liberty all–star equity fund · 2 ® pr (unaudited) while these were the major events...
TRANSCRIPT

2016 Annual Report
LIBERTY ALL–STAR® EQUITY FUND

1 President’s Letter
6 Unique Fund Attributes
8 Investment Managers/ Portfolio Characteristics
9 Investment Growth
10 Table of Distributions and Rights Offerings
11 Major Stock Changes in the Quarter and Distribution Policy
12 Top 20 Holdings and Economic Sectors
13 Manager Roundtable
20 Schedule of Investments
28 Statement of Assets and Liabilities
29 Statement of Operations
30 Statements of Changes in Net Assets
32 Financial Highlights
34 Notes to Financial Statements
42 Report of Independent Registered Public Accounting Firm
43 Automatic Dividend Reinvestment and Direct Purchase Plan
45 Additional Information
47 Trustees and Officers
53 Board Consideration of the Renewal of the Fund Management and Portfolio Management Agreements
58 Privacy Policy
60 Description of Lipper Benchmark and Market Indices
Inside Back Cover: Fund Information
The views expressed in the President’s Letter, Unique Fund Attributes and Manager Roundtable reflect the current views of the respective parties. These views are not guarantees of future performance and involve certain risks, uncertainties and assumptions that are difficult to predict, so actual outcomes and results may differ significantly from the views expressed. These views are subject to change at any time based upon economic, market or other conditions, and the respective parties disclaim any responsibility to update such views. These views may not be relied on as investment advice and, because investment decisions for the Fund are based on numerous factors, may not be relied on as an indication of trading intent. References to specific company securities should not be construed as a recommendation or investment advice.
Contents
A SINGLE INVESTMENT...A DIVERSIFIED CORE PORTFOLIO
A single fund that offers:
• A diversified, multi-managed portfolio of growth and value stocks• Exposure to many of the industries that make the U.S. economy one of the world’s most
dynamic• Access to institutional quality investment managers• Objective and ongoing manager evaluation• Active portfolio rebalancing• A quarterly fixed distribution policy• Actively managed, exchange-traded closed-end fund listed on the New York Stock
Exchange (ticker symbol: USA)
LIBERTY ALL-STAR® EQUITY FUND

1Annual Report | December 31, 2016
Liberty All-Star® Equity Fund President's Letter(Unaudited)
Fellow Shareholders: February 2017
While surprising events help to shape equity market performance every year, 2016 will be remembered as an archetype of surprise. Each of the four quarters was marked by headlines that would have been hard to anticipate in advance: the worst calendar year start for U.S. equities ever; the U.K. vote to withdraw from the European Union; record highs recorded by the S&P 500® Index, the Dow Jones Industrial Average (DJIA) and the NASDAQ Composite Index on the same day in August; and Donald Trump’s upset win in the presidential election.
Sparked by the Trump victory, U.S. equities rallied in the fourth quarter, with the S&P 500® advancing 3.82 percent, the DJIA gaining 8.66 percent and the NASDAQ returning 1.66 percent. That the fourth quarter’s return for the NASDAQ was substantially below the other two indices signaled the unevenness of the rally; investors moved quickly to embrace financials and industrial stocks at the expense of growth stocks, including information technology and health care/biotech. For the full year, the S&P 500® returned 11.96 percent, the DJIA returned 16.50 percent and the NASDAQ returned 8.87 percent.
That was an outcome that would have been hard to envision on February 11, when the rout that opened the year reached its nadir. At that point, U.S. stocks were down 10 percent, with the stocks of energy companies and those that supply the industry faring even worse. But if the historically poor start to the year was a surprise, the latter half of the first quarter was almost as surprising. A rally took hold that by quarter’s end had driven the S&P 500® and DJIA to positive returns and left the NASDAQ only modestly negative.
The second quarter was calm by comparison until a poor jobs report for May rattled investors, only to be followed by the “Brexit” referendum in which voters in the U.K. said they favored leaving the European Union. Once again, however, a rally over the last few trading days of the quarter propelled the S&P 500® and the DJIA to modest gains, while the NASDAQ surrendered less than one percentage point.
Positive sentiment prevailed in the third quarter. At one point, the DJIA recorded gains for nine straight trading days—its longest streak in three years. This time it was the NASDAQ leading the way with a 10.02 percent return, a reflection of investors’ greater appetite for risk, as well as technology companies’ prospects for growth in a growth-challenged economy. Markets were also buoyed by good job growth, higher home sales, a surge in consumer confidence and firmer crude oil prices.
Equity markets got off to a poor start in the fourth quarter. October ended broadly lower, with the S&P 500® down 1.94 percent for the month. On November 4, after the same index closed lower for the ninth straight day, The Wall Street Journal declared it the longest losing streak since 2008. All that changed a few days later with the presidential election and an outcome that, with few exceptions, was not foreseen by polls or pundits. Markets that had been predicted to retrench as much as 10 percent on a Trump victory instead surprised many investors and rallied. Investors saw opportunity in Trump’s calls for lower corporate taxes, investment in infrastructure, replacing the Affordable Care Act and a lighter approach to government regulation. Some of the enthusiasm abated in the final week of the year, as investors locked-in profits. Nevertheless, the DJIA advanced nearly 9 percent (after closing above 19,000 for the first time on November 22). The other main event of the quarter—one that came as no surprise—was the Federal Reserve’s quarter-point increase in the fed funds rate, and the subsequent release of meeting notes indicating that the Fed would likely be more aggressive in raising short-term rates during 2017.

2 www.all-starfunds.com
Liberty All-Star® Equity Fund President's Letter(Unaudited)
While these were the major events highlighting each quarter, there were underlying themes running through the year. One was a strengthening U.S. economy, marked by gains in employment, improving corporate earnings, a strong housing market and favorable consumer confidence. Another, less positive, factor was China—the world’s second largest economy—where a slowing economy, a decline in the stock market and a weaker yuan held potential implications for the U.S. economy. The geopolitical situation—principally, the Middle East, South China Sea, North Korea, Russian meddling in Eastern Europe and the refugee crises—remain ongoing sources of concern that are not likely to be resolved any time soon.
Liberty All-Star® Equity FundFor the full year, Liberty All-Star Equity Fund underperformed the key indices previously referred to in this letter. In 2016, the Fund returned 9.14 percent with shares valued at net asset value (NAV) with dividends reinvested and 6.12 percent with shares valued at market price with dividends reinvested. (Fund returns are net of expenses.) As noted, returns for the S&P 500®, the DJIA and the NASDAQ were 11.96 percent, 16.50 percent and 8.87 percent, respectively. The return on Fund shares valued at NAV narrowly trailed the Fund’s principal benchmark, the Lipper Large-Cap Core Mutual Fund Average, which returned 10.04 percent for the year.
For the fourth quarter, the Fund returned 2.66 percent with shares valued at NAV with dividends reinvested and 1.93 percent with shares valued at market price with dividends reinvested. For the same period, the benchmark Lipper index returned 3.68 percent.
Looking back, the Fund—like the vast majority of actively managed funds—was hurt in the first quarter by the market’s hyper-volatility. The Fund outperformed all key benchmarks in both the second and third quarters. In the fourth quarter, the Fund continued to outperform until the presidential election. The massive shift by investors to financials and cyclical stocks and their simultaneous abandonment of the type of growth stocks that the Fund’s growth managers generally invest in (higher growth rates and higher valuation multiples compared to the S&P 500®) accounted for the underperformance in the final quarter and offset strong performance by the value managers. Fund shares valued at market price were also hurt in the fourth quarter by the widening of the discount at which Fund shares trade relative to NAV; during the period, Fund shares traded in a discount range of -14.8 percent to -17.4 percent relative to their underlying NAV.
In accordance with the Fund’s distribution policy, the Fund declared a distribution of $0.12 per share in the fourth quarter, bringing total distributions for 2016 to $0.48 per share. As shareholders may recall, the Fund's distribution policy has been in place since 1988 and is a major component of the Fund’s total return. These distributions add up to $25.65 since 1987 (the Fund's first full calendar year of operations). We continue to emphasize that shareholders should include these distributions when determining the return on their investment in the Fund.
One of the key principles on which the Fund was founded is multi-management, or the practice of allocating the Fund’s assets to carefully selected investment managers representing both value and growth styles of investing. Thus, we are once again offering insights into the managers’ thinking through our annual roundtable question-and-answer exchange, and invite shareholders to read the managers’ comments.
The market continued to rally in the early days of 2017, but much remains unsettled as the new administration and the Republican-led Congress begin the arduous task of governing. We are hopeful that the U.S. economy will continue to grow and that government policies, as they unfold, will complement and support private sector growth. A year with no surprises may be welcome, but

3Annual Report | December 31, 2016
Liberty All-Star® Equity Fund President's Letter(Unaudited)
if that turns out to be the case it would be a surprise all by itself. For our part, we at ALPS Advisors will continue to offer shareholders a consistent focus and a steady adherence to the principles that make the Fund a core equity holding for long-term investors.
Sincerely,
William R. Parmentier, Jr.President and Chief Executive OfficerLiberty All-Star® Equity Fund

4 www.all-starfunds.com
Liberty All-Star® Equity Fund President's Letter(Unaudited)
FUND STATISTICS AND SHORT-TERM PERFORMANCE PERIODS ENDED DECEMBER 31, 2016
FUND STATISTICS:
Net Asset Value (NAV) $6.13
Market Price $5.16
Discount -15.8%
Quarter 2016
Distributions* $0.12 $0.48
Market Price Trading Range $4.76 to $5.25 $4.26 to $5.28
Premium/(Discount) Range -14.8% to -17.4% -14.0% to -17.6%
PERFORMANCE:
Shares Valued at NAV with Dividends Reinvested 2.66% 9.14%
Shares Valued at Market Price with Dividends Reinvested 1.93% 6.12%
Dow Jones Industrial Average 8.66% 16.50%
Lipper Large-Cap Core Mutual Fund Average 3.68% 10.04%
NASDAQ Composite Index 1.66% 8.87%
S&P 500® Index 3.82% 11.96%

5Annual Report | December 31, 2016
Liberty All-Star® Equity Fund President's Letter(Unaudited)
LONG-TERM PERFORMANCE SUMMARY AND DISTRIBUTIONS PERIODS ENDED DECEMBER 31, 2016
ANNUALIZED RATES OF RETURN
3 YEARS 5 YEARS 10 YEARS
LIBERTY ALL-STAR® EQUITY FUND
Distributions $1.38 $2.05 $4.56
Shares Valued at NAV with Dividends Reinvested 5.56% 12.54% 5.20%
Shares Valued at Market Price with Dividends Reinvested 3.63% 12.44% 3.98%
Dow Jones Industrial Average 8.71% 12.92% 7.52%
Lipper Large-Cap Core Mutual Fund Average 6.84% 13.14% 6.14%
NASDAQ Composite Index 10.14% 17.07% 9.53%
S&P 500® Index 8.87% 14.66% 6.95%
* All 2016 distributions consist of ordinary dividends and long-term capital gains. A breakdown of each 2016 distribution for federal income tax purposes can be found in the table on page 45.
Performance returns for the Fund are total returns, which include dividends. Returns are net of management fees and other Fund expenses.
The returns shown for the Lipper Large-Cap Core Mutual Fund Average are based on open-end mutual funds’ total returns, which include dividends, and are net of fund expenses. Returns for the unmanaged Dow Jones Industrial Average, NASDAQ Composite Index and the S&P 500® Index are total returns, including dividends. A description of the Lipper benchmark and the market indices can be found on page 60.
Past performance cannot predict future results. Performance will fluctuate with market conditions. Current performance may be lower or higher than the performance data shown. Performance information does not reflect the deduction of taxes that shareholders would pay on Fund distributions or the sale of Fund shares. An investment in the Fund involves risk, including loss of principal.
Closed-end funds raise money in an initial public offering and shares are listed and traded on an exchange. Open-end mutual funds continuously issue and redeem shares at net asset value. Shares of closed-end funds frequently trade at a discount to net asset value. The price of the Fund’s shares is determined by a number of factors, several of which are beyond the control of the Fund. Therefore, the Fund cannot predict whether its shares will trade at, below or above net asset value.

6 www.all-starfunds.com
Liberty All-Star® Equity Fund Unique Fund Attributes(Unaudited)
MULTI-MANAGEMENT FOR INDIVIDUAL INVESTORS
Liberty All-Star® Equity Fund is multi-managed, an investment discipline that is followed by large institutional investors to diversify their portfolios. In 1986, Liberty All-Star® Equity Fund became the first closed-end fund to bring multi-management to individual investors.
UNIQUE ATTRIBUTES OF Liberty All-Star® Equity Fund
Several attributes help to make the Fund a core equity holding for investors seeking diversification, income and the potential for long-term appreciation.
REAL-TIME TRADING AND LIQUIDITY
The Fund has a fixed number of shares that trade on the New York Stock Exchange and other exchanges. Share pricing is continuous—not just end-of-day, as it is with open-end mutual funds. In addition, Fund shares offer immediate liquidity and there are no annual sales fees.

7Annual Report | December 31, 2016
Liberty All-Star® Equity Fund Unique Fund Attributes(Unaudited)
DISTRIBUTION POLICY
Since 1988, the Fund has followed a policy of paying annual distributions on its shares at a rate that approximates historical equity market returns. The current annual distribution rate is 8 percent of the Fund’s net asset value (paid quarterly at 2 percent per quarter), providing a systematic mechanism for distributing funds to shareholders.
ACCESS TO INSTITUTIONAL MANAGERS
The Fund’s investment managers invest primarily for pension funds, endowments, foundations and other institutions. Because institutional managers are closely monitored by their clients, they tend to be more disciplined and consistent in their investment process.
MONITORING AND REBALANCING
ALPS Advisors continuously monitors these investment managers to ensure that they are performing as expected and adhering to their style and strategy, and will replace managers when warranted. Periodic rebalancing maintains the Fund’s structural integrity and is a well-recognized investment discipline.
ALIGNMENT AND OBJECTIVITY
Alignment with shareholders’ best interests and objective decision-making help to ensure that the Fund is managed openly and equitably. In addition, the Fund is governed by a Board of Trustees that is elected by and responsible to shareholders.

8 www.all-starfunds.com
Investment Managers/Liberty All-Star® Equity Fund Portfolio Characteristics
(Unaudited)
PORTFOLIO CHARACTERISTICSAS OF DECEMBER 31, 2016
INVESTMENT STYLE SPECTRUMVALUE GROWTH
Pzena Delaware Aristotle Sustainable TCWTotal Fund
S&P 500® Index
Number of Holdings 40 32 43 30 31 151* 505Percent of Holdings in Top 10 35% 34% 32% 40% 52% 17% 18%Weighted Average Market
Capitalization (billions) $87 $86 $80 $112 $113 $95 $148 Average Five-Year Earnings
Per Share Growth 3% 7% 6% 12% 15% 8% 10%Dividend Yield 2.4% 2.6% 2.0% 1.2% 0.7% 1.8% 2.1%Price/Earnings Ratio** 17x 20x 18x 31x 37x 22x 21x Price/Book Value Ratio 1.7x 2.6x 2.9x 5.2x 4.9x 3.0x 3.1x
* Certain holdings are held by more than one manager.** Excludes negative earnings.
THE FUND’S ASSETS ARE APPROXIMATELY EQUALLY DISTRIBUTED AMONG THREE VALUE MANAGERS AND TWO GROWTH MANAGERS:
ALPS Advisors, Inc., the investment advisor to the Fund, has the ultimate authority (subject to oversight by the Board of Trustees) to oversee the investment managers and recommend their hiring, termination and replacement.
MANAGERS’ DIFFERING INVESTMENT STRATEGIES ARE REFLECTED IN PORTFOLIO CHARACTERISTICS
The portfolio characteristics table below is a regular feature of the Fund’s shareholder reports. It serves as a useful tool for understanding the value of a multi-managed portfolio. The characteristics are different for each of the Fund’s five investment managers. These differences are a reflection of the fact that each pursues a different investment style. The shaded column highlights the characteristics of the Fund as a whole, while the final column shows portfolio characteristics for the S&P 500® Index.
Delaware InvestmentsVALUE/Seeks to capitalize on discrepancies between estimated intrinsic value and price, buying at times of excessive pessimism and selling at times of undue optimism.
Sustainable Growth Advisers, LPGROWTH/Seeks to invest in companies with predictable, sustainable earnings and cash flow growth over the long term.
TCW Investment Management CompanyGROWTH/Seeks to invest in companies that have superior sales growth, leading and/or rising market shares, and high and/or rising profit margins.
Aristotle Capital Management, LLCVALUE/Seeks to own high quality, attractively valued companies that possess catalysts for positive change.
Pzena Investment Management, LLCVALUE/Seeks to invest in companies with low price-to-normalized earnings ratios that have the ability to generate earnings recovery.
$0
$40000
$80000
$120000
$160000
$200000
$240000
Distributions & Reinvested
'16'14'13'12'11'10'09'08'07'06'05'04'03'02'01'00'99'98'97'96'95'94'93'92'91'90'89'8812/31/87
$0
$40000
$80000
$120000
$160000
$200000
$240000
Distributions & Reinvested & Right Reinvested
'16'15'14'13'12'11'10'09'08'07'06'05'04'03'02'01'00'99'98'97'96'95'94'93'92'91'90'89'8812/31/87
$0
$40000
$80000
$120000
$160000
$200000
$240000
Distributions Taken in Cash'16'14'13'12'11'10'09'08'07'06'05'04'03'02'01'00'99'98'97'96'95'94'93'92'91'90'89'8812/31/87
$220,765
$151,839
Market Price Growth Plus Distributions Paid
$50,500
Additional Value Added Through Distribution ReinvestmentAdditional Value Added Through Full Participation in All Rights Offerings
'09 '10 '11 '12 '13 '14'08'07'06'05'04'03'02'01'00'99'98'97'96'95'94'93'92'91'90'89'88'87$0
$40,000
$80,000
$120,000
$160,000
$240,000
$200,000
$10,000
'15 '16

9Annual Report | December 31, 2016
Liberty All-Star® Equity Fund Investment Growth(Unaudited)
The growth of the investment assuming all distributions were received in cash and not reinvested back into the Fund. The value of the investment under this scenario grew to $50,500 (including the December 31, 2016 value of the original investment of $8,600 plus distributions during the period of $40,783 and tax credits on retained capital gains of $1,117).
The additional value realized through reinvestment of all distributions and tax credits. The value of the investment under this scenario grew to $151,839.
The additional value realized through full participation in all the rights offerings under the terms of each offering. The value of the investment under this scenario grew to $220,765 excluding the cost to fully participate in all the rights offerings under the terms of each offering which was $49,966.
Past performance cannot predict future results. Performance will fluctuate with changes in market conditions. Current performance may be lower or higher than the performance data shown. Performance information does not reflect the deduction of taxes that shareholders would pay on Fund distributions or the sale of Fund shares. An investment in the Fund involves risk, including loss of principal.
GROWTH OF A HYPOTHETICAL $10,000 INVESTMENT
The graph below illustrates the growth of a hypothetical $10,000 investment assuming the purchase of shares of beneficial interest at the closing market price (NYSE: USA) of $6.00 on December 31, 1987, and tracking its progress through December 31, 2016. For certain information, it also assumes that a shareholder exercised all primary rights in the Fund’s rights offerings (see below). This graph covers the period since the Fund commenced its distribution policy in 1988.
PORTFOLIO CHARACTERISTICSAS OF DECEMBER 31, 2016
INVESTMENT STYLE SPECTRUMVALUE GROWTH
Pzena Delaware Aristotle Sustainable TCWTotal Fund
S&P 500® Index
Number of Holdings 40 32 43 30 31 151* 505Percent of Holdings in Top 10 35% 34% 32% 40% 52% 17% 18%Weighted Average Market
Capitalization (billions) $87 $86 $80 $112 $113 $95 $148 Average Five-Year Earnings
Per Share Growth 3% 7% 6% 12% 15% 8% 10%Dividend Yield 2.4% 2.6% 2.0% 1.2% 0.7% 1.8% 2.1%Price/Earnings Ratio** 17x 20x 18x 31x 37x 22x 21x Price/Book Value Ratio 1.7x 2.6x 2.9x 5.2x 4.9x 3.0x 3.1x
* Certain holdings are held by more than one manager.** Excludes negative earnings.
Aristotle Capital Management, LLCVALUE/Seeks to own high quality, attractively valued companies that possess catalysts for positive change.
$0
$40000
$80000
$120000
$160000
$200000
$240000
Distributions & Reinvested
'16'14'13'12'11'10'09'08'07'06'05'04'03'02'01'00'99'98'97'96'95'94'93'92'91'90'89'8812/31/87
$0
$40000
$80000
$120000
$160000
$200000
$240000
Distributions & Reinvested & Right Reinvested
'16'15'14'13'12'11'10'09'08'07'06'05'04'03'02'01'00'99'98'97'96'95'94'93'92'91'90'89'8812/31/87
$0
$40000
$80000
$120000
$160000
$200000
$240000
Distributions Taken in Cash'16'14'13'12'11'10'09'08'07'06'05'04'03'02'01'00'99'98'97'96'95'94'93'92'91'90'89'8812/31/87
$220,765
$151,839
Market Price Growth Plus Distributions Paid
$50,500
Additional Value Added Through Distribution ReinvestmentAdditional Value Added Through Full Participation in All Rights Offerings
'09 '10 '11 '12 '13 '14'08'07'06'05'04'03'02'01'00'99'98'97'96'95'94'93'92'91'90'89'88'87$0
$40,000
$80,000
$120,000
$160,000
$240,000
$200,000
$10,000
'15 '16

10 www.all-starfunds.com
Table of Distributions andLiberty All-Star® Equity Fund Rights Offerings
(Unaudited)
RIGHTS OFFERINGS
YEAR
PER SHARE
DISTRIBUTIONSMONTH
COMPLETED
SHARES NEEDED TO
PURCHASE ONE ADDITIONAL
SHARESUBSCRIPTION
PRICE TAX CREDITS1
1988 $0.641989 0.951990 0.901991 1.021992 1.07 April 10 $10.051993 1.07 October 15 10.41 $0.181994 1.00 September 15 9.141995 1.041996 1.18 0.131997 1.33 0.361998 1.40 April 20 12.831999 1.392000 1.422001 1.202002 0.88 May 10 8.992003 0.782004 0.89 July 102 8.342005 0.872006 0.882007 0.90 December 10 6.512008 0.6520093 0.312010 0.312011 0.342012 0.322013 0.352014 0.3920154 0.512016 0.48Total $24.47
1 The Fund’s net investment income and net realized capital gains exceeded the amount to be distributed under the Fund’s distribution policy. In each case, the Fund elected to pay taxes on the undistributed income and passed through a proportionate tax credit to shareholders.
2 The number of shares offered was increased by an additional 25 percent to cover a portion of the over-subscription requests.
3 Effective with the second quarter distribution, the annual distribution rate was changed from 10 percent to 6 percent.
4 Effective with the second quarter distribution, the annual distribution rate was changed from 6 percent to 8 percent.

11Annual Report | December 31, 2016
Major Stock Changes in the QuarterLiberty All-Star® Equity Fund and Distribution Policy
December 31, 2016 (Unaudited)
The following are the major ($5 million or more) stock changes - both purchases and sales - that were made in the Fund’s portfolio during the fourth quarter of 2016.
SHARESSECURITY NAME PURCHASE (SALES) HELD AS OF 12/31/16
PURCHASES
Cognizant Technology Solutions Corp., Class A 118,825 118,825
Equity Residential 110,000 110,000
SALES
athenahealth, Inc. (50,300) 0
Cerner Corp. (108,895) 144,969
Xerox Corp. (706,400) 0
DISTRIBUTION POLICYThe current policy is to pay distributions on its shares totaling approximately 8 percent of its net asset value per year, payable in four quarterly installments of 2 percent of the Fund’s net asset value at the close of the New York Stock Exchange on the Friday prior to each quarterly declaration date. Sources of distributions to shareholders may include ordinary dividends, long-term capital gains and return of capital. The actual amounts and sources of the amounts for tax reporting purposes will depend upon the Fund’s investment experience during its fiscal year and may be subject to changes based on tax regulations. If a distribution includes anything other than net investment income, the Fund provides a Section 19(a) notice of the best estimate of its distribution sources at that time. These estimates may not match the final tax characterization (for the full year’s distributions) contained in shareholders’ 1099-DIV forms after the end of the year. If the Fund’s net investment income and net realized capital gains for any year exceed the amount distributed under the distribution policy, the Fund may, in its discretion, retain and not distribute capital gains and pay income tax thereon to the extent of such excess.

12 www.all-starfunds.com
Liberty All-Star® Equity Fund Top 20 Holdings and Economic SectorsDecember 31, 2016 (Unaudited)
TOP 20 HOLDINGS* PERCENT OF NET ASSETSAlphabet, Inc., Class C 2.14%Mondelez International, Inc., Class A 1.90Visa, Inc., Class A 1.80Salesforce.com, Inc. 1.69Facebook, Inc., Class A 1.65Amazon.com, Inc. 1.64Starbucks Corp. 1.54The Priceline Group, Inc. 1.50Halliburton Co. 1.45Bank of America Corp. 1.40Adobe Systems, Inc. 1.35Chubb Ltd. 1.34Equinix, Inc. 1.25Lowe's Companies, Inc. 1.25CVS Health Corp. 1.17Intel Corp. 1.13Archer-Daniels-Midland Co. 1.03State Street Corp. 1.01Celgene Corp. 0.99JPMorgan Chase & Co. 0.99
28.22%
ECONOMIC SECTORS* PERCENT OF NET ASSETSInformation Technology 20.02%Financials 19.28Health Care 13.59Consumer Discretionary 12.06Consumer Staples 9.23Energy 8.80Industrials 5.68Materials 3.29Real Estate 2.84Utilities 1.26Telecommunication Services 1.26Other Net Assets 2.69
100.00%
* Because the Fund is actively managed, there can be no guarantee that the Fund will continue to hold securities of the indicated issuers and sectors in the future.

13Annual Report | December 31, 2016
Liberty All-Star® Equity Fund Manager Roundtable(Unaudited)
MANAGER ROUNDTABLE
Looking back and looking ahead, the Fund’s managers assess 2016 and evaluate what a Trump administration may—or may not—mean for the investment environment in 2017.
Liberty All-Star Equity Fund’s five investment managers represent long experience, deep knowledge, a proven track record and, given that they represent both growth and value styles of investing, a broad point of view on the stock market and equity investing generally. Thus, once again, we are grateful to be able to call upon this resource to provide Fund shareholders with commentary and insight. The Fund’s Investment Advisor, ALPS Advisors, serves as moderator of the roundtable. Participating investment management firms, the portfolio manager for each, and their respective styles and strategies are:
ARISTOTLE CAPITAL MANAGEMENT, LLCPortfolio Manager/Howard Gleicher, CFACEO and Chief Investment OfficerInvestment Style/Value – Aristotle seeks to invest in high quality companies that it believes are selling at a significant discount to their intrinsic value and where a catalyst exists that will lead to a realization by the market of this true value. Aristotle practices a fundamental, bottom-up research-driven process and invests with a long-term perspective.
DELAWARE INVESTMENTSPortfolio Manager/D. Tysen Nutt, Jr.Senior Vice President, Senior Portfolio Manager, Team LeaderInvestment Style/Value – Delaware uses a research-intensive approach to identify companies it be-lieves are undervalued as indicated by multiple factors, including the earnings and cash flow poten-tial or the assets of the company. Delaware seeks to buy companies at times of excessive pessimism and sell at times of undue optimism.
PZENA INVESTMENT MANAGEMENT, LLCPortfolio Managers/Richard S. Pzena, Founder and Co-Chief Investment OfficerJohn J. Flynn, Principal and Portfolio Manager Benjamin S. Silver, CFA, Principal and Co-Director of ResearchInvestment Style/Value – Pzena uses fundamental research and a disciplined process to identify good companies with a sustainable business advantage that the firm believes are undervalued on the basis of current price to an estimated normal level of earnings.
SUSTAINABLE GROWTH ADVISERS, LPPortfolio Manager/George FraiseFounding Principal Investment Style/Growth – Sustainable Growth Advisers (SGA) focuses on companies that have unique characteristics that lead to a high degree of predictability, strong profitability and above-average earnings and cash flow growth over the long term.

14 www.all-starfunds.com
Liberty All-Star® Equity Fund Manager Roundtable(Unaudited)
TCW INVESTMENT MANAGEMENT COMPANYPortfolio Manager/Craig C. Blum, CFAManaging DirectorInvestment Style/Growth – TCW invests in companies that have superior sales growth, leading and/or rising market shares, and high and/or rising profit margins. TCW’s concentrated growth equity strategy seeks companies with distinct advantages in their business model.
How do you assess 2016 in general and, more specifically, what industries, sectors or strate-gies helped and/or hurt returns in the portion of the Liberty All-Star Equity Fund that you manage? Rich, how does Pzena assess the year?
Pzena (Pzena – Value): Investor sentiment shifted mid-year toward economically sensitive sectors and away from the previous market leaders such as health care, consumer staples and utilities, with the trend accelerating after the U.S. presidential election. Our portfolio significantly outperformed in this environment as we were finding most of our opportunities in economically sensitive businesses, with holdings in the energy, technology, financial and producer durable sectors making the largest contributions. We had little exposure to consumer staples, health care and utilities (so-called bond proxies) which underperformed, also helping our relative performance as we were finding few values in those sectors. Although some consumer discretionary holdings and our lack of exposure to a recovery in materials detracted from performance, it was Pzena’s strongest year from both an absolute and relative basis since 2013. Despite the strong performance, valuation spreads continue to be wide, an environment that historically has signaled good opportunity for value outperformance.
Thanks. Let’s stay with the value managers and ask Aristotle Capital and Delaware Investments to comment on 2016. Howard, will you lead off for Aristotle? Gleicher (Aristotle – Value): For 2016, the primary contributors to the portfolio were the industrials, information technology and financials sectors, and security selection was the main driver of outperformance relative to our benchmark, the Russell 1000® Value Index. The primary detractors were the consumer staples, health care and energy sectors. Security selection in consumer staples, as opposed to sector allocation in the other two sectors, contributed to the underperformance relative to the benchmark. As always, all sector over- and underweights relative to the Index resulted from bottom-up security selection rather than tactical allocation decisions.
Nutt (Delaware – Value): The year brought a number of reversals and surprises. The market pendulum swung from growth to value and from defensives to cyclicals. It even swung from fear to greed as evidenced by the S&P 500 Index posting a double-digit total return for the year following its worst yearly start ever. The U.K. vote to leave the European Union surprised the markets, as did Donald Trump’s victory in the U.S. presidential election. We were surprised by the speed and magnitude of the stock market’s rise following the election results. The portion of the Fund’s portfolio we manage maintained a defensive tilt during the year, which ended up hurting relative performance. Our overweight allocation to health care and stock selection in the information
“Despite [our] strong performance [in 2016], valuation spreads continue to be wide, an environment that historically has signaled good opportunity for value outperformance.”
—Rich Pzena (Pzena – Value)
15Annual Report | December 31, 2016
Liberty All-Star® Equity Fund Manager Roundtable(Unaudited)
technology sector were notable detractors from returns. Conversely, our overweight positioning in telecommunication services and stock selection in the energy sector were solid contributors to performance.
Let’s turn to the growth style managers and hear from TCW and Sustainable.
Blum (TCW – Growth): We were disappointed with our results in 2016. We believe the year can be divided into three distinct periods: January –February 11 (market bottom), February 12 –November 8 (election) and election through year-end. The first period marked the worst stock market start to a calendar year in history and our underperformance was driven primarily by information technology and health care as the market favored bond proxies during the sell-off. While many of our stocks bounced back during the second period, the rebound was mostly offset by the price deterioration experienced in some of our health care holdings. In the third period, the “Trump effect” resulted in a market rally in deep cyclical stocks and a belief that Trump is going to be able to magically unleash massive debt-funded government infrastructure-spending programs. While our holdings in the financials rallied during the third period, our strategy underperformed as many information technology holdings were discarded in favor of deep cyclicals.
Fraise (Sustainable – Growth): We also were disappointed with our results in 2016, which were impacted late in the year by the shift in investor sentiment resulting from the November election. Driven by hope for more pro-growth fiscal and regulatory policies under a Trump administration and a Republican-controlled Congress, low quality, smaller-cap and value stocks staged a major rally, largely in stocks very different from the types on which our approach is focused. Companies with lower returns on equity, more cyclicality and higher betas, and more debt outperformed in November and December. Stocks in the energy, financial services and industrials sectors performed best on expectations for greater economic growth, a paring back of the regulatory oversight under Dodd-Frank and significant new infrastructure spending. While we have exposure to select energy service businesses, and they helped us, our focus on strong pricing power, predictable revenue streams and long runways of growth generally steers us away from large money center banks with a high degree of dependence on interest rate spreads as well as deep cyclical stocks, which are highly sensitive to the business cycle.
Let’s look at the event that had a major impact on the fourth quarter of 2016 and should affect 2017 and beyond—the election of Donald Trump. The Fund’s investment managers are generally bottom-up, fundamentally-based in their approach to picking stocks. But it is hard to ignore one major macro factor—the so-called “Trump effect.” Are you or are you not factoring such sweeping proposals as corporate tax reform, infrastructure build, healthcare legislation and a lighter approach to regulation into your thinking, and why or why not? Let’s stay with the growth managers and ask George Fraise to start us off.
Fraise (Sustainable – Growth): We do consider the impact of changes to regulatory and tax policy, health care legislation, and infrastructure spending on the trajectory of the earnings and cash flows of our portfolio businesses. Given the uncertainty around the magnitude of any final
“The ‘Trump effect’ resulted in a market rally [after the election]… While our hold-ings in the financials rallied… our strat-egy underperformed as many information technology holdings were discarded in fa-vor of deep cyclicals.”
—Craig Blum (TCW – Growth)

16 www.all-starfunds.com
Liberty All-Star® Equity Fund Manager Roundtable(Unaudited)
legislation, however, we focus the vast majority of our attention on the key drivers of secular growth, which are more critical over the long term and more predictable. While there is significant hope in the market for positive changes in the areas you note, we are very cognizant of the difficulties of trying to forecast the outcome of the political process. We believe positive changes to regulatory and tax policy will occur, and have factored an increase in infrastructure spending and a reduction in tax rates into our expectations, but we are skeptical that the eventual changes enacted will necessarily be of the magnitude currently being assumed by buoyant investors. As a result, we think there could be disappointment on the part of investors who have factored in a meaningful sustained improvement in economic growth. While they have been largely overlooked in the recent “Trump rally,” we are confident that select businesses with superior underlying quality and growth characteristics—enabling them to generate higher revenues and earnings in a more predictable and sustainable manner—will attract the interest of investors as current hopes meet the realities of getting such changes enacted.
Blum (TCW – Growth): Despite experiencing the worst economic downturn since the Great Depression, the U.S. economy hasn’t produced real growth higher than 3 percent since 2005. We believe Trump’s surprise election and the Republican sweep could represent a sea change in policy and the end of secular stagnation. While much has been made of a potential infrastructure build, we believe corporate tax reform and reduced regulation are more likely in the near term. This would be bullish for the economy. The near- to intermediate-term is always difficult to forecast but enough is new and different that, yes, we are factoring in the potential for a steeper industrial demand curve, revived inflation expectations and a reigniting of the U.S. economy.
How do the value managers assess the “Trump effect?” Ty Nutt, please start us off.
Nutt (Delaware – Value): Our investment process includes a top-down component, what we call our macro-economic overlay. As part of this, we are certainly considering the potential consequences of the new administration’s policy proposals. Stronger economic growth seems plausible to us if tax cuts and regulatory reforms are enacted. We have questions about the timing and implementation of these changes as it may be a while before their impacts are realized. Also, we wonder about any offsetting effects that could arise from restrictions on global trade. Additionally, we think it’s worth noting that some of the challenges to global growth that existed prior to the election, such as high levels of indebtedness and aging populations, are still in place. In 2017 and beyond, we’ll be watching policy developments in Washington, D.C., assessing their potential impact on portfolio holdings as well as the opportunities that could be created by them.
“We are confident that select business-es with superior underlying quality and growth characteristics will attract the in-terest of investors as current hopes meet the realities of getting [changes dependent on the political process] enacted.”
—George Fraise (Sustainable – Growth)
“We are certainly considering the potential consequences of the new administration’s policy proposals… [but] we have questions about the timing and implementation of these changes as it may be a while before their impacts are realized.”
—Ty Nutt(Delaware – Value)

17Annual Report | December 31, 2016
Liberty All-Star® Equity Fund Manager Roundtable(Unaudited)
Thanks. Now let’s hear from Howard Gleicher and Rich Pzena.
Gleicher (Aristotle – Value): We did not attempt to reposition our portfolio prior to the election, which, in hindsight, was wise, given the outcome that surprised many, if not most. Nor have we made investment decisions since the election based on our expectations of what the Trump administration will bring. Any tax, spending or regulatory changes are unknowable in probability, scope and timing, as are the impacts of any such changes. We do not make decisions based on so many unknown variables. Rather, we endeavor to identify and invest in a diverse but limited number of high-quality companies that we believe will outperform their peers regardless of the economic, political or regulatory environment. Historically, we have been able to add value through in-depth company research. Therefore, we choose to focus on what we know, what we can analyze and what we—and the companies in which we invest—can control. It is our belief that a diversified portfolio of investments in these companies will hold up best regardless of the environment and will optimize risk-adjusted performance for our clients.
Most quarters, we are reminded that macroeconomic events, or “the news of the day” like the Brexit vote, may cause stock prices to temporarily diverge from company fundamentals. As always, we will incorporate this new information into our investment process but will not allow it to impact our daily discipline of seeking out unique and value-creating businesses. Every once in a while something happens in the market that could be meaningful. Some may not impact the financial markets, other events may impact only the financial markets. Our analysts are researching companies that have nothing to do with what is happening on any given day, and that is a competitive advantage of ours.
Pzena (Pzena – Value): Our investment decisions are bottom-up research focused and based on finding good businesses where temporary conditions have led to earnings weakness and deep undervaluation. Our experience is that as long as the business franchise is sound, management finds a way to adapt to the macro environment and restore earnings to historical levels. Although we do not ignore macro factors, we are not counting on them as the only path to earnings normalization. That said, changes in macro expectations (the “Trump effect”) have helped accelerate re-valuation, i.e., higher interest rates benefitting stock prices of banks, and likewise create opportunity where uncertainty has increased, i.e., health care. Uncertainty and volatility create buying opportunities and we are focused on the longer-term earnings power of businesses. Our approach is to focus on individual businesses where the franchise has the ability to evolve with the environment and where the valuation offers downside support.
Let’s turn to a closer look at the Fund’s portfolio. Please tell us about a longtime holding in the portion of the Liberty All-Star Equity Fund portfolio that you manage that exemplifies your approach to investing, and tell us about a recent addition that similarly illustrates your approach. Craig Blum, share TCW’s insight with us, please.
Blum (TCW – Growth): We first purchased Amazon over 14 years ago. Amazon’s long-term investments have created immense scale advantages and the company is one of the most disruptive
“Every once in a while something happens in the market that could be meaningful. Some may not impact the financial markets, other events may impact only the financial markets. Our analysts are researching companies that have nothing to do with what is happening on any given day.”
—Howard Gleicher (Aristotle – Value)
18 www.all-starfunds.com
Liberty All-Star® Equity Fund Manager Roundtable(Unaudited)
forces in retail and technology. Amazon continues to take market share from offline retailers, in fact today Amazon’s market capitalization exceeds that of most major brick and mortar retailers combined. Moreover, Amazon Web Services (AWS) is the leading public cloud provider and is immensely profitable. Amazon’s revenues have grown at a compound annual rate averaging 20 percent over the past five years and we believe the company’s long-term growth profile remains robust.
We purchased Adobe Systems in the first quarter of 2016. Adobe remains the unmatched leader in creative software and the digitalization of the global economy is only broadening the demand for Adobe’s creative products. The company has successfully navigated the transition from a license software-based business model to the cloud and we believe Adobe is now at a growth inflection point with a total addressable market that continues to expand.
George Fraise, tell us about two holdings that you like.
Fraise (Sustainable – Growth): Mondelez, a leading global packaged foods company focused on snacking, has been a holding of SGA’s since 2014. The company’s pricing power benefits from strong brands and number one or number two market shares in every category in which it competes. Its revenues are highly recurring in nature due to the natural desire by consumers for energy and treats. Its snacks are easily packaged into a variety of configurations and distributed across a broad range of retail channels at low price points. In addition to its organic growth drivers, we expect Mondelez to continue to benefit from management’s steps to substantially improve operating margins as the company modernizes and realigns its outdated supply chain and manufacturing base and utilizes a zero-based budgeting system to efficiently manage operating expenses. This should lead to mid-teens earnings and cash flow growth over the next few years.
A recent addition is UnitedHealth, the largest health insurance and health services company in the U.S. The company has the largest market share in a relatively consolidated market, where its scale and technology provide it the ability to match or underprice its competitors while still being able to offer customers greater health-related cost savings. The company earns a large percentage of its revenues from existing clients’ contract renewals in their United Healthcare and OptumRX businesses. And, since 2008, the company also has greater exposure to Medicare and Medicaid, making it less sensitive to general business conditions. With over 4 million Americans becoming eligible for Medicare every year, demographic trends will bring the company more patients in the private- and government-run sectors, again making effective cost management an ever-increasing need. These factors enhance the recurring revenue model at UnitedHealth and provide more predictability in forecasting its revenues and earnings over the three- to-five-year time horizon that we focus on. Let’s close by asking the value managers to give a look at two of their portfolio holdings.Rich Pzena, please start us off.
Pzena (Pzena – Value): Long-time holding Bank of America has the largest deposit franchise in the United States, as well as a significant investment bank and mortgage business. We believe the business has multiple paths to earnings normalization that include self-help actions, higher interest rates and increased securities trading activity. Most of its businesses continue to show year-on-year growth and the bank continues to bring down expenses. We believe the upside in earnings remains substantial, making Bank of America an attractive opportunity.

19Annual Report | December 31, 2016
Liberty All-Star® Equity Fund Manager Roundtable(Unaudited)
We initiated a position in Seagate Technology, a leader in hard disk drives, in late 2015 then increased our position when it missed earnings in early 2016. Investors are mainly worried about solid state drives overtaking Seagate’s offerings, but a 10-to-1 cost advantage over solid state should provide longevity to Seagate’s hard disk franchise. We like the two-player industry structure, and see a big opportunity for Seagate to restore earnings by rationalizing its cost structure while returning capital to shareholders through its aggressive stock buy-back program.
Ty Nutt and Howard Gleicher, wrap it us for us, please.
Nutt (Delaware – Value): Marsh & McLennan is a long-term holding in our strategy. It is a leading global insurance brokerage and professional services firm. Marsh & McLennan had undergone significant turmoil and transformation in the years leading up to our purchase and represented compelling value to us. The company has good discipline around expenses and its balance sheet is solid. Against the backdrop of a sluggish global economy, the firm is capable of delivering double-digit earnings per share expansion through organic growth, acquisitions, positive operating leverage and capital management.
We recently added a position in Abbott Laboratories, a leading medical products company that we had previously owned in our strategy from 2001 to 2008. Abbott is in the process of transforming itself into a leading provider of cardiovascular products through its impending acquisition of heart-device maker St. Jude Medical. While investors, generally, have not shown much enthusiasm for the deal, we think the combination makes long-term strategic and financial sense. Both Abbott and St. Jude Medical are dominant players in the markets they serve, although the two stocks have underperformed peers over the past year. When combined, Abbott-St. Jude will have a number one or number two market share position in eight categories across its cardiovascular product portfolio.
Gleicher (Aristotle – Value): We have owned and/or followed Archer Daniels Midland—and its close competitor Bunge—for more than 12 years. We added it again to our clients’ portfolios during 2015. In our view, Chicago-based Archer Daniels continues to transform itself and adapt to an ever-changing global agricultural landscape. As one of the largest integrated agricultural services companies in a consolidating industry, the company participates in all aspects of food production after farming and before cooking. While somewhat cyclical by the nature of its industry, Archer Daniels is adapting and transforming itself into a more predictable, more value-added food and agricultural services company. The company continues to satisfy all three criteria requisite for inclusion in Aristotle Capital client portfolios.
We recently added PPG Industries, the world’s second-largest coatings company, to the Fund. In our view, among the high-quality characteristics PPG possesses are: a strong market position in a consolidating industry, close relationships with customers and a diverse, differentiated product set, all of which yield pricing power. PPG also has historically produced predictable financial results, including consistent free cash flow generation, with fairly low cyclicality, a trait difficult to find in the materials sector.
Many thanks to all. After a difficult start and several challenging periods, 2016 turned out to be a reasonably good year. Two thousand seventeen opened on a much more positive note, and we hope the year ends the same way. One thing is certain: Given all the forces at work in the marketplace today, it will not lack for interest.

Liberty All-Star® Equity Fund Schedule of Investments December 31, 2016
See Notes to Schedule of Investments and Financial Statements.
20 www.all-starfunds.com
SHARES MARKET VALUECOMMON STOCKS (97.31%)
CONSUMER DISCRETIONARY (12.06%) Automobiles (0.40%) Ford Motor Co. 385,900 $ 4,680,967
Hotels, Restaurants & Leisure (2.91%) Chipotle Mexican Grill, Inc.(a)(b) 25,972 9,799,755 Hilton Worldwide Holdings, Inc. 222,500 6,052,000 Starbucks Corp. 322,464 17,903,201
33,754,956
Household Durables (0.50%) Lennar Corp., Class A 136,000 5,838,480
Internet & Catalog Retail (3.15%) Amazon.com, Inc.(b) 25,419 19,060,946 The Priceline Group, Inc.(b) 11,907 17,456,376
36,517,322
Media (1.83%) The Interpublic Group of Cos., Inc. 128,075 2,998,236 News Corp., Class A 305,600 3,502,176 News Corp., Class B 73,245 864,291 Omnicom Group, Inc. 67,575 5,751,308 Time Warner, Inc. 84,000 8,108,520
21,224,531
Specialty Retail (2.30%) The Home Depot, Inc. 55,600 7,454,848 Lowe's Companies, Inc. 204,139 14,518,366 Staples, Inc. 524,632 4,747,919
26,721,133
Textiles, Apparel & Luxury Goods (0.97%) NIKE, Inc., Class B 181,321 9,216,547 Under Armour, Inc., Class A(a)(b) 56,600 1,644,230 Under Armour, Inc., Class C(b) 17,713 445,836
11,306,613
CONSUMER STAPLES (9.23%) Beverages (0.90%) The Coca‐Cola Co. 113,700 4,714,002 Monster Beverage Corp.(b) 127,800 5,666,652
10,380,654
Food & Staples Retailing (3.48%) Costco Wholesale Corp. 42,575 6,816,683 CVS Health Corp. 172,345 13,599,744 Walgreens Boots Alliance, Inc. 83,100 6,877,356

Liberty All-Star® Equity Fund Schedule of Investments December 31, 2016
See Notes to Schedule of Investments and Financial Statements.
Annual Report | December 31, 2016 21
SHARES MARKET VALUECOMMON STOCKS (continued)
Food & Staples Retailing (continued) Wal‐Mart Stores, Inc. 84,200 $ 5,819,904 Whole Foods Market, Inc. 235,294 7,237,644
40,351,331
Food Products (3.53%) Archer‐Daniels‐Midland Co. 261,400 11,932,910 The Kraft Heinz Co. 80,400 7,020,528 Mondelez International, Inc., Class A 497,216 22,041,585
40,995,023
Household Products (0.69%) Colgate‐Palmolive Co. 122,620 8,024,253
Personal Products (0.63%) Coty, Inc., Class A 119,000 2,178,890 Unilever NV 126,100 5,177,666
7,356,556
ENERGY (8.80%) Energy Equipment & Services (2.54%) Core Laboratories NV(a) 67,685 8,124,908 Halliburton Co. 311,200 16,832,808 Schlumberger Ltd. 54,519 4,576,870
29,534,586
Oil, Gas & Consumable Fuels (6.26%) BP PLC(c) 126,501 4,728,607 Cenovus Energy, Inc. 337,675 5,109,023 Chevron Corp. 64,200 7,556,340 Concho Resources, Inc.(b) 16,975 2,250,885 ConocoPhillips 147,700 7,405,678 EQT Corp. 74,800 4,891,920 Exxon Mobil Corp. 64,675 5,837,565 Marathon Oil Corp. 229,700 3,976,107 Murphy Oil Corp.(a) 143,075 4,453,925 Occidental Petroleum Corp. 92,500 6,588,775 Phillips 66 74,500 6,437,545 Pioneer Natural Resources Co. 28,600 5,150,002 Royal Dutch Shell PLC, Class A(c) 151,229 8,223,833
72,610,205
FINANCIALS (19.28%) Capital Markets (5.37%) Ameriprise Financial, Inc. 56,100 6,223,734 Bank of New York Mellon Corp. 170,500 8,078,290 The Charles Schwab Corp. 165,300 6,524,391

Liberty All-Star® Equity Fund Schedule of Investments December 31, 2016
See Notes to Schedule of Investments and Financial Statements.
22 www.all-starfunds.com
SHARES MARKET VALUECOMMON STOCKS (continued)
Capital Markets (continued) Franklin Resources, Inc. 174,700 $ 6,914,626 The Goldman Sachs Group, Inc. 36,925 8,841,691 Morgan Stanley 212,300 8,969,675 State Street Corp. 150,726 11,714,425 UBS Group AG 325,600 5,102,152
62,368,984
Commercial Banks (3.46%) Banco Bilbao Vizcaya Argentaria SA(a)(c) 826,463 5,595,155 BB&T Corp. 159,600 7,504,392 BOK Financial Corp.(a) 44,400 3,686,976 Cullen/Frost Bankers, Inc. 38,000 3,352,740 First Republic Bank 52,530 4,840,114 M&T Bank Corp. 33,000 5,162,190 Mitsubishi UFJ Financial Group, Inc.(c) 682,100 4,201,736 Regions Financial Corp. 400,825 5,755,847
40,099,150
Consumer Finance (2.39%) Capital One Financial Corp. 78,440 6,843,106 Visa, Inc., Class A 268,458 20,945,093
27,788,199
Diversified Financial Services (3.91%) Bank of America Corp. 737,300 16,294,330 Citigroup, Inc. 146,006 8,677,137 JPMorgan Chase & Co. 132,825 11,461,469 Voya Financial, Inc. 227,275 8,913,725
45,346,661
Insurance (4.15%) The Allstate Corp. 104,100 7,715,892 American International Group, Inc. 87,975 5,745,647 Axis Capital Holdings Ltd. 89,225 5,823,716 Chubb Ltd. 117,600 15,537,312 Marsh & McLennan Cos., Inc. 105,800 7,151,022 Metlife, Inc. 115,850 6,243,156
48,216,745
HEALTH CARE (13.59%) Biotechnology (3.85%) AbbVie, Inc. 101,300 6,343,406 Alexion Pharmaceuticals, Inc.(b) 52,800 6,460,080 Amgen, Inc. 62,732 9,172,046 BioMarin Pharmaceutical, Inc.(b) 53,073 4,396,567 Celgene Corp.(b) 99,621 11,531,131

Liberty All-Star® Equity Fund Schedule of Investments December 31, 2016
See Notes to Schedule of Investments and Financial Statements.
Annual Report | December 31, 2016 23
SHARES MARKET VALUECOMMON STOCKS (continued)
Biotechnology (continued) Regeneron Pharmaceuticals, Inc.(b) 18,636 $ 6,841,089
44,744,319
Health Care Equipment & Supplies (1.52%) Baxter International, Inc. 149,000 6,606,660 Danaher Corp. 63,500 4,942,840 Medtronic PLC 86,200 6,140,026
17,689,526
Health Care Providers & Services (3.07%) Acadia Healthcare Co., Inc.(a)(b) 112,050 3,708,855 Cardinal Health, Inc. 89,300 6,426,921 Cigna Corp. 48,775 6,506,097 Express Scripts Holding Co.(b) 96,800 6,658,872 Quest Diagnostics, Inc. 84,700 7,783,930 UnitedHealth Group, Inc. 28,090 4,495,524
35,580,199
Health Care Technology (0.59%) Cerner Corp.(b) 144,969 6,867,182
Life Sciences Tools & Services (0.19%) Illumina, Inc.(b) 16,895 2,163,236
Pharmaceuticals (4.37%) Abbott Laboratories 276,425 10,617,484 Allergan PLC(b) 35,362 7,426,374 Johnson & Johnson 60,200 6,935,642 Merck & Co., Inc. 113,300 6,669,971 Novartis AG(c) 73,000 5,317,320 Novo Nordisk AS(c) 196,018 7,029,205 Pfizer, Inc. 207,400 6,736,352
50,732,348
INDUSTRIALS (5.68%) Aerospace & Defense (1.90%) General Dynamics Corp. 41,000 7,079,060 Northrop Grumman Corp. 33,100 7,698,398 Raytheon Co. 51,100 7,256,200
22,033,658
Commercial Services & Supplies (0.68%) Waste Management, Inc. 111,600 7,913,556
Machinery (2.41%) Deere & Co. 43,000 4,430,720

Liberty All-Star® Equity Fund Schedule of Investments December 31, 2016
See Notes to Schedule of Investments and Financial Statements.
24 www.all-starfunds.com
SHARES MARKET VALUECOMMON STOCKS (continued)
Machinery (continued) Dover Corp. 92,275 $ 6,914,166 Oshkosh Corp. 97,000 6,267,170 Parker‐Hannifin Corp. 40,950 5,733,000 Stanley Black & Decker, Inc. 40,300 4,622,007
27,967,063
Road & Rail (0.40%) Kansas City Southern 54,385 4,614,567
Trading Companies & Distributors (0.29%) Fastenal Co. 71,700 3,368,466
INFORMATION TECHNOLOGY (20.02%) Communications Equipment (0.59%) Cisco Systems, Inc. 226,300 6,838,786
Computers & Peripherals (0.30%) HP, Inc. 234,400 3,478,496
Electronic Equipment & Instruments (0.20%) Corning, Inc. 94,115 2,284,171
Internet Software & Services (3.79%) Alphabet, Inc., Class C(b) 32,257 24,896,598 Facebook, Inc., Class A(b) 166,445 19,149,497
44,046,095
IT Services (3.53%) Alliance Data Systems Corp. 31,157 7,119,375 Automatic Data Processing, Inc. 83,862 8,619,336 Cognizant Technology Solutions Corp., Class A(b) 118,825 6,657,765 FleetCor Technologies, Inc.(b) 64,893 9,183,657 PayPal Holdings, Inc.(b) 239,490 9,452,670
41,032,803
Semiconductors & Semiconductor Equipment (2.03%) Intel Corp. 360,266 13,066,848 Microchip Technology, Inc. 105,000 6,735,750 Texas Instruments, Inc. 51,846 3,783,203
23,585,801
Software (8.02%) Adobe Systems, Inc.(b) 152,306 15,679,903 ANSYS, Inc.(b) 21,219 1,962,545 CA, Inc. 211,600 6,722,532

Liberty All-Star® Equity Fund Schedule of Investments December 31, 2016
See Notes to Schedule of Investments and Financial Statements.
Annual Report | December 31, 2016 25
SHARES MARKET VALUECOMMON STOCKS (continued)
Software (continued) Microsoft Corp. 118,600 $ 7,369,804 Mobileye NV(b) 166,250 6,337,450 Oracle Corp. 181,400 6,974,830 Red Hat, Inc.(b) 116,005 8,085,548 Salesforce.com, Inc.(b) 286,891 19,640,558 SAP SE(c) 86,000 7,432,980 ServiceNow, Inc.(b) 87,781 6,525,640 Splunk, Inc.(b) 123,629 6,323,623
93,055,413
Technology Hardware, Storage & Equipment (1.56%) Apple, Inc. 77,149 8,935,397 Hewlett Packard Enterprise Co. 247,196 5,720,116 Seagate Technology 89,400 3,412,398
18,067,911
MATERIALS (3.29%) Chemicals (2.64%) Air Products & Chemicals, Inc. 23,400 3,365,388 The Dow Chemical Co. 99,100 5,670,502 Ecolab, Inc. 78,105 9,155,468 EI du Pont de Nemours & Co. 103,500 7,596,900 PPG Industries, Inc. 51,500 4,880,140
30,668,398
Construction Materials (0.65%) Martin Marietta Materials, Inc. 34,100 7,554,173
REAL ESTATE (2.84%) Equity Real Estate Investment (0.61%) Equity Residential 110,000 7,079,600
Real Estate Investment Trusts (2.23%) American Tower Corp. 107,850 11,397,588 Equinix, Inc. 40,652 14,529,431
25,927,019
TELECOMMUNICATION SERVICES (1.26%) Diversified Telecommunication (1.26%) AT&T, Inc. 174,900 7,438,497 Verizon Communications, Inc. 134,800 7,195,624
14,634,121

Liberty All-Star® Equity Fund Schedule of Investments December 31, 2016
See Notes to Schedule of Investments and Financial Statements.
26 www.all-starfunds.com
SHARES MARKET VALUECOMMON STOCKS (continued)
UTILITIES (1.26%) Electric Utilities (0.60%) Edison International 97,300 $ 7,004,627
Gas Utilities (0.35%) National Fuel Gas Co. 72,000 4,078,080
Independent Power and Renewable Energy Producers (0.31%) AES Corp. 307,000 3,567,340
TOTAL COMMON STOCKS (COST OF $994,169,904) 1,129,693,303
SHORT TERM INVESTMENTS (4.64%)
MONEY MARKET FUND (3.83%) State Street Institutional U.S. Government Money
Market Fund, 0.42%(d)
(COST OF $44,508,132) 44,508,132 44,508,132
INVESTMENTS PURCHASED WITH COLLATERAL FROM SECURITIES LOANED (0.81%)
State Street Navigator Securities Lending Government Money Market Portfolio, 0.50%
(COST OF $9,369,253) 9,369,253 9,369,253
TOTAL SHORT TERM INVESTMENTS
(COST OF $53,877,385) 53,877,385
TOTAL INVESTMENTS (101.95%) (COST OF $1,048,047,289)(e) 1,183,570,688
LIABILITIES IN EXCESS OF OTHER ASSETS (‐1.95%) (22,581,108)
NET ASSETS (100.00%) $ 1,160,989,580
NET ASSET VALUE PER SHARE(189,439,556 SHARES OUTSTANDING) $ 6.13

Liberty All-Star® Equity Fund Schedule of Investments December 31, 2016
See Notes to Financial Statements.
Annual Report | December 31, 2016 27
Notes to Schedule of Investments:
(a) Security, or a portion of the security position, is currently on loan. The total market value of securities on loan is $13,402,360.
(b) Non-income producing security. (c) American Depositary Receipt. (d) Rate reflects seven-day effective yield on December 31, 2016. (e) Cost of investments for federal income tax purposes is $1,049,556,972.
Gross unrealized appreciation and depreciation at December 31, 2016 based on cost of investments for federal income tax purposes is as follows:
Gross unrealized appreciation $ 190,832,585 Gross unrealized depreciation (56,818,869)
Net unrealized appreciation $ 134,013,716

Liberty All-Star® Equity Fund Statement of Assets and Liabilities December 31, 2016
See Notes to Financial Statements.
28 www.all-starfunds.com
ASSETS: Investments at market value (Cost $1,048,047,289) $1,183,570,688Cash 10,712Receivable for investment securities sold 24,900,142Dividends and interest receivable 1,409,942Tax reclaim receivable 2,043Prepaid and other assets 2,124
TOTAL ASSETS 1,209,895,651
LIABILITIES: Payable for investments purchased 22,740,544Distributions payable to shareholders 15,631,700Investment advisory fee payable 714,125Payable for administration, pricing and bookkeeping fees 184,666Payable for collateral upon return of securities loaned 9,369,253Accrued expenses 265,783
TOTAL LIABILITIES 48,906,071
NET ASSETS $1,160,989,580
NET ASSETS REPRESENTED BY:Paid‐in capital $1,038,226,750Distributions in excess of net investment income (11,250,886)Accumulated net realized loss on investments (1,509,683)Net unrealized appreciation on investments 135,523,399
NET ASSETS $1,160,989,580
Shares of common stock outstanding
(unlimited number of shares of beneficial interest without par value authorized) 189,439,556
NET ASSET VALUE PER SHARE $6.13

Liberty All-Star® Equity Fund Statement of Operations For the Year Ended December 31, 2016
See Notes to Financial Statements.
Annual Report | December 31, 2016 29
INVESTMENT INCOME: Dividends (Net of foreign taxes withheld at source which amounted to $126,328) $19,799,680Securities lending income 424,229Interest 1,324
TOTAL INVESTMENT INCOME 20,225,233
EXPENSES: Investment advisory fee 8,056,249Administration fee 2,014,315Pricing and bookkeeping fees 199,452Audit fee 48,244Custodian fee 95,528Insurance expense 57,420Legal fees 468,461NYSE fee 183,017Shareholder communication expenses 99,538Transfer agent fees 108,452Trustees' fees and expenses 193,487Miscellaneous expenses 347,609
TOTAL EXPENSES 11,871,772
NET INVESTMENT INCOME 8,353,461
REALIZED AND UNREALIZED GAIN ON INVESTMENTS:Net realized gain on investment transactions 77,621,557Net realized gain on foreign currency transactions 11,345Net change in unrealized appreciation on investments 987,445
NET REALIZED AND UNREALIZED GAIN ON INVESTMENTS 78,620,347
NET INCREASE IN NET ASSETS RESULTING FROM OPERATIONS $86,973,808

Liberty All-Star® Equity Fund Statements of Changes in Net Assets
See Notes to Financial Statements.
30 www.all-starfunds.com
For the Year Ended
December 31, 2016
For the Year Ended
December 31, 2015 FROM OPERATIONS:
Net investment income $8,353,461 $7,048,764 Net realized gain on investment transactions 77,632,902 99,752,650 Net change in unrealized
appreciation/(depreciation) on investments 987,445 (130,429,134)
Net Increase/(Decrease) in Net Assets From Operations 86,973,808 (23,627,720)
DISTRIBUTIONS TO SHAREHOLDERS: From net investment income (8,327,978) – From net realized gains on investments (71,261,720) (92,237,880) Tax return of capital (9,746,264) –
Total Distributions (89,335,962) (92,237,880)
CAPITAL SHARE TRANSACTIONS:Dividend reinvestments 26,759,969 27,755,527
Net Increase/(Decrease) in Net Assets 24,397,815 (88,110,073)
NET ASSETS: Beginning of period 1,136,591,765 1,224,701,838
End of period (Includes distributions in excess of net investment income of $(11,250,886) and $(1,541,450), respectively) $1,160,989,580 $1,136,591,765

Intentionally Left Blank

Liberty All-Star® Equity Fund Financial Highlights
See Notes to Financial Statements.
32 www.all-starfunds.com
PER SHARE OPERATING PERFORMANCE:
Net asset value at beginning of period
INCOME FROM INVESTMENT OPERATIONS: Net investment income(a)
Net realized and unrealized gain/(loss) on investments
Total from Investment Operations
LESS DISTRIBUTIONS TO SHAREHOLDERS: Net investment income
Net realized gain on investments
Tax return of capital
Total Distributions
Change due to tender offer(b)
Net asset value at end of period
Market price at end of period
TOTAL INVESTMENT RETURN FOR SHAREHOLDERS:(c) Based on net asset value
Based on market price
RATIOS AND SUPPLEMENTAL DATA: Net assets at end of period (millions)
Ratio of expenses to average net assets after reimbursement
Ratio of expenses to average net assets before reimbursement
Ratio of net investment income to average net assets
Portfolio turnover rate
(a) Calculated using average shares outstanding during the period. (b) Effect of Fund's tender offer for shares at a price below net asset value, net of costs. (c) Calculated assuming all distributions are reinvested at actual reinvestment prices. The net
asset value and market price returns will differ depending upon the level of any discount from or premium to net asset value at which the Fund's shares traded during the period. Past performance is not a guarantee of future results.

Financial Highlights
Annual Report | December 31, 2016 33
For the Year Ended December 31,
2016 2015 2014 2013 2012
$6.18
$6.84
$6.71 $5.35 $4.99
0.04
0.04
0.02 0.03 0.04
0.39
(0.19)
0.50 1.66 0.64
0.43
(0.15)
0.52 1.69 0.68
(0.05)
–
(0.08) (0.31) (0.32)
(0.38)
(0.51)
(0.30) (0.04) –
(0.05)
–
(0.01) – –
(0.48)
(0.51)
(0.39) (0.35) (0.32)
–
–
– 0.02 –
$6.13
$6.18
$6.84 $6.71 $5.35
$5.16
$5.35
$5.98 $5.97 $4.77
9.1%
(1.0%)
8.9% 33.8% 14.7%
6.1%
(2.0%)
7.0% 33.5% 20.9%
$1,161
$1,137
$1,225 $1,177 $991
N/A
N/A
N/A N/A 1.07%
1.07%
1.04%
1.03% 1.05% 1.08%
0.76%
0.60%
0.32% 0.44% 0.72%
46%
76%
36% 41% 45%

Liberty All-Star® Equity Fund Notes to Financial Statements December 31, 2016
34 www.all-starfunds.com
NOTE 1. ORGANIZATION Liberty All‐Star® Equity Fund (the “Fund”) is a Massachusetts business trust registered under the Investment Company Act of 1940 (the “Act”), as amended, as a diversified, closed‐end management investment company.
Investment Goal The Fund seeks total investment return comprised of long‐term capital appreciation and current income through investing primarily in a diversified portfolio of equity securities.
Fund Shares The Fund may issue an unlimited number of shares of beneficial interest.
NOTE 2. SIGNIFICANT ACCOUNTING POLICIES The following is a summary of significant accounting policies consistently followed by the Fund in the preparation of its financial statements. The Fund is considered an investment company under U.S. GAAP and follows the accounting and reporting guidance applicable to investment companies in the Financial Accounting Standards Board Accounting Standards Codification Topic 946.
Use of Estimates The preparation of financial statements in conformity with accounting principles generally accepted in the United States of America (“GAAP”) requires management to make estimates and assumptions that affect the reported amounts and disclosures in the financial statements. Actual results could differ from these estimates.
Security Valuation Equity securities are valued at the last sale price at the close of the principal exchange on which they trade, except for securities listed on the NASDAQ Stock Market LLC (“NASDAQ”), which are valued at the NASDAQ official closing price. Unlisted securities or listed securities for which there were no sales during the day are valued at the closing bid price on such exchanges or over‐the‐counter markets. Cash collateral from securities lending activity is reinvested in the State Street Navigator Securities Lending Government Money Market Portfolio, registered investment company under the 1940 Act, which operates as a money market fund in compliance with Rule 2a‐7 under the 1940 Act. Shares of registered investment companies are valued daily at that investment company’s net asset value per share. Repurchase agreements are valued at cost, which approximates fair value. The Fund’s investments are valued at market value or, in the absence of market value with respect to any portfolio securities, at fair value according to procedures adopted by the Fund’s Board of Trustees (the “Board”). When market quotations are not readily available, or in management’s judgment they do not accurately reflect fair value of a security, or an event occurs after the market close but before the Fund is priced that materially affects the value of a security, the securities will be valued by the Fund’s Fair Valuation Committee using fair valuation procedures established by the Board. Examples of potentially significant events that could materially impact the value of a security include, but are not limited to: single issuer events such as corporate actions, reorganizations, mergers, spin‐offs, liquidations, acquisitions and buyouts; corporate announcements on earnings or product offerings; regulatory news; and litigation and multiple issuer events such as governmental actions; natural disasters or armed conflicts that affect a

Liberty All-Star® Equity Fund Notes to Financial Statements December 31, 2016
Annual Report | December 31, 2016 35
country or a region; or significant market fluctuations. Potential significant events are monitored by the Advisor ALPS Advisors Inc. (the "Advisor"), Sub‐Advisers and/or the Valuation Committee through independent reviews of market indicators, general news sources and communications from the Fund’s custodian. As of December 31, 2016, the Fund held no securities that were fair valued.
Security Transactions Security transactions are recorded on trade date. Cost is determined and gains/(losses) are based upon the specific identification method for both financial statement and federal income tax purposes.
Income Recognition Interest income is recorded on the accrual basis. Corporate actions and dividend income are recorded on the ex‐date. The Fund estimates components of distributions from real estate investment trusts (“REITs”). Distributions received in excess of income are recorded as a reduction of the cost of the related investments. Once the REIT reports annually the tax character of its distributions, the Fund revises its estimates. If the Fund no longer owns the applicable securities, any distributions received in excess of income are recorded as realized gains.
Lending of Portfolio Securities The Fund may lend its portfolio securities only to borrowers that are approved by the Fund’s securities lending agent, State Street Bank & Trust Co. (“SSB”). The Fund will limit such lending to not more than 30% of the value of its total assets. The borrower pledges and maintains with the Fund collateral consisting of cash (U.S. Dollar only), securities issued or guaranteed by the U.S. government or its agencies or instrumentalities, or by irrevocable bank letters of credit issued by a person other than the Borrower or an affiliate of the Borrower. The initial collateral received by the Fund is required to have a value of no less than 102% of the market value of the loaned securities for securities traded on U.S. exchanges and a value of no less than 105% of the market value for all other securities. The collateral is maintained thereafter, at a market value equal to no less than 100% of the current value of the securities on loan. The market value of the loaned securities is determined at the close of each business day and any additional required collateral is delivered to the Fund on the next business day. During the term of the loan, the Fund is entitled to all distributions made on or in respect of the loaned securities. Loans of securities are terminable at any time and the borrower, after notice, is required to return borrowed securities within the standard time period for settlement of securities transactions. Any cash collateral received is reinvested in a money market fund managed by SSB as disclosed in the Fund’s Schedule of Investments and is reflected in the Statement of Assets and Liabilities as a payable for collateral upon return of securities loaned. Non‐cash collateral, in the form of securities issued or guaranteed by the U.S. government or its agencies or instrumentalities, is not disclosed in the Fund’s Statements of Assets and Liabilities as it is held by the lending agent on behalf of the Fund and the Fund does not have the ability to re‐hypothecate these securities. Income earned by the Fund from securities lending activity is disclosed in the Statement of Operations.

Liberty All-Star® Equity Fund Notes to Financial Statements December 31, 2016
36 www.all-starfunds.com
The following is a summary of the Fund's securities lending agreement and related cash and non‐cash collateral received as of December 31, 2016:
Market Value of Securities on Loan
Cash Collateral Received
Non-Cash Collateral Received
Total Collateral Received
Liberty All‐Star® Equity Fund $ 13,402,360 $ 9,369,253 $ 4,357,823 $ 13,727,076 The risks of securities lending include the risk that the borrower may not provide additional collateral when required or may not return the securities when due. To mitigate these risks, the Fund benefits from a borrower default indemnity provided by SSB. SSB’s indemnity allows for full replacement of securities lent wherein SSB will purchase the unreturned loaned securities on the open market by applying the proceeds of the collateral, or to the extent such proceeds are insufficient or the collateral is unavailable, SSB will purchase the unreturned loan securities at SSB’s expense. However, the Fund could suffer a loss if the value of the investments purchased with cash collateral falls below the value of the cash collateral received. The following table reflects a breakdown of transactions accounted for as secured borrowings, the gross obligation by the type of collateral pledged or securities loaned, and the remaining contractual maturity of those transactions as of December 31, 2016: Liberty All‐Star® Equity Fund Remaining contractual maturity of the agreement
Securities Lending
Transactions Overnight & Continuous
Up to 30 days
30-90 days
Greater than 90 days Total
Common Stocks $ 9,369,253 $ – $ – $ – $ 9,369,253
Total Borrowings 9,369,253
Gross amount of recognized liabilities for securities lending (collateral received) $ 9,369,253
Fair Value Measurements The Fund discloses the classification of its fair value measurements following a three‐tier hierarchy based on the inputs used to measure fair value. Inputs refer broadly to the assumptions that market participants would use in pricing the asset or liability, including assumptions about risk. Inputs may be observable or unobservable. Observable inputs reflect the assumptions market participants would use in pricing the asset or liability that are developed based on market data obtained from sources independent of the reporting entity. Unobservable inputs reflect the reporting entity’s own assumptions about the assumptions market participants would use in pricing the asset or liability that are developed based on the best information available. Valuation techniques used to value the Fund’s investments by major category are as follows: Equity securities that are value based on unadjusted quoted prices in active markets are categorized as Level 1 in the hierarchy. In the event there were no sales during the day or closing prices are not available, securities are valued at the mean of the most recent quoted bid and ask prices on such day and are generally categorized as Level 2 in the hierarchy. Investments in open‐

Liberty All-Star® Equity Fund Notes to Financial Statements December 31, 2016
Annual Report | December 31, 2016 37
end mutual funds are valued at their closing NAV each business day and are categorized as Level 1 in the hierarchy. Various inputs are used in determining the value of the Fund’s investments as of the end of the reporting period. When inputs used fall into different levels of the fair value hierarchy, the level in the hierarchy within which the fair value measurement falls is determined based on the lowest level input that is significant to the fair value measurement in its entirety. The designated input levels are not necessarily an indication of the risk or liquidity associated with these investments. These inputs are categorized in the following hierarchy under applicable financial accounting standards:
Level 1 – Unadjusted quoted prices in active markets for identical investments, unrestricted assets or liabilities that a Fund has the ability to access at the measurement date;
Level 2 – Quoted prices which are not active, quoted prices for similar assets or liabilities in active markets or inputs other than quoted prices that are observable (either directly or indirectly) for substantially the full term of the asset or liability; and
Level 3 – Significant unobservable prices or inputs (including the Fund’s own assumptions in determining the fair value of investments) where there is little or no market activity for the asset or liability at the measurement date.
The following is a summary of the inputs used to value the Fund’s investments as of December 31, 2016:
Valuation Inputs Investments in Securities at Value* Level 1 Level 2 Level 3 Total Common Stocks $ 1,129,693,303 $ – $ – $ 1,129,693,303 Short Term Investment 44,508,132 – – 44,508,132 Investments Purchased with
Collateral from Securities Loaned 9,369,253 – – 9,369,253
Total $ 1,183,570,688 $ – $ – $ 1,183,570,688
* See Schedule of Investments for industry classifications.
The Fund recognizes transfers between the levels as of the end of the period. For the year ended December 31, 2016, the Fund did not have any transfers between Level 1 and Level 2 securities. The Fund did not have any securities that used significant unobservable inputs (Level 3) in determining fair value during the period.
Distributions to Shareholders The Fund currently has a policy of paying distributions on its shares of beneficial interest totaling approximately 8% of its net asset value per year. The distributions are payable in four quarterly

Liberty All-Star® Equity Fund Notes to Financial Statements December 31, 2016
38 www.all-starfunds.com
distributions of 2% of the Fund’s net asset value at the close of the NYSE on the Friday prior to each quarterly declaration date. Distributions to shareholders are recorded on ex‐date.
NOTE 3. FEDERAL TAX INFORMATION AND TAX BASIS INFORMATION The timing and character of income and capital gain distributions are determined in accordance with income tax regulations, which may differ from GAAP. Reclassifications are made to the Fund’s capital accounts for permanent tax differences to reflect income and gains available for distribution (or available capital loss carryforwards) under income tax regulations. If, for any calendar year, the total distributions made under the distribution policy exceed the Fund’s net investment income and net realized capital gains, the excess will generally be treated as a non‐taxable return of capital, reducing the shareholder’s adjusted basis in his or her shares. If the Fund’s net investment income and net realized capital gains for any year exceed the amount distributed under the distribution policy, the Fund may, in its discretion, retain and not distribute net realized capital gains and pay income tax thereon to the extent of such excess.
Classification of Distributions to Shareholders Net investment income and net realized gain/(loss) may differ for financial statement and tax purposes. The character of distributions made during the year from net investment income or net realized gains may differ from its ultimate characterization for federal income tax purposes. The amounts and characteristics of tax basis distributions and composition of distributable earnings/(accumulated losses) are finalized at fiscal year‐end. Also, due to the timing of dividend distributions, the fiscal year in which amounts are distributed may differ from the fiscal year in which the income or realized gain was recorded by the Fund. For the year ended December 31, 2016, permanent book and tax basis differences resulting primarily from excess distributions were identified and reclassified among the components of the Fund’s net assets as follows:
Accumulated Net Investment Loss Accumulated Net Realized Loss Paid-In Capital
$ (9,734,919)
$ (11,345) $ 9,746,264
The tax character distributions paid during the years ended December 31, 2016 and December 31, 2015 were as follows:
Distributions Paid From: 12/31/2016 12/31/2015 Ordinary Income $ 21,742,399 $ – Long‐term capital gains 57,847,299 92,237,880 Return of Capital 9,746,264 –
Total $ 89,335,962 $ 92,237,880

Liberty All-Star® Equity Fund Notes to Financial Statements December 31, 2016
Annual Report | December 31, 2016 39
As of December 31, 2016, the components of distributable earnings on a tax basis were as follows:
Accumulated Capital
Gains Net Unrealized Appreciation
Other Cumulative Effect of Timing
Differences Total $ –
$ 134,013,716
$ (11,250,886) $ 122,762,830
As of December 31, 2016, the cost of investments for federal income tax purposes and accumulated net unrealized appreciation/(depreciation) on investments was as follows:
Cost of Investments
Gross unrealized Appreciation (excess of
value over tax cost)
Gross unrealized Depreciation (excess
of tax cost over value)
Net Unrealized Appreciation
$ 1,049,556,972
$ 190,832,585
$ (56,818,869) $ 134,013,716
The differences between book‐basis and tax‐basis are primarily due to deferral of losses from wash sales and the differing treatment of certain other investments. The Fund elected to defer to the fiscal year ending December 31, 2017, late year ordinary losses in the amount of $238.
Federal Income Tax Status For federal income tax purposes, the Fund currently qualifies, and intends to remain qualified, as a regulated investment company under the provisions of Subchapter M of the Internal Revenue Code of 1986, as amended, by distributing substantially all of its investment company taxable net income including realized gain, not offset by capital loss carryforwards, if any, to its shareholders. Accordingly, no provision for federal income or excise taxes has been made. As of and during the year ended December 31, 2016, the Fund did not have a liability for any unrecognized tax benefits. The Fund files U.S. federal, state, and local tax returns as required. The Fund’s tax returns are subject to examination by the relevant tax authorities until expiration of the applicable statute of limitations, which is generally three years after the filing of the tax return. Tax returns for open years have incorporated no uncertain tax positions that require a provision for income taxes.
NOTE 4. FEES AND COMPENSATION PAID TO AFFILIATES
Investment Advisory Fee ALPS Advisors, Inc. (“AAI”) serves as the investment advisor to the Fund. AAI receives a monthly investment advisory fee based on the Fund’s average daily net assets at the following annual rates: Average Daily Net Assets Annual Fee Rate
First $400 million 0.800% Next $400 million 0.720% Next $400 million 0.648% Over $1.2 billion 0.584%

Liberty All-Star® Equity Fund Notes to Financial Statements December 31, 2016
40 www.all-starfunds.com
Investment Advisory Fees for the year ending December 31, 2016 are reported on the Statement of Operations. AAI retains multiple Portfolio Managers to manage the Fund’s investments in various asset classes. AAI pays each Portfolio Manager a portfolio management fee based on the assets of the investment portfolio that they manage. The portfolio management fee is paid from the investment advisory fees collected by AAI and is based on the Fund’s average daily net assets at the following annual rates: Average Daily Net Assets Annual Fee Rate
First $400 million 0.400% Next $400 million 0.360% Next $400 million 0.324% Over $1.2 billion 0.292%
Administration, Bookkeeping and Pricing Services ALPS Fund Services, Inc. (“ALPS”) serves as the administrator to the Fund and the Fund has agreed to pay expenses incurred in connection with this service. Pursuant to an Administrative, Bookkeeping and Pricing Services Agreement, ALPS provides operational services to the Fund including, but not limited to, fund accounting and fund administration and generally assists in the Fund’s operations. Officers of the Trust are employees of ALPS. The Fund’s administration fee is accrued on a daily basis and paid monthly. Administration, Pricing and Bookkeeping fees paid by the Fund for the year ended December 31, 2016 are disclosed in the Statement of Operations. The Fund also reimburses ALPS for out‐of‐pocket expenses and charges, including fees payable to third parties for pricing the Fund’s portfolio securities and direct internal costs incurred by ALPS in connection with providing fund accounting oversight and monitoring and certain other services.
Fees Paid to Officers All officers of the Fund, including the Fund’s Chief Compliance Officer, are employees of AAI or its affiliates, and receive no compensation from the Fund. The Board of Trustees has appointed a Chief Compliance Officer to the Fund in accordance with federal securities regulations.
NOTE 5. PORTFOLIO INFORMATION
Purchases and Sales of Securities For the year ended December 31, 2016, the cost of purchases and proceeds from sales of securities, excluding short‐term obligations, were $500,370,098 and $565,481,541, respectively.
NOTE 6. CAPITAL TRANSACTIONS During the years ended December 31, 2016 and December 31, 2015, distributions in the amounts of $26,759,969 and $27,755,527, respectively, were paid in newly issued shares valued at market value or net asset value, but not less than 95% of market value. Such distributions resulted in the issuance of 5,387,206 and of 5,021,023 shares, respectively. Under the Fund’s Automatic Dividend Reinvestment and Direct Purchase Plan (the “Plan”), shareholders automatically participate and have all their Fund dividends and distributions reinvested. Under the Plan, all dividends and distributions will be reinvested in additional shares of

Liberty All-Star® Equity Fund Notes to Financial Statements December 31, 2016
Annual Report | December 31, 2016 41
the Fund. Distributions declared payable in cash will be reinvested for the accounts of participants in the Plan in additional shares purchased by the Plan Agent on the open market at prevailing market prices, subject to certain limitations as described more fully in the Plan. Distributions declared payable in shares are paid to participants in the Plan entirely in newly issued full and fractional shares valued at the lower of market value or net asset value per share on the valuation date for the distribution (but not at a discount of more than 5 percent from market price). Dividends and distributions are subject to taxation, whether received in cash or in shares.
NOTE 7. INDEMNIFICATION In the normal course of business, the Fund enters into contracts that contain a variety of representations and warranties and which provide general indemnities. The Fund’s maximum exposure under these arrangements is unknown, as this would involve future claims against the Fund. Also, under the Fund’s organizational documents and by contract, the Trustees and Officers of the Fund are indemnified against certain liabilities that may arise out of their duties to the Fund. However, based on experience, the Fund expects the risk of loss due to these warranties and indemnities to be minimal.
NOTE 8. TRUSTEES FEES As of December 31, 2016, there were six Trustees, five of whom are not “interested persons” of the Fund within the meaning of that term under the 1940 Act (each, an “Independent Trustee”). The Independent Chairman of the Board receives a quarterly retainer of $8,250; the Independent Audit Committee Chairman receives a quarterly retainer of $5,750; the Nominating and Governance Committee (“Nominating Committee”) Chairman receives a quarterly retainer of $5,000; and all other Independent Trustees receive a quarterly retainer of $4,500. Each Independent Trustee also receives a meeting fee of $4,500 for attendance in person at a regular scheduled meeting or a special meeting; $4,500 for attendance by telephone at a regular meeting; and $1,000 for attendance by telephone for a special meeting. Each Audit Committee member receives $4,500 for attendance at an in person Audit Committee meeting and $1,000 for attendance at a telephonic Audit Committee meeting. Each Nominating Committee member receives $1,000 for attendance at an in person or telephonic Nominating Committee meeting. If an Audit Committee or Nominating Committee meeting is held in conjunction with a regular or special board meeting, the Trustees are only compensated for the regular or special board meeting. Independent Trustees are also reimbursed for all reasonable out‐of‐pocket expenses relating to attendance at meetings. Trustees’ fees are allocated between the Fund and the Liberty All‐Star® Growth Fund, Inc. One‐third of the Trustees’ fees are equally shared and the remaining two‐thirds are allocated based on each Fund’s proportionate share of total net assets. Trustees’ fees and expenses accrued by the Fund for the year ending December 31, 2016 are reported on the Statement of Operations.

Report of Independent Registered Liberty All-Star® Equity Fund Public Accounting Firm
42 www.all-starfunds.com
To the Board of the Trustees and Shareholders of Liberty All‐Star® Equity Fund: We have audited the accompanying statement of assets and liabilities of Liberty All‐Star® Equity Fund (the “Fund”), including the schedule of investments, as of December 31, 2016, and the related statement of operations for the year then ended, the statements of changes in net assets for each of the two years in the period then ended, and the financial highlights for each of the five years in the period then ended. These financial statements and financial highlights are the responsibility of the Fund’s management. Our responsibility is to express an opinion on these financial statements and financial highlights based on our audits. We conducted our audits in accordance with the standards of the Public Company Accounting Oversight Board (United States). Those standards require that we plan and perform the audit to obtain reasonable assurance about whether the financial statements and financial highlights are free of material misstatement. The Fund is not required to have, nor were we engaged to perform, an audit of its internal control over financial reporting. Our audits included consideration of internal control over financial reporting as a basis for designing audit procedures that are appropriate in the circumstances, but not for the purpose of expressing an opinion on the effectiveness of the Fund’s internal control over financial reporting. Accordingly, we express no such opinion. An audit also includes examining, on a test basis, evidence supporting the amounts and disclosures in the financial statements, assessing the accounting principles used and significant estimates made by management, as well as evaluating the overall financial statement presentation. Our procedures included confirmation of securities owned as of December 31, 2016, by correspondence with the custodian and brokers; when replies were not received from brokers, we performed other auditing procedures. We believe that our audits provide a reasonable basis for our opinion. In our opinion, such financial statements and financial highlights referred to above present fairly, in all material respects, the financial position of Liberty All‐Star® Equity Fund as of December 31, 2016, the results of its operations for the year then ended, the changes in its net assets for each of the two years in the period then ended, and the financial highlights for each of the five years in the period then ended, in conformity with accounting principles generally accepted in the United States of America. DELOITTE & TOUCHE LLP Denver, Colorado February 16, 2017

Automatic Dividend Reinvestment and Liberty All-Star® Equity Fund Direct Purchase Plan
(Unaudited)
Annual Report | December 31, 2016 43
Under the Fund’s Automatic Dividend Reinvestment and Direct Purchase Plan (the “Plan”), shareholders automatically participate and have all their Fund dividends and distributions reinvested by Computershare Trust Company, N.A., as agent for participants in the Plan (the “Plan Agent”), in additional shares of the Fund. For further information, call Investor Assistance at 1‐800‐LIB‐FUND (1‐800‐542‐3863) weekdays between 9 a.m. and 5 p.m. Eastern Time. Shareholders whose shares are held in the name of a brokerage firm, bank or other nominee can participate in the Plan only if their brokerage firm, bank or nominee is able to do so on their behalf. Shareholders participating in the Plan through a brokerage firm may not be able to transfer their shares to another brokerage firm and continue to participate in the Plan. Under the Plan, all dividends and distributions will be reinvested in additional shares of the Fund. Distributions declared payable in cash will be reinvested for the accounts of participants in the Plan in additional shares purchased by the Plan Agent on the open market at prevailing market prices. If, prior to the Plan Agent’s completion of such open market purchases, the market price of a share plus estimated brokerage commissions exceeds the net asset value, the remainder of the distribution will be paid in newly issued shares valued at net asset value (but not at a discount of more than 5% from market price). Distributions declared payable in shares (or cash at the option of shareholders) are paid to participants in the Plan entirely in newly issued full and fractional shares valued at the lower of market value or net asset value per share on the valuation date for the distribution (but not at a discount of more than 5 percent from market price). Dividends and distributions are subject to taxation, whether received in cash or in shares. Plan participants have the option of making additional investments of $100 or more on a monthly basis up to a maximum of $120,000 in a calendar year. These direct purchases will be invested on or shortly after the 15th of each month and direct purchases should be sent so as to be received by the Plan Agent at least two business days prior to the next investment date. Barring suspension of trading, direct purchases will be invested within 35 days after such date. Alternatively, participants can authorize an automatic monthly deduction from a checking or savings account at a U.S. bank or other financial institution. A participant may withdraw a direct purchase by written notice received by the Plan Agent at least two business days before such payment is to be invested. The Plan Agent maintains all shareholder accounts in the Plan and furnishes confirmations of all transactions in the account, including information needed by shareholders for tax records. Shares in the account of each Plan participant will be held by the Plan Agent in book‐entry or noncertificated form in the name of the participant, and each shareholder’s proxy will include those shares purchased or received pursuant to the Plan. There is no charge to participants for reinvesting distributions pursuant to the Plan. The Plan Agent’s fees are paid by the Fund, therefore indirectly by shareholders. There are no brokerage charges with respect to shares issued directly by the Fund as a result of dividends or distributions declared payable in shares. However, each participant bears a per share fee (which includes any brokerage commissions the Plan Agent is required to pay) incurred with respect to the Plan Agent’s open market purchases in connection with the reinvestment of distributions declared payable in cash.

Automatic Dividend Reinvestment and Liberty All-Star® Equity Fund Direct Purchase Plan
(Unaudited)
44 www.all-starfunds.com
With respect to direct purchases, the Plan Agent will charge $1.25 for purchase by check and $2.00 for automatic investment transactions, plus a per share fee (which includes any brokerage commissions the Plan Agent is required to pay). Sales of shares held in the Plan will also be subject to a service fee of $2.50 and a per share fee currently $0.10. All fees described in this summary are subject to change. Please contact the Plan Agent for the current fees. Shareholders may terminate their participation in the Plan by notifying the Plan Agent by telephone, through the Internet or in writing. Such termination will be effective immediately if notice is received by The Plan Agent prior to any dividend record date and all subsequent dividends and distributions will be paid in cash instead of shares. The Fund reserves the right to amend or terminate the Plan. The full text of the Plan may be found on the Fund’s website at www.all‐starfunds.com.

Liberty All-Star® Equity Fund Additional Information (Unaudited)
Annual Report | December 31, 2016 45
TAX INFORMATION
All 2016 distributions, whether received in cash or shares of the Fund, consist of the following: (1) ordinary dividends (2) long‐term capital gains The table below details the breakdown of each 2016 distribution for federal income tax purposes. Total Ordinary Dividends
Record Date Payable Date Amount
per Share
Qualified Non- Qualified Long-Term
Capital Gains 10/30/15* 01/04/16 $0.008435 21.26% 6.06% 72.68% 01/22/16 03/07/16 $0.120000 21.26% 6.06% 72.68% 04/29/16 06/13/16 $0.120000 21.26% 6.06% 72.68% 07/29/16 09/12/16 $0.120000 21.26% 6.06% 72.68% 10/28/16 01/03/17 $0.059990 21.26% 6.06% 72.68% 10/28/16** 01/03/17 $0.060010 ‐ ‐ ‐
* Pursuant to Section 852 of the Internal Revenue Code, the taxability of this distribution will be
reported on the Form 1099-DIV for 2016. ** Pursuant to Section 852 of the Internal Revenue Code, the taxability of this distribution will be
reported on the Form 1099-DIV for 2017. Tax Designations The Fund designates the following as a percentage of taxable ordinary income distributions for the calendar year ended December 31, 2016: Qualified Dividend Income 77.83%
Dividend Received Deduction 75.26%
Pursuant to Section 852(b)(3) of the Internal Revenue Code, the Fund designated $57,847,299 as long‐term capital gain dividends.
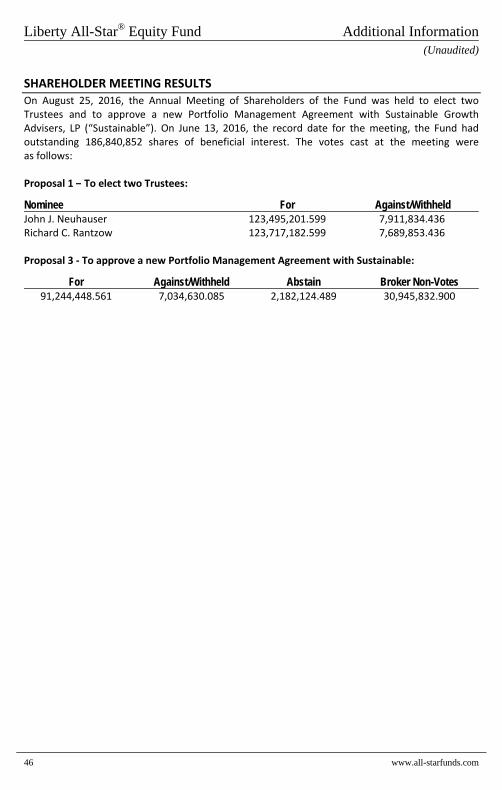
Liberty All-Star® Equity Fund Additional Information (Unaudited)
46 www.all-starfunds.com
SHAREHOLDER MEETING RESULTS On August 25, 2016, the Annual Meeting of Shareholders of the Fund was held to elect two Trustees and to approve a new Portfolio Management Agreement with Sustainable Growth Advisers, LP (“Sustainable”). On June 13, 2016, the record date for the meeting, the Fund had outstanding 186,840,852 shares of beneficial interest. The votes cast at the meeting were as follows: Proposal 1 – To elect two Trustees:
Nominee For Against/Withheld John J. Neuhauser 123,495,201.599 7,911,834.436 Richard C. Rantzow 123,717,182.599 7,689,853.436 Proposal 3 ‐ To approve a new Portfolio Management Agreement with Sustainable:
For Against/Withheld Abstain Broker Non-Votes 91,244,448.561 7,034,630.085 2,182,124.489 30,945,832.900

Liberty All-Star® Equity Fund Trustees and Officers (Unaudited)
Annual Report | December 31, 2016 47
The Fund’s Statement of Additional Information includes additional information about the Fund’s Trustees and is available, without charge, by contacting the Fund at 1‐800‐542‐3863. INDEPENDENT TRUSTEES
Name (Year of Birth) and Address*
Position with Equity Fund,
Term of Office and Length of Service
Principal Occupation(s) During Past Five Years
Number of Portfolios in
Fund Complex Overseen
By Trustee** Other
Directorships Held John A. Benning Year of Birth: 1934
Trustee since 2002; Term expires 2018
Retired since December, 1999
2
Director, Liberty All‐Star Growth Fund, Inc. (since 2002
Thomas W. Brock Year of Birth: 1947
Trustee since 2005; Chairman since 2015; Term expires 2017
Chief Executive Officer, Silver Bay Realty (since 2016); Director, Silver Bay Realty (December 2012‐present); Chief Executive Officer, Stone Harbor Investment Partners LP (April 2006‐2012); Adjunct Professor, Columbia University Graduate School of Business (since 1998)
2
Director, Liberty All‐Star Growth Fund, Inc. (since 2005), Trustee, Equitable AXA Annuity Trust (since January 2016), 1290 Funds (since January 2016).
George R. Gaspari Year of Birth: 1940
Trustee since 2006; Term expires 2017
Financial Services Consultant (1996‐2012)
2 Director, Liberty All‐Star Growth Fund, Inc. (since 2006), Trustee (since 1999) and Chairman – Audit Committee (since January 2015), The Select Sector SPDR Trust
* The address for all Trustees is: c/o ALPS Fund Services, Inc., 1290 Broadway, Suite 1100, Denver,
CO 80203. ** The Fund Complex for the Fund includes the Fund, and any other investment companies for which
any Trustee serves as trustee for and for which ALPS Advisors, Inc., Pzena Investment Management, LLC, Delaware Investments Fund Advisers, Aristotle Capital Management, LLC, TCW Investment Management Company, Sustainable Growth Advisers, LP, Congress Asset Management Company, LLP and Weatherbie Capital, LLC provides investment advisory services.

Liberty All-Star® Equity Fund Trustees and Officers (Unaudited)
48 www.all-starfunds.com
INDEPENDENT TRUSTEES (continued)
Name (Year of Birth) and Address*
Position with Equity Fund,
Term of Office and Length of Service
Principal Occupation(s) During Past Five Years
Number of Portfolios in
Fund Complex Overseen
By Trustee** Other
Directorships Held John J. Neuhauser Year of Birth: 1943
Trustee since 1998; Term expires 2019
President, St. Michael’s College (since August, 2007); University Professor December 2005‐2007, Boston College (formerly Academic Vice President and Dean of Faculties, from August 1999 to December 2005, Boston College)
2
Director, Liberty All‐Star Growth Fund, Inc. (since 1998), Trustee, Columbia Funds Series Trust I (since 1985)
Richard C. Rantzow Year of Birth: 1938
Trustee and Chairman – Audit Committee since 2006; Term expires 2019
Retired, Ernst & YoungPartner (1993); Chief Financial Officer, Miller Sports (1993‐1998)
2 Director, Liberty All‐Star Growth Fund, Inc. (since 2006), Trustee, Clough Global Dividend and Income Fund (Since 2004), Trustee, Clough Global Equity Fund (since 2005) and Trustee, Clough Global Opportunities Fund (since 2006).
* The address for all Trustees is: c/o ALPS Fund Services, Inc., 1290 Broadway, Suite 1100, Denver,
CO 80203. ** The Fund Complex for the Fund includes the Fund, and any other investment companies for which
any Trustee serves as trustee for and for which ALPS Advisors, Inc., Pzena Investment Management, LLC, Delaware Investments Fund Advisers, Aristotle Capital Management, LLC, TCW Investment Management Company, Sustainable Growth Advisers, LP, Congress Asset Management Company, LLP and Weatherbie Capital, LLC provides investment advisory services.

Liberty All-Star® Equity Fund Trustees and Officers (Unaudited)
Annual Report | December 31, 2016 49
INTERESTED TRUSTEE
Name (Year of Birth) and Address*
Position with Equity Fund,
Term of Office and Length of Service
Principal Occupation(s) During Past Five Years
Number of Portfolios in
Fund Complex Overseen
By Trustee** Other
Directorships Held Edmund J. Burke*** Year of Birth: 1961
Trustee since 2006; Term expires 2018
Chief Executive Officer and President of ALPS Holdings, Inc., a DST Company (since November 2011); CEO and a Director of ALPS Holdings, Inc. (since 2005); Director of ALPS Advisors, Inc. (since 2001), ALPS Distributors, Inc. (since 2000), ALPS Fund Services, Inc., (since 2000) and ALPS Portfolio Solutions Distributor, Inc. (since 2013). Mr. Burke is also a Director of Boston Financial Data Services (since 2013) and is a Trustee and President of Clough Funds Trust. Mr. Burke is deemed an affiliate of the Fund as defined under the 1940 Act.
16 Director, Liberty All‐Star Growth Fund, Inc. (since 2006), Trustee (since 2004) and President (since 2006), Clough Global Dividend and Income Fund, Trustee (since 2006) and President (since 2005), Clough Global Equity Fund, Trustee and President (since 2006), Clough Global Opportunities Fund, Trustee and President of Clough Funds Trust and Trustee and President of Financial Investors Trust.
* The address for all Trustees is: c/o ALPS Fund Services, Inc., 1290 Broadway, Suite 1100, Denver,
CO 80203. ** The Fund Complex for the Fund includes the Fund, and any other investment companies for which
any Trustee serves as trustee for and for which ALPS Advisors, Inc., Pzena Investment Management, LLC, Delaware Investments Fund Advisers, Aristotle Capital Management, LLC, TCW Investment Management Company, Sustainable Growth Advisers, LP, Congress Asset Management Company, LLP and Weatherbie Capital, LLC provides investment advisory services.
*** Mr. Burke is an “interested person” of the Fund under Section 2(a)(19) of the 1940 Act because he is the CEO and President of ALPS Holdings, Inc.
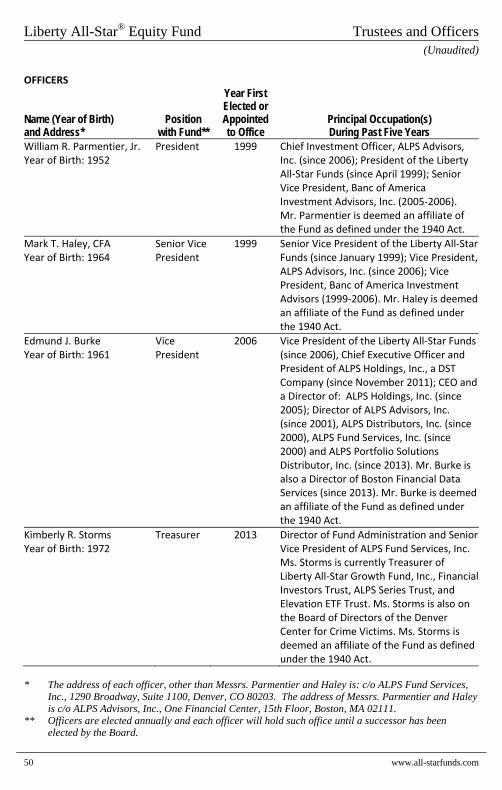
Liberty All-Star® Equity Fund Trustees and Officers (Unaudited)
50 www.all-starfunds.com
OFFICERS
Name (Year of Birth) and Address*
Position with Fund**
Year First Elected or Appointed to Office
Principal Occupation(s) During Past Five Years
William R. Parmentier, Jr. Year of Birth: 1952
President 1999 Chief Investment Officer, ALPS Advisors, Inc. (since 2006); President of the Liberty All‐Star Funds (since April 1999); Senior Vice President, Banc of America Investment Advisors, Inc. (2005‐2006). Mr. Parmentier is deemed an affiliate of the Fund as defined under the 1940 Act.
Mark T. Haley, CFA Year of Birth: 1964
Senior Vice President
1999 Senior Vice President of the Liberty All‐Star Funds (since January 1999); Vice President, ALPS Advisors, Inc. (since 2006); Vice President, Banc of America Investment Advisors (1999‐2006). Mr. Haley is deemed an affiliate of the Fund as defined under the 1940 Act.
Edmund J. Burke Year of Birth: 1961
Vice President
2006 Vice President of the Liberty All‐Star Funds (since 2006), Chief Executive Officer and President of ALPS Holdings, Inc., a DST Company (since November 2011); CEO and a Director of: ALPS Holdings, Inc. (since 2005); Director of ALPS Advisors, Inc. (since 2001), ALPS Distributors, Inc. (since 2000), ALPS Fund Services, Inc. (since 2000) and ALPS Portfolio Solutions Distributor, Inc. (since 2013). Mr. Burke is also a Director of Boston Financial Data Services (since 2013). Mr. Burke is deemed an affiliate of the Fund as defined under the 1940 Act.
Kimberly R. Storms Year of Birth: 1972
Treasurer 2013 Director of Fund Administration and Senior Vice President of ALPS Fund Services, Inc. Ms. Storms is currently Treasurer of Liberty All‐Star Growth Fund, Inc., Financial Investors Trust, ALPS Series Trust, and Elevation ETF Trust. Ms. Storms is also on the Board of Directors of the Denver Center for Crime Victims. Ms. Storms is deemed an affiliate of the Fund as defined under the 1940 Act.
* The address of each officer, other than Messrs. Parmentier and Haley is: c/o ALPS Fund Services,
Inc., 1290 Broadway, Suite 1100, Denver, CO 80203. The address of Messrs. Parmentier and Haley is c/o ALPS Advisors, Inc., One Financial Center, 15th Floor, Boston, MA 02111.
** Officers are elected annually and each officer will hold such office until a successor has been elected by the Board.

Liberty All-Star® Equity Fund Trustees and Officers (Unaudited)
Annual Report | December 31, 2016 51
OFFICERS (continued)
Name (Year of Birth) and Address*
Position with Fund**
Year First Elected or Appointed to Office
Principal Occupation(s) During Past Five Years
Andrew P. Meloni Year of Birth: 1969
Assistant Treasurer
2015 Fund Controller, ALPS Fund Services, Inc. Employee of ALPS Fund Services, Inc. since March 2007. Mr. Meloni is also Assistant Treasurer of Liberty All‐Star Growth Fund, Inc., ALPS ETF Trust, ALPS Variable Investment Trust, RiverNorth Opportunities Fund, Inc. and the Principal Real Estate Income Fund. Mr. Meloni is deemed an affiliate of the Fund as defined under the 1940 Act.
Erin D. NelsonYear of Birth: 1977
Chief Compliance Officer
2015 Ms. Nelson is Senior Vice President and Chief Compliance Officer of ALPS Advisors, Inc. Prior to 2015, Ms. Nelson was Vice‐President and Assistant General Counsel of ALPS. Ms. Nelson is also Chief Compliance Officer of Liberty All‐Star Growth Fund, Inc., Principal Real Estate Income Fund, ALPS Variable Investment Trust, ALPS ETF Trust and the RiverNorth Opportunities Fund, Inc. Ms. Nelson is deemed an affiliate of the Fund as defined under the 1940 Act.
Sareena Khwaja‐Dixon Year of Birth: 1980
Secretary 2016 Ms. Khwaja‐Dixon joined ALPS in August 2015 and is currently Senior Counsel and Vice President of ALPS Fund Services, Inc. Prior to joining ALPS, Ms. Khwaja‐Dixon served as a Senior Paralegal/Paralegal for Russell Investments (2011 – 2015). Ms. Khwaja‐Dixon is also Secretary of Liberty All‐Star Growth Fund, Inc., and Stadion Investment Trust, and Assistant Secretary of Clough Dividend and Income Fund, Clough Global Opportunities Fund, Clough Global Equity Fund, Clough Funds Trust and ALPS Variable Investment Trust. Ms. Khwaja‐Dixon is deemed an affiliate of the Fund as defined under the 1940 Act.
* The address of each officer, other than Messrs. Parmentier and Haley is: c/o ALPS Fund Services,
Inc., 1290 Broadway, Suite 1100, Denver, CO 80203. The address of Messrs. Parmentier and Haley is c/o ALPS Advisors, Inc., One Financial Center, 15th Floor, Boston, MA 02111.
** Officers are elected annually and each officer will hold such office until a successor has been elected by the Board.

Liberty All-Star® Equity Fund Trustees and Officers (Unaudited)
52 www.all-starfunds.com
OFFICERS (continued)
Name (Year of Birth) and Address*
Position with Fund**
Year First Elected or Appointed to Office
Principal Occupation(s) During Past Five Years
Abigail J. Murray Year of Birth: 1975
Assistant Secretary
2016 Ms. Murray joined ALPS in April 2015. She is currently Vice President and Senior Counsel of ALPS. Prior to joining ALPS, Ms. Murray was an Attorney and Managing Member at Murray & Rouvina PLC from 2014 to 2015 and an Associate with Vedder Price P.C. from 2007 to 2014. Ms. Murray is also the Secretary of ALPS ETF Trust, Clough Global Dividend and Income Fund, Clough Global Equity Fund and Clough Global Opportunities Fund, Clough Funds Trust, RiverNorth Opportunities Fund, Inc., and Assistant Secretary of Liberty All‐Star Growth Fund, Inc. and Principal Real Estate Income Fund. Ms. Murray is deemed an affiliate of the Fund as defined under the 1940 Act.
* The address of each officer, other than Messrs. Parmentier and Haley is: c/o ALPS Fund Services,
Inc., 1290 Broadway, Suite 1100, Denver, CO 80203. The address of Messrs. Parmentier and Haley is c/o ALPS Advisors, Inc., One Financial Center, 15th Floor, Boston, MA 02111.
** Officers are elected annually and each officer will hold such office until a successor has been elected by the Board.

Liberty All-Star® Board Consideration of the Renewal of the Fund Equity Fund Management & Portfolio Management Agreements
(Unaudited)
Annual Report | December 31, 2016 53
The Investment Company Act of 1940 requires that the Board of Trustees (“Board”) of the Liberty All‐Star Equity Fund (“Fund”), including all of the Trustees who are not “interested persons” of the Fund (“Independent Trustees”), annually review the Fund’s investment advisory agreements and consider whether to renew them for an additional year. At its meeting on September 8, 2016, the Board, including a majority of the Independent Trustees, conducted such a review and approved the continuation of the Fund Management Agreement between the Fund and ALPS Advisors, Inc. (“AAI”) and two separate Portfolio Management Agreements among the Fund, AAI and the following independent investment management firms: Pzena Investment Management, LLC (“Pzena”) and TCW Investment Management Company (“TCW”). Pzena and TCW are collectively referred to as “Portfolio Managers,” and each a “Portfolio Manager.”) Prior to the Board’s action, the Independent Trustees met to consider management's recommendations with respect to the renewal of the Fund Management Agreement and the Portfolio Management Agreements (each, an "Agreement" and, collectively, the "Agreements"). In reaching its decision to renew each Agreement, the Board considered the overall fairness of each Agreement and whether each Agreement was in the best interest of the Fund. The Board further considered factors it deemed relevant with respect to the Fund, including (1) the nature, extent and quality of services provided to the Fund by AAI, its affiliates, and each Portfolio Manager; (2) the performance of the Fund and the Portfolio Managers; (3) the level of the Fund's management and portfolio management fees and expense ratios; (4) the costs of the services provided and profits realized by AAI and its affiliates from their relationship with the Fund; (5) the extent to which economies of scale would be realized as the Fund grows and whether fee levels will reflect economies of scale for the benefit of shareholders; (6) the "fall‐out" benefits to AAI, each Portfolio Manager and their respective affiliates (i.e., any direct or indirect benefits to be derived by AAI, each Portfolio Manager and their respective affiliates from their relationships with the Fund); and (7) other general information about AAI and each Portfolio Manager. In considering each Agreement, the Board did not identify any single factor or information as all‐important or controlling and each Independent Trustee may have attributed different weight to each factor. The Board considered these factors in the context of the Fund's multi‐manager methodology, which seeks to achieve more consistent and less volatile performance over the long term than if a single Portfolio Manager was employed. The Fund allocates its portfolio assets among Portfolio Managers recommended by AAI and approved by the Board, currently five for the Fund. The Board considered that each Portfolio Manager employs a different investment style and/or strategy, and from time to time AAI rebalances the Fund's portfolio assets among the Portfolio Managers. The Board also took into account that AAI continuously analyzes and evaluates each Portfolio Manager's investment performance and portfolio composition and, from time to time, recommends changes in the Portfolio Managers. In connection with its deliberations, the Board considered information furnished throughout the year at regular Board meetings, as well as information prepared specifically in connection with the annual renewal and approval process. Information furnished and discussed throughout the year included AAI's analysis of the Fund's investment performance and related financial information for the Fund, presentations given by the Fund's Portfolio Managers, as well as periodic reports on legal, compliance, brokerage commissions and execution and other services provided by AAI, the Portfolio Managers and their affiliates. Information furnished specifically in connection with the renewal process included, among other things, a report of the Fund's investment performance

Liberty All-Star® Board Consideration of the Renewal of the Fund Equity Fund Management & Portfolio Management Agreements
(Unaudited)
54 www.all-starfunds.com
over various time periods as compared to a peer universe and a market index and the Fund's fees and expenses as compared to comparable groups of closed‐end funds and open‐end multi‐managed funds based, in part, on information prepared by AAI and Broadridge Financial Solutions regarding review of the Lipper peer groups. The information provided by AAI generally included information reflecting the Fund's management fees, expense ratios, investment performance and profitability, including AAI's profitability with respect to the Fund. As part of the process to consider the Agreements, legal counsel to the Independent Trustees requested information from AAI and each Portfolio Manager up for renewal. In response to these requests, the Board received reports from AAI and each Portfolio Manager up for renewal that addressed specific factors designed to inform the Independent Trustees consideration of each Agreement. Counsel also provided the Independent Trustees and the Board with a memorandum discussing the legal standards applicable to their consideration of the Agreements. Based on its evaluation of all material factors, the Board unanimously concluded that the terms of each Agreement were reasonable and fair and that the renewal of each Agreement was in the best interests of the Fund and its shareholders. The following is a summary of the Board's considerations. Nature, Extent and Quality of the Services Provided The Board considered the nature, extent and quality of the portfolio manager selection, evaluation and monitoring services provided by AAI, and the portfolio management services provided by each Portfolio Manager up for renewal, in light of the investment objective of the Fund. The Board also considered the nature, extent and quality of the administrative services provided to the Fund by ALPS Fund Services, Inc., an affiliate of AAI. The Board considered the steps that AAI has taken to encourage strong performance, including AAI’s willingness to recommend Portfolio Manager changes when necessary to address performance issues. The Board also took into consideration the changes in Portfolio Managers that occurred in 2015 and 2016. In addition, the Board considered the demonstrated consistency in investment approach of each Portfolio Manager up for renewal. The Board considered that TCW manages a sleeve of the large‐cap growth portion of the Fund’s portfolio and that Pzena manages a large‐cap value portion of the Fund’s portfolio. The Board considered the background and experience of the personnel at AAI responsible for Portfolio Manager selection, evaluation and monitoring for the Fund and the personnel at each Portfolio Manager responsible for managing the Fund's portfolio. The Board also considered the overall financial strength of AAI and each Portfolio Manager, the effect on the Fund of any turnover in personnel at each Portfolio Manager, the insurance maintained by AAI and each Portfolio Manager and the compliance records of AAI and each Portfolio Manager. The Board concluded that the nature, extent and quality of the services provided by AAI and the Portfolio Managers up for renewal were appropriate and consistent with the terms of the Agreements and that the Fund was likely to continue to benefit from services provided under the Agreements. Investment Performance The Board considered the long‐term and short‐term investment performance of the Fund over multiple periods, which generally included annual total returns both on an absolute basis and relative to an appropriate benchmark and/or Lipper peer group. The Board considered the Fund’s performance based on both net asset value (“NAV”) and market price and, in general, considered

Liberty All-Star® Board Consideration of the Renewal of the Fund Equity Fund Management & Portfolio Management Agreements
(Unaudited)
Annual Report | December 31, 2016 55
long‐term performance to be more important in its evaluation than short‐term performance. In addition, the Board considered the performance of the Fund’s Portfolio Managers that were up for renewal, including the performance of other investment companies and accounts managed by the Portfolio Managers and the performance of the allocated portions of the Fund in the context of the Portfolio Manager’s different investment strategies and styles and the contribution of each Portfolio Manager to the Fund’s overall strategy and performance. Among other information, the Board received information regarding the Fund’s return on an absolute and a relative basis, based on NAV and market price, for various periods. In particular the Board received information which indicated that, based on NAV, the Fund underperformed the Lipper Large‐Cap Core Mutual Fund Average (“Lipper Average”) for the one‐, five‐, and ten‐year periods. In addition to the performance of the Fund and each Portfolio Manager’s sleeve of the Fund, the Board considered management’s and the Portfolio Managers’ explanations for the Fund’s performance and the relevant benchmarks and peer groups. The Board accepted the explanations and determined that the performance information and explanations supported the renewal of the Agreements. Costs of the Services Provided to the Fund The Board considered the fees paid by the Fund to AAI and the fees paid by AAI to the Portfolio Managers as well as information provided by AAI about the management fees, overall expense ratio and expense reimbursement by AAI for selected closed‐end funds and multi‐manager open‐end equity funds. The Independent Trustees considered that the Fund’s total expenses were lower than the median of a representative group of closed‐end funds selected by AAI. The Board also considered that the Fund’s management fee was higher than the median for the multi‐manager open‐end equity funds selected by AAI, but the total expense ratio was lower. In addition, the Trustees took into consideration that the Fund’s expenses were affected by shareholder meeting expenses relating to portfolio manager changes. The Board considered that AAI currently does not have any institutional clients with investment objectives and strategies comparable to those of the Fund. The Board considered the breakpoint schedule that lowers the management fee rate paid by the Fund as the Fund's assets increase. The Board also considered the management fees paid to the Portfolio Managers and the fee rates charged by the Portfolio Managers to their other accounts, including institutional accounts. The Board considered that the Portfolio Managers were paid by AAI, not the Fund. The Board also considered the differences in the level of services provided by and the differences in responsibility of AAI and the Portfolio Managers to the Fund and to other accounts. The Board concluded that the management fees payable by the Fund to AAI and the fees payable by AAI to the Portfolio Managers were reasonable in relation to the nature and quality of the services provided, taking into account the management fees paid by comparable closed‐end funds and open‐end equity funds. Profitability and Costs of Services to AAI The Board considered the level of profits realized by AAI in connection with the operation of the Fund. The Board considered the profitability information setting forth recent overall profitability of the Fund to AAI, as well as overall profitability information relating to certain prior calendar

Liberty All-Star® Board Consideration of the Renewal of the Fund Equity Fund Management & Portfolio Management Agreements
(Unaudited)
56 www.all-starfunds.com
years. In reviewing the information, attention was given to the methodology followed in allocating costs to the Fund, it being recognized that allocation methodologies are inherently subjective and various allocation methodologies may be reasonable while producing different results. The Board considered management's ongoing costs and expenditures in providing and improving services for the Fund as well as the ongoing need to meet regulatory and compliance requirements. In addition, the Board considered information prepared by management comparing the profitability of AAI on an overall basis to other investment company managers. The Board also considered the extent to which AAI and its affiliates might derive ancillary benefits from the Fund, noting that an affiliate of AAI serves as the Fund's administrator and receives compensation for acting in this capacity. The Board considered that AAI has advised the Board that it does not regard Portfolio Manager profitability as meaningful to an evaluation of the Portfolio Manager Agreements because the willingness of the Portfolio Managers to serve in such capacity depends primarily upon arm's‐length negotiations with AAI. In addition, AAI has advised the Board that AAI generally is aware of the fees charged by the Portfolio Managers to other clients, and AAI believes that the fees agreed upon with the Portfolio Managers are reasonable in light of the quality of investment advisory services rendered. The Board accepted AAI's explanations in light of the Board's findings as to the reasonableness of the aggregate management fees paid by the Fund due to the fact that each Portfolio Manager's fee is paid by AAI and not the Fund. The Board understood that, as a business matter, AAI was entitled to earn reasonable profits for its services to the Fund. The Board determined that AAI's profitability was reasonable in relation to the services provided and to the costs of providing management services to the Fund and supported the renewal of the Agreements. Extent of Economies of Scale as the Fund Grows and Whether Fee Levels Reflect Economies of Scale The Board considered whether economies of scale are realized by AAI as the Fund grows larger and the extent to which this is reflected in the level of management fees charged. The Board took into consideration the fee breakpoint schedules under the Agreements and concluded that the schedules reflect economies of scale with respect to the selection, evaluation and monitoring of Portfolio Managers and other services performed by AAI and the management of Fund assets by each Portfolio Manager. In this regard, the Board considered that the Fund has reached an asset size at which the Fund and its shareholders are benefiting from reduced management fee rates due to breakpoints in the management fees. Based on the foregoing, the Board concluded that the Fund was realizing economies of scale under the Agreements and management fee schedule, which supports the renewal of the Agreements. Benefits to be Derived from the Relationship with the Fund The Board also considered the potential "fall‐out' benefits that AAI or the Portfolio Managers might receive in connection with their association with the Fund. In its consideration of the Agreements, the Board considered, among other things, that AAI and the Portfolio Managers may derive ancillary benefits from the Fund's operations. For example, under the Agreements, AAI may request that transactions giving rise to brokerage commissions be executed through brokers and dealers that provide brokerage or research services to the Fund or AAI. Each Portfolio Manager, through its position as a Portfolio Manager to the Fund, also may engage in soft dollar

Liberty All-Star® Board Consideration of the Renewal of the Fund Equity Fund Management & Portfolio Management Agreements
(Unaudited)
Annual Report | December 31, 2016 57
transactions. In advance of the meeting, the Board received information regarding each Portfolio Manager's procedures for executing portfolio transactions for the allocated portion of the Fund and each Portfolio Manager's soft dollar policies and procedures. In addition, the Board considered that a Portfolio Manager may be affiliated with registered broker‐dealers who may, from time to time, receive brokerage commissions from the Fund in connection with the purchase and sale of portfolio securities; provided, however, that those transactions, among other things, must be consistent with seeking best execution. The Board determined that the foregoing ancillary benefits were consistent with the renewal of the Agreements. Conclusions Based on its evaluation of all material factors, the Board unanimously concluded that the terms of each Agreement were reasonable and fair and that the renewal of each Agreement was in the best interests of the Fund and its shareholders.

Liberty All-Star® Equity Fund Privacy Policy (Unaudited)
58 www.all-starfunds.com
This Privacy Policy Notice discloses the privacy policies of the Liberty All‐Star® Funds, which are advised by ALPS Advisors, Inc. and serviced by ALPS Fund Services, Inc. (the “Companies”). The Companies and the Funds are referred to herein collectively as “we” or “us.” Protecting Your Privacy is a Top Priority We realize that our ability to offer superior products and services depends on the personal and financial information we collect from you. We value your business and are committed to maintaining your trust. That is why we have made your privacy a top priority. The Information We Have and Where We Get It We collect information about you from a variety of sources, including:
Information we receive from you on applications or other forms, such as your name, address and phone number; your social security number; and your assets, income and other household information;
Information about your other transactions with us, our affiliates or others, such as your account balances and transactions history; and
Information from visitors to our websites provided through online forms, site visitorship data and online information‐collecting devices known as “cookies.”
We do not solicit personal or financial information from minors without written parental consent, nor do we knowingly market products and services to minors. How We Use This Information We may share all of the information we collect with the Companies as part of the ordinary course of providing financial products and services to you, for the purpose of offering you new products and services to address your financial needs, for product development purposes and as otherwise required or permitted by law. To assist in our business dealings with you, we may also share this information with companies (other than the Companies) that perform services, including marketing services, on our behalf (such as vendors that package and mail our investor statements and marketing research firms that enhance our ability to market our products and services). We do not share your information with mailing list or direct marketing companies. Thus, the information you provide to us will not result in unwanted solicitations from third‐party marketers. Finally, we may share this information with other entities outside of the Companies for the following purposes, including among others:
To respond to a subpoena or court order, judicial process or regulatory inquiry;
To report suspicious transactions to government agencies and law enforcement officials;
To protect against fraud;
To provide products and services with the consent or the direction of a customer; or
In connection with the proposed or actual sale or merger of all or a portion of a business or operating unit.

Liberty All-Star® Equity Fund Privacy Policy (Unaudited)
Annual Report | December 31, 2016 59
Except as described above, and except for information we provide to nonaffiliated third parties as otherwise required or permitted by law, we do not share information about you with nonaffiliated third parties. Security of Personal Financial Information We restrict access to information about you to those employees we determine need to know that information to provide products and services to you. We maintain physical, electronic and procedural safeguards to protect this information. If you provide information to us via our websites in order to view your account activity or conduct transactions, we use 128‐bit SSL encryption security with passwords to ensure a safe transmission of data between you and us. Information you provide is stored and transmitted in a secure environment, accessible only by a select group of people who are given a secure passcode to access the information. We continuously assess new technology for protecting information and upgrade our systems where appropriate. If You Have Any Questions or Concerns About This Privacy Policy Notice, Please Write to Us at: ALPS Advisors, Inc. Attn: Compliance Department 1290 Broadway, Suite 1100 Denver, CO 80203 Former Customers If, for whatever reason, our customer relationship with you ends, we will preserve your information as necessary to comply with applicable laws. The measures we take to protect the privacy of customer information, as described in this Privacy Policy Notice, will continue to apply to you. We also will comply with more restrictive state laws to the extent they apply. We reserve the right to change this Privacy Policy Notice, and any of the policies described herein, at any time. The examples contained in this Privacy Policy Notice are illustrations; they are not intended to be exclusive.

Description of Lipper Liberty All-Star® Equity Fund Benchmark and Market Indices
(Unaudited)
60 www.all-starfunds.com
Dow Jones Industrial Average A price‐weighted measure of 30 U.S. blue‐chip companies.
Lipper Large‐Cap Core Mutual Fund Average The average of funds that, by portfolio practice, invest at least 75% of their equity assets in companies with market capitalizations (on a three‐year weighted basis) above Lipper’s U.S. domestic equity large‐cap floor. These funds typically have average characteristics compared to the S&P 500® Index.
NASDAQ Composite Index Measures all NASDAQ domestic and international based common type stocks listed on the NASDAQ Stock Market.
Russell 1000® Growth Index Measures the performance of those Russell 1000®companies with higher price‐to‐book ratios and higher forecasted growth values. The Russell 1000®Index measures the performance of the 1,000 largest companies in the Russell 3000®Index.
Russell 1000® Value Index Measures the performance of those Russell 1000®companies with lower price‐to‐book ratios and lower forecasted growth values. The Russell 1000®Index measures the performance of the 1,000 largest companies in the Russell 3000®Index.
Russell 3000® Index Measures the performance of the 3,000 largest U.S. companies based on total market capitalization, which represents approximately 98% of the investable U.S. equity market.
S&P 500® Index A large‐cap U.S. equities index that includes 500 leading companies and captures approximately 80% coverage of available market capitalization. An investor cannot invest directly in an index.

Annual Certifications — As required, on September 2, 2016, the Fund submitted to the New York Stock Exchange (“NYSE”) the annual certification of the Fund’s Chief Executive Officer certifying that, as of such date, he was not aware of any violation of the NYSE’s Corporate Governance listing standards. The Fund also has included the certifications of the Fund’s Chief Executive Officer and Chief Financial Officer required by Section 302 of the Sarbanes-Oxley Act of 2002 as exhibits to reports filed with the Securities and Exchange Commission (“SEC”) on a quarterly basis on Form N-CSR and Form N-Q.
A description of the Fund’s proxy voting policies and procedures is available (i) on the SEC’s website at www.sec.gov, and (ii) without charge, upon request, by calling 1-800-542-3863. Information regarding how the Fund voted proxies relating to portfolio securities during the 12-month period ended June 30th is available from the SEC’s website at www.sec.gov.
The Fund files a complete schedule of portfolio holdings with the SEC for the first and third quarters of each fiscal year on Form N-Q. The Fund’s Form N-Qs are available on the SEC’s website at www.sec.gov and may be reviewed and copied at the SECs Public Reference Room in Washington, DC. Information on the operation of the Public Reference Room may be obtained by calling 1-800-SEC-0330.
Notice is hereby given in accordance with Section 23(c) of the Investment Company Act of 1940 that the Fund may purchase at market prices from time to time shares of its own common stock in the open market.
This report is transmitted to shareholders of Liberty All-Star®Equity Fund for their information. It is not a prospectus or other document intended for use in the purchase of Fund shares.
LAS000767
INVESTMENT ADVISORALPS Advisors, Inc.1290 Broadway, Suite 1100Denver, Colorado 80203303-623-2577www.all-starfunds.com
INDEPENDENT REGISTERED PUBLIC ACCOUNTING FIRMDeloitte & Touche LLP555 Seventeenth Street, Suite 3600Denver, Colorado 80202
CUSTODIANState Street Bank & Trust CompanyOne Lincoln StreetBoston, Massachusetts 02111
INVESTOR ASSISTANCE, TRANSFER & DIVIDEND DISBURSING AGENT & REGISTRARComputershare Trust Company, N.A.P.O. Box 30170 College Station, Texas 77842-31701-800-LIB-FUND (1-800-542-3863)www.computershare.com
LEGAL COUNSELK&L Gates LLP1601 K Street, NWWashington, DC 20006
TRUSTEESJohn A. Benning*Thomas W. Brock*, ChairmanEdmund J. BurkeGeorge R. Gaspari*Dr. John J. Neuhauser*Richard C. Rantzow*
OFFICERSWilliam R. Parmentier, Jr., PresidentMark T. Haley, CFA, Senior Vice PresidentEdmund J. Burke, Vice PresidentKimberly R. Storms, TreasurerAndrew P. Meloni, Assistant TreasurerSareena Khwaja-Dixon, SecretaryAbigail Murray, Assistant SecretaryErin D. Nelson, Chief Compliance Officer
*Member of Audit Committee

ALPS Advisors, Inc.Investment Advisor1290 Broadway, Suite 1100Denver, CO 80203303-623-2577www.all-starfunds.com
Secondary market support provided to the Fund by ALPS Fund Services, Inc.’s affiliate ALPS Portfolio Solutions Distributor, Inc., a FINRA member.