cibccanadianindexfund interimfinancialreports(unaudited) ·...
TRANSCRIPT

The accompanying notes are an integral part of these financial statements.
CIBC Canadian Index Fund
Interim Financial Reports (unaudited)for the period ended June 30, 2016
† Securities LendingThe tables that follow indicate the Fund had assets involved in securities lending transactionsoutstanding as at June 30, 2016 and December 31, 2015.
Aggregate Valueof Securities
on Loan($000s)
AggregateValue
of Collateralfor Loan
($000s)x
x
June 30, 2016 54,301 56,949x
December 31, 2015 72,255 75,543x
Collateral Type* ($000s)i ii iii iv
xx
June 30, 2016 12,070 44,879 – –x
December 31, 2015 17,121 58,288 – 134x
x
* See note 2j for Collateral Type definitions.
Organization of the Fund (note 1)The Fund was established on July 8, 1996 (Date Established).
Inception Datexx
Class A July 25, 1996x
Premium Class November 23, 2011x
Institutional Class November 29, 2011x
Class O June 1, 2010xx
Statements of Financial Position (unaudited)(in 000s, except per unit amounts)
As at June 30, 2016 and December 31, 2015 (note 1)
June 30, 2016 December 31, 2015x
xxx
Assetsxxx
Current assetsx
Investments (non-derivative financial assets) † (notes2 and 3) $ 514,934 $ 479,421
x
Cash including foreign currency holdings, at fair value 23 41x
Margin 205 76x
Dividends receivable 1,367 1,323x
Receivable for portfolio securities sold – 680x
Receivable for units issued 504 717x
Other receivables – 1x
Derivative assets 38 30xxx
Total Assets 517,071 482,289xxx
Liabilitiesxxx
Current liabilitiesx
Payable for units redeemed 2,669 741x
Other accrued expenses 1 1xxx
Total Liabilities 2,670 742xxx
Net Assets Attributable to Holders ofRedeemable Units (note 5) $ 514,401 $ 481,547
xxx
Net Assets Attributable to Holders ofRedeemable Units per Class
x
Class A $ 415,348 $ 402,436x
Premium Class $ 88,949 $ 66,687x
Institutional Class $ 97 $ 166x
Class O $ 10,007 $ 12,258xxx
Net Assets Attributable to Holders ofRedeemable Units per Unit (note 5)
x
Class A $ 26.28 $ 24.08x
Premium Class $ 12.22 $ 11.15x
Institutional Class $ 12.30 $ 10.99x
Class O $ 12.12 $ 11.04x
1

The accompanying notes are an integral part of these financial statements.
CIBC Canadian Index Fund
Statements of Comprehensive Income (unaudited)(in 000s, except per unit amounts)
For the periods ended June 30, 2016 and 2015 (note 1)
June 30, 2016 June 30, 2015x
x
Net Gain (loss) on Financial Instrumentsx
Interest for distribution purposes $ 215 $ 117x
Dividend revenue 7,513 7,505x
Derivative income (loss) 180 738x
Other changes in fair value of investments andderivatives
x
Net realized gain (loss) on sale of investments andderivatives (3,376) 244
x
Net realized gain (loss) on foreign currency (notes 2fand g) 3 (3)
x
Net change in unrealized appreciation (depreciation)of investments and derivatives 42,117 (3,242)
xxx
Net Gain (loss) on Financial Instruments ± 46,652 5,359xx
x
Other Incomex
Foreign exchange gain (loss) on cash 3 1x
Securities lending revenue ±± 90 60xxx
93 61xx
x
Expenses (note 6)x
Management fees ±±± 2,541 2,860x
Audit fees 6 6x
Custodial fees 31 37x
Independent review committee fees – –x
Legal fees 4 2x
Regulatory fees 30 41x
Transaction costs ±±±± 27 14x
Unitholder reporting costs 545 577x
Withholding taxes (note 7) 1 –x
Other expenses 4 4xxx
3,189 3,541xx
x
Expenses waived/absorbed by the Manager (736) (752)xx
x
2,453 2,789xx
x
Increase (Decrease) in Net Assets Attributable toHolders of Redeemable Units (excludingdistributions) 44,292 2,631
xx
x
Increase (Decrease) in Net Assets Attributable toHolders of Redeemable Units per Class(excluding distributions)
x
Class A $ 35,392 $ 2,028x
Premium Class $ 7,659 $ 469x
Institutional Class $ 19 $ 1x
Class O $ 1,222 $ 133xxx
Average Number of Units Outstanding for theperiod per Class
x
Class A 16,257 16,950x
Premium Class 6,953 5,488x
Institutional Class 14 15x
Class O 1,096 976xxx
Increase (Decrease) in Net Assets Attributable toHolders of Redeemable Units per Unit(excluding distributions)
x
Class A $ 2.18 $ 0.11x
Premium Class $ 1.10 $ 0.09x
Institutional Class $ 1.47 $ 0.10x
Class O $ 1.11 $ 0.14x
x
± Net Gain (Loss) on Financial Instruments(in 000s)
Net gains (losses)
Category June 30, 2016 June 30, 2015x..
Financial assets at FVTPL..
Held for Trading $ 192 $ 181..
Designated at Inception 46,460 5,178......
Total financial assets at FVTPL $ 46,652 $ 5,359..
±± Securities Lending Revenue (note 2j)June 30, 2016 June 30, 2015
(in 000s)
% of Grosssecurities
lending revenue (in 000s)
% of Grosssecurities
lending revenuexx
Gross securities lending revenue $ 170 100.0 $ 204 100.0x
Interest paid on collateral 35 20.6 115 56.4x
Withholding taxes 6 3.5 3 1.5x
Agent fees - Bank of New YorkMellon Corp. (The) 39 23.0 26 12.7
xxx
Securities lending revenue $ 90 52.9 $ 60 29.4xx
±±± Maximum Chargeable Annual Management Fee Rates (note 6)xx
Class A 1.00%x
Premium Class 0.75%x
Institutional Class 0.60%x
Class O 0.00%xx
±±±± Brokerage Commissions and Fees (notes 8 and 9)
2016 2015x
x
Brokerage commissions and other fees ($000s)x
Total Paid 26 14x
Paid to CIBC World Markets Inc. 23 12x
Paid to CIBC World Markets Corp. – –x
Soft dollars ($000s)x
Total Paid – –x
Paid to CIBC World Markets Inc. and CIBC World Markets Corp. – –xx
Administrative and Other Fund Operating Expenses (note 9)
2016 2015x
x
($000s) 425 486xx
Service Provider (note 9)The amounts paid by the Fund (including all applicable taxes) to CIBC Mellon Trust Company forcustodial fees, and to CIBC Mellon Global Securities Services Company (CIBC GSS) for securitieslending, fund accounting and reporting, and portfolio valuation (all net of absorptions) for the periodsended June 30, 2016 and 2015 were as follows:
2016 2015x
x
($000s) 65 60xx
2

The accompanying notes are an integral part of these financial statements.
CIBC Canadian Index Fundx
Statements of Changes in Net Assets Attributable to Holders of Redeemable Units (unaudited)(in 000s)For the periods ended June 30, 2016 and 2015 (note 1)
Class A Units Premium Class Units Institutional Class Units Class O Units
June 30, 2016 June 30, 2015 June 30, 2016 June 30, 2015 June 30, 2016 June 30, 2015 June 30, 2016 June 30, 2015xx.
Increase (Decrease) in Net Assets Attributable toHolders of Redeemable Units (excludingdistributions) $ 35,392 $ 2,028 $ 7,659 $ 469 $ 19 $ 1 $ 1,222 $ 133
xxx.
Distributions Paid or Payable to Holders ofRedeemable Units ‡
x.
From net investment income (8) (7) – – – – – –x.xx
(8) (7) – – – – – –xxx.
Redeemable Unit Transactionsx.
Amount received from the issuance of units 20,899 25,466 28,679 7,944 97 1 917 2,087x.
Amount received from reinvestment of distributions 8 7 – – – – – –x.
Amount paid on redemptions of units (43,379) (38,604) (14,076) (5,416) (185) – (4,390) (3,509)x.xx
(22,472) (13,131) 14,603 2,528 (88) 1 (3,473) (1,422)xxx.
Increase (Decrease) in Net Assets Attributable toHolders of Redeemable Units 12,912 (11,110) 22,262 2,997 (69) 2 (2,251) (1,289)
x.
Net Assets Attributable to Holders of Redeemable Unitsat Beginning of Period 402,436 464,246 66,687 67,660 166 181 12,258 13,015
x.xx
Net Assets Attributable to Holders of Redeemable Unitsat End of Period $ 415,348 $ 453,136 $ 88,949 $ 70,657 $ 97 $ 183 $ 10,007 $ 11,726
xxx.
Redeemable Units Issued and Outstanding (note 5)x.
As at June 30, 2016 and 2015x.
Balance - beginning of period 16,714 17,211 5,979 5,407 15 15 1,110 1,051x.
Redeemable units issued 852 919 2,493 621 8 – 82 164x.xx
17,566 18,130 8,472 6,028 23 15 1,192 1,215x.
Redeemable units redeemed (1,762) (1,392) (1,192) (422) (15) – (366) (277)x.xx
Balance - end of period 15,804 16,738 7,280 5,606 8 15 826 938x
x
‡ Net Capital and Non-Capital Losses (note 7)As at December 2015, the Fund had non-capital and capital losses (in $000s) for income tax purposes available to be carried forward as follows:
Total Net Capital Losses
Total Non-Capital Lossesthat Expire in:
2026 to 2035x..
38,812 –.
.
3

The accompanying notes are an integral part of these financial statements.
CIBC Canadian Index Fundx
x
Statements of Cash Flows (unaudited)(in 000s)For the periods ended June 30, 2016 and 2015 (note 1)
June 30, 2016 June 30, 2015xx.
Cash Flows from Operating Activitiesx.
Increase (Decrease) in Net Assets Attributable to Holders of Redeemable Units from Operations (excluding distributions) $ 44,292 $ 2,631x.
Adjustments for:x.
Foreign exchange loss (gain) on cash (3) (1)x.
Net realized (gain) loss on sale of investments and derivatives 3,376 (244)x.
Net change in unrealized (appreciation) depreciation of investments and derivatives (42,117) 3,242x.
Purchase of investments (81,515) (30,539)x.
Proceeds from the sale of investments 85,415 37,729x.
Margin (129) (38)x.
Dividends receivable (44) 34x.
Other receivables 1 (2)x.
Other liabilities – (1)x.xx
9,276 12,811xxx.
Cash Flows from Financing Activitiesx.
Amount received from the issuance of units 50,805 34,947x.
Amount paid on redemptions of units (60,102) (47,674)x.xx
(9,297) (12,727)xxx.
Increase (Decrease) in Cash during the Period (21) 84xxx.
Foreign exchange loss (gain) on cash 3 1xxx.
Cash (Bank Overdraft) at Beginning of Period 41 88xxx.
Cash (Bank Overdraft) at End of Period $ 23 $ 173x
x.
Interest received $ 215 $ 117x.
Dividends received, net of withholding taxes $ 7,468 $ 7,539
4

The accompanying notes are an integral part of these financial statements.
CIBC Canadian Index Fund
x
Schedule of Investment Portfolio (unaudited) As at June 30, 2016
SecurityNumber
of Shares
AverageCost
($000s)
FairValue
($000s)
% ofNet
Assetsx
CANADIAN EQUITIES..
Consumer Discretionary..
Aimia Inc. 42,718 684 338..
Amaya Inc. 29,652 980 588..
BRP Inc. 9,309 278 192..
Canadian Tire Corp. Ltd., Class 'A' 19,510 704 2,746..
Cineplex Inc. 17,787 325 917..
Cogeco Communications Inc. 6,422 210 435..
Corus Entertainment Inc., Class 'B' 32,870 541 438..
DHX Media Ltd. 35,258 335 233..
Dollarama Inc. 31,229 518 2,817..
Dorel Industries Inc., Class 'B' 7,342 215 252..
EnerCare Inc. 29,125 426 498..
Gildan Activewear Inc. 62,823 465 2,377..
Great Canadian Gaming Corp. 13,188 267 237..
Hudson's Bay Co. 31,167 602 486..
Intertain Group Ltd. (The) 18,603 339 194..
Linamar Corp. 12,800 246 589..
Magna International Inc., Class 'A' 105,708 2,023 4,794..
Martinrea International Inc. 24,231 212 194..
Quebecor Inc., Class 'B' 23,408 335 867..
Restaurant Brands International Inc. 65,494 2,954 3,522..
Shaw Communications Inc., Class 'B' 112,339 1,727 2,786..
Thomson Reuters Corp. 88,627 3,456 4,633..
Uni-Select Inc. 11,017 304 361..
....
18,146 30,494 5.9%..x
Consumer Staples..
Alimentation Couche-Tard Inc., Class 'B' 117,769 460 6,534..
Cott Corp. 34,411 354 621..
Empire Co. Ltd., Class 'A' 45,269 762 869..
George Weston Ltd. 13,279 888 1,485..
Jean Coutu Group (PJC) Inc. (The), Class 'A' 22,832 288 457..
Loblaw Cos. Ltd. 60,569 2,710 4,186..
Maple Leaf Foods Inc. 24,913 366 687..
Metro Inc., Class 'A' 66,383 488 2,988..
North West Co. Inc. (The) 13,604 235 401..
Premium Brands Holdings Corp. 6,982 363 380..
Saputo Inc. 60,602 596 2,325..
....
7,510 20,933 4.1%..x
Energy..
Advantage Oil & Gas Ltd. 51,736 718 374..
AltaGas Ltd. 45,509 1,353 1,429..
ARC Resources Ltd. 98,269 2,434 2,173..
Baytex Energy Corp. 59,105 1,587 443..
Birchcliff Energy Ltd. 29,477 373 203..
Bonavista Energy Corp. 55,864 1,456 184..
Bonterra Energy Corp. 7,252 417 193..
Cameco Corp. 111,018 1,303 1,575..
Canadian Energy Services & Technology Corp. 61,803 368 252..
Canadian Natural Resources Ltd. 307,811 3,594 12,269..
Cenovus Energy Inc. 233,706 3,609 4,176..
Crescent Point Energy Corp. 142,028 4,581 2,899..
Crew Energy Inc. 40,030 539 233..
Enbridge Inc. 260,611 4,223 14,263..
Enbridge Income Fund Holdings Inc. 27,234 740 873..
Encana Corp. 238,377 3,825 2,396..
Enerflex Ltd. 22,214 198 237..
Enerplus Corp. 67,454 2,912 574..
Ensign Energy Services Inc. 34,776 286 252..
Freehold Royalties Ltd. 25,374 417 302..
Gibson Energy Inc. 39,660 852 595..
Gran Tierra Energy Inc. 72,695 517 315..
Husky Energy Inc. 84,607 1,247 1,334..
Imperial Oil Ltd. 71,324 1,429 2,916..
Inter Pipeline Ltd. 94,469 2,369 2,588..
Kelt Exploration Ltd. 41,025 436 194..
Keyera Corp. 51,227 729 2,024..
MEG Energy Corp. 43,547 2,010 295..
Mullen Group Ltd. 29,074 702 410..
Nuvista Energy Ltd. 43,019 325 269..
Parex Resources Inc. 40,061 489 501..
Parkland Fuel Corp. 26,653 414 599..
Pason Systems Inc. 20,078 243 359..
Pembina Pipeline Corp. 108,930 2,399 4,277..
Peyto Exploration & Development Corp. 46,177 1,038 1,601..
PrairieSky Royalty Ltd. 57,170 1,740 1,402..
Precision Drilling Corp. 82,178 1,407 563..
Raging River Exploration Inc. 55,836 394 574..
Secure Energy Services Inc. 39,020 439 345..
Seven Generations Energy Ltd., Class 'A' 49,117 801 1,211..
ShawCor Ltd. 18,119 294 580..
Suncor Energy Inc. 465,921 11,646 16,699
5

The accompanying notes are an integral part of these financial statements.
CIBC Canadian Index Fund
Schedule of Investment Portfolio (unaudited) As at June 30, 2016 (cont'd)
SecurityNumber
of Shares
AverageCost
($000s)
FairValue
($000s)
% ofNet
Assets..
Surge Energy Inc. 62,003 431 158..
TORC Oil & Gas Ltd. 32,439 371 266..
Tourmaline Oil Corp. 54,963 1,816 1,869..
TransCanada Corp. 197,050 6,073 11,520..
Veresen Inc. 86,105 1,150 943..
Vermilion Energy Inc. 32,352 1,234 1,331..
Whitecap Resources Inc. 88,235 998 872..
....
78,926 101,910 19.9%..x
Financials..
Alaris Royalty Corp. 10,182 349 292..
Allied Properties REIT 22,039 473 852..
Artis REIT 39,196 395 529..
Bank of Montreal 180,514 7,050 14,793..
Bank of Nova Scotia 337,359 9,666 21,358..
Boardwalk REIT 10,478 183 603..
Brookfield Asset Management Inc., Class 'A' 243,506 2,756 10,407..
Canadian Apartment Properties REIT 36,238 485 1,202..
Canadian Imperial Bank of Commerce 110,699 5,583 10,742..
Canadian Western Bank 22,968 265 566..
CI Financial Corp. 66,069 1,944 1,781..
Colliers International Group Inc. 9,408 173 415..
Cominar REIT 44,823 719 755..
CREIT 20,512 467 991..
Crombie REIT 21,921 280 337..
Dream Global REIT 30,267 277 284..
Dream Office REIT 30,168 753 561..
Element Financial Corp. 108,323 1,489 1,484..
Fairfax Financial Holdings Ltd. 6,462 1,928 4,496..
First Capital Realty Inc. 32,916 531 729..
FirstService Corp. 8,656 104 511..
Genworth MI Canada Inc. 10,815 276 358..
Granite Real Estate Investment Trust, Stapled Units 13,204 491 512..
Great-West Lifeco Inc. 80,780 1,725 2,753..
H&R REIT 78,954 1,504 1,777..
Home Capital Group Inc. 17,026 243 545..
Horizons S&P/TSX 60 Index ETF 193,873 5,227 5,293..
IGM Financial Inc. 24,361 522 857..
Industrial Alliance Insurance and Financial Services Inc. 28,759 663 1,168..
Intact Financial Corp. 36,833 1,495 3,399..
Laurentian Bank of Canada 8,505 273 410..
Manulife Financial Corp. 553,229 11,990 9,776..
Milestone Apartments REIT 19,645 339 371..
National Bank of Canada 94,648 1,470 4,183..
Northview Apartment REIT 12,993 359 291..
Onex Corp. 22,147 433 1,750..
Power Corp. of Canada 102,280 1,819 2,813..
Power Financial Corp. 68,021 1,218 2,017..
Pure Industrial Real Estate Trust 52,336 250 270..
RioCan REIT 90,836 1,589 2,664..
Royal Bank of Canada 417,437 12,145 31,867..
Smart REIT 32,250 613 1,232..
Sun Life Financial Inc. 171,849 5,201 7,293..
TMX Group Ltd. 6,562 218 353..
Toronto-Dominion Bank (The) 519,966 11,639 28,848..
Tricon Capital Group Inc. 29,591 320 257..
....
97,892 184,745 36.0%..x
Health Care..
Chartwell Retirement Residences 50,978 378 804..
Concordia International Corp. 10,590 831 295..
Extendicare Inc. 24,728 247 201..
ProMetic Life Sciences Inc. 138,800 368 387..
Valeant Pharmaceuticals International Inc. 81,347 4,503 2,119..
....
6,327 3,806 0.7%..x
Industrials..
Aecon Group Inc. 16,079 276 283..
Air Canada 78,102 268 694..
ATS Automation Tooling Systems Inc. 20,970 289 204..
Badger Daylighting Ltd. 10,407 304 234..
Bombardier Inc., Class 'B' 542,069 4,089 1,052..
Boyd Group Income Fund 5,060 299 376..
CAE Inc. 75,533 566 1,179..
Canadian National Railway Co. 218,638 2,996 16,680..
Canadian Pacific Railway Ltd. 39,073 1,628 6,499..
Finning International Inc. 47,152 586 992..
MacDonald, Dettwiler and Associates Ltd. 10,170 348 857..
New Flyer Industries Inc. 11,221 310 451..
Ritchie Bros. Auctioneers Inc. 30,171 636 1,317..
Russel Metals Inc. 17,308 258 396..
SNC-Lavalin Group Inc. 42,034 609 2,281..
Stantec Inc. 31,945 467 1,001..
Toromont Industries Ltd. 20,561 192 774..
Transcontinental Inc., Class 'A' 17,823 227 312
6

The accompanying notes are an integral part of these financial statements.
CIBC Canadian Index Fund
Schedule of Investment Portfolio (unaudited) As at June 30, 2016 (cont'd)
SecurityNumber
of Shares
AverageCost
($000s)
FairValue
($000s)
% ofNet
Assets..
TransForce Inc. 22,931 243 550..
Waste Connections Inc. 49,202 3,665 4,592..
WestJet Airlines Ltd. 34,307 432 723..
Westshore Terminals Investment Corp. 16,576 404 310..
WSP Global Inc. 18,005 525 712..
....
19,617 42,469 8.3%..x
Information Technology..
Avigilon Corp. 9,854 312 131..
BlackBerry Ltd. 128,975 3,485 1,118..
Celestica Inc. 34,946 1,392 420..
CGI Group Inc., Class 'A' 75,711 1,160 4,179..
Computer Modelling Group Ltd. 21,008 260 217..
Constellation Software Inc. 5,231 706 2,616..
Descartes Systems Group Inc. (The) 21,251 316 525..
DH Corp. 29,951 774 962..
Enghouse Systems Ltd. 5,190 263 284..
Kinaxis Inc. 5,632 255 292..
Mitel Networks Corp. 26,189 289 212..
Open Text Corp. 34,024 502 2,599..
Sierra Wireless Inc. 8,950 441 196..
....
10,155 13,751 2.7%..x
Materials..
Agnico Eagle Mines Ltd. 62,127 2,139 4,295..
Agrium Inc. 38,758 1,489 4,530..
Alacer Gold Corp. 81,887 594 252..
Alamos Gold Inc., Class 'A' 74,190 1,014 824..
B2Gold Corp. 260,503 769 844..
Barrick Gold Corp. 326,836 9,700 9,014..
Canfor Corp. 20,861 250 272..
CCL Industries Inc., Class 'B' 7,620 159 1,713..
Centerra Gold Inc. 45,481 482 350..
Chemtrade Logistics Income Fund 19,373 410 346..
Detour Gold Corp. 48,552 736 1,569..
Dominion Diamond Corp. 23,937 318 274..
Eldorado Gold Corp. 200,999 1,679 1,168..
Endeavour Mining Corp. 16,332 335 358..
First Majestic Silver Corp. 43,870 473 770..
First Quantum Minerals Ltd. 193,354 2,178 1,754..
Franco-Nevada Corp. 49,861 1,907 4,898..
Goldcorp Inc. 233,434 5,983 5,770..
Guyana Goldfields Inc. 43,256 407 401..
Hudbay Minerals Inc. 65,982 786 407..
IAMGOLD Corp. 113,863 920 609..
Interfor Corp. 17,483 284 194..
Intertape Polymer Group Inc. 14,619 216 308..
Kinross Gold Corp. 348,982 5,177 2,213..
Kirkland Lake Gold Inc. 25,653 283 273..
Labrador Iron Ore Royalty Corp. 17,952 278 223..
Lucara Diamond Corp. 84,389 315 294..
Lundin Mining Corp. 175,612 1,655 766..
MAG Silver Corp. 19,060 319 310..
Methanex Corp. 25,188 386 947..
Nevsun Resource Ltd. 56,054 272 212..
New Gold Inc. 143,119 811 809..
Norbord Inc. 11,281 355 285..
NovaGold Resources Inc. 65,494 423 518..
OceanaGold Corp. 169,948 536 838..
Osisko Gold Royalties Ltd. 29,823 472 504..
Pan American Silver Corp. 42,638 761 907..
Potash Corp. of Saskatchewan Inc. 235,377 4,281 4,943..
Pretium Resources Inc. 37,383 448 541..
SEMAFO Inc. 90,684 436 562..
Silver Standard Resources Inc. 33,207 620 557..
Silver Wheaton Corp. 123,418 1,863 3,753..
Stella-Jones Inc. 11,831 520 569..
Tahoe Resources Inc. 84,087 1,348 1,627..
Teck Resources Ltd., Class 'B' 130,401 2,073 2,218..
Torex Gold Resources Inc. 220,738 391 510..
Turquoise Hill Resources Ltd. 276,577 1,549 1,209..
West Fraser Timber Co. Ltd. 18,732 398 708..
Western Forest Products Inc. 110,920 268 226..
Winpak Ltd. 8,569 409 407..
Yamana Gold Inc. 265,691 2,783 1,785..
....
62,658 69,634 13.5%..x
Telecommunication Services..
BCE Inc. 243,725 7,955 14,902..
Manitoba Telecom Services Inc. 20,860 704 791..
Rogers Communications Inc., Class 'B' 100,439 1,794 5,253..
TELUS Corp. 166,391 2,795 6,922..
....
13,248 27,868 5.4%..
7

The accompanying notes are an integral part of these financial statements.
CIBC Canadian Index Fund
Schedule of Investment Portfolio (unaudited) As at June 30, 2016 (cont'd)
SecurityNumber
of Shares
AverageCost
($000s)
FairValue
($000s)
% ofNet
Assetsx
Utilities..
Algonquin Power & Utilities Corp. 58,130 430 691..
ATCO Ltd., Class 'I' 20,966 279 950..
Brookfield Renewable Partners L.P. 28,930 938 1,113..
Canadian Utilities Ltd., Class 'A' 32,937 475 1,233..
Capital Power Corp. 24,539 604 473..
Emera Inc. 41,562 823 2,021..
Fortis Inc. 79,408 1,944 3,468..
Hydro One Ltd. 46,730 1,145 1,213..
Innergex Renewable Energy Inc. 26,652 279 386..
Just Energy Group Inc. 27,250 459 214..
Northland Power Inc. 31,059 450 689..
Superior Plus Corp. 39,741 684 424..
TransAlta Corp. 80,755 1,508 543..
TransAlta Renewables Inc. 25,147 300 336..
....
10,318 13,754 2.7%..
..
TOTAL CANADIAN EQUITIES 324,797 509,364 99.2%..x
INTERNATIONAL EQUITIES..
Bermuda..
Brookfield Business Partners L.P. 4,977 173 122..
....
173 122 0.0%..x
United States..
Brookfield Property Partners L.P. 60,174 1,134 1,748..
....
1,134 1,748 0.3%..
..
TOTAL INTERNATIONAL EQUITIES 1,307 1,870 0.3%..
..
TOTAL EQUITIES 326,104 511,234 99.5%..
..
TOTAL INVESTMENTS BEFORE SHORT-TERM INVESTMENTS 326,104 511,234 99.5%..
SecurityCoupon
Rate (%)Maturity
Date Additional Details Par Value
AverageCost
($000s)
FairValue
($000s)
% ofNet
Assetsx
SHORT-TERM INVESTMENTS (note 11)..
Royal Bank of Canada 0.45% 2016/07/04 Term Deposit 3,700,000 3,700 3,700..
..
..
TOTAL SHORT-TERM INVESTMENTS 3,700 3,700 0.7%..
..
Less: Transaction costs included in average cost (145).
..
..
TOTAL INVESTMENTS 329,659 514,934 100.2%..
..
Margin 205 0.0%..
Derivative assets 38 0.0%..
Other Assets, less Liabilities (776) (0.2)%..
..
..
TOTAL NET ASSETS ATTRIBUTABLE TO HOLDERS OFREDEEMABLE UNITS 514,401 100.0%
.
...
x
x
Schedule of Derivative Assets and Liabilities - Futures Contracts (note 11)
ContractedValue ($) Name of Future Expiry Date
Number ofContracts Currency
ContractedPrice
FairValue ($)
Unrealized Gain(Loss) ($000s)
x..
3,388,296 S&P/TSX 60 Index Standard September 2016 21 CAD 806.74 3,426,780 38......
3,388,296 Derivative Assets and Liabilities - Futures 3,426,780 38..
..
As at June 30, 2016, $204,714 cash was deposited as margin for the futures contracts.
8

The accompanying notes are an integral part of these financial statements.
CIBC Canadian Index Fund
Supplemental Schedule to Schedule of Investment Portfolio (unaudited)
Offsetting Arrangements (note 2d)
The Fund may enter into various master netting arrangements or other similar agreements that do not meet the criteria for offsetting in the Statements of Financial Position but still allowfor the related amounts to be set off in certain circumstances, such as bankruptcy or the termination of the contracts.
As at June 30, 2016 and December 31, 2015, the Fund did not enter into any arrangements whereby the financial instruments were eligible for offset.
Interests in Underlying Funds (note 4)
As at June 30, 2016 and December 31, 2015, the Fund had no investments in underlying funds where the ownership exceeded 20% of each underlying fund.
9
The accompanying notes are an integral part of these financial statements.
CIBC Canadian Index Fund
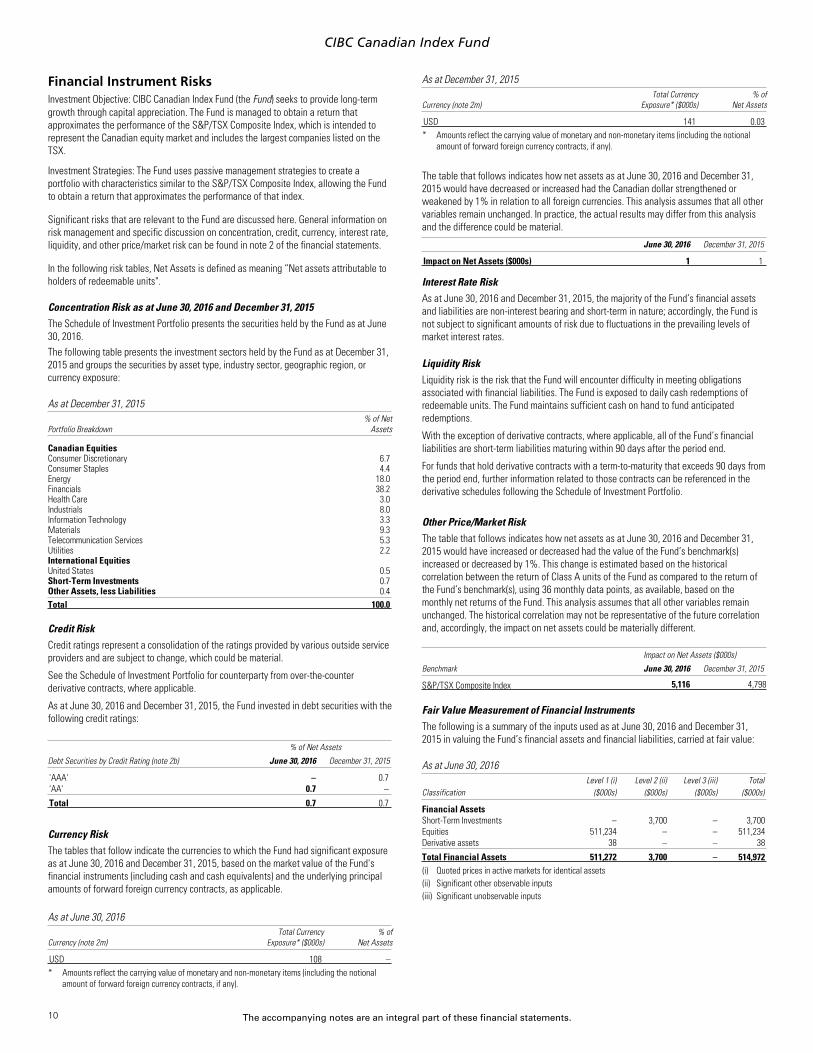
Financial Instrument RisksInvestment Objective: CIBC Canadian Index Fund (the Fund) seeks to provide long-termgrowth through capital appreciation. The Fund is managed to obtain a return thatapproximates the performance of the S&P/TSX Composite Index, which is intended torepresent the Canadian equity market and includes the largest companies listed on theTSX.
Investment Strategies: The Fund uses passive management strategies to create aportfolio with characteristics similar to the S&P/TSX Composite Index, allowing the Fundto obtain a return that approximates the performance of that index.
Significant risks that are relevant to the Fund are discussed here. General information onrisk management and specific discussion on concentration, credit, currency, interest rate,liquidity, and other price/market risk can be found in note 2 of the financial statements.
In the following risk tables, Net Assets is defined as meaning “Net assets attributable toholders of redeemable units".
Concentration Risk as at June 30, 2016 and December 31, 2015The Schedule of Investment Portfolio presents the securities held by the Fund as at June30, 2016.The following table presents the investment sectors held by the Fund as at December 31,2015 and groups the securities by asset type, industry sector, geographic region, orcurrency exposure:
As at December 31, 2015
Portfolio Breakdown% of Net
Assetsx
x
Canadian Equitiesx
Consumer Discretionary 6.7x
Consumer Staples 4.4x
Energy 18.0x
Financials 38.2x
Health Care 3.0x
Industrials 8.0x
Information Technology 3.3x
Materials 9.3x
Telecommunication Services 5.3x
Utilities 2.2x
International Equitiesx
United States 0.5x
Short-Term Investments 0.7x
Other Assets, less Liabilities 0.4xxx
Total 100.0xx
Credit RiskCredit ratings represent a consolidation of the ratings provided by various outside serviceproviders and are subject to change, which could be material.
See the Schedule of Investment Portfolio for counterparty from over-the-counterderivative contracts, where applicable.
As at June 30, 2016 and December 31, 2015, the Fund invested in debt securities with thefollowing credit ratings:
.
% of Net Assets
Debt Securities by Credit Rating (note 2b) June 30, 2016 December 31, 2015x
x
'AAA' – 0.7x
'AA' 0.7 –xxx
Total 0.7 0.7xx
Currency RiskThe tables that follow indicate the currencies to which the Fund had significant exposureas at June 30, 2016 and December 31, 2015, based on the market value of the Fund'sfinancial instruments (including cash and cash equivalents) and the underlying principalamounts of forward foreign currency contracts, as applicable.
As at June 30, 2016
Currency (note 2m)Total Currency
Exposure* ($000s)% of
Net Assetsx
x
USD 108 –xxx
* Amounts reflect the carrying value of monetary and non-monetary items (including the notionalamount of forward foreign currency contracts, if any).
As at December 31, 2015
Currency (note 2m)Total Currency
Exposure* ($000s)% of
Net Assetsx
x
USD 141 0.03xxx
* Amounts reflect the carrying value of monetary and non-monetary items (including the notionalamount of forward foreign currency contracts, if any).
The table that follows indicates how net assets as at June 30, 2016 and December 31,2015 would have decreased or increased had the Canadian dollar strengthened orweakened by 1% in relation to all foreign currencies. This analysis assumes that all othervariables remain unchanged. In practice, the actual results may differ from this analysisand the difference could be material.
June 30, 2016 December 31, 2015x
x
Impact on Net Assets ($000s) 1 1xx
Interest Rate RiskAs at June 30, 2016 and December 31, 2015, the majority of the Fund’s financial assetsand liabilities are non-interest bearing and short-term in nature; accordingly, the Fund isnot subject to significant amounts of risk due to fluctuations in the prevailing levels ofmarket interest rates.
Liquidity RiskLiquidity risk is the risk that the Fund will encounter difficulty in meeting obligationsassociated with financial liabilities. The Fund is exposed to daily cash redemptions ofredeemable units. The Fund maintains sufficient cash on hand to fund anticipatedredemptions.
With the exception of derivative contracts, where applicable, all of the Fund’s financialliabilities are short-term liabilities maturing within 90 days after the period end.
For funds that hold derivative contracts with a term-to-maturity that exceeds 90 days fromthe period end, further information related to those contracts can be referenced in thederivative schedules following the Schedule of Investment Portfolio.
Other Price/Market RiskThe table that follows indicates how net assets as at June 30, 2016 and December 31,2015 would have increased or decreased had the value of the Fund’s benchmark(s)increased or decreased by 1%. This change is estimated based on the historicalcorrelation between the return of Class A units of the Fund as compared to the return ofthe Fund’s benchmark(s), using 36 monthly data points, as available, based on themonthly net returns of the Fund. This analysis assumes that all other variables remainunchanged. The historical correlation may not be representative of the future correlationand, accordingly, the impact on net assets could be materially different..
Impact on Net Assets ($000s)
Benchmark June 30, 2016 December 31, 2015x
x
S&P/TSX Composite Index 5,116 4,798xx
Fair Value Measurement of Financial InstrumentsThe following is a summary of the inputs used as at June 30, 2016 and December 31,2015 in valuing the Fund’s financial assets and financial liabilities, carried at fair value:
As at June 30, 2016Level 1 (i) Level 2 (ii) Level 3 (iii) Total
Classification ($000s) ($000s) ($000s) ($000s)xx
Financial Assetsx
Short-Term Investments – 3,700 – 3,700x
Equities 511,234 – – 511,234x
Derivative assets 38 – – 38xxx
Total Financial Assets 511,272 3,700 – 514,972xx
x
(i) Quoted prices in active markets for identical assetsx
(ii) Significant other observable inputsx
(iii) Significant unobservable inputs
10

The accompanying notes are an integral part of these financial statements.
CIBC Canadian Index Fund
As at December 31, 2015Level 1 (i) Level 2 (ii) Level 3 (iii) Total
Classification ($000s) ($000s) ($000s) ($000s)xx
Financial Assetsx
Short-Term Investments – 3,173 – 3,173x
Equities 476,248 – – 476,248x
Derivative assets 30 – – 30xxx
Total Financial Assets 476,278 3,173 – 479,451xx
x
(i) Quoted prices in active markets for identical assetsx
(ii) Significant other observable inputsx
(iii) Significant unobservable inputs
Transfer of assets between Level 1 and Level 2Financial assets and liabilities transferred from Level 1 to Level 2 are the result ofsecurities no longer being traded in an active market.
For the periods ended June 30, 2016 and December 31, 2015, there were no transfers offinancial assets and liabilities from Level 1 to Level 2.
Financial assets and liabilities transferred from Level 2 to Level 1 are the result ofsecurities now being traded in an active market.
For the periods ended June 30, 2016 and December 31, 2015, there were no transfers offinancial assets and liabilities from Level 2 to Level 1.
Reconciliation of financial asset and liability movement – Level 3The Fund did not hold any significant positions of Level 3 investments at the beginning of,during, or at the end of either reporting period.
11

Notes to Financial Statements (unaudited)
x
As at and for the periods as disclosed in the financial statements (see note 1)
1. Organization of the Funds and Financial Reporting Periods
Each of the CIBC Mutual Funds and CIBC Family of Managed Portfolios (individually, a Fund, and collectively, the Funds) is a mutual fund trust organized under the laws of Ontario and governed by a declaration of trust(Declaration of Trust). The address of the Funds’ registered office is 18 York Street, Suite 1300, Toronto, Ontario.
CIBC Securities Inc. is the principal distributor, Canadian Imperial Bank of Commerce (CIBC) is the manager (the Manager), and CIBC Trust Corporation is the trustee (the Trustee) of the Funds.
Each Fund is permitted to have an unlimited number of classes of units and may issue an unlimited number of units of each class. In the future, the offering of any classes of units of a Fund may be terminated oradditional classes of units may be offered. The following table indicates the classes of units offered for sale by each of the Funds, as at the date of these financial statements:x
Funds Class A Class T4 Class T6 Class T8 Premium Class Institutional Class Class Ox..
CIBC Canadian T-Bill Fund ü ü..
CIBC Money Market Fund ü ü ü..
CIBC U.S. Dollar Money Market Fund ü ü ü..
CIBC Short-Term Income Fund ü ü ü..
CIBC Canadian Bond Fund ü ü ü..
CIBC Monthly Income Fund ü ü..
CIBC Global Bond Fund ü ü..
CIBC Global Monthly Income Fund ü ü..
CIBC Balanced Fund ü..
CIBC Dividend Income Fund ü ü..
CIBC Dividend Growth Fund ü ü..
CIBC Canadian Equity Fund ü ü..
CIBC Canadian Equity Value Fund ü ü..
CIBC Canadian Small-Cap Fund ü..
CIBC U.S. Equity Fund ü ü..
CIBC U.S. Small Companies Fund ü ü..
CIBC Global Equity Fund ü..
CIBC International Equity Fund ü ü..
CIBC European Equity Fund ü ü..
CIBC Emerging Markets Fund ü ü..
CIBC Asia Pacific Fund ü ü..
CIBC Latin American Fund ü..
CIBC International Small Companies Fund ü..
CIBC Financial Companies Fund ü..
CIBC Canadian Resources Fund ü ü..
CIBC Energy Fund ü ü..
CIBC Canadian Real Estate Fund ü ü..
CIBC Precious Metals Fund ü ü..
CIBC Global Technology Fund ü..
CIBC Canadian Short-Term Bond Index Fund ü ü ü ü..
CIBC Canadian Bond Index Fund ü ü ü ü..
CIBC Global Bond Index Fund ü ü ü..
CIBC Balanced Index Fund ü ü ü..
CIBC Canadian Index Fund ü ü ü ü..
CIBC U.S. Broad Market Index Fund ü ü ü ü..
CIBC U.S. Index Fund ü ü ü ü..
CIBC International Index Fund ü ü ü ü..
CIBC European Index Fund ü ü ü..
CIBC Emerging Markets Index Fund ü ü ü ü..
CIBC Asia Pacific Index Fund ü ü ü ü..
CIBC Nasdaq Index Fund ü ü ü..
CIBC Managed Income Portfolio ü ü ü..
CIBC Managed Income Plus Portfolio ü ü ü..
CIBC Managed Balanced Portfolio ü ü ü ü..
CIBC Managed Monthly Income Balanced Portfolio ü ü ü..
CIBC Managed Balanced Growth Portfolio ü ü ü ü..
CIBC Managed Growth Portfolio ü ü ü ü..
CIBC Managed Aggressive Growth Portfolio ü ü ü ü..
CIBC U.S. Dollar Managed Income Portfolio ü ü ü..
CIBC U.S. Dollar Managed Balanced Portfolio ü ü ü ü..
CIBC U.S. Dollar Managed Growth Portfolio ü ü ü üx
12

p / 2 Notes to Financial Statements (unaudited)
Each class of units may charge a different management fee. Operating expenses can be either common or class-specific. Class-specific expenses are allocated on a class-by-class basis. As a result, a separate netasset value per unit is calculated for each class of units.
Class A units are available to all investors on a no-load basis with a minimum investment of $500. Investors may have to pay a short-term trading fee if applicable.
Class T4, T6, and T8 units have the same characteristics as Class A units, except that they each intend to pay a fixed distribution amount per unit, which also results in a separate net asset value per unit for each class,and may have different minimum investment requirements.
Premium Class units are available to investors on a no-load basis with a minimum investment of $100,000 for CIBC Canadian T-Bill Fund and CIBC Money Market Fund, US$100,000 for CIBC U.S. Dollar Money MarketFund, $50,000 for CIBC Short-Term Income Fund, CIBC Canadian Bond Fund, CIBC Canadian Short-Term Bond Index Fund, CIBC Canadian Bond Index Fund, CIBC Global Bond Index Fund, CIBC Balanced Index Fund,CIBC Canadian Index Fund, CIBC U.S. Broad Market Index Fund, CIBC U.S. Index Fund, CIBC International Index Fund, CIBC European Index Fund, CIBC Emerging Markets Index Fund, CIBC Asia Pacific Index Fund, andCIBC Nasdaq Index Fund, and US$50,000 for the U.S. dollar purchase option of CIBC U.S. Broad Market Index Fund and CIBC Nasdaq Index Fund. Management fees charged in respect of Premium Class units are lowerthan those charged in respect of Class A units.
Institutional Class units are available to investors with a minimum investment of $50,000. Institutional Class units are available to investors participating in programs that do not require the payment of sales charges byinvestors and do not require the payment of service or trailing commissions to dealers, and others who pay an annual fee to their dealer. For these investors, we “unbundle” the typical distribution costs and charge alower management fee. Potential investors include institutional clients, clients of “fee-for-service” investment advisors, dealer sponsored “wrap accounts”, and others who pay an annual fee to their dealer instead oftransactional sales charges and where the dealer does not receive service fees or trailing commissions from the Manager.
Class O units are only available to certain investors who have been approved by and have entered into a Class O unit account agreement with the Manager or whose dealer or discretionary manager offers separatelymanaged accounts or similar programs and has entered into a Class O unit account agreement with the Manager. These investors are typically financial services companies, including the Manager, that use Class Ounits of a fund to facilitate offering other products to investors. No management fees or operating expenses are charged to a fund in respect of Class O units; instead, a negotiated management fee is charged by theManager directly to, or as directed by, Class O unitholders or dealers and discretionary managers on behalf of unitholders.
The date upon which each Fund was established by Declaration of Trust (Date Established) and the date upon which each class of units of each Fund was first sold to the public (Inception Date) are reported in footnoteOrganization of the Fund on the Statements of Financial Position.
The Schedule of Investment Portfolio of each of the Funds is as at June 30, 2016. The Statements of Financial Position of each of the Funds are as at June 30, 2016 and December 31, 2015. The Statements ofComprehensive Income, Statements of Changes in Net Assets Attributable to Holders of Redeemable Units, and the Statements of Cash Flows of each of the Funds are for the six-month periods ended June 30, 2016and 2015, except for Funds or classes established during either period, in which case the information presented is from the Date Established or the Inception Date to June 30, 2016 or 2015.
These financial statements were approved for issuance by the Manager on August 18, 2016.
2. Summary of Significant Accounting Policies
These financial statements have been prepared in accordance with International Accounting Standards Interim Financial Reporting (IAS 34) as published by the International Accounting Standards Board (IASB). TheFunds adopted IFRS in 2014 as required by Canadian securities legislation and the Canadian Accounting Standards Board. Previously, the Funds prepared their financial statements in accordance with Canadiangenerally accepted accounting principles (GAAP) as defined in Part V of the CPA Canada Handbook.
The financial statements have been prepared on a going concern basis using the historical cost convention. However, each Fund is an investment entity and primarily all financial assets and financial liabilities aremeasured at fair value in accordance with IFRS. Accordingly, the Funds’ accounting policies for measuring the fair value of investments and derivatives are consistent with those used in measuring the Net Asset Valuefor transactions with unitholders. In applying IFRS, these financial statements include estimates and assumptions made by management that affect the reported amounts of assets, liabilities, income, and expensesduring the reporting periods. However, existing circumstances and assumptions may change due to market changes or circumstances arising beyond the control of the Funds. Such changes are reflected in theassumptions when they occur.
These financial statements have been presented in Canadian dollars, which is the Funds’ functional currency (unless otherwise noted).
a) Financial Instruments
Classification and recognition of financial instruments
In accordance with IAS 39 Financial Instruments: Recognition and Measurement, financial assets and financial liabilities are classified at initial recognition into the following categories:
Financial assets and liabilities at fair value through profit or loss (“FVTPL”)
This category is sub-divided into:
l Financial instruments classified as Held For Trading: Financial assets and liabilities are classified as Held For Trading if they are acquired for the purpose of selling and/or repurchasing in the near term, andare acquired principally for the purpose of generating a profit from short-term fluctuations in price. Derivatives and securities sold short held by the Funds are classified as Held For Trading and do not meetthe definition of effective hedging instruments as defined by IAS 39.
l Financial instruments designated as FVTPL through inception: All investments held by the Funds, excluding those classified as Held For Trading (discussed above), are designated as fair value through profitor loss upon initial recognition. These financial assets are designated upon initial recognition on the basis that they are part of a group of financial assets that are managed and have their performanceevaluated on a fair value basis, in accordance with risk management and investment strategies of the Funds, as set out in the Funds’ prospectus.
Loans and receivables
The Funds include in this category receivable balances relating to portfolio investments and other short-term receivables such as receivable for units issued.
Other financial liabilities
This category includes all financial liabilities, other than those classified as fair value through profit or loss. The Funds include in this category amounts relating to payables for portfolio securities purchased and otheraccrued liabilities such as payable for units redeemed and distributions payable to holders of redeemable units.
All Funds have contractual obligations to distribute cash to the unitholders. As a result, each Fund's obligation for net assets attributable to holders of redeemable units represents a financial liability and is presentedat the redemption amount.
b) Risk Management
The Funds’ overall risk management approach includes formal guidelines that govern the extent of exposure to various types of risk, including diversification within asset classes and limits on the exposure to individualinvestments and counterparties. In addition, derivative financial instruments may be used to manage certain risk exposures. The Manager also has various internal controls to oversee the Funds’ investment activities,including monitoring compliance with the investment objectives and strategies, internal guidelines, and securities regulations. Please refer to each Fund’s Supplemental Schedule to Schedule of Investment Portfoliofor specific risk disclosures.
Fair value of financial instruments by using valuation techniques
Financial instruments are valued at their fair value which is defined as the price that would be received to sell an asset or paid to transfer a liability in an orderly transaction between market participants at themeasurement date. Refer to notes 3a to 3f for valuation of each specific type of financial instrument held by the Funds. The fair value of financial assets and liabilities traded in active markets are based on quotedmarket prices at the close of trading on the reporting date. The Funds use the last traded market price for both financial assets and financial liabilities where the last traded price falls within that day’s bid-ask spread.In circumstances where the last traded price is not within the bid-ask spread, the Manager determines the price that is most representative of fair value based on the specific facts and circumstances.
For financial assets and financial liabilities that are not traded in an active market, fair value is determined using valuation techniques.
The Funds classify fair value measurement within a hierarchy which gives the highest priority to unadjusted quoted prices in active markets for identical assets or liabilities (Level 1) and the lowest priority tounobservable inputs (Level 3). The three levels of the fair value hierarchy are:
Level 1: Quoted prices (unadjusted) in active markets for identical assets or liabilities that the entity can access at the measurement date;
13

Notes to Financial Statements (unaudited) p / 3
Level 2: Inputs other than quoted prices included within Level 1 that are observable for the asset or liability, either directly or indirectly; and
Level 3: Inputs are unobservable for the asset or liability.
If inputs are used to measure an asset’s or liability’s fair value, the classification within the hierarchy is based on the lowest level input that is significant to the fair value measurement. Each Fund’s fair value hierarchyclassification of its assets and liabilities is included in the Supplemental Schedule to Schedule of Investment Portfolio.
The carrying values of all non-investment assets and liabilities approximate their fair values due to their short-term nature. Fair values are classified as Level 1 when the related security or derivative is actively tradedand a quoted price is available. If an instrument classified as Level 1 subsequently ceases to be actively traded, it is transferred out of Level 1. In such cases, instruments are reclassified into Level 2, unless themeasurement of its fair value requires the use of significant unobservable inputs, in which case it is classified as Level 3.
The Manager is responsible for performing the fair value measurements included in the financial statements of a Fund, including the Level 3 measurements. The Manager obtains pricing from third-party pricingvendors and the pricing is reviewed daily. At each financial reporting date, the Manager reviews and approves all Level 3 fair value measurements. The Funds also have a Valuation Committee which meets quarterly toperform detailed reviews of the valuations of investments held by the Funds, which includes discussion on Level 3 measurements.
Credit risk
Credit risk is the risk that a counterparty to a financial instrument, such as a fixed income security or a derivative contract, will fail to discharge an obligation or commitment that it has entered into with the Funds. Thevalue of fixed income securities and derivatives as presented on the Schedule of Investment Portfolio includes consideration of the creditworthiness of the issuer and, accordingly, represents the maximum credit riskexposure of the Funds. Certain Funds may invest in short-term fixed income securities issued or guaranteed primarily by the Government of Canada or, any Canadian provincial or Canadian municipal government,obligations of Canadian chartered banks or trust companies, and commercial paper with approved credit ratings. The risk of default on these short-term fixed income securities is considered low and these securitiesprimarily have credit ratings of ‘A-1 (Low)’ or higher (as rated by S&P Global Ratings, a division of S&P Global, or equivalent rating from another rating service).
The bond ratings noted in the Funds’ ‘Financial Instruments Risk’ under sub-section ‘Credit Risk’ represent ratings collected and disseminated by recognized third party vendors. These ratings utilized by the Manager,while obtained from vendors skilled and recognized for bond rating services, may not be the same as those used directly by the portfolio advisor or portfolio sub-advisors. Ratings used by the portfolio advisor orportfolio sub-advisors could be higher or lower than those used for risk disclosure in the financial statements in compliance with their investment policy guidelines.
The Funds may engage in securities lending transactions. The credit risk related to securities lending transactions is limited by the fact that the value of cash or securities held as collateral by the Funds in connectionwith these transactions is at least 102% of the fair value of the securities loaned. The collateral and loaned securities are marked to market on each business day. Further information regarding the collateral andsecurities on loan can be found in the footnotes to the Statements of Financial Position and in note 2j.
Currency risk
Currency risk is the risk that the value of an investment will fluctuate due to changes in foreign exchange rates. Mutual funds may invest in securities denominated or traded in currencies other than the Funds’reporting currency.
Interest rate risk
Prices of fixed income securities generally increase when interest rates decline and decrease when interest rates rise. This risk is known as interest rate risk. Prices of longer-term fixed income securities will generallyfluctuate more in response to interest rate changes than would shorter-term securities. Due to the nature of short-term fixed income securities with a remaining term-to-maturity of less than one year, theseinvestments are not generally exposed to a significant risk that their value will fluctuate in response to changes in the prevailing levels of market interest rates.
Liquidity risk
The Funds are exposed to daily cash redemptions of redeemable units. Generally, the Funds retain sufficient cash and cash equivalent positions to maintain adequate liquidity. However, liquidity risk also involves theability to sell an asset for cash easily and at a fair price. Some securities are illiquid due to legal restrictions on their resale, the nature of the investment, or simply a lack of interested buyers for a particular security orsecurity type. Certain securities may become less liquid due to changes in market conditions, such as interest rate changes or market volatility, which could impair the ability of a Fund to sell such securities quickly or ata fair price. Difficulty in selling securities could result in a loss or a lower return for a Fund.
Other price/market risk
Other price/market risk is the risk that the value of investments will fluctuate as a result of changes in market conditions. Several factors can influence market trends, such as economic developments, changes ininterest rates, political changes, and catastrophic events. All investments are exposed to other price/market risk.
c) Investment Transactions, Income Recognition, and Recognition of Realized and Unrealized Gains and Losses
i) Interest for distribution purposes shown on the Statements of Comprehensive Income represents the coupon interest received by the Fund accounted for on an accrual basis. The Funds do not amortizepremiums paid or discounts received on the purchase of fixed income securities except for zero coupon bonds, which are amortized on a straight-line basis.
ii) Dividend income is recorded on the ex-dividend date.
iii) Securities that are exchange-traded are recorded at fair value established by the last traded market price when that price falls within that day’s bid-ask spread. Debt securities are recorded at fair value,established by the last traded price on the over-the-counter market (OTC) when that price falls within that day’s bid-ask spread. In circumstances where the last traded price is not within the bid-ask spread,the Manager determines the price that is most representative of fair value based on the specific facts and circumstances. Unlisted securities are recorded at fair value using fair valuation techniquesestablished by the Manager in establishing a fair value.
iv) Realized gains and losses on investments and unrealized appreciation or depreciation of investments are calculated using the average cost, excluding transaction costs, of the related investments.
v) Investment income is the sum of income paid to the fund that is generated from a fund’s investment fund holdings.
vi) Other income is the sum of income, excluding transaction costs, other than that which is separately classified on the Statements of Comprehensive Income.
d) Offsetting
Financial assets and liabilities are offset and the net amount reported in the Statements of Financial Position, if there is a currently enforceable legal right to offset the recognized amounts and there is an intention tosettle on a net basis, or to realize the asset and settle the liability simultaneously.
Where applicable, additional information can be found in the table Offsetting Arrangements as part of the Supplemental Schedule to Schedule of Investment Portfolio. This supplemental schedule discloses the OTCderivatives which are subject to offsetting.
e) Portfolio Securities
The cost of securities of a Fund is determined in the following manner: securities are purchased and sold at a market-traded price to arrive at a value for the position traded. The total purchased value represents thetotal cost of the security to the Fund. When additional units of the same security are purchased, the cost of those additional units is added to the total security cost. When units of the same security are sold, theproportionate cost of the units of the security sold is deducted from the total security cost. If there is a return of capital paid by a security, the amount of this return of capital is deducted from the total security cost.This method of tracking security cost is known as “average cost” and the current total for any one security is referred to as the “adjusted cost base” or “ACB” of the security. Transaction costs incurred in portfoliotransactions are excluded from the average cost of investments and are recognized immediately in Increase (Decrease) in Net Assets Attributable to Holders of Redeemable Units and are presented as a separateexpense item in the financial statements.
The difference between the fair value of securities and their average cost, excluding transaction costs, represents the unrealized appreciation (depreciation) in value of the portfolio investments. The applicable periodchange in unrealized appreciation (depreciation) of investments is included on the Statements of Comprehensive Income.
Short-term investments on the Schedule of Investment Portfolio are presented at their amortized cost which approximates the fair value. Accrued interest for bonds is disclosed separately on the Statements ofFinancial Position.
14

p / 4 Notes to Financial Statements (unaudited)
f) Foreign Exchange
The value of investments and other assets and liabilities denominated in foreign currencies is translated into Canadian dollars, which is the Funds’ functional and presentation currency (except for CIBC U.S. DollarMoney Market Fund, CIBC U.S. Dollar Managed Income Portfolio, CIBC U.S. Dollar Managed Balanced Portfolio, and CIBC U.S. Dollar Managed Growth Portfolio, which are valued in U.S. dollars) at the current ratesprevailing on each valuation date.
Purchases and sales of investments, income, and expenses are translated into Canadian dollars, which is the Funds’ functional and presentation currency (with the exception of the above-mentioned Funds which arevalued in U.S. dollars) at the foreign exchange rates prevailing on the dates of such transactions. Foreign currency translation gains (losses) on investments and income transactions are included in Net realized gain(loss) on foreign currency and in Income, respectively, on the Statements of Comprehensive Income.
g) Forward Foreign Currency Contracts
The Funds may enter into forward foreign currency contracts for either hedging or non-hedging purposes where such activity is consistent with their investment objectives and as permitted by the Canadian securitiesregulatory authorities.
Changes in the fair value of forward foreign currency contracts are included in derivative assets or derivative liabilities on the Statements of Financial Position, and are recorded as an Increase (decrease) in unrealizedappreciation (depreciation) of investments and derivatives during the applicable period on the Statements of Comprehensive Income.
The gain or loss arising from the difference between the value of the original forward foreign currency contract and the value of such contract at close or delivery is realized and recorded as Net realized gain (loss) onforeign currency for Funds that use the forward foreign currency contracts for hedging, or as Derivative income (loss) from forward foreign currency contracts for Funds that do not use the forward foreign currencycontracts for hedging.
h) Futures Contracts
The margin deposits with brokers relating to futures contracts are included in Margin on the Statements of Financial Position. Any change in the margin requirement is settled daily and included in Receivable forportfolio securities sold or Payable for portfolio securities purchased on the Statements of Financial Position.
Any difference between the settlement value at the close of business on each valuation date and the settlement value at the close of business on the previous valuation date is recorded as Derivative income (loss)from futures contracts on the Statements of Comprehensive Income.
i) Options
Premiums paid for purchased call and put options are included in derivative assets and subsequently measured at fair value on the Statements of Financial Position. When a purchased option expires, the Fund willrealize a loss in the amount of the cost of the option. For a closing transaction, the Fund will realize a gain or loss depending on whether the proceeds are greater or less than the premium paid at the time of purchase.When a purchased call option is exercised, the cost of the security purchased is increased by the premium paid at the time of purchase.
Premiums received from writing options are included in derivative liabilities and subsequently measured at fair value on the Statements of Financial Position as initial reductions in the value of investments. Premiumsreceived from writing options that expire unexercised are recorded as realized gains and reported as Net gain (loss) on sale of investments and derivatives on the Statements of Comprehensive Income. For a closingtransaction, if the cost of closing the transaction exceeds the premium received, the Fund will record a realized loss or, if the premium received at the time the option was written is greater than the amount paid, theFund will record a realized gain and is reported as Net gain (loss) on sale of investments and derivatives. If a written put option is exercised, the cost for the security delivered is reduced by the premiums received at thetime the option was written.
j) Securities Lending
A Fund may lend portfolio securities in order to earn additional revenue, which is disclosed on the Statements of Comprehensive Income. The loaned assets of any one Fund are not permitted to exceed 50% of thefair value of the assets of that Fund (excluding collateral debt for the loaned securities). The minimum allowable collateral is 102% of the fair value of the loaned securities as per the requirements of NationalInstrument 81-102 – Investment Funds. Collateral can consist of the following:
i) Cash.
ii) Qualified securities.
iii) Irrevocable letters of credit issued by a Canadian financial institution that is not the counterparty, or an affiliate counterparty, of the fund in the transaction, if evidences of indebtedness of the Canadianfinancial institution that are rated as short-term debt by an approved credit rating organization have an approved credit rating.
iv) Securities that are immediately convertible into securities of the same issuer, class, or type, and the same term, as the securities loaned.
The fair value of the loaned securities is determined on the close of any valuation date and any additional required collateral is delivered to the Fund on the next business day. The securities on loan continue to beincluded on the Schedule of Investment Portfolio and are included in the total value on the Statements of Financial Position in Investments (non-derivative financial assets) at fair value. Where applicable, a Fund’ssecurities lending transactions are reported in footnote Securities Lending on the Statements of Financial Position.
Changes to National Instrument 81-106 – Investment Fund Continuous Disclosure took effect for Funds with a financial year beginning on or after January 1, 2016. Those changes now require a reconciliation of thegross amount generated from the securities lending transactions of the Funds to the revenue from securities lending disclosed in the Funds’ Statements of Comprehensive Income. The gross amount generated fromsecurities lending includes interest paid on collateral, withholding taxes deducted, the fees paid to the Funds’ lending agent and the securities lending revenue received by the Funds. Where applicable, thereconciliation can be found in the footnotes to the Funds’ Statements of Comprehensive Income.
k) Multi-Class Structured Funds
The realized and unrealized capital gains or losses, income, and common expenses (other than class-specific operating expenses and management fees) of the Fund are allocated on each valuation date to theunitholders in proportion to the respective prior day’s net asset value, which includes unitholder trades dated for that day, of each class of units at the date on which the allocation is made. All class-specific operatingexpenses and management fees do not require allocation. All class-specific operating expenses are paid by the Manager and are collected from the Funds on a recoverable basis.
l) Loans and Receivables, Other Assets and Liabilities
Loans and Receivables, other assets and liabilities (other than those classified as FVTPL) are recorded at cost, which approximates their fair value, with the exception of net assets attributable to holders of redeemableunits which are presented at the redemption value.x
x..x
m) Legend of Abbreviations
The following is a list of abbreviations (foreign currency translation and others) that may be used on the Schedule of Investment Portfolio:
x
Currency Abbreviations
x..
AED – United Arab Emirates Dirham KRW – South Korean Won..
ARS – Argentine Peso MAD – Morocco Dirham..
AUD – Australian Dollar MXN – Mexican Peso..
BRL – Brazilian Real MYR – Malaysian Ringgit..
CAD – Canadian Dollar NOK – Norwegian Krone..
CHF – Swiss Franc NZD – New Zealand Dollar..
CLP – Chilean Peso PEN – Peruvian Nuevo Sol..
CNY – Chinese Renminbi PHP – Philippine Peso
15

Notes to Financial Statements (unaudited) p / 5
..
COP – Colombian Peso PKR – Pakistan Rupee..
CZK – Czech Koruna PLN – Polish Zloty..
DKK – Danish Krone QAR – Qatari Riyal..
EGP – Egyptian Pound RUB – Russian Ruble..
EUR – Euro SEK – Swedish Krona..
GBP – British Pound SGD – Singapore Dollar..
HKD – Hong Kong Dollar THB – Thai Baht..
HUF – Hungarian Forint TRY – New Turkish Lira..
IDR – Indonesian Rupiah TWD – Taiwan Dollar..
ILS – Israeli Shekel USD – United States Dollar..
INR – Indian Rupee VEF – Venezuelan Bolivar Fuerte..
JOD – Jordanian Dinars ZAR – South African Rand..
JPY – Japanese Yen..
Other Abbreviations
..
ADR – American Depositary Receipt..
CVO – Contingent Value Obligations..
ETF – Exchange-Traded Fund..
GDR – Global Depositary Receipt Securities..
NVDR – Non-Voting Depositary Receiptxxxxxxxx
n) Standards issued but not yet effective
Standards issued but not yet effective up to the date of issuance of the Funds’ financial statements are listed below. The Funds intend to adopt applicable standards when they become effective.
IFRS 9, Financial Instruments - Classification and Measurement
In July 2014, the IASB issued the final version of IFRS 9, Financial Instruments which reflects all phases of the financial instruments project and replaces IAS 39, Financial Instruments: Recognition and Measurementand all previous versions of IFRS 9. The standard introduces new requirements for classification and measurement, impairment, and hedge accounting. IFRS 9 is effective for annual periods beginning on or afterJanuary 1, 2018, with early application permitted. The Funds are in the process of assessing the impact of IFRS 9.
o) Increase (decrease) in Net Assets Attributable to Holders of Redeemable Units per Unit
Increase (decrease) in net assets attributable to holders of redeemable units per unit of each class is calculated by dividing the Increase (decrease) in net assets attributable to holders of redeemable units (excludingdistributions), as reported on the Statements of Comprehensive Income, by the weighted average number of units in issue during the related period.
3. Valuation of Investments
The valuation date (Valuation Date) for a Fund is any day when the Manager’s head office is open for business. The Manager may, at its discretion, establish other Valuation Dates.
The value of the investments or assets of a Fund is determined as follows:
a) Cash and Other Assets
Cash, accounts receivable, dividends receivable, distributions receivable, and interest receivable are valued at fair value or at their recorded cost, plus or minus any foreign exchange between recognition of the assetby the Fund and the current Valuation Date, which approximates fair value.
b) Bonds, Debentures, and Other Debt Obligations
Bonds, debentures, and other debt obligations are fair valued using the last traded price provided by a recognized vendor upon the close of trading on a Valuation Date, whereby the last traded price falls within thatday’s bid-ask spread. If the last traded price does not fall within that day’s bid-ask spread, the Manager will then determine the price that is most representative of fair value based on the specific facts andcircumstances.
c) Listed Securities, Unlisted Securities, and Fair Value Pricing of Foreign Securities
Any security that is listed or traded on a securities exchange is fair valued using the last traded price, whereby the last traded price falls within that day’s bid-ask spread or, if there is no traded price on that exchangeor the last traded price does not fall within that day’s bid-ask spread and in the case of securities traded on an OTC market, at the fair value as determined by the Manager as an appropriate basis for valuation. In suchsituations, a fair value will be determined by the Manager to establish current value. If any securities are inter-listed or traded on more than one exchange or market, the Manager will use the principal exchange ormarket for the fair value of such securities.
Units of each mutual fund in which a Fund invests will be valued at fair value using the most recent net asset value quoted by the Trustee or Manager of the mutual fund on the Valuation Date.
Unlisted securities are fair valued using the last traded price quoted by a recognized dealer, or the Manager may determine a price that more accurately reflects the fair value of these securities if the Manager feelsthe last traded price does not reflect fair value.
Fair value pricing is designed to avoid stale prices and to provide a more accurate fair value, and may assist in the deterrence of harmful short-term or excessive trading in the Fund. When securities listed or traded onmarkets or exchanges that close prior to North or South American markets or exchanges are valued by the Manager at their fair market value, instead of using quoted or published prices, the prices of such securitiesused to calculate the Fund’s net assets or net asset value may differ from quoted or published prices of such securities.
d) Derivatives
Long positions in options, debt-like securities, and listed warrants are fair valued using the last traded price as established on either their principal trading exchange or by a recognized dealer in such securities,whereby the last traded price falls within that day’s bid-ask spread and the credit rating of each counterparty (as rated by S&P Global Ratings, a division of S&P Global) meets or exceeds the minimum approved creditrating.
When any option is written by any Fund, the premium received by the Fund will be reflected as a liability that will be valued at an amount equal to the current fair value of the option that would have the effect ofclosing the position. Any difference resulting from revaluation shall be treated as an unrealized gain or loss on investment; the liability shall be deducted in arriving at the net assets attributable to holders ofredeemable units of the Fund. The securities that are the subject of a written option, if any, will be valued in the manner described above for listed securities.
Futures contracts, forward contracts, or swaps will be valued at fair value of the gain or loss, if any, that would be realized on the Valuation Date if the position in the futures contracts, forward contracts, or swapswere to be closed out.
Margin paid or deposited in respect of futures contracts and forward contracts will be reflected as an account receivable and margin consisting of assets other than cash will be noted as held as collateral.
Other derivatives and margin are fair valued in a manner that the Manager determines to represent their fair value.
e) Restricted Securities
Restricted securities purchased by any Fund will be fair valued in a manner that the Manager determines to represent their fair value.
16

p / 6 Notes to Financial Statements (unaudited)
f) Other Investments
All other investments of the Funds will be fair valued in accordance with the laws of the Canadian securities regulatory authorities where applicable.
The value of any security or other property of a Fund for which a market quotation is not readily available or where the market quotations do not properly reflect the fair value of such securities will be determined bythe Manager by valuing the securities at their fair value. In such situations, fair value will be determined using fair valuation techniques that most accurately reflect their fair value as established by the Manager.
4. Interest in Underlying Funds
The Funds may invest in other investment funds (Underlying Funds). Each Underlying Fund invests in a portfolio of assets to generate returns in the form of investment income and capital appreciation for itsunitholders. Each Underlying Fund finances its operations primarily through the issuance of redeemable units, which are puttable at the unitholder’s option and entitle the unitholder to a proportionate share of theUnderlying Fund’s net assets. The funds’ interests in Underlying Funds held in the form of redeemable units, are reported in their Schedule of Investments at fair value, which represents the Funds’ maximum exposureon those investments. The Funds' interests in Underlying Funds as at the prior year period ends are presented in the Financial Instruments Risks - Concentration Risk section in the Supplemental Schedule to Scheduleof Investment Portfolio. Distributions earned from Underlying Funds are included in “Investment Income” in the Statements of Comprehensive Income. The total realized and change in unrealized gains (losses) arisingfrom Underlying Funds are also included in the Statement of Comprehensive Income. The Funds do not provide any additional significant financial or other support to Underlying Funds.
Where applicable, the table “Interests in Underlying Funds” presented as part of the Supplemental Schedule to Schedule of Investment Portfolio, provides additional information on the Funds’ investments inUnderlying Funds where the ownership interest exceeds 20% of each Underlying Fund.
5. Redeemable Units Issued and Outstanding
Each Fund is permitted to have an unlimited number of classes of units and may issue an unlimited number of units of each class. The outstanding units represent the net assets attributable to holders of redeemableunits of a Fund. Each unit has no par value and the value of each unit is the net asset value as determined on each valuation date. Settlement of the cost for units issued is completed as per security regulations inplace at the time of issue. Distributions made by a Fund and reinvested by unitholders in additional units also constitute issued redeemable units of a Fund.
Units are redeemed at the net assets attributable to holders of a redeemable unit per unit of a Fund. A right to redeem units of a Fund may be suspended with the approval of the Canadian securities regulatoryauthorities or when normal trading is suspended on a stock, options, or futures exchange within Canada or outside of Canada on which securities or derivatives that make up more than 50% of the value or underlyingexposure of the total assets of a Fund, not including any liabilities of a Fund, are traded and when those securities or derivatives are not traded on any other exchange that represents a reasonably practical alternativefor a Fund. The Fund is not subject to any externally imposed capital requirements.
The capital received by a Fund is utilized within the respective investment mandate of the Fund. This includes the ability to make liquidity available to satisfy unitholder unit redemption requirements upon aunitholder’s request.
Changes in issued and outstanding units for the six-month periods ended June 30, 2016 and 2015 can be found on the Statements of Changes in Net Assets Attributable to Holders of Redeemable Units.x
6. Management Fees and Operating Expenses
Management fees are based on the net asset value of the Funds and are calculated daily. Management fees are paid to the Manager in consideration for providing, or arranging for the provision of, management,distribution, and portfolio advisory services. The maximum annual management fee expressed as a percentage of the average net asset value for each class of units of the Fund is reported in footnote MaximumChargeable Annual Management Fee Rates on the Statements of Comprehensive Income. For Class O units, management fees are negotiated with and paid by, or as directed by, unitholders, or dealers anddiscretionary managers on behalf of unitholders.
In addition to the management fees, the Funds are responsible for all expenses relating to the operation and conduct of the business of the Funds, including interest, operating, and administrative costs (other thanadvertising and promotional expenses, which are the responsibility of the Manager), brokerage fees, commissions, spreads, regulatory fees, Independent Review Committee fees, taxes, audit and legal fees andexpenses, safekeeping and custodial fees, investor servicing costs, and costs of unitholder reports, prospectuses, and other reports. All class-specific operating expenses are paid by the Manager and recovered fromthe Funds. The Funds do not pay a fee to the Trustee.
The Manager may recover from a Fund less than the actual class-specific operating expenses paid by the Manager, resulting in the Manager absorbing class-specific expenses. The Manager may also charge to a Fundless than the maximum management fee in footnote Maximum Chargeable Annual Management Fee Rates on the Statements of Comprehensive Income, resulting in the Manager waiving management fees.
At its sole discretion, the Manager may stop absorbing class-specific operating expenses and/or waiving management fees at any time. Class-specific operating expenses absorbed and/or management fees waivedby the Manager are disclosed on the Statements of Comprehensive Income.
In some cases, the Manager may charge management fees to a Fund that are less than the management fees the Manager is entitled to charge in respect of certain investors in a Fund. The difference in the amount ofthe management fees will be paid out by the Fund to the applicable investors as a distribution of additional units of the Fund (Management Fee Distributions). Management Fee Distributions are negotiable betweenthe Manager and the investor and are dependent primarily on the size of the investor’s investment in the Fund. Management Fee Distributions paid to qualified investors do not adversely impact the Fund or any of theFund’s other investors. The Manager may increase or decrease the amount of Management Fee Distributions to certain investors from time to time.
Where a Fund invests in units of an Underlying fund, the Fund does not pay duplicate management fees on the portion of its assets that it invests in units of the Underlying Fund. In addition, the Fund will not payduplicate sales fees or redemption fees with respect to the purchase or redemption by it of units of the Underlying Fund. Some of the Underlying Funds held by the Funds may offer Management Fee Distributions. SuchManagement Fee Distributions of an Underlying Fund will be paid out as required for taxable distribution payments by a Fund. The manager of an Underlying Fund may, in some cases, waive a portion of an UnderlyingFund’s management fee and/or absorb a portion of an Underlying Fund’s operating expenses.
7. Income Taxes and Withholding Taxes
The Funds qualify as mutual fund trusts under the Income Tax Act (Canada). No income tax is payable by the Funds on net income and/or net realized capital gains that are distributed to unitholders. In addition, incometaxes payable on undistributed net realized capital gains are refundable on a formula basis when units of the Funds are redeemed. Sufficient net income and realized capital gains of the Funds have been, or will be,distributed to the unitholders such that no tax is payable by the Funds and, accordingly, no provision for income taxes has been made in the financial statements. Occasionally, a Fund may pay distributions in excess ofthe net income and net realized capital gains of the Fund. This excess distribution is called a return of capital and is non-taxable to the unitholder. However, a return of capital reduces the average cost of theunitholder’s units for tax purposes, which may result in a capital gain to the unitholder to the extent the average cost becomes less than zero.
CIBC U.S. Dollar Money Market Fund, CIBC U.S. Dollar Managed Income Portfolio, CIBC U.S. Dollar Managed Balanced Portfolio, and CIBC U.S. Dollar Managed Growth Portfolio may realize net foreign currency gainsand losses on the translation of their net realized capital gains to Canadian dollars for tax purposes. These gains will be distributed to investors annually unless these Funds elect to retain them, with the result that thetax would be payable by the Funds.
Non-capital losses that arose in 2006 and thereafter are available to be carried forward for 20 years.
Capital losses for income tax purposes may be carried forward indefinitely and applied against capital gains realized in future years. Where applicable, a Fund’s net capital and non-capital losses are reported infootnote Net Capital and Non-Capital Losses on the Statements of Changes in Net Assets Attributable to Holders of Redeemable Units.
The Funds have a taxation year-end of December 15 (except for CIBC Canadian T-Bill Fund, CIBC Money Market Fund, CIBC U.S. Dollar Money Market Fund which have a taxation year-end of December 31).
The Funds currently incur withholding taxes imposed by certain countries on investment income and capital gains. Such income and gains are recorded on a gross basis and the related withholding taxes are shown asa separate expense in the Statements of Comprehensive Income.
8. Brokerage Commissions and Fees
The total commissions paid by the Funds to brokers in connection with portfolio transactions are reported in footnote Brokerage Commissions and Fees on the Statements of Comprehensive Income of each Fund whereapplicable. In allocating brokerage business, consideration may be given by the portfolio sub-advisors of the Funds to dealers that furnish research, statistical analysis, and other securities to portfolio sub-advisors thatprocess trades through such dealers (referred to in the industry as “soft dollar” arrangements). These goods and services are paid for with a portion of brokerage commissions and assist the portfolio sub-advisors withtheir investment decision-making services to the Funds. The total soft dollar payments paid by the Funds to brokers are reported in footnote Brokerage Commissions and Fees on the Statements of ComprehensiveIncome of each Fund. In addition, the Manager may enter into commission recapture arrangements with certain dealers with respect to the Fund. Any commission recaptured will be paid to the applicable Fund.
Fixed income and certain other securities are transacted in an OTC market, where participants are dealing as principals. Such securities are generally traded on a net basis and do not normally involve brokeragecommissions, but will typically include a “spread” (being the difference between the bid and the offer prices on the security of the applicable marketplace).
17

Notes to Financial Statements (unaudited) p / 7
Spreads associated with fixed income securities trading and certain other securities are not ascertainable and, for that reason, are not included in the dollar amounts. In addition, the soft dollar amounts only includethe value of research and other services supplied by a third party to CIBC Asset Management Inc. (CAMI or the Portfolio Advisor) and any portfolio sub-advisors, as the value of the services supplied to the PortfolioAdvisor and any portfolio sub-advisors by the dealer is not ascertainable. When these services benefit more than one Fund, the costs are allocated among the Funds based on transaction activity or some other fairbasis as determined by the Portfolio Advisor and any portfolio sub-advisors.x
9. Related Party Transactions
CIBC and its affiliates have the following roles and responsibilities with respect to the Funds and receive the fees described below in connection with their roles and responsibilities. The Funds may hold securities ofCIBC. CIBC and its affiliates may also be involved in underwriting or lending to issuers of securities that may be held by the Funds, have purchased or sold securities from or to the Funds while acting as principal, havepurchased or sold securities from or to the Funds on behalf of another investment fund managed by CIBC or an affiliate, and also may have been involved as a counterparty to derivative transactions. Management feespayable and other accrued expenses on the Statements of Financial Position are amounts generally payable to a related party of the Fund.
Manager, Trustee, Portfolio Advisor, and certain Portfolio Sub-Advisors of the Funds
CIBC is the Manager, CIBC Trust Corporation is the Trustee, and CAMI is the Portfolio Advisor of each of the Funds. American Century Investment Management, Inc. (ACI) is a portfolio sub-advisor to certain Funds.Although not an affiliate, CIBC had previously owned a 41% equity interest in ACI. On December 21, 2015, CIBC announced that it entered into a definitive agreement to sell its minority position in ACI. The sale wascompleted on May 19, 2016.
The Manager also arranges for fund administrative services (other than advertising and promotional, which are the responsibility of the Manager), legal, investor servicing, and costs of unitholder reports,prospectuses, and other reports. The Manager is the registrar and transfer agent for the Funds and provides, or arranges for the provision of, all other administrative services required by the Funds. The dollar amount(including all applicable taxes) of all fund administrative expenses (net of absorptions) that the Manager recovers from a Fund is reported in footnote Administrative and Other Fund Operating Expenses on theStatements of Comprehensive Income.
Brokerage Arrangements and Soft Dollars
The Portfolio Advisor generally delegates trading and execution authority to the portfolio sub-advisors.
The Portfolio Advisor and portfolio sub-advisors make decisions, including the selection of markets and dealers and the negotiation of commissions, with respect to the purchase and sale of portfolio securities, certainderivative products (including futures and forwards), and the execution of portfolio transactions. Brokerage business may be allocated by the Portfolio Advisor or portfolio sub-advisors to CIBC World Markets Inc. andCIBC World Markets Corp., each a subsidiary of CIBC. The total commissions paid to related brokers in connection with portfolio transactions are reported in footnote Brokerage Commissions and Fees on theStatements of Comprehensive Income of each Fund.
CIBC World Markets Inc. and CIBC World Markets Corp. may also earn spreads on the sale of fixed income and other securities, and certain derivative products (including futures and forwards) to the Funds. Dealers,including CIBC World Markets Inc. and CIBC World Markets Corp., may furnish goods and services, other than order execution, to the Portfolio Advisor and portfolio sub-advisors that process trades through them(referred to in the industry as “soft dollar” arrangements). These goods and services are paid for with a portion of brokerage commissions and assist the Portfolio Advisor and portfolio sub-advisors with theirinvestment decision-making services to the Fund or relate directly to executing portfolio transactions on behalf of the Fund. As per terms of the portfolio sub-advisory agreements, such soft dollar arrangements are incompliance with applicable laws. Custodial fees directly related to portfolio transactions incurred by a Fund, otherwise payable by the Fund, shall be paid by CAMI, and/or dealer(s) directed by CAMI, up to the amountof the credits generated under soft dollar arrangements from trading on behalf of the Fund, or a portion of the Fund, during that month. The total soft dollar payments paid by the Fund to related brokers are reported infootnote Brokerage Commissions and Fees on the Statements of Comprehensive Income of each Fund. In addition, the Manager may enter into commission recapture arrangements with certain dealers with respect tothe Funds. Any commission recaptured will be paid to the relevant Fund.
Custodian
The custodian holds all cash and securities for the Funds and ensures that those assets are kept separate from any other cash or securities that the custodian might be holding. The custodian also provides otherservices to the Funds including record keeping and processing of foreign exchange transactions. CIBC Mellon Trust Company is the custodian of the Funds (the Custodian). The Custodian may hire sub-custodians forthe Funds. The fees and spreads for services of the Custodian directly related to the execution of portfolio transactions by a Fund, or a portion of a Fund, are paid by CAMI and/or dealer(s) directed by CAMI up to theamount of the credits generated under soft dollar arrangements from trading on behalf of the Funds during that month. All other fees for the services of the Custodian are paid by the Manager, and charged to theFunds on a recoverable basis. CIBC owns a 50% interest in CIBC Mellon Trust Company.
Service Provider
CIBC Mellon Global Securities Services Company (CIBC GSS) provides certain services to the Funds, including securities lending, fund accounting and reporting, and portfolio valuation. Such servicing fees are paid bythe Manager and charged to the Funds on a recoverable basis. CIBC indirectly owns a 50% interest in CIBC GSS.
The dollar amount paid by the Funds (including all applicable taxes) to CIBC Mellon Trust Company for custodial fees (net of absorptions) and to CIBC GSS for securities lending, fund accounting and reporting, andportfolio valuation (net of absorptions) for the six-month periods ended June 30, 2016 and 2015 is reported in footnote Service Provider on the Statements of Comprehensive Income.
10. Hedging
Certain foreign currency denominated positions have been hedged, or partially hedged, by forward foreign currency contracts as part of the investment strategies of certain Funds. These hedges are indicated by ahedging reference number on the Schedule of Investment Portfolio and a corresponding hedging reference number on the Schedule of Derivative Assets and Liabilities - Forward Foreign Currency Contracts for thoseFunds.
11. Collateral on Specified Derivatives
Short-term investments may be used as collateral for futures contracts outstanding with brokers.x
18

This page is intentionally left blank.
"S&P®", and "S&P/TSX Composite" are trademarks of "S&P Global Ratings", a division of S&P Global, and have been licensed for use by CIBC. "TSX" is a trademark of TSX, Inc. andhas been licensed for use by S&P Global Ratings. The Fund is not sponsored, endorsed, sold, or promoted by S&P Global Ratings or TSX, Inc. and neither S&P Global Ratings nor TSX,Inc. make any representation regarding the advisability of investing in the Fund.

CIBC Mutual FundsCIBC Family of Managed Portfolios
CIBC
18 York Street, Suite 1300Toronto, Ontario
M5J 2T8
CIBC Securities Inc.1-800-465-3863
Websitewww.cibc.com/mutualfunds
CIBC Securities Inc. is a wholly-owned subsidiary of CIBC and is the principal distributor of the CIBC Mutual Funds and the CIBC Family of Managed Portfolios. CIBC Family ofManaged Portfolios are mutual funds that primarily invest in other CIBC Mutual Funds. To obtain a copy of the simplified prospectus, call CIBC Securities Inc. at 1-800-465-3863 or askyour advisor.