libbey inc. investor presentation · b2b channel: diverse opportunities for growth whirlpool...
TRANSCRIPT
Libbey Inc.
Investor Presentation
January 2018

Management
1
Jim BurmeisterVice President, Chief Financial Officer
Joe HuhnVice President, Financial Planning & Analysis
and Investor Relations

Material provided in this presentation include forward-lookingstatements about Libbey Inc. These statements are subject torisks and uncertainties, including market conditions, competitive pressures, the value of the U.S. dollar and significant cost increases.
Please refer to the Company’s Form 10-K for
fiscal year-end December 31, 2016, filed on
March 3, 2017, for further information.
Safe Harbor Statement
2

3
Libbey at a Glance
A global tableware leader selling manufactured and sourced glass, ceramic and metal tableware. #1 in the Americas!(1) and #2 global in glass beverageware(1)
Customers include some of North America’s largest foodservice distributors and most recognized retail names
$793.4 million of net sales in 2016 sold to Foodservice, Retail and B2B channels globally
Selling > 1.2 billion tableware pieces annually
Our products are central to lifestyle and celebrations at home, in restaurants and in over 100 countries around the world
NYSE American: LBY
(1) Management estimate

Established Industry Leadership and Global Presence
4
Million Total Square Feet
7Warehousing /
DCs
8Manufacturing
Facilities
6
West Chicago, IL
Toledo, OH
Shreveport, LA
Monterrey, Mexico
Laredo, TX
Marinha Grande, Portugal
Leerdam, Netherlands Langfang,
China
Manufacturing / Warehousing / Distribution CentersWarehousing / Distribution Centers
Headquarters
(1) In the first quarter of 2017, net sales and related costs for certain countries were reclassified between segments to align with changes in business unit responsibilities. Accordingly, 2016 segment results have been reclassified to conform with the revised structure. The revised 2016 segment results do not affect any previously reported consolidated financial results.
(2) Represents percentage of Segment EBIT only
Other
1%
EMEA
2%
Latin America
14%
U.S. & Canada
83%
Latin America
19%
EMEA
16%
Other
4%
U.S. & Canada
61%
2016 Net Sales by Segment (1)
2016 Segment EBIT(1)(2)
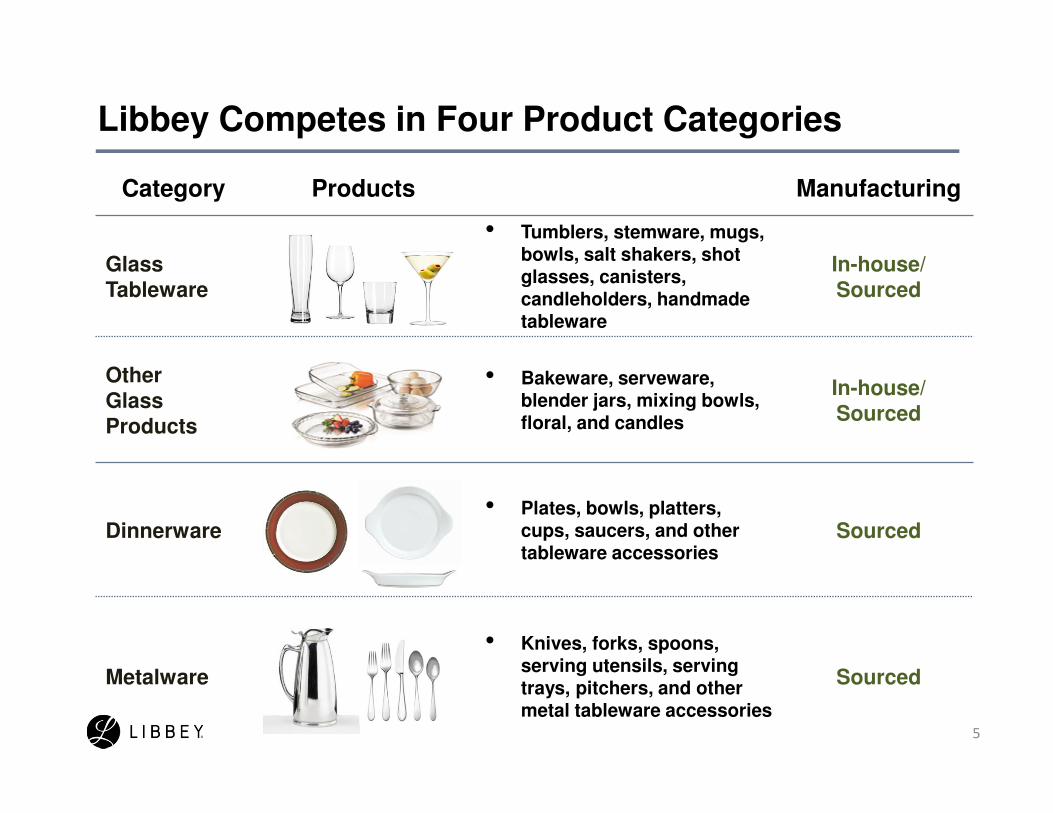
Libbey Competes in Four Product Categories
5
Category Products Manufacturing
Glass Tableware
• Tumblers, stemware, mugs, bowls, salt shakers, shot glasses, canisters, candleholders, handmade tableware
In-house/Sourced
Other Glass Products
• Bakeware, serveware, blender jars, mixing bowls, floral, and candles
In-house/Sourced
Dinnerware• Plates, bowls, platters,
cups, saucers, and other tableware accessories
Sourced
Metalware
• Knives, forks, spoons, serving utensils, serving trays, pitchers, and other metal tableware accessories
Sourced
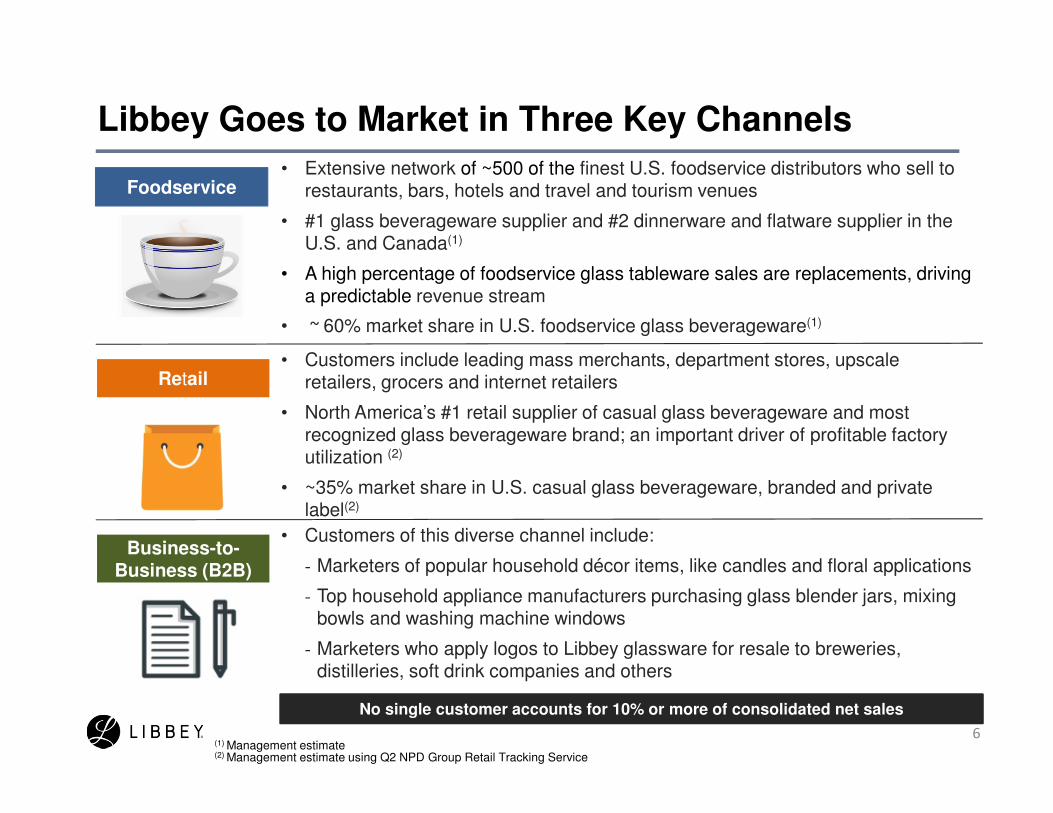
Libbey Goes to Market in Three Key Channels
• Extensive network of ~500 of the finest U.S. foodservice distributors who sell to restaurants, bars, hotels and travel and tourism venues
• #1 glass beverageware supplier and #2 dinnerware and flatware supplier in the U.S. and Canada(1)
• A high percentage of foodservice glass tableware sales are replacements, driving a predictable revenue stream
• ~ 60% market share in U.S. foodservice glass beverageware(1)
• Customers of this diverse channel include:
- Marketers of popular household décor items, like candles and floral applications
- Top household appliance manufacturers purchasing glass blender jars, mixing bowls and washing machine windows
- Marketers who apply logos to Libbey glassware for resale to breweries, distilleries, soft drink companies and others
Foodservice
Business-to-Business (B2B)
• Customers include leading mass merchants, department stores, upscale retailers, grocers and internet retailers
• North America’s #1 retail supplier of casual glass beverageware and most recognized glass beverageware brand; an important driver of profitable factory utilization (2)
• ~35% market share in U.S. casual glass beverageware, branded and private label(2)
6(1) Management estimate(2) Management estimate using Q2 NPD Group Retail Tracking Service
Retail
No single customer accounts for 10% or more of consolidated net sales
• ‘Annuity Like’ market with a strong ‘installed base’ of customers reordering based on table setting placements
• Consumer confidence is strong and discretionary income is rising
• Foodservice market leader recognized for excellence by leading foodservice distributors:
• Strong foodservice network and in-house salesforce sell to established restaurants, hospitality and tourism and new entrants throughout the country
• Steady pace of innovation and critical profitability of beverages lead to lower price sensitivity; price increases in 43 of last 47 years
• Exceptional depth and breadth of product line and sizeable installed tableware base provide significant advantage
7
Foodservice Channel: Positioned for Continued Strength
Edward Don & Company Trimark US FoodsSysco ABC Webstaurant

• U.S. casual glass beverageware leader; market share in brick and mortar estimated at ~35%…more than twice the next competitor(1)
• Highly recognized brands and enhanced e-commerce capabilities position the company for continued leadership
• Established relationships with major retailers provide a platform to launch innovative products aligned with consumer wants and needs
8
Retail Channel: Improving Competitive Positioning
(1) Management estimate using Q2 2017 NPD Group Retail Tracking Service, NPD survey and management estimates, includes branded and private label
Walmart Amazon Bed Bath & Beyond
Dollar Tree Target Soriana
Wayfair IKEA Crate & Barrel

• The business-to-business channel offers diverse opportunities for growth
�Established global supplier of logo glassware for promotions and OEM supplier to leading appliance manufacturers
�Growing in houseware applications: decorated beverageware and glass components for candles and floral applications
�Commercial sales of blender jars and washing machine windows
9
B2B Channel: Diverse Opportunities for Growth
Whirlpool Princess House Smith MountainSunbeam Syndicate Sales Inc. Star Soap & Candle
Organizational Excellence
10
Libbey has Three Key Strategic Focus Areas:
Growth
Operational Excellence
1.
2.
3.
11
Growth1• New product innovation & e-commerce to drive growth and market expansion
• New product development process grounded in market insights
� Differentiated offerings aligned with current consumer wants and needs
� Expansion in underserved and emerging categories
- Foodservice: underpenetrated categories, adjacencies like assisted living and travel and tourism
- Omni channel: adjacent categories; good, better, best offerings
• Leveraging new products to target existing and new segments
� Launched more than 200 new products targeted to retail at International Home & Housewares show in March 2017
� 350 new products targeted to foodservice launched at National Restaurant Association show in May 2017
� 72 new retail-directed products launched at New York Tabletop show in October 2017. Targeted to defined consumer segments using customer research data
� Three-year pipeline of projects built to sustain momentum
• E-commerce capabilities launched in July of 2017
� Enhances capabilities to maintain retail market leadership, as consumers increasingly purchase on the internet, in addition to traditional brick and mortar retail stores
12
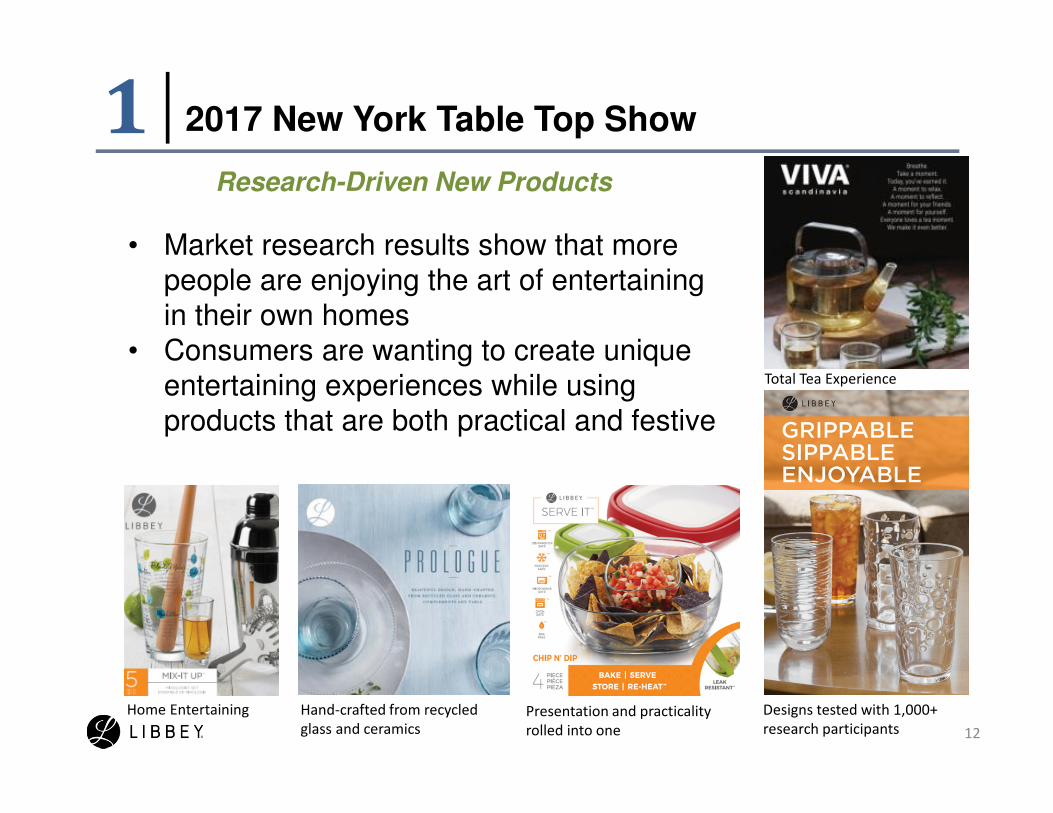
2017 New York Table Top Show1Research-Driven New Products
Designs tested with 1,000+
research participantsPresentation and practicality
rolled into one
Hand-crafted from recycled
glass and ceramics
Home Entertaining
Total Tea Experience
• Market research results show that more people are enjoying the art of entertaining in their own homes
• Consumers are wanting to create unique entertaining experiences while using products that are both practical and festive
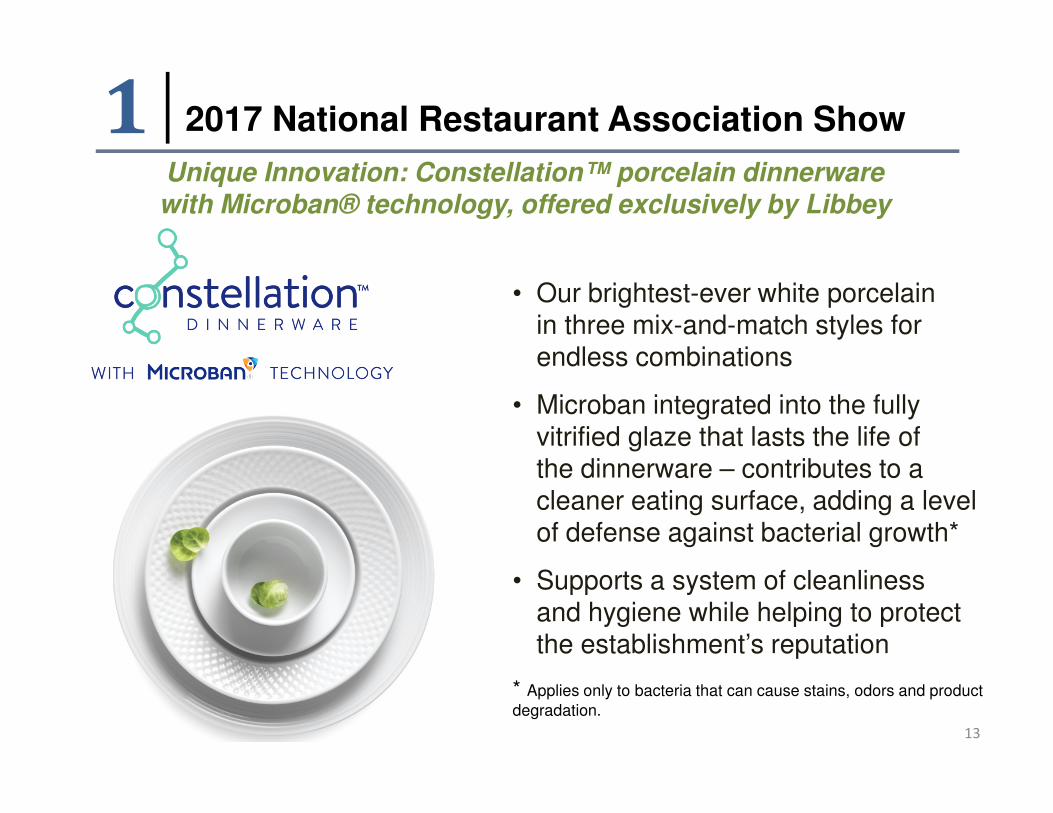
Unique Innovation: Constellation™ porcelain dinnerware with Microban® technology, offered exclusively by Libbey
13
2017 National Restaurant Association Show 1
• Our brightest-ever white porcelain in three mix-and-match styles for endless combinations
• Microban integrated into the fully vitrified glaze that lasts the life of the dinnerware – contributes to a cleaner eating surface, adding a level of defense against bacterial growth*
• Supports a system of cleanliness and hygiene while helping to protect the establishment’s reputation
* Applies only to bacteria that can cause stains, odors and product
degradation.

14
Product Innovation and E-commerce1Product innovation and e-commerce strategy to drive retail growthAddresses retail headwinds of consumer purchase migration to internet and strong price
competition in commoditized products
Upgraded e-commerce capabilities
Major new product launches
Q3 2017 e-commerce “go live”
Retail recovery and growth
Explore other channel potential?
• Significant progress…from zero to live
capabilities in six months
• Early stages of adoption with new and existing
customers
• Extends retailer aisles – release of shelf-space
constraints dramatically increases exposure for
existing products and new product launches
�
�
�
2017

15
E-commerce Platform1Digital Strategy Aspects:
� Content - Enhanced photography, video and product information
� Showcases real, human content that allows consumers to see themselves with the product and allows them to imagine new and better experiences
� 3PL Drop Ship - Scalability and superior service coast to coast
� Syndication - Process of submission and publication of product information on multiple retailer websites beyond the source
� E-commerce Products - Offers visibility to our full retail line with many more SKUs available online by retailers compared to traditional brick-and-mortar stores
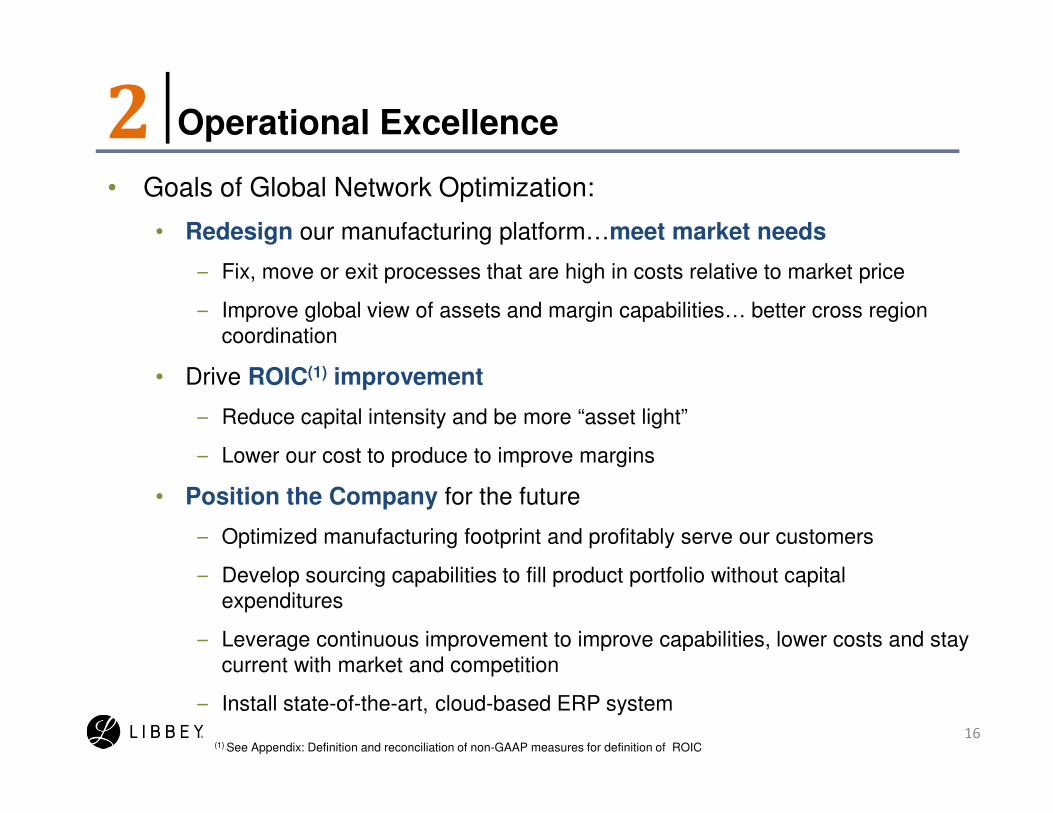
• Goals of Global Network Optimization:
• Redesign our manufacturing platform…meet market needs
– Fix, move or exit processes that are high in costs relative to market price
– Improve global view of assets and margin capabilities… better cross region coordination
• Drive ROIC(1) improvement
– Reduce capital intensity and be more “asset light”
– Lower our cost to produce to improve margins
• Position the Company for the future
– Optimized manufacturing footprint and profitably serve our customers
– Develop sourcing capabilities to fill product portfolio without capital expenditures
– Leverage continuous improvement to improve capabilities, lower costs and stay current with market and competition
– Install state-of-the-art, cloud-based ERP system
16
Operational Excellence2
(1) See Appendix: Definition and reconciliation of non-GAAP measures for definition of ROIC

17
Organizational Excellence3• Organizational re-alignments support strategy
� Cost reduction actions to de-layer key areas and offset portions of strategic investments
� Chief Digital Officer – Klay Huddleston joins Libbey with 22 years of e-commerce and global initiatives, most recently as Senior Vice President, Total Commerce Practice at Resource/Ammirati, an IBM Company. Prior to IBM, Klay held leadership positions at Amazon in the United Kingdom and United States.
� Chief Supply Chain Officer – Bill Mossing joins Libbey with 28 years of leadership experience, most recently as Vice President of Supply chain at Bendix Commercial Vehicle Systems.
• Develop winning teams that foster high performance and live our core values of:
� Continuous Improvement
� Customer Focus
� Performance Accountability
� Respect and Teamwork
� Talent Development

18
Invest in the
business
Maintain financial strength
and flexibility
Balanced approach to capital allocation
• Support/accelerate the organic growth of our business
• Selectively consider acquisitions
• Develop or invest in technologies and manufacturing capabilities
• Currently prioritizing debt pay down to move toward target range
• 2017 common dividend was $0.47/share
• Share repurchase authorization increased to 1.5 million shares in 2015
– 524K shares repurchased 2015-2016
• Target Debt Net of Cash to Adjusted EBITDA ratio(1) of 2.5x – 3.0x
• Ability to flex up or down
• Continuing to prioritize debt pay down to move toward target range
– Repaid $24.4 million of Term Loan B in 2016
– $18.3 million in the first nine months of 2017
• Extended ABL facility from April, 2019 to December, 2022
(1) See Appendix: Definition and reconciliation of non-GAAP measures for details regarding calculation of Adjusted EBITDA and the ratio net debt/Adjusted EBITDA
Balanced Approach to Capital Allocation

• Flexible capital structure
� $391MM senior secured Term Loan B matures 2021
- LIBOR plus 300 bps, $220MM swapped to a fixed 4.85%
- No financial covenants
- $150MM accordion option
� Recently extended $100MM ABL facility… now matures December 2022
- LIBOR plus 150-200 bps
• Improved interest coverage
� Significant debt paydown and borrowing rate reductions
• Fully funded U.S. pension in 2012, lowering annual cash contributions
� ~$7MM estimated global cash contribution for 2017
19
6.4
4.3
3.3 3.0 3.0 2.83.2 3.3 3.1
2008 2009 2010 2011 2012 2013 2014 2015 2016
1.2 1.4 2.5 2.6
3.5 4.2
5.3 6.3
5.3
2008 2009 2010 2011 2012 2013 2014 2015 2016
Adjusted EBITDA(1) / Interest Expense
Debt Net of Cash / Adjusted EBITDA(1)
(1) See Appendix: Definition and reconciliation of non-GAAP measures for details regarding calculation of Adjusted EBITDA and the debt net of cash to Adjusted EBITDA ratio
Capital Structure and Leverage Policy Provide Financial Flexibility
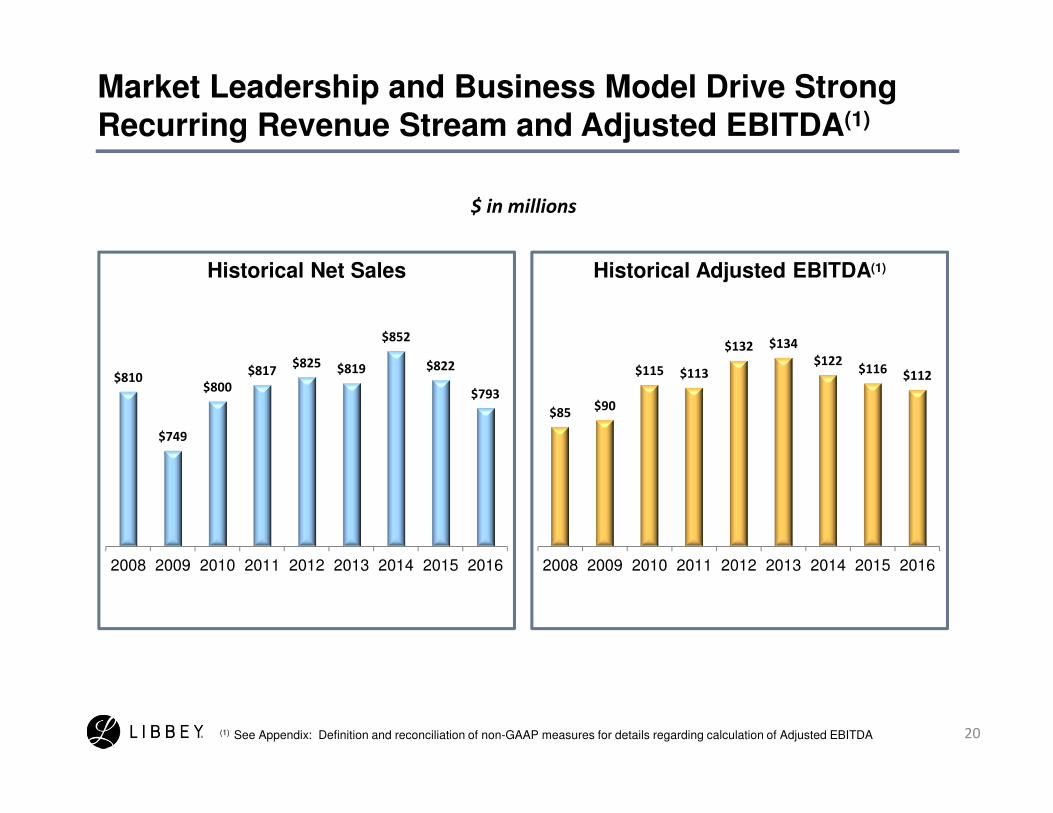
Market Leadership and Business Model Drive Strong Recurring Revenue Stream and Adjusted EBITDA(1)
(1) See Appendix: Definition and reconciliation of non-GAAP measures for details regarding calculation of Adjusted EBITDA 20
$ in millions
Historical Net Sales Historical Adjusted EBITDA(1)
$810
$749
$800
$817$825 $819
$852
$822
$793
2008 2009 2010 2011 2012 2013 2014 2015 2016
$85$90
$115 $113
$132 $134
$122$116
$112
2008 2009 2010 2011 2012 2013 2014 2015 2016

• Strong cash generation and liquidity
� $61MM cash on hand at 12/31/16
� $88MM ABL availability at 12/31/16
• Seasonal trade working capital needs
� Average $35-$40 MM peak to trough
swing in quarter-end trade working capital
each year(1)
• Capital expenditures on average about equal
to depreciation & amortization
� ~$30 MM growth investment for ClearFire®
glass manufacturing technology over
2014-2015
• Flexibility to selectively pursue M&A
opportunities
• No significant long-term debt due until Term
Loan B in 2021
21
0
50
100
150
200
2012 2013 2014 2015 2016
Total of Cash and ABL
Availability ($MM)
Cash ABL Availability
0
10
20
30
40
50
60
2012 2013 2014 2015 2016
Capital Expenditures, Depreciation & Amortization
Capital Expenditures Depreciation & Amortization
$ M
illi
on
s
(1) Trade working capital is defined as net accounts receivable plus net inventories less accounts payable as also noted in Appendix: Definition and reconciliation of non-GAAP measures
Significant Liquidity Resources and Moderate Near-term Funding Obligations
$136$113
$142 $140 $149

Appendix
22

Lifestyle trend inspired launch of over 200 new Libbey retail products
23
2017 International Home and Housewares Show 1
• Insights from consumer research driven designs, culminated in a modern collection designed to fit today’s lifestyles – Urban Story
• Practical, yet beautiful. Simple, yet versatile. Multi-functional.
• Sold online and in-store
Urban Story Collection

24
2017 National Restaurant Association Show 1Insight-driven product solutions support customer success
Today’s hottest food and beverage trends, combined with Libbey’s tabletop expertise, helps customers define and deliver the experiences they want for their patrons.
Retro drinks and fine spirits enhanced by classic, cut glass designs
Mixing solid and multi-tone dinnerware; TikiOrganic shapes Earthen looksCraft beer and snacks

Key Financial DataQ3 ‘17 & ’16 and YTD ‘17 & ‘16
25
(1) See the Appendix for definitions of non-GAAP measures.
margin, Trade Working Capital and Debt, net of cash to Adjusted EBITDA ratio to the most directly comparable U.S. GAAP measure.
(2)See our third quarter 2017 press release filed on form 8-K on October 31, 2017, for reconciliations of Adjusted EBITDA, Adjusted EBITDA
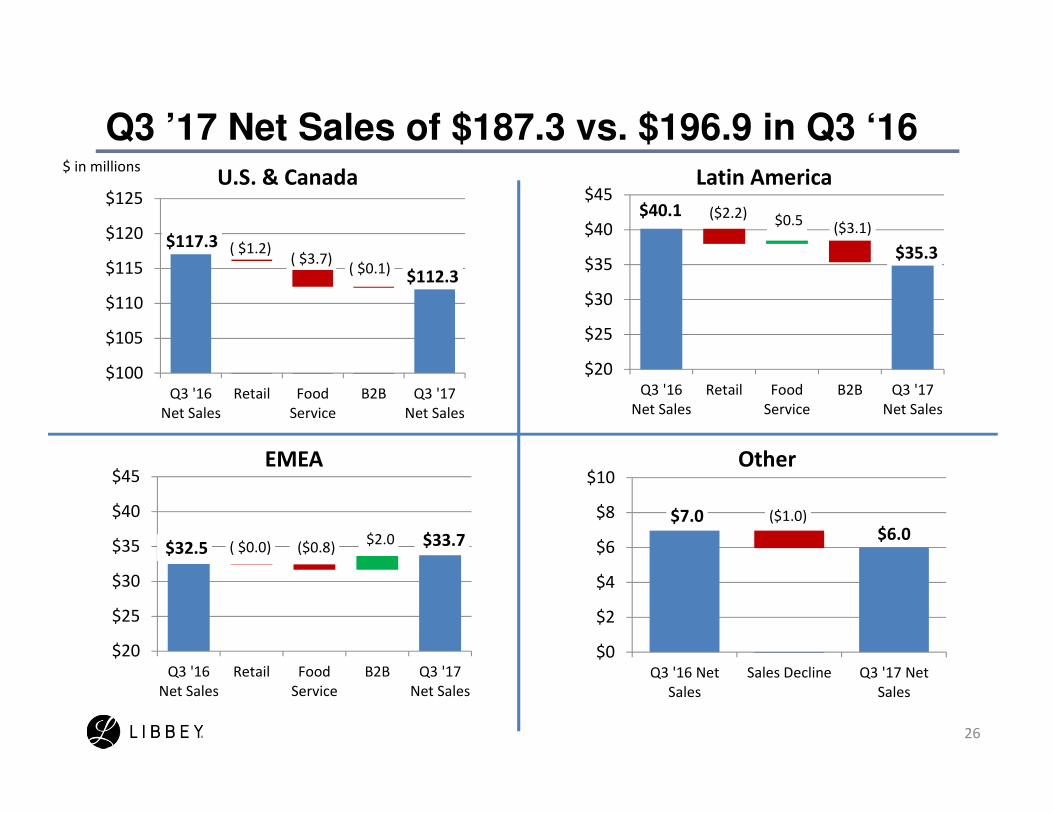
Q3 ’17 Net Sales of $187.3 vs. $196.9 in Q3 ‘16
26
$117.3
$112.3
( $1.2) ( $3.7)
( $0.1)
$100
$105
$110
$115
$120
$125
Q3 '16
Net Sales
Retail Food
Service
B2B Q3 '17
Net Sales
$ in millionsU.S. & Canada
OtherEMEA
Latin America
$7.0 $6.0
($1.0)
$0
$2
$4
$6
$8
$10
Q3 '16 Net
Sales
Sales Decline Q3 '17 Net
Sales
$32.5 $33.7 ( $0.0) ($0.8) $2.0
$20
$25
$30
$35
$40
$45
Q3 '16
Net Sales
Retail Food
Service
B2B Q3 '17
Net Sales
$40.1
$35.3
($2.2) $0.5 ($3.1)
$20
$25
$30
$35
$40
$45
Q3 '16
Net Sales
Retail Food
Service
B2B Q3 '17
Net Sales
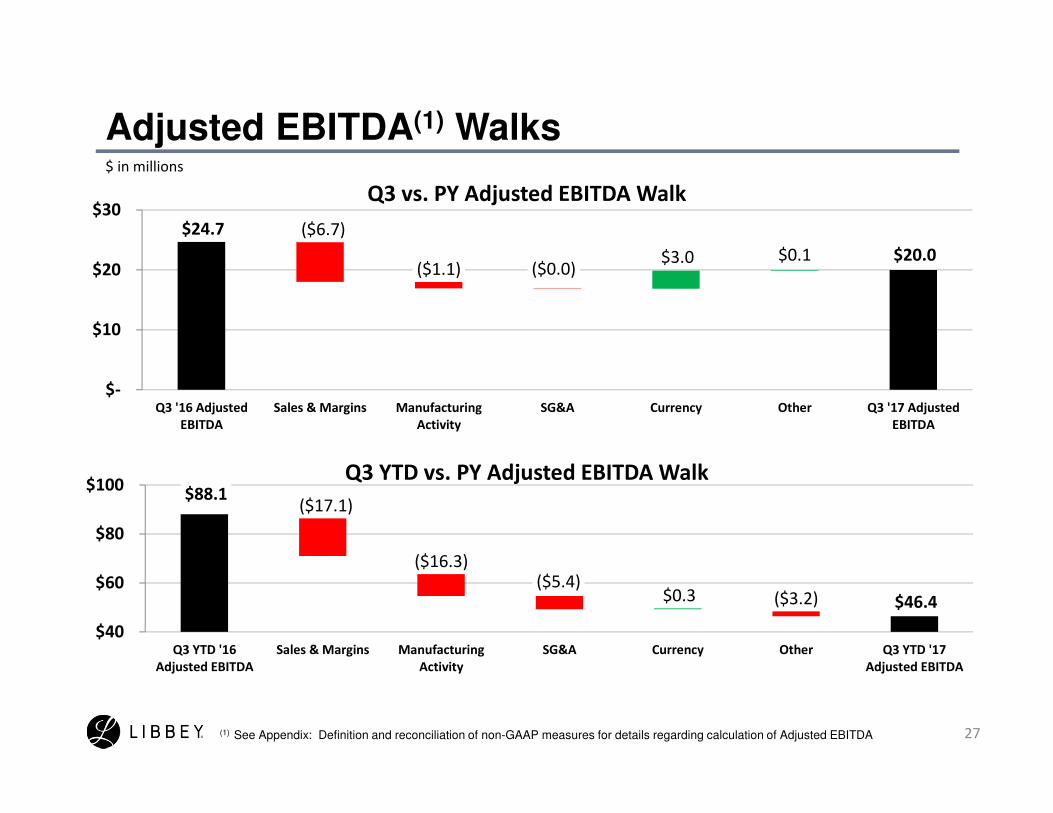
Adjusted EBITDA(1) Walks
27
$ in millions
$24.7
$20.0 $3.0 0.1
($6.7)
($1.1) ($0.0)$0.1
$-
$10
$20
$30
Q3 '16 Adjusted
EBITDA
Sales & Margins Manufacturing
Activity
SG&A Currency Other Q3 '17 Adjusted
EBITDA
Q3 vs. PY Adjusted EBITDA Walk
$88.1
$46.4 $0.3
($17.1)
($16.3)($5.4)
($3.2)
$40
$60
$80
$100
Q3 YTD '16
Adjusted EBITDA
Sales & Margins Manufacturing
Activity
SG&A Currency Other Q3 YTD '17
Adjusted EBITDA
Q3 YTD vs. PY Adjusted EBITDA Walk
(1) See Appendix: Definition and reconciliation of non-GAAP measures for details regarding calculation of Adjusted EBITDA

Definition and reconciliation of non-GAAP measures
Q3 2017 Q3 2016
9 months
ended
9/30/17
9 months
ended
9/30/16 FY 2016 FY 2015 FY 2014 FY 2013 FY 2012 FY 2011 FY 2010 FY 2009 FY 2008
Net income (loss) (U.S. GAAP) (78.8)$ 2.9$ (86.2)$ 12.3$ 10.1$ 66.3$ 5.0$ 28.5$ 7.0$ 23.6$ 70.1$ (28.8)$ (80.4)$
Add:
Interest expense 5.1$ 5.2$ 15.1$ 15.6$ 20.9$ 18.5$ 22.9$ 32.0$ 37.7$ 43.4$ 45.2$ 66.7$ 69.7$
Provision (benefit) for income taxes 2.7 5.5 1.7 12.0 17.7 (38.2) 8.5 13.2 5.7 1.7 11.6 2.7 6.3
Depreciation and amortization 11.2 11.2 33.6 36.7 48.5 42.7 40.4 44.0 41.5 42.2 41.1 43.2 44.4
Add: Special items before interest and taxes(1)
:
Restructuring and facility closure charges - - - - - - 1.0 6.5 - (0.1) 2.5 3.8 29.1
Severance - - - - - - - - 5.1 1.1 - - -
Pension curtailment and settlement charges - - - 0.2 0.2 21.7 0.8 2.3 4.3 - - 3.2 -
Loss (gain) on redemption of debt - - - - - - 47.2 2.5 31.1 2.8 (58.3) - -
Abandoned property - - - - - - - 1.8 - 2.7 - - -
Gain on sale of assets - - - - - - - - - (6.8) - - -
Goodwill and intangible impairment charges 79.7 - 79.7 - - - - - - - - - 11.9
Product portfolio optimization - - - 6.8 5.7 - - - - - - - -
Other (2)
- (0.1) 2.5 4.5 8.5 5.3 (3.5) 5.1 - 2.5 2.8 - 4.5 Less: Accelerated depreciation expense
included in special items and also in
depreciation and amortization above - - - - - - - (1.5) - - - (0.7) (0.3)
Adjusted EBITDA (non-GAAP) 20.0$ 24.7$ 46.4$ 88.1$ 111.6$ 116.3$ 122.1$ 134.4$ 132.4$ 113.1$ 115.0$ 90.1$ 85.2$
Net sales 187.3$ 196.9$ 557.8$ 587.6$ 793.4$ 822.3$ 852.5$ 818.8$ 825.3$ 817.1$ 799.8$ 748.6$ 810.2$
Net income (loss) margin (U.S. GAAP) (42.1%) 1.5% (15.5%) 2.1% 1.3% 8.1% 0.6% 3.5% 0.8% 2.9% 8.8% (3.8%) (9.9%)
Adjusted EBITDA Margin (non-GAAP) 10.7% 12.6% 8.3% 15.0% 14.1% 14.1% 14.3% 16.4% 16.0% 13.8% 14.4% 12.0% 10.5%
Reconciliation of Net Income (Loss) to Adjusted Earnings Before Interest, Taxes, Depreciation and Amortization (Adjusted EBITDA) and Adjusted EBITDA Margin(Dollars in millions)
(2) Other Q3 2016 includes $(0.1) million for executive termination. Other 9 months ended 9/30/17 includes $2.5 million for reorganization charges. The 9 months ended 9/30/16 includes $4.5 million for executive
termination. FY 2016 includes $4.1 million for work stoppage and $4.4 million for executive terminations. 2015 includes $4.2 million for reorganization charges, $0.9 million for executive termination, and $0.2 million for an
environmental obligation. 2014 includes $(4.7) million for furnace malfunction net proceeds, $0.9 million for executive retirement charges, and $0.3 million for an environmental obligation. 2013 includes $4.4 million of furnace
malfunction charges and $0.7 million for executive retirement charges. 2011 includes $2.7 million for CEO transition expenses, $(1.0) million for an equipment credit and an $0.8 million write-down of unutilized fixed assets.
2010 includes $2.7 million of fixed asset write-down charges, $1.0 million in expenses related to a secondary stock offering and a $(0.9) million insurance claim recovery. 2008 includes a $4.5 million fixed asset write-down
charge.
Adjusted EBITDA excludes special items that Libbey believes are not reflective of our core operating performance.
(1) Beginning in the first quarter of 2017, the gain (loss) on mark-to-market natural gas contracts was considered representative of our ongoing operations and not a special item when computing Adjusted EBITDA. The prior
years presented here have been recasted to conform with our current presentation in 2017.
28

Definition and computation of non-GAAP measures
Definitions – Other Non-GAAP Measures
Trade working capital is defined as net accounts receivable plus net inventory less accounts payable.
Return on invested capital (ROIC) is defined as after tax income from operations (using a 35% tax rate), adjusted for special items, over ending trade working capital plus net book value of property, plant and equipment
Constant currency references regarding net sales reflect a simple mathematical translation of local currency results using the comparable prior period’s currency conversion rate. Constant currency references regarding Segment EBIT, Adjusted EBITDA and Adjusted EBITDA Margin comprise a simple mathematical translation of local currency results using the comparable prior period’s currency conversion rate plus the transactional impact of changes in exchange rates from revenues, expenses and assets and liabilities that are denominated in a currency other than the functional currency. Our currency market risks include currency fluctuations relative to the U.S. dollar, Canadian dollar, Mexican peso, Euro and RMB.
Free cash flow is defined as net cash provided by operating activities plus net cash provided by (used in) investing activities.
Last 12
months
ended
9/30/17
Last 12
months
ended
9/30/16 FY 2016 FY 2015 FY 2014 FY 2013 FY 2012 FY 2011 FY 2010 FY 2009 FY 2008
Adjusted EBITDA (1)
(non-GAAP) 69.9$ 119.2$ 111.6$ 116.3$ 122.1$ 134.4$ 132.4$ 113.1$ 115.0$ 90.1$ 85.2$
Debt reported on balance sheet(2)
(U.S. GAAP) 398.9$ 413.8$ 407.8$ 431.0$ 437.9$ 402.4$ 454.2$ 390.1$ 436.6$ 512.0$ 543.5$
Plus: Unamortized discount, finance fees and warrants (2)
3.6 4.8 4.5 5.8 7.0 9.5 12.3 11.6 16.9 5.0 11.4
Less: Carrying value in excess of principal on PIK notes - - - - - - - - - 70.2 -
Less: Carrying value adjustment on debt related to the Interest
Rate Agreement - - - - - (1.3) 0.4 4.1 3.3 - -
Gross Debt 402.5 418.6 412.3 436.9 444.9 413.2 466.1 397.6 450.2 446.8 554.9
Less: Cash and cash equivalents 21.6 42.7 61.0 49.0 60.0 42.2 67.2 58.3 76.3 55.1 13.3
Debt net of cash 380.9$ 376.0$ 351.3$ 387.9$ 384.9$ 371.0$ 398.9$ 339.3$ 373.9$ 391.7$ 541.6$
Debt net of cash to Adjusted EBITDA Ratio (non-GAAP) 5.5 3.2 3.1 3.3 3.2 2.8 3.0 3.0 3.3 4.3 6.4
Interest expense 20.4$ 20.4$ 20.9$ 18.5$ 22.9$ 32.0$ 37.7$ 43.4$ 45.2$ 66.7$ 69.7$
Adjusted EBITDA to Interest Expense Ratio (non-GAAP) 3.4 5.9 5.3 6.3 5.3 4.2 3.5 2.6 2.5 1.4 1.2
Computation of Adjusted EBITDA to Debt net of cash to Adjusted EBITDA Ratio and Adjusted EBITDA to Interest Expense Ratio(Dollars in millions)
(1) - See prior page for calculation and reconciliation to net income.
(2) - All years reflect retrospective adoption of ASU 2015-03 and 2015-15, which presents debt issuance costs of senior debt as a reduction to the liability.
29