leveraged losses: lessons from the mortgage … losses: lessons from the mortgage market meltdown...
TRANSCRIPT

Leveraged Losses: Lessons from the Mortgage Market Meltdown
David Greenlaw, Jan Hatzius, Anil K Kashyap, Hyun Song Shin
US Monetary Policy Forum Conference DraftFebruary 29, 2008

• Characterize disruptions caused by “subprime” and compare to previous periods of financial distress
• Estimate the ultimate losses on mortgage backed securities• Role of leverage and mark-to-market accounting in
propagating the shock• Estimate effect of contraction in B/S of financial institutions
on real GDP• Policy recommendations for C.B.
Outline:

• Current credit crisis different from past because large part of credit has been securitized.
• Those securities are owned by highly leveraged investors with short-term liabilities.
• Thus they are highly sensitive to balance-sheet changes caused by price changes or changes in perceived risk.
• Amplification mechanism driven by leverage adjustments generates new features peculiar to “subprime” crisis and a spillover into real economy through decline in credit.
First “Post-Securitization” Credit Crisis(Come Back to this Later)

Credit Market since August 2007European bank closes three investment funds because U.S. market made it impossible to value underlying asset
ECB injects $130 billion
FED cuts discount rate by 50bp

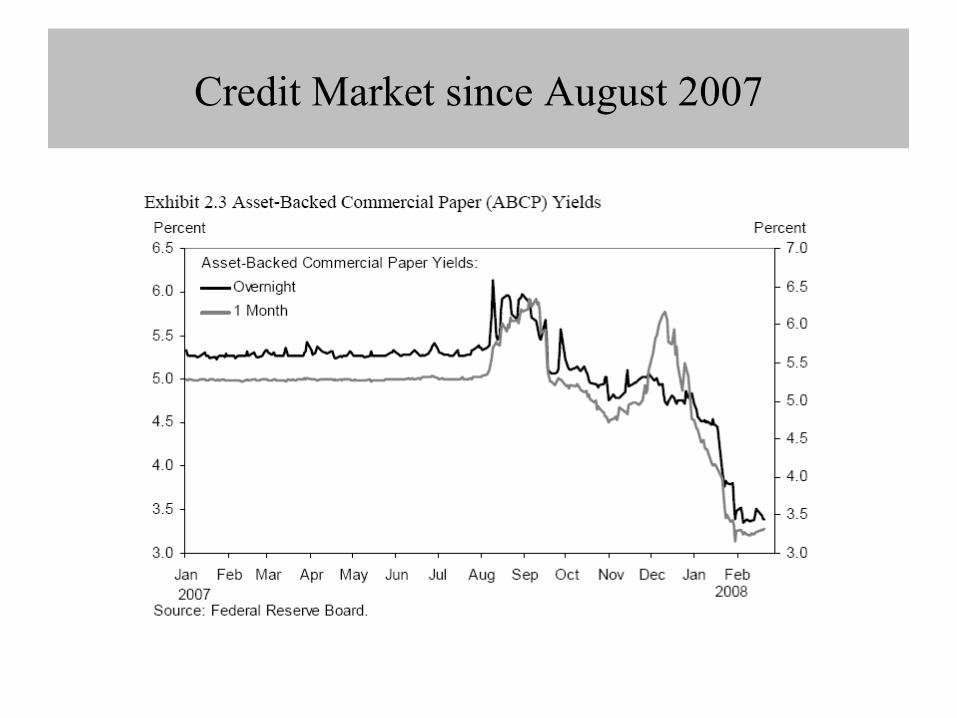
Credit Market since August 2007
Securities market is the dominant source of financial intermediation in the U.S. today. In addition to the underlying loans financial intermediaries had exposure to jumbo mortgages, ASCP, and CDO’s.

Credit Market since August 2007
Credit Market since August 2007

Credit Market since August 2007

Credit Market since August 2007
Residential mortgages only 25% of collateral underlying ABCP and most ABCP’s were highly rated, but banks tightened credit standards on a variety of loans, because investors found it difficult to evaluate credit quality of underlying assets.
Credit Market since August 2007
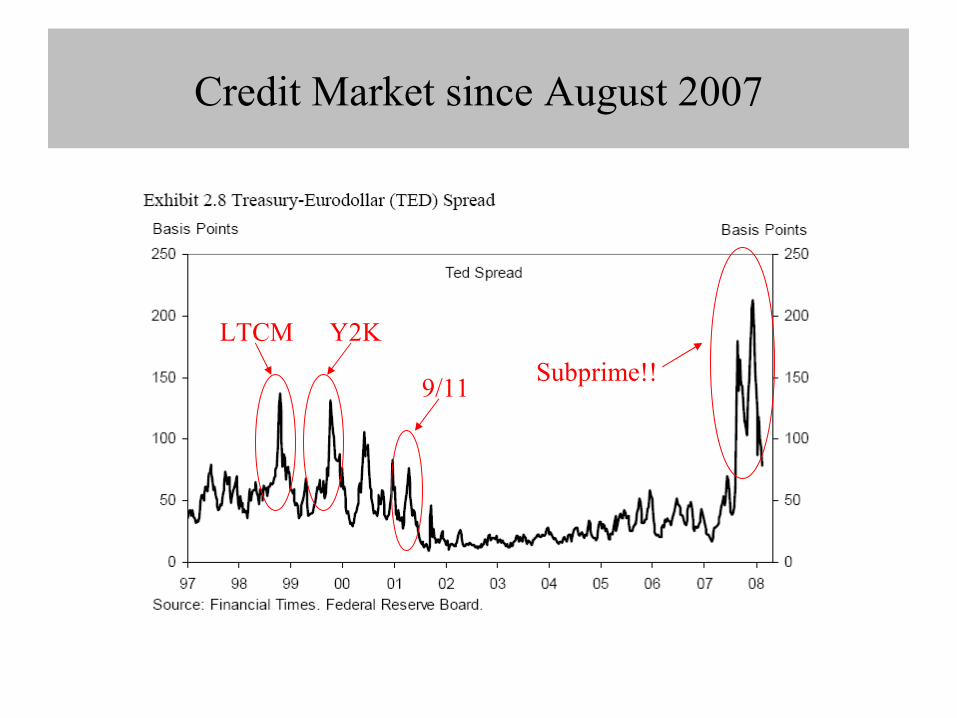
LTCM Y2K
9/11 Subprime!!
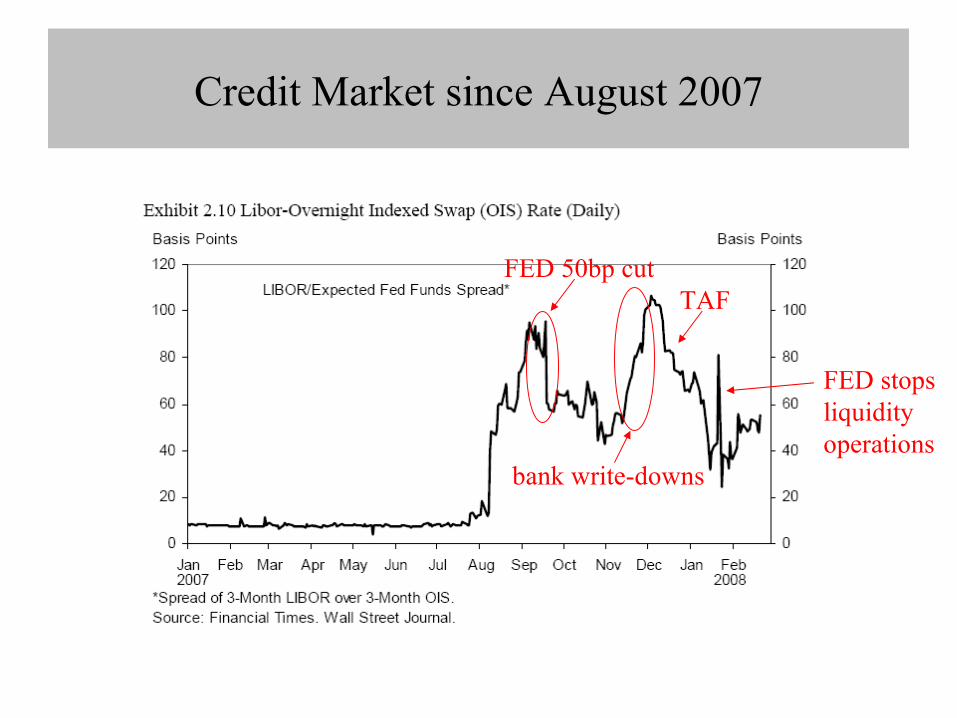
Credit Market since August 2007
FED 50bp cut
bank write-downs
TAF
FED stopsliquidity operations

Credit Market since August 2007
A decline in ABX Indices indicates steep increase in insurance costs forAAA bonds.
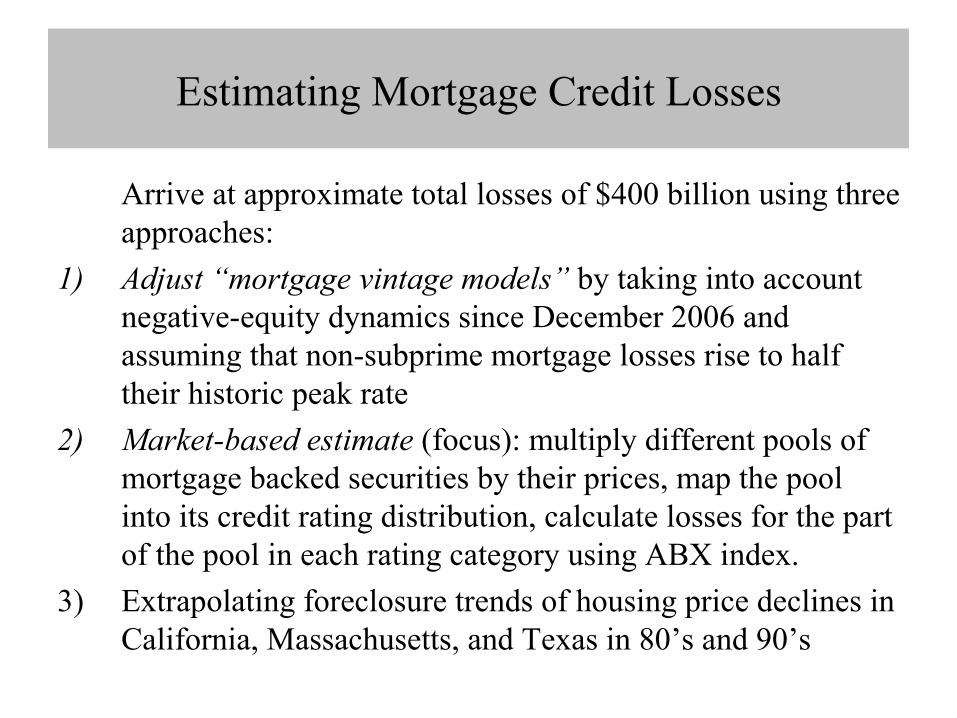
Arrive at approximate total losses of $400 billion using three approaches:
1) Adjust “mortgage vintage models” by taking into account negative-equity dynamics since December 2006 and assuming that non-subprime mortgage losses rise to half their historic peak rate
2) Market-based estimate (focus): multiply different pools of mortgage backed securities by their prices, map the pool into its credit rating distribution, calculate losses for the part of the pool in each rating category using ABX index.
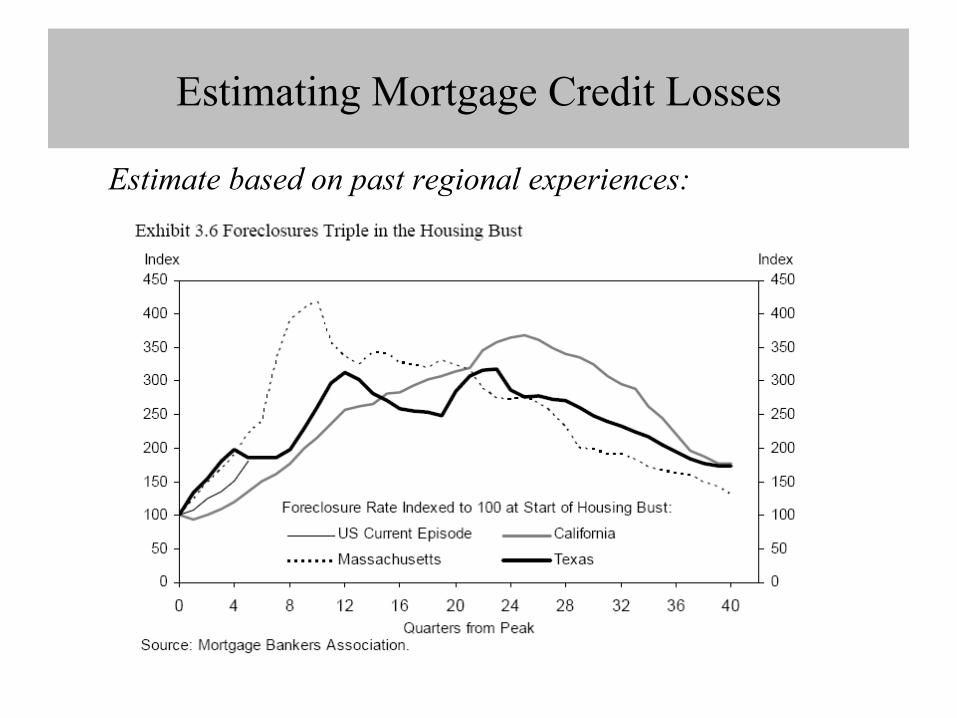
3) Extrapolating foreclosure trends of housing price declines in California, Massachusetts, and Texas in 80’s and 90’s
Estimating Mortgage Credit Losses

Estimating Mortgage Credit Losses
Market-based estimate:

Estimating Mortgage Credit Losses
Market-based estimate:

Estimating Mortgage Credit Losses
Market-based estimate:
Estimating Mortgage Credit Losses
Estimate based on past regional experiences:

Estimating Mortgage Credit Losses
Estimate based on past regional experiences:
Average foreclosure rate triples with several years, peaking between years2 and 6.
Cumulating the difference between projected foreclosure rate andthe 0.4% rate prevailing at the start of 2006 over the entire 2006-2013 Period using $11 trillion of 1-4 family mortgage debt get $1.5 trillion in foreclosure starts.
Assuming repossession average 55%-60% and average loss severity of 50%, the implied foreclosure starts will translate into $400 billion in mortgage credit losses.

Estimating Mortgage Credit Losses
Two distinguishing features of current crisis:
1) Divergence between those markets that suffered acute distress (interbank market, jumbo mortgages, ABCP and CDOs markets), and other markets such as stock market that came out largely unscathed.
2) Absence of contraction in balance sheets (decline in leverage) in response to falling asset prices.
First “Post-Securitization” Credit Crisis

First “Post-Securitization” Credit Crisis
First “Post-Securitization” Credit Crisis
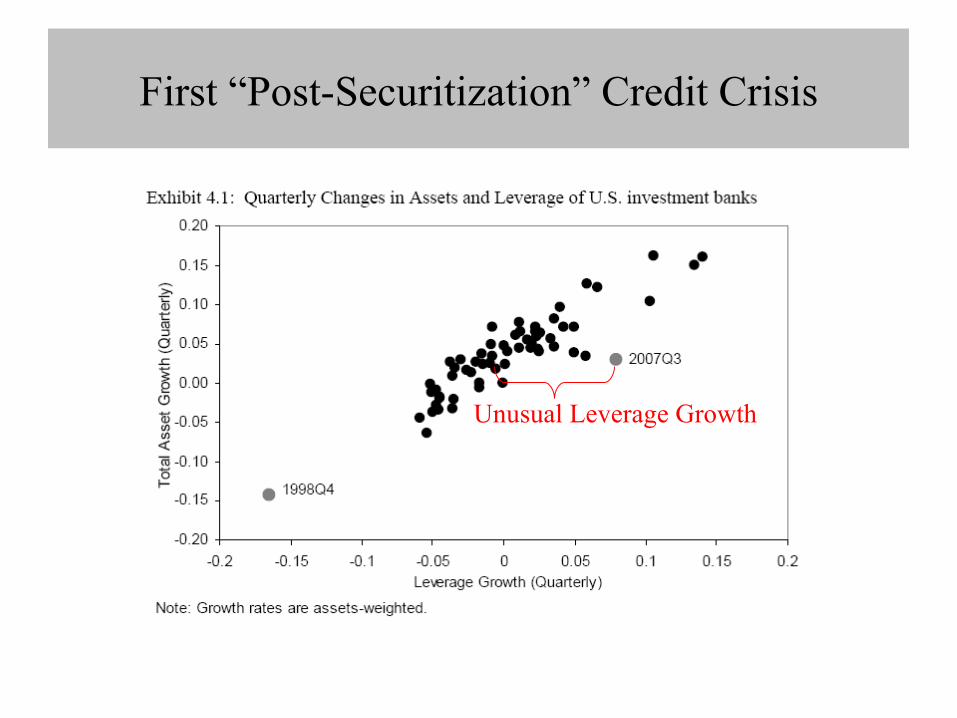
Unusual Leverage Growth

U.S. leveraged institutions hold 51% of all outstanding mortgage debt. Their balance sheets consist of very short-term claims, and as such are actively managed in response to changes in anticipated risk and asset prices (Mark-to-Market Accounting).
They usually adjust their balance sheets so that leverage is high during booms and low during busts. However, through 2007 Q4 neither investment banks nor even commercial banks have shown signs of deleveraging.
Role of Leverage and Mark-To-Market Accounting

Leverage targeting implies that adjustment of leverage and of price changes will reinforce each other in an amplification of the financial cycle. When prices go up, the leverage become too low relative to target and financial intermediaries look for ways to employ surplus capital by taking on short-term debt on liabilities side and by accumulating new borrowers on the asset side.This implies that when balance sheets are expanding fast enough, even borrowers who do not have the means to repay are granted credit – so intense is the urge to employ surplus capital. SUBPRIME MORTGAGE MARKET
Role of Leverage and Mark-To-Market Accounting

1) So why were markets for stocks, sovereign debt, and high grade corporate bonds little affected?
Most stocks and high grade bonds are held by non-leveraged investors such as households and long-only/hold-to-maturity investors who are insensitive to changes in balance sheet size. (households, mutual funds, insurance companies)
In contrast, most mortgages, speculative grade bonds, and mortgage-backed securities are held by leveraged institutions.(broker-dealers themselves, hedge funds, SIV’s)
Role of Leverage and Mark-To-Market Accounting

2) So why didn’t banks’ balance sheets contract (deleverage), even though VaR had doubled by Nov. 2007 relative to May 2006?
Distressed entities, such as SIV’s, having difficulties rolling over their ABCP liabilities, began tapping into their back-up liquidity lines from commercial banks, leading to involuntary expansion of credit.
Role of Leverage and Mark-To-Market Accounting

• Under imperfect capital markets and if some borrowers depend on financial intermediaries for financing, then balance sheet adjustments by leveraged intermediaries will have effects on real economy.
• To calculate the real effect of a decline in credit on GDP growth, must fist determine leveraged sector’s total claims against non-leveraged sectors (households, corporations, etc.).
Economic Impact of Deleveraging

Economic Impact of Deleveraging
A – initial aggregate assets of leveraged sectorE – initial equity of leveraged sectorμ – ratio of new leverage to the old leverageL – total credit losses suffered by leveraged sectork – proportion of credit losses made up by raising new capital

Economic Impact of Deleveraging
A = $20.5 trillionE = $2.05 trillion (satisfies A and L)L = $200 billion (50% of $400 billion in total credit losses)μ = 95% (benchmark reflecting a 50% increase in VaR)k = 50% benchmark

Economic Impact of Deleveraging
Note: Estimates of total asset contraction not very sensitive to the choice of k

Economic Impact of Deleveraging
H = $7,567 trillion (Flow of Funds Data)A = $20.5 trillionthen z = 0.36λ = 10 (A/E, aggregate leverage)
s claims to other leveraged partiesy loans to non-leveraged end-usersd obligations to leveraged partiesh obligations to non-leveraged userse equity

Economic Impact of Deleveraging

Economic Impact of Deleveraging
Proxy for domestic credit using domestic non-financial debt (DNFD)
Instrument for DNFD using TED spread and bank willingness to makes installment loans (Senior Loan Officer’s survey) p.41

Summary:
$910 billion contraction in end-user credit (3.0 percentage drop in DNFD growth) will reduce real GDP growth by 1.3 percentage points over the following year
Economic Impact of Deleveraging

Monetary Policy: must help banks raise new equity capital
1. Liquidity injections will only increase leverage, because induces financial intermediaries to expand their balance sheets by borrowing from C.B.
2. Lower short-term rates will improve yield spread on which banks operate, thus allowing them to rebuild equity capital
3. Lower short-term rates stimulate demand, improving borrowers’ positions thus helping financial intermediaries.
4. Lower short-term rates are prices at which collateralized borrowing and lending is rolled over, thus lower the marginal price of quantity adjustments.
Policy Recommendations

Other Policy Options to help banks raise new equity capital:
1. Encourage banks to retain cash flow by cutting dividends(government has a role in helping financial sector overcome the stigma of doing so)
2. Reinstate monthly survey that tracks commitment lending vs. voluntary lending
Policy Recommendations