leveling the playing field policy parity for … coal council – leveling the playing field...
TRANSCRIPT

LEVELING THE PLAYING FIELD Policy Parity for Carbon Capture and Storage Technologies
Revision: 1-1-15
National Coal Council – Leveling the Playing Field
LEVELING THE PLAYING FIELD Policy Parity for Carbon Capture and Storage
Technologies
NCC CHAIR Jeff Wallace, Southern Company Services (retired)
COAL POLICY COMMITTEE CHAIR Fredrick D. Palmer, Peabody Energy (retired)
STUDY CHAIR Glenn Kellow, Peabody Energy
TECHNICAL CHAIR & LEAD AUTHOR Fred Eames, Hunton & Williams
CONTRIBUTING AUTHORS Janet Gellici, National Coal Council Mark Menezes, Hunton & Williams Eric Hutchins, Hunton & Williams
LEAD EDITOR Richard Guerard, Hunton & Williams
NCC EXECUTIVE VICE PRESIDENT & CHIEF OPERATING OFFICER
Janet Gellici
The National Coal Council is a Federal Advisory Committee to the U.S. Secretary of Energy. The NCC advises, informs and makes recommendations to the Secretary on matters requested
by the Secretary relating to coal or the coal industry.
Library of Congress Catalog # TBD
National Coal Council – Leveling the Playing Field
The National Coal Council (NCC) was chartered in 1984 based on the conviction that an industry advisory council on coal could make a vital contribution to America’s energy security. The NCC’s founders believed that providing expert information could help shape policies relevant to the use of coal in an environmentally sound manner. It was expected that this could, in turn, lead to decreased dependence on other less abundant, more costly, less secure sources of energy. These principles continue to guide and inform the activities of the NCC. Coal has a vital role to play in the future of our nation’s electric power, industrial, manufacturing, and energy needs. Our nation’s primary energy challenge is to find a way to balance our social, economic, and environmental objectives.
Throughout its 30-year history, the NCC has maintained its focus on providing guidance to the Secretary of Energy on various aspects of the coal industry. The NCC has retained its original charge to represent a diversity of perspectives through its varied membership and continues to welcome members with extensive experience and expertise related to coal.
The NCC serves as an advisory group to the Secretary of Energy, chartered under the Federal Advisory Committee Act (FACA), providing advice and recommendations to the Secretary of Energy on general policy matters relating to coal and the coal industry. As a FACA organization, the NCC does not engage in lobbying activities. The principal activity of the NCC is to prepare reports for the Secretary of Energy at his/her request. During its 30-year history, the NCC has prepared more than 30 studies for the Secretary, at no cost to the Department of Energy. All NCC studies are publicly available on the NCC website.
Members of the NCC are appointed by the Secretary of Energy and represent all segments of coal interests and geographic distribution. The NCC is headed by a Chair and Vice Chair who are elected by its members. The Council is supported entirely by voluntary contributions from NCC members and receives no funds from the Federal government. Studies are conducted solely at the expensive of the NCC and at no cost to the government. The National Coal Council values the opportunity to represent the power, the pride, and the promise of our nation’s coal industry.
National Coal Council
1101 Pennsylvania Ave. NW, Ste. 600 - Washington, DC 20004 (202) 756-4524 – [email protected]
National Coal Council – Leveling the Playing Field
November 12, 2015 The Honorable Ernest J. Moniz U.S. Secretary of Energy U.S. Department of Energy 1000 Independence Ave., SW Washington, DC 20585 Dear Secretary Moniz: On behalf of the members of the National Coal Council (NCC), we are pleased to submit to you, pursuant to your letter dated September 18, 2015, the white paper “Leveling the Playing Field: Policy Parity for Carbon Capture and Storage Technologies.” The white paper’s primary focus is to recommend incentives and policies that can be employed to level the playing field for deploying CCS technologies. We are pleased to have completed this work through the NCC’s newly formed rapid-response initiative, ensuring that your request for guidance could be provided in advance of the COP21 meeting in late November. The principal theme of the NCC’s Leveling the Playing Field white paper is that federal policy has severely tilted the energy playing field. Existing incentives for CCS are simply too small to bridge the gap between the cost and risk of promising, but immature, CCS technologies vis-à-vis other low-carbon technology options. While the U.S. Department of Energy has stewarded a successful research and development program to spur early development of CCS technologies, insufficient overall support has hindered commercial deployment. Other low carbon technologies have benefitted from substantial government support. The success of policy and financial incentives afforded to the renewable energy industry provides ample evidence that government support can be the critical enabler for bringing scale and speed to clean energy technology deployment. The National Coal Council is pleased to offer a menu of options that can be employed to level the playing for CCS. These include financial incentives, regulatory improvements, and research, development and demonstration catalysts. No single incentive by itself will provide the parity needed to effectively deploy CCS technologies. The optimal mix of incentives will need to be evaluated and provided on a project-by-project basis.
National Coal Council – Leveling the Playing Field
We are confident that this country will succeed in meeting our global carbon dioxide emission reduction goals when we commit with urgency to the deployment of CCS technologies. Such commitment begins with the establishment of policies and incentives to level the playing field for CCS. Thank you for the opportunity to prepare this white paper. The Council stands ready to address any questions you may have regarding its recommendations and other contents. Sincerely,
Jeff Wallace Glenn Kellow NCC Chair NCC Study Chair
National Coal Council – Leveling the Playing Field
National Coal Council – Leveling the Playing Field
LEVELING THE PLAYING FIELD Policy Parity for Carbon Capture and Storage
Technologies Advisory Group & Review Team
EXECUTIVE ADVISORY BOARD Jeff Wallace, Southern Company (retired) – NCC Chair
Mike Durham, Soap Creek Energy – NCC Vice Chair Fred Palmer, Peabody Energy (retired) – Coal Policy Committee Chair Bill Brownell, Hunton & Williams – Coal Policy Committee Vice Chair
John Eaves, Arch Coal Kemal Williamson, Peabody Energy
Rich Lopriore, PSEG Fossil LLC Mike Sorensen, Tri-State Generation & Transmission
George Duggan, BNSF Railway George McClellan, Clean Coal Solutions
Mark Schoenfield, Jupiter Oxygen Janet Gellici, National Coal Council
STUDY CHAIR Glenn Kellow, Peabody Energy
TECHNICAL CHAIR & LEAD AUTHOR Fred Eames, Hunton & Williams
CONTRIBUTING AUTHORS Janet Gellici, National Coal Council Mark Menezes, Hunton & Williams Eric Hutchins, Hunton & Williams
CONTRIBUTING ADVISORS Shannon Angielski, CURC Shannon Banaga, Tampa Electric Carl Bozzuto, ALSTOM Inc. Dr. Frank Burke, Consultant Joe Divoky, Babcock & Wilcox Bill Elliott, Bechtel Dave Frederick, FirstEnergy Nina French, Clean Coal Solutions
John Kennedy, Dynegy Jason Makansi, Pearl Street Inc. Larry Monroe, Southern Company Karen Obenshain, EEI Deck Slone, Arch Coal Pamela Tomski, Global CCS Institute Matt Usher, American Electric Power Steve Winberg, Battelle
National Coal Council – Leveling the Playing Field
LEAD EDITOR Richard Guerard, Hunton & Williams
SCOPING TEAM MEMBERS Not noted elsewhere for their contributions
Brad Crabtree, Great Plains Institute David Flannery, Steptoe Johnson Raj Gaikwad, Sargent & Lundy Revis James, EPRI Holly Krutka, Shenhua Group Nancy Mohn, ALSTOM Massood Ramezan, LTI Dan Roling, NOVADX Ventures
Sharon Sjostrom, Clean Coal Solutions Rick Smith, Ameren Scott Teel, Southern Company Liam McHugh, World Coal Association Ken Nemeth, SSEB Mark Riedy, Kilpatrick Townsend Chris Ungate, Sargent & Lundy
COAL POLICY COMMITTEE Robert O. Agbede, Chester Engineers Sy Ali, Clean Energy Consulting Shannon Angielski, CURC Richard Bajura, West Virginia University Shannon Banaga, Tampa Electric
Janos M. Beer, Massachusetts Institute of Technology Jacqueline F. Bird, JFBird Enterprises Lisa Bradley, Haley & Aldrich
F. William Brownell, Esq., Hunton & Williams Wanda Burget, Norwest Corporation Dr. Frank Burke, Consultant Brad Crabtree, Great Plains Institute
Christopher Curfman, Caterpillar Global Mining Division Jack Daly, Sargent & Lundy Joe Divoky, Babcock & Wilcox Ted Doheny, Joy Global, Inc. Michael D. Durham, Soap Creek Energy John W. Eaves, Arch Coal, Inc. George Ellis, Pennsylvania Coal Association Alex G. Fassbender, Ecovia Corporation Paul J. Feldman, Midwest ISO John S. Fischer, Breakthrough Energy, LLC David Flannery, Steptoe & Johnson PLLC
Mark Fraley, FirstEnergy Solutions Corp Clark D. Harrison, CH2M William Hoback, Southern Illinois Univ. Clarence Joseph Hopf, Talen Energy Marty Irwin, PQR Energy Revis James, EPRI Michael Karmis, Virginia Tech Michael Kennedy, KY State Dept. Energy Dev. Norman Kettenbauer, GenPower Services John T. Long, Connemara Ltd. Richard P. Lopriore, PSEG Fossil LLC Jason Makansi, Pearl Street, Inc. George McClellan, Clean Coal Solutions Nancy Mohn, ALSTOM Betsy Monseu, American Coal Council Ram G. Narula Kenneth J. Nemeth, Southern States Energy Board Jerry J. Oliver, Global Tech Management Services Fredrick D. Palmer, Peabody Energy (retired) Robert M. Purgert, Energy Industries of Ohio Dawn Santoianni, Tau Technical Communications Mark Schoenfield, Jupiter Oxygen Corporation Deck Slone, Arch Coal Matt Usher, American Electric Power Jeff Wallace, Southern Company (retired) Gregory A. Workman, Dominion Resources
National Coal Council – Leveling the Playing Field
LEVELING THE PLAYING FIELD Policy Parity for Carbon Capture and Storage Technologies
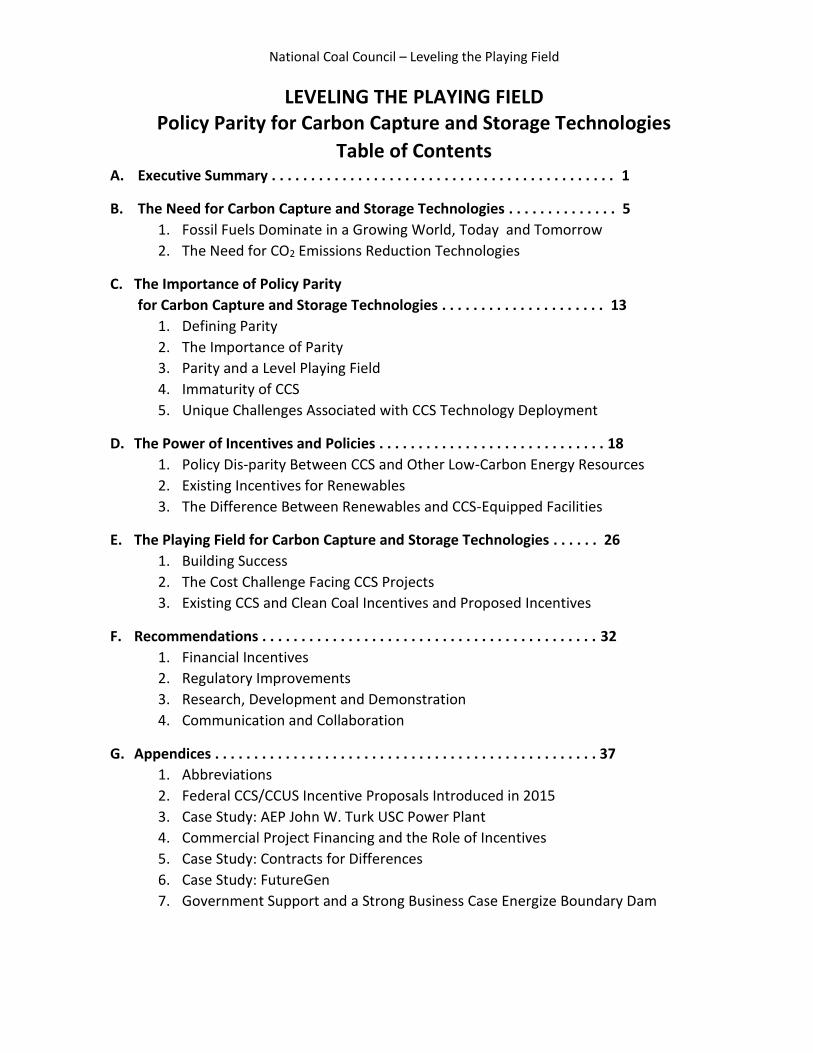
Table of Contents A. Executive Summary . . . . . . . . . . . . . . . . . . . . . . . . . . . . . . . . . . . . . . . . . . . . 1
B. The Need for Carbon Capture and Storage Technologies . . . . . . . . . . . . . . 5
1. Fossil Fuels Dominate in a Growing World, Today and Tomorrow
2. The Need for CO2 Emissions Reduction Technologies
C. The Importance of Policy Parity
for Carbon Capture and Storage Technologies . . . . . . . . . . . . . . . . . . . . . 13
1. Defining Parity
2. The Importance of Parity
3. Parity and a Level Playing Field
4. Immaturity of CCS
5. Unique Challenges Associated with CCS Technology Deployment
D. The Power of Incentives and Policies . . . . . . . . . . . . . . . . . . . . . . . . . . . . . 18
1. Policy Dis-parity Between CCS and Other Low-Carbon Energy Resources
2. Existing Incentives for Renewables
3. The Difference Between Renewables and CCS-Equipped Facilities
E. The Playing Field for Carbon Capture and Storage Technologies . . . . . . 26
1. Building Success
2. The Cost Challenge Facing CCS Projects
3. Existing CCS and Clean Coal Incentives and Proposed Incentives
F. Recommendations . . . . . . . . . . . . . . . . . . . . . . . . . . . . . . . . . . . . . . . . . . . 32
1. Financial Incentives
2. Regulatory Improvements
3. Research, Development and Demonstration
4. Communication and Collaboration
G. Appendices . . . . . . . . . . . . . . . . . . . . . . . . . . . . . . . . . . . . . . . . . . . . . . . . . 37
1. Abbreviations
2. Federal CCS/CCUS Incentive Proposals Introduced in 2015
3. Case Study: AEP John W. Turk USC Power Plant
4. Commercial Project Financing and the Role of Incentives
5. Case Study: Contracts for Differences
6. Case Study: FutureGen
7. Government Support and a Strong Business Case Energize Boundary Dam
National Coal Council – Leveling the Playing Field
1
LEVELING THE PLAYING FIELD
Policy Parity for Carbon Capture and Storage Technologies
A. Executive Summary
Federal energy and environmental policy has severely tilted the energy playing field. Secretary Moniz has requested the National Coal Council (NCC) make recommendations to level the playing field for carbon capture and storage (CCS) and provide "policy parity." Existing incentives for CCS are simply too small to “bridge the chasm” – as the NCC put it earlier this year – between the cost and risk of promising but immature CCS technologies and other technology alternatives. While CCS is commercially deployed in some industrial sectors and technically demonstrated at electric power plants, power generation with CCS remains expensive today compared to other technologies such as natural gas combined cycle (NGCC) or heavily subsidized renewables. The U.S. Department of Energy (DOE) has stewarded a successful research and development program to spur early development of CCS technologies, but without sufficient government support and incentives, commercial CCS deployment has lagged. Absent commercial-scale deployment, developers have no history to understand technical risks, frequency and duration of down time, and other critical factors that become known only with operation. Today, the world’s first and only operating commercial-scale power plant with CCS has successfully achieved a capture rate of 80% of the plant’s carbon dioxide (CO2), but has been unable to maintain that level of performance and has been operational just 40% of the time because of technical complications.1 With broad deployment, technological experience and confidence will rise, and costs will decline. Policy parity is essential to this progress. Coal and other fossil fuel use will keep rising globally as the world adds, per the United Nations, three billion more people to cities in the next 40 – 50 years.2 To achieve climate goals and address fossil emissions, the world must have CCS.3 Commercializing CCS requires a level playing field. Cross-functional experts within the NCC’s working groups have rigorously assessed the incentives and policies needed to level the playing field. There is consensus among them that the recommendations in this report will bring needed advances to development and deployment of CCS technologies. Other clean technologies have benefitted from substantial government support. In 1992 when Congress enacted the Section 45 renewable energy tax credit, the United States had less than 2,000 megawatts (MW) of installed wind generating capacity.4 Today there are 69,471 MW of installed wind capacity.5 Wind energy prices have dropped from more than $50 per-megawatt-hour (/MWh) in the late 1990s to less than half that cost in 2014.6 The industry credits government policy for its success: “With a two-thirds reduction in the cost of wind energy over the last six years, the renewable production tax credit (PTC) is on track to achieving its goal of a vibrant, self-sustaining wind industry.”7
National Coal Council – Leveling the Playing Field
2
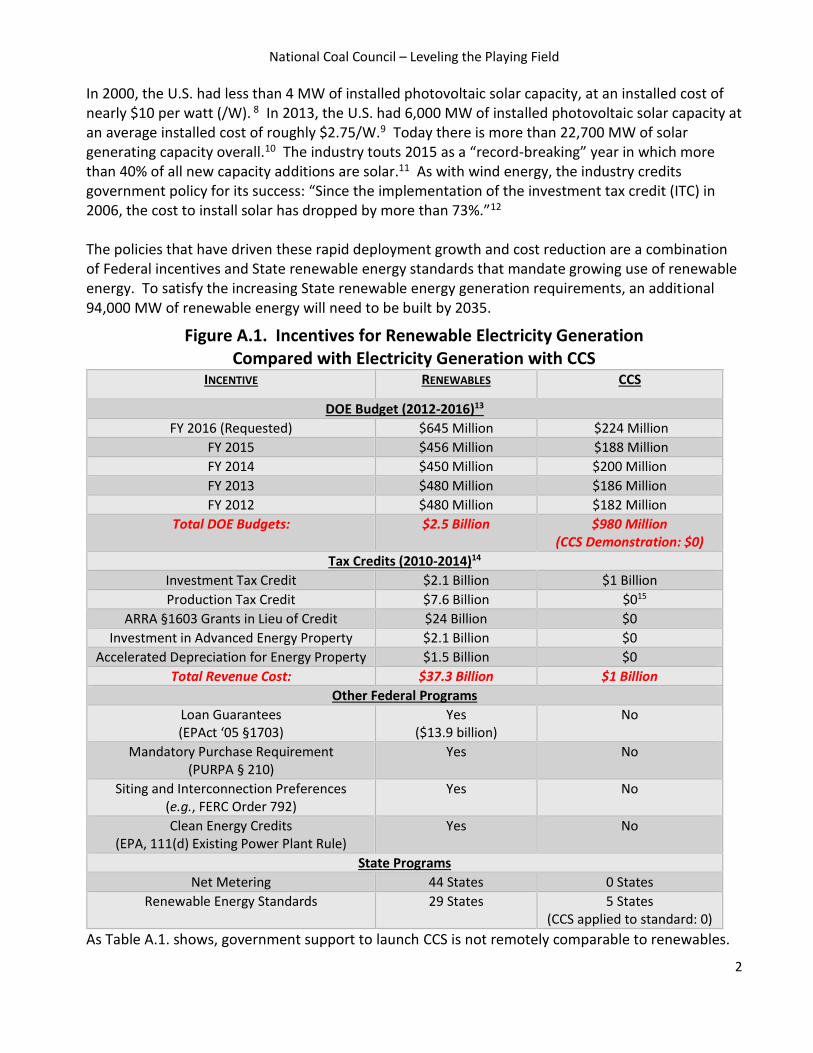
In 2000, the U.S. had less than 4 MW of installed photovoltaic solar capacity, at an installed cost of nearly $10 per watt (/W). 8 In 2013, the U.S. had 6,000 MW of installed photovoltaic solar capacity at an average installed cost of roughly $2.75/W.9 Today there is more than 22,700 MW of solar generating capacity overall.10 The industry touts 2015 as a “record-breaking” year in which more than 40% of all new capacity additions are solar.11 As with wind energy, the industry credits government policy for its success: “Since the implementation of the investment tax credit (ITC) in 2006, the cost to install solar has dropped by more than 73%.”12 The policies that have driven these rapid deployment growth and cost reduction are a combination of Federal incentives and State renewable energy standards that mandate growing use of renewable energy. To satisfy the increasing State renewable energy generation requirements, an additional 94,000 MW of renewable energy will need to be built by 2035.
Figure A.1. Incentives for Renewable Electricity Generation Compared with Electricity Generation with CCS
INCENTIVE RENEWABLES CCS
DOE Budget (2012-2016)13
FY 2016 (Requested) $645 Million $224 Million
FY 2015 $456 Million $188 Million
FY 2014 $450 Million $200 Million
FY 2013 $480 Million $186 Million
FY 2012 $480 Million $182 Million
Total DOE Budgets: $2.5 Billion $980 Million (CCS Demonstration: $0)
Tax Credits (2010-2014)14
Investment Tax Credit $2.1 Billion $1 Billion
Production Tax Credit $7.6 Billion $015
ARRA §1603 Grants in Lieu of Credit $24 Billion $0
Investment in Advanced Energy Property $2.1 Billion $0
Accelerated Depreciation for Energy Property $1.5 Billion $0
Total Revenue Cost: $37.3 Billion $1 Billion
Other Federal Programs
Loan Guarantees (EPAct ‘05 §1703)
Yes ($13.9 billion)
No
Mandatory Purchase Requirement (PURPA § 210)
Yes No
Siting and Interconnection Preferences (e.g., FERC Order 792)
Yes No
Clean Energy Credits (EPA, 111(d) Existing Power Plant Rule)
Yes No
State Programs
Net Metering 44 States 0 States
Renewable Energy Standards 29 States 5 States (CCS applied to standard: 0)
As Table A.1. shows, government support to launch CCS is not remotely comparable to renewables.
National Coal Council – Leveling the Playing Field
3
A decade from today, it will be agreed that the incentives which proved effective in leveling the playing field for CCS technology deployment were those which enabled project financing to occur. These fall into two categories: those which provide up-front financial support for projects, and those which assure guaranteed revenue over the life of projects. In its January 2015 report, Fossil Forward: Revitalizing CCS – Bringing Scale and Speed to CCS Deployment,16 the NCC recommended policy parity for CCS. In September, Secretary of Energy Moniz requested the NCC report on policy parity measures that would level the playing field for CCS. Among other specific recommendations, this report calls for the following:
Financial Incentives – Financial incentives for CCS must be substantially increased and broadened to include incentives available to other clean energy sources. Up-front incentives that reduce risk to capital should be emphasized, and designed with a recognition – as with wind and solar in the 1990s – that CCS is an immature technology with up-front risks and high initial capital costs. Operating incentives are important to assure a steady long-term revenue stream and lessen direct costs to consumers. Both types of incentives are needed and are central to “policy parity.” Among the specific recommendations are the following:
o Establish a “contracts for differences” (CFD) structure, one permitted under Federal
law, to offer developers a menu of incentives to be provided by the government for
competitively selected projects. The CFD structure may be the single most important
mechanism to spur CCS development and deployment, but only if the incentives
underlying it are sufficient.
o Enhance DOE grants to increase the portion of the cost assumed by DOE to address the elevated capital costs of CCS projects.
o Provide an electricity production tax credit consistent with that for renewables.
o Provide for investment tax credits.
o Guarantee purchase of electricity output with CCS to assure future revenue.
o Establish a market set-aside for CCS, similar to State renewable energy requirements,
implemented Federally through the existing structure of State programs.
National Coal Council – Leveling the Playing Field
4
Regulatory Improvements – A first-of-its-kind regulatory (FOAK) blueprint is needed to remove barriers to the construction and development of projects with CCS. This blueprint would be applicable to facilities for carbon capture (e.g., industrial facilities such as power stations), transportation, and injection. Given its charter and expertise, DOE is central to the development of this blueprint with sister agencies, which would include such elements as:
o Streamlining siting and other permitting requirements for facilities necessary to a CCS
project, including capture facilities, pipelines, and storage facilities.
o Addressing uncertainty created by regulations, such as New Source Review (NSR) under the Clean Air Act, that might be triggered should retrofits or other expensive changes to existing power plants be made when installing carbon capture equipment.
o Easing the new burden faced by enhanced oil recovery (EOR) operators under the
111(d) existing power plant and 111(b) new power plant rules to facilitate the use of “regulated” CO2.
Research Development & Demonstration – DOE must be a catalyst for additional commercial-scale demonstration projects, and such projects must commence immediately. The NCC remains firm in its belief that our national objective should be 5-10 gigawatts (GW) of commercial-scale projects in operation by 2025. Projects must be in development stage promptly in order to achieve this goal. To be such a catalyst, DOE must identify for Congress a menu of incentives needed to mobilize project developers with funding mechanisms for commercial-scale CCS projects. Existing incentives have not been sufficient.
Communication and Collaboration – DOE needs to assure that U.S. and global policy makers and others firmly understand both that fossil fuels will be used in coming decades to a greater extent than today, and that there is a resulting need for CCS. DOE also should initiate international collaboration to support the prompt deployment of 5-10 GW of commercial scale demonstrations in addition to U.S. deployment.
National Coal Council – Leveling the Playing Field
5
B. The Need for Carbon Capture and Storage Technologies Meeting global CO2 emission reduction goals requires our expeditious deployment of CO2 technologies for fossil. That deployment will be advanced by incentives and policies to level the playing field for CCS. The commercial deployment of a suite of carbon reduction technologies is essential to worldwide efforts to reduce CO2. These technologies:
Provide the most impactful opportunity to capture, use, and store a significant volume of CO2 from fossil fuels. The technologies can be used to reduce CO2 emissions from electric generation as well as from key industrial sectors, including cement production, iron and steel making, oil refining, and chemicals manufacturing.
Maintain electric reliability by providing baseload generation. Baseload power is the “always on” power that enables the grid to maintain voltage, frequency, and other attributes essential to reliable power supply.
Significantly reduce the costs of decarbonization.17 Not including CCS as a key mitigation technology is projected to increase the overall costs of meeting CO2 emissions goals by 70% to 138%. 18
Preserve the economic value of fossil fuel reserves and associated infrastructure while undertaking strong actions necessary to mitigate climate change.19
In January 2015, the NCC noted in its study Fossil Forward - Revitalizing CCS that in order to achieve CCS deployment at commercial scale, policy parity for CCS with other low carbon technologies and options is required. The NCC recommended to Secretary of Energy Moniz that DOE take a stronger position on the need for policy parity with respect to funding allocations. This white paper is presented in response to Secretary Moniz’s follow-on request for recommendations on measures that can be undertaken by DOE to level the playing field for CCS and other low carbon coal technologies, providing market, operational, financial, and regulatory parity with other clean energy resources. Reducing carbon emissions from fossil fuels can have far more impact on atmospheric CO2 concentrations than building renewables because of the scale of emissions involved from fossil units and the direct CO2 emissions reductions that result. By contrast, CO2 emissions avoided through new renewable generation capacity are constrained by renewables’ smaller scale, the intermittency of wind and solar generation leading to lower capacity factors, the need for fossil load-following generation, and the fact that renewables displace existing grid power even in places where the generation mix is already less carbon intensive. Policy parity is critical to achieving carbon reduction objectives by moving more quickly toward the goal of deploying affordable, low carbon technologies. Advancing CCS and carbon management technologies should be viewed not as a subsidy for coal, but as a low carbon solution.
National Coal Council – Leveling the Playing Field
6
Policy initiatives must provide positive economic signals for CCS technology deployment. Policies that disadvantage fossil fuels have had a suppressing effect on deploying CCS technologies in a world that continues and will continue to rely on fossil energy resources for many years to come. 1. Fossil Fuels Dominate in a Growing World, Today and Tomorrow Globally, the vast majority of energy is supplied by fossil fuels. In 2014, 87% of global primary energy consumption was supplied by fossil fuels – primarily oil, followed by coal and natural gas.20 According to the BP Statistical Review, “coal remains – by far – the most abundant fossil fuel by reserve/production ratio.”21 The BP Energy Outlook 2035 notes that population growth and increases in income-per-person are the key drivers behind growing demand for energy. 22 By 2035, the world’s population is projected to reach 8.7 billion, which means an additional 1.6 billion people – five times the population of the United States – will need energy. Globally, gross domestic product (GDP)-per-person in 2035 is expected to be 75% higher than today, with China and India driving growth among non-OECD nations. By 2035, China and India will be the world’s largest and third largest economies respectively, jointly accounting for about one-third of global population and GDP.
Primary energy consumption is projected to increase by 37% between 2013 and 2035, with virtually all of the projected growth (96%) in the non-Organisation for Economic Co-operation and Development (OECD) nations. Power generation is expected to account for an ever-increasing share of that primary energy consumption, reflecting the global trend toward increased electrification. Globally, 44% of electricity is provided by coal. BP projects that coal will remain the dominant fuel
for power generation worldwide in 2035, accounting for more than one-third of electricity
production.23 In the ASEAN region alone, according to the International Energy Agency’s (IEA) recent
special report on Southeast Asia, coal demand will triple between 2011 and 2035, with coal’s share
of power generation increasing to almost 50%.24
National Coal Council – Leveling the Playing Field
7
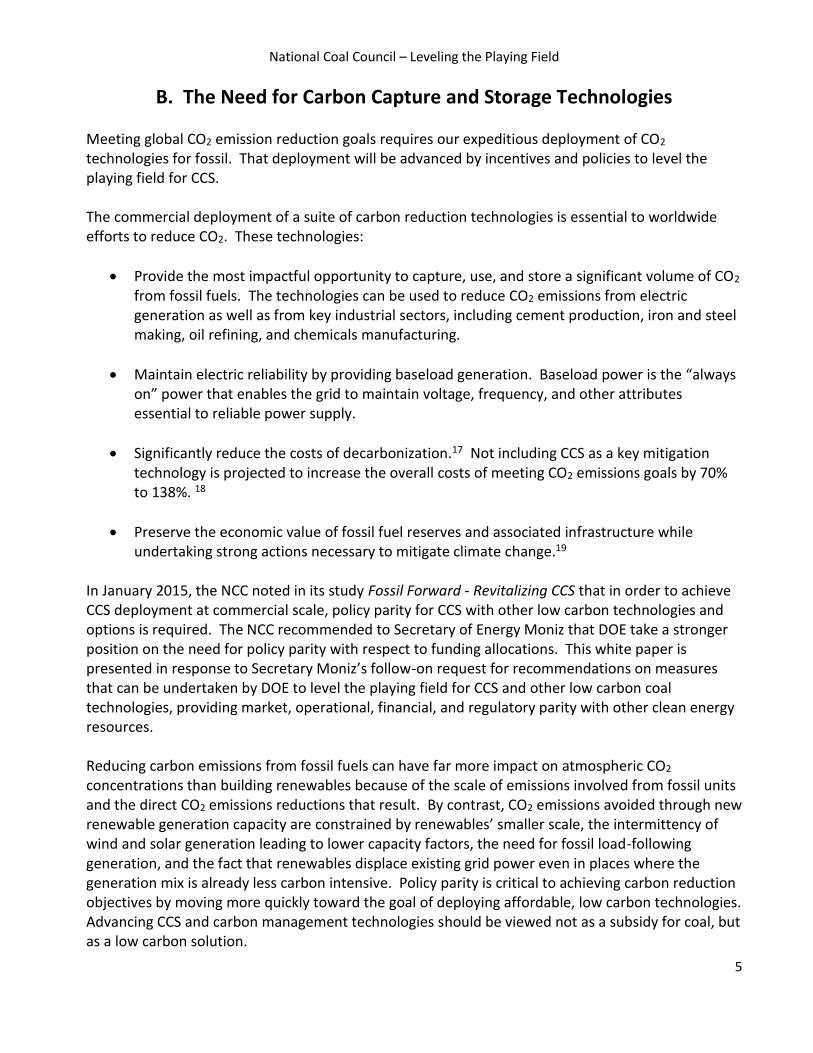
Figure B.1. World Energy Consumption: OECD vs. non-OECD
Source: Energy Information Administration
Another fossil fuel, natural gas, will also experience growth during this period. Global natural gas demand is expected to grow by 1.9% per year (2013-2035), driven by non-OECD demand of 2.5% per year. Increased usage by the power and industrial sectors will account for over 80% of total natural gas demand growth. The foregoing emphasizes that U.S. and international policy must be built on an appreciation that coal and other fossil fuels are an indispensable – not optional – component of world energy supply for the foreseeable future. Since fossil fuels will remain the world’s dominant source of primary energy for decades to come, if we are serious about addressing CO2 emissions from fossil fuels we must support technological solutions. As Howard J. Herzog, Senior Research Engineer at the Massachusetts Institute of Technology so emphatically states it: “There are many uncertainties with respect to global climate change, but there is one thing about which I have no doubts: we will not solve climate change by running out of fossil fuels.”25 2. The Need for CO2 Emissions Reduction Technologies In light of the recent growth of fossil-fueled power plants in international markets, especially in non-OECD nations, achieving the goal of reducing CO2 emissions will clearly require the deployment of CO2 reduction technologies worldwide. Globally there are 510 coal power plant units under construction, with a further 1,874 planned; a total of 2,384 units.
National Coal Council – Leveling the Playing Field
8
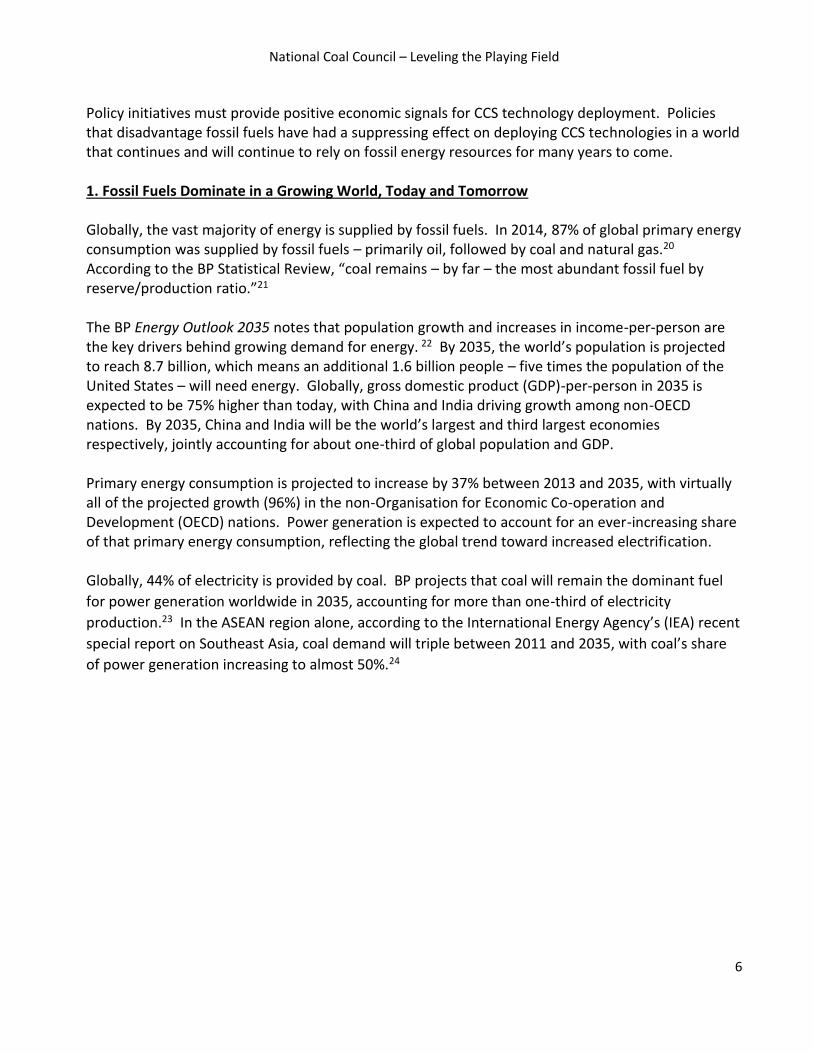
China alone is bringing online an average of 500 MW of new coal capacity per week through 2030, an average of a new coal-fired plant every 7 to 10 days. The equivalent of the entire U.S. coal fleet was built between 2005-09 – more than 500 coal plants of 600 MW. From 2010 to 2013, China added the equivalent of half the U.S. coal fleet, plus another 39 GW in 2014. China is predicted to add another U.S.-worth of coal capacity over the next decade, or the equivalent of one 600 MW plant every 10 days. By 2040, its coal-fired power fleet is expected to be 50% larger than it is today and these plants typically operate for 40 years or more. Today China consumes more than 4 billion tons of coal annually, compared to less than 1 billion tons in the U.S. and 600 million tons in the European Union (EU). China is not alone. BP’s Energy Outlook 2035 predicts that CO2 emissions from coal use will increase in India by 360 million tons by 2035. ASEAN countries also are expected to increase coal use significantly, far outstripping projected modest coal use reductions in the U.S. and Europe.
Figure B.2. Installed Coal-fueled Generation Capacity
Source: World Coal Association
These recently-built fossil fuel plants, which will continue to operate over a projected lifetime of 40-60 years, as well as more mature plants still years away from retirement, constitute overwhelming evidence that CCS must be part of the path to reducing atmospheric CO2 emissions. Here in the United States, CO2 reduction technology deployment will similarly be necessary to achieve CO2 emissions reduction policy goals. Coal provided fuel for 18.5% of total U.S. energy consumption and 43% of U.S. electric power generation in 2013. In 2014, the U.S. coal fleet totaled 300 GW of capacity (28% of U.S. total generating capacity) and 1,586 million megawatt hours (MWh) of generation (39% of U.S. total).26
National Coal Council – Leveling the Playing Field
9
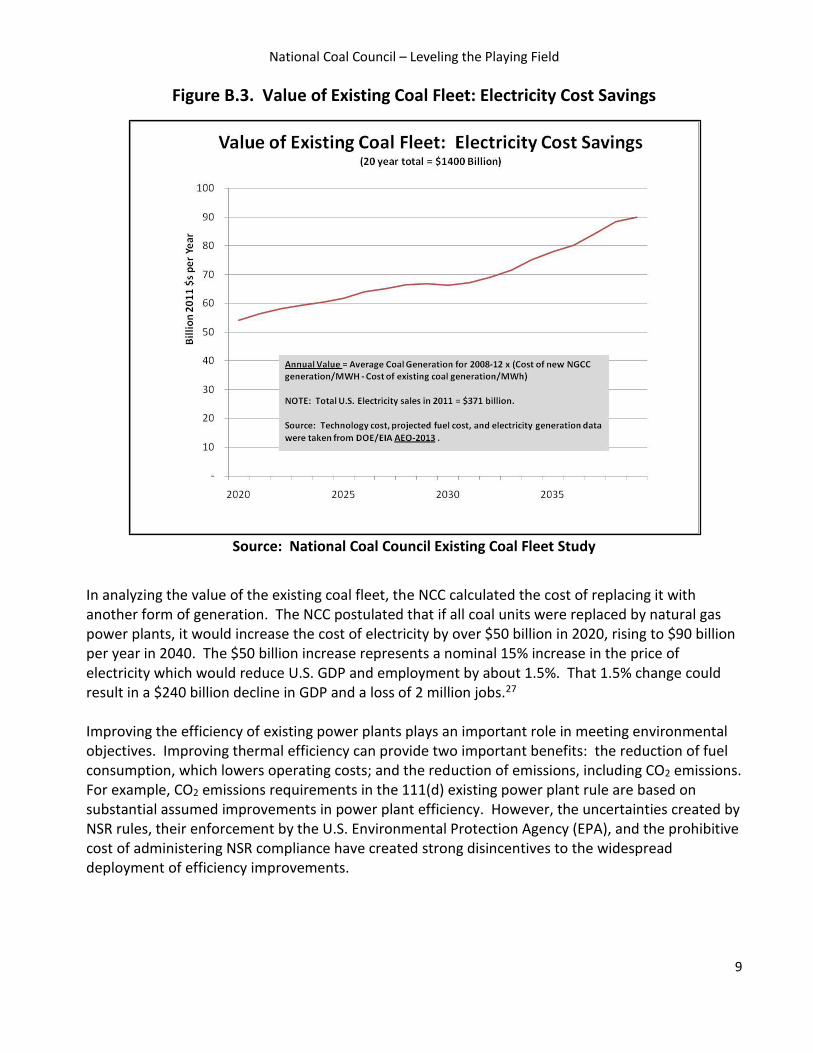
Figure B.3. Value of Existing Coal Fleet: Electricity Cost Savings
Source: National Coal Council Existing Coal Fleet Study
In analyzing the value of the existing coal fleet, the NCC calculated the cost of replacing it with another form of generation. The NCC postulated that if all coal units were replaced by natural gas power plants, it would increase the cost of electricity by over $50 billion in 2020, rising to $90 billion per year in 2040. The $50 billion increase represents a nominal 15% increase in the price of electricity which would reduce U.S. GDP and employment by about 1.5%. That 1.5% change could result in a $240 billion decline in GDP and a loss of 2 million jobs.27 Improving the efficiency of existing power plants plays an important role in meeting environmental objectives. Improving thermal efficiency can provide two important benefits: the reduction of fuel consumption, which lowers operating costs; and the reduction of emissions, including CO2 emissions. For example, CO2 emissions requirements in the 111(d) existing power plant rule are based on substantial assumed improvements in power plant efficiency. However, the uncertainties created by NSR rules, their enforcement by the U.S. Environmental Protection Agency (EPA), and the prohibitive cost of administering NSR compliance have created strong disincentives to the widespread deployment of efficiency improvements.
National Coal Council – Leveling the Playing Field
10
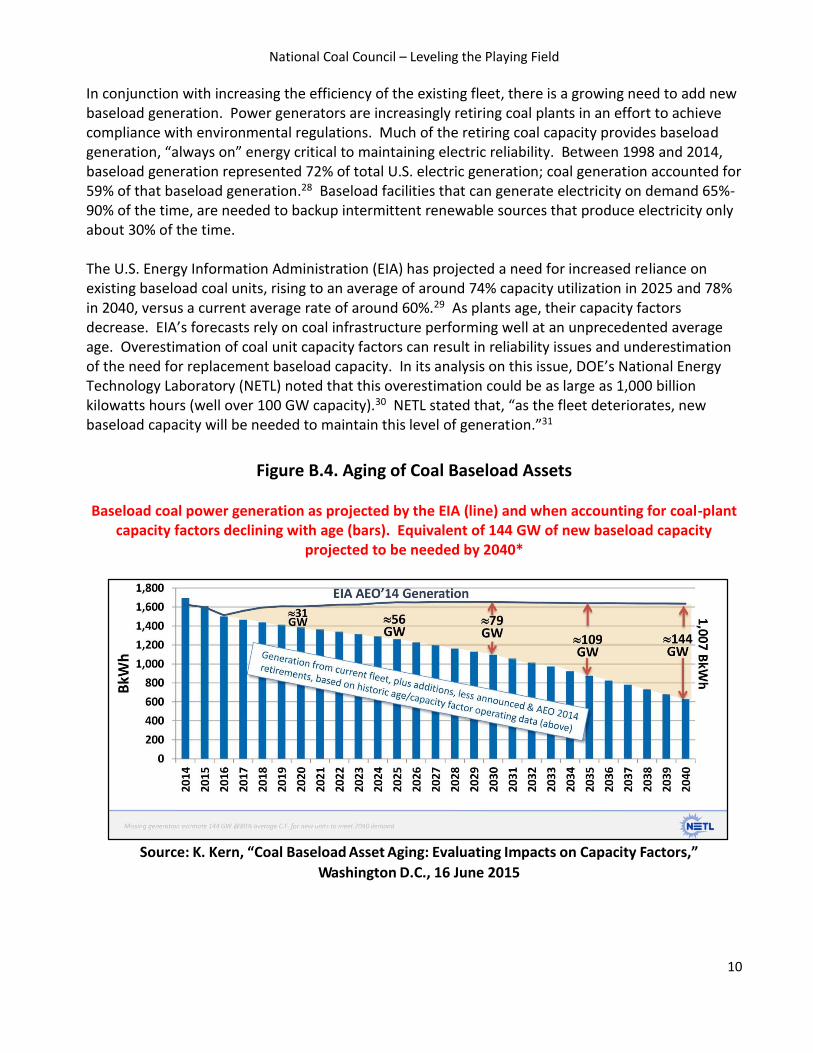
In conjunction with increasing the efficiency of the existing fleet, there is a growing need to add new baseload generation. Power generators are increasingly retiring coal plants in an effort to achieve compliance with environmental regulations. Much of the retiring coal capacity provides baseload generation, “always on” energy critical to maintaining electric reliability. Between 1998 and 2014, baseload generation represented 72% of total U.S. electric generation; coal generation accounted for 59% of that baseload generation.28 Baseload facilities that can generate electricity on demand 65%-90% of the time, are needed to backup intermittent renewable sources that produce electricity only about 30% of the time. The U.S. Energy Information Administration (EIA) has projected a need for increased reliance on existing baseload coal units, rising to an average of around 74% capacity utilization in 2025 and 78% in 2040, versus a current average rate of around 60%.29 As plants age, their capacity factors decrease. EIA’s forecasts rely on coal infrastructure performing well at an unprecedented average age. Overestimation of coal unit capacity factors can result in reliability issues and underestimation of the need for replacement baseload capacity. In its analysis on this issue, DOE’s National Energy Technology Laboratory (NETL) noted that this overestimation could be as large as 1,000 billion kilowatts hours (well over 100 GW capacity).30 NETL stated that, “as the fleet deteriorates, new baseload capacity will be needed to maintain this level of generation.”31
Figure B.4. Aging of Coal Baseload Assets Baseload coal power generation as projected by the EIA (line) and when accounting for coal-plant
capacity factors declining with age (bars). Equivalent of 144 GW of new baseload capacity projected to be needed by 2040*
Source: K. Kern, “Coal Baseload Asset Aging: Evaluating Impacts on Capacity Factors,”
Washington D.C., 16 June 2015
National Coal Council – Leveling the Playing Field
11
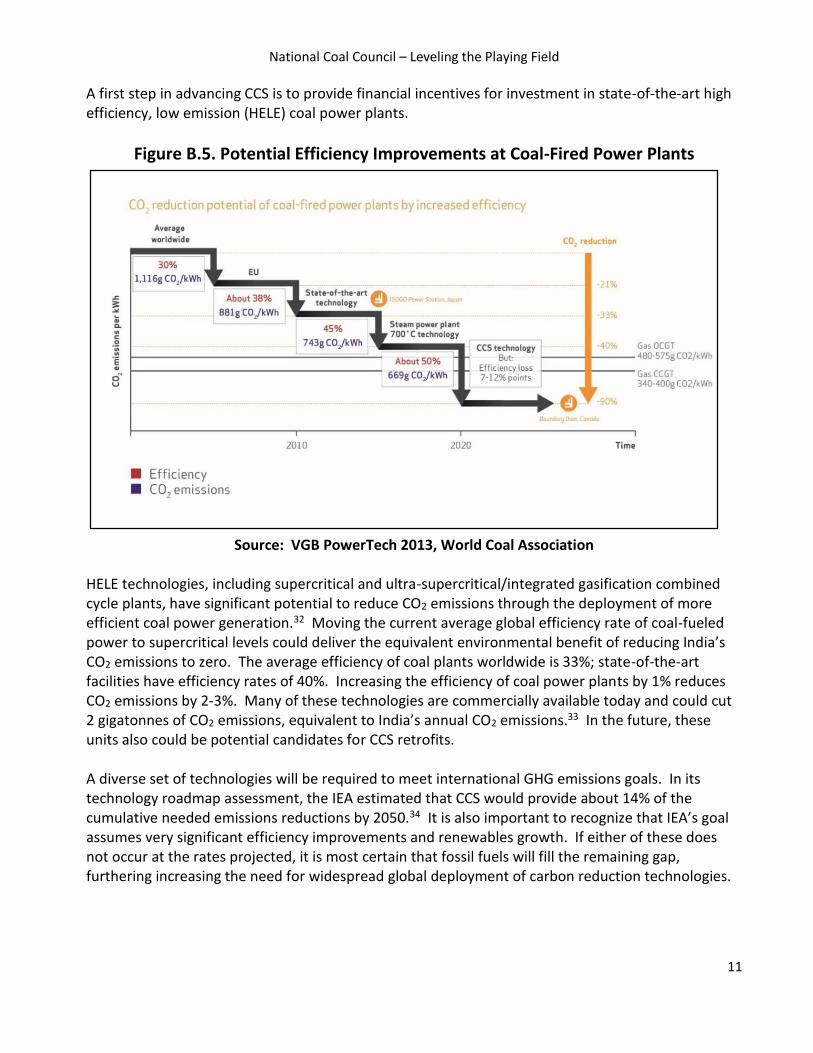
A first step in advancing CCS is to provide financial incentives for investment in state-of-the-art high efficiency, low emission (HELE) coal power plants.
Figure B.5. Potential Efficiency Improvements at Coal-Fired Power Plants
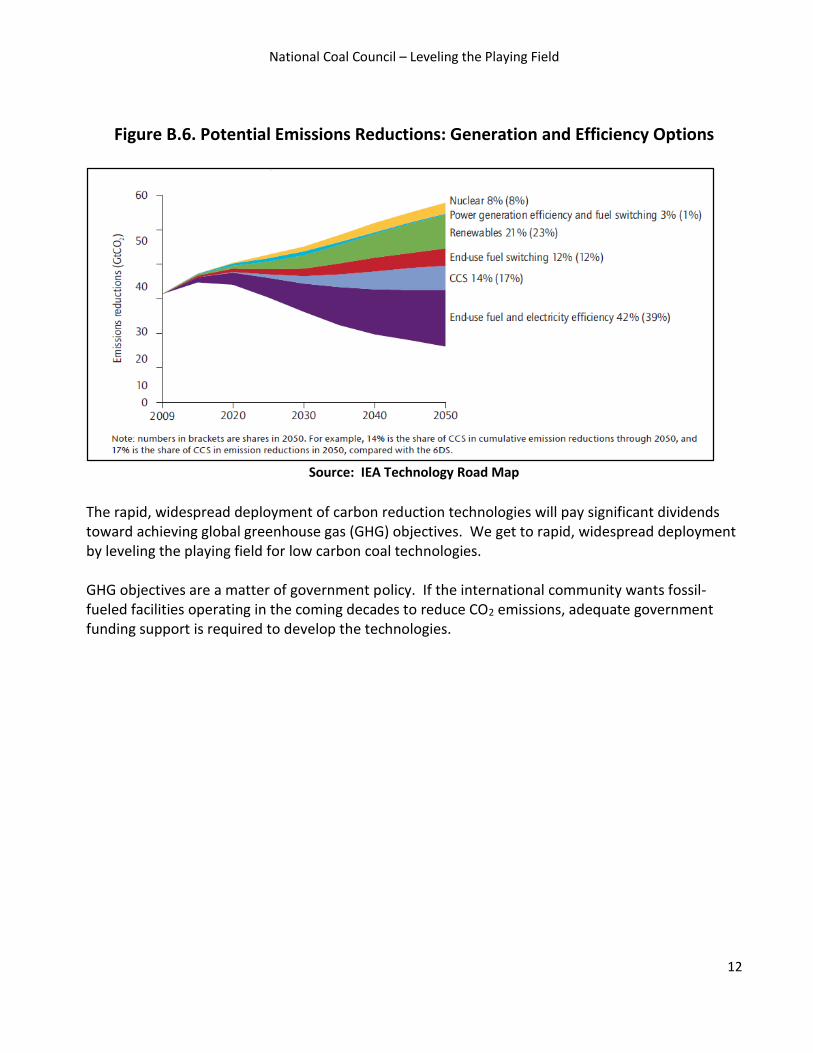
Source: VGB PowerTech 2013, World Coal Association HELE technologies, including supercritical and ultra-supercritical/integrated gasification combined cycle plants, have significant potential to reduce CO2 emissions through the deployment of more efficient coal power generation.32 Moving the current average global efficiency rate of coal-fueled power to supercritical levels could deliver the equivalent environmental benefit of reducing India’s CO2 emissions to zero. The average efficiency of coal plants worldwide is 33%; state-of-the-art facilities have efficiency rates of 40%. Increasing the efficiency of coal power plants by 1% reduces CO2 emissions by 2-3%. Many of these technologies are commercially available today and could cut 2 gigatonnes of CO2 emissions, equivalent to India’s annual CO2 emissions.33 In the future, these units also could be potential candidates for CCS retrofits. A diverse set of technologies will be required to meet international GHG emissions goals. In its technology roadmap assessment, the IEA estimated that CCS would provide about 14% of the cumulative needed emissions reductions by 2050.34 It is also important to recognize that IEA’s goal assumes very significant efficiency improvements and renewables growth. If either of these does not occur at the rates projected, it is most certain that fossil fuels will fill the remaining gap, furthering increasing the need for widespread global deployment of carbon reduction technologies.
National Coal Council – Leveling the Playing Field
12
Figure B.6. Potential Emissions Reductions: Generation and Efficiency Options
Source: IEA Technology Road Map
The rapid, widespread deployment of carbon reduction technologies will pay significant dividends toward achieving global greenhouse gas (GHG) objectives. We get to rapid, widespread deployment by leveling the playing field for low carbon coal technologies. GHG objectives are a matter of government policy. If the international community wants fossil-fueled facilities operating in the coming decades to reduce CO2 emissions, adequate government funding support is required to develop the technologies.
National Coal Council – Leveling the Playing Field
13
C. The Importance of Policy Parity For Carbon Capture and Storage Technologies
1. Defining Parity CCS needs policies recognizing it as a still immature, not commercially available carbon reduction
technology. These policies need to account both for cost factors and still uncertain technical
performance risk.
In reviewing government programs below, we emphasize that two incentive programs might cost government the same amount, yet bear no comparison for “parity” sake. A $1 billion government incentive that buys market share for a mature technology said to be as cheap as competing sources35 is not the same as a $1 billion incentive needed to deploy and test expensive, FOAK emerging technology at commercial scale. Intensified assistance is needed to develop immature CCS technologies into successful proven ones, much as policy makers provided for renewables in the 1990s. CCS will need continued assistance for years thereafter, because of the need for parity, if fossil with CCS is required to compete with mature subsidized technologies.36 2. The Importance of Parity Policy parity is important to meeting the diverse set of U.S. energy policy objectives. Those objectives have consistently focused on providing a reliable, secure, and low-cost supply of energy, and in recent years have increasingly directed energy production and consumption toward environmental objectives. CCS is essential to meeting those environmental objectives. Policy parity for CCS will have the added benefit of ensuring that we preserve other critical features of our energy system – such as fuel diversity and reliability – while we fulfill our nation’s environmental obligations.
Reliability is priority one. Reliable power is not just a matter of convenience. Electric service must be reliable to ensure the health and safety of our nation’s citizens. Diversity enhances reliability.
A diverse source of electricity provides an insurance policy against operational malfunctions and security breaches.
Diversity also provides a hedge against monopolistic or volatile pricing of any one source of power, which is why utilities, regulators and customers advocate for diversity.
Baseload sources are especially critical to maintaining a diverse generation portfolio that can meet environmental performance goals. The value and operating ability of intermittent renewables is greatly diminished without the backstop support of reliable “always on” generation.
National Coal Council – Leveling the Playing Field
14
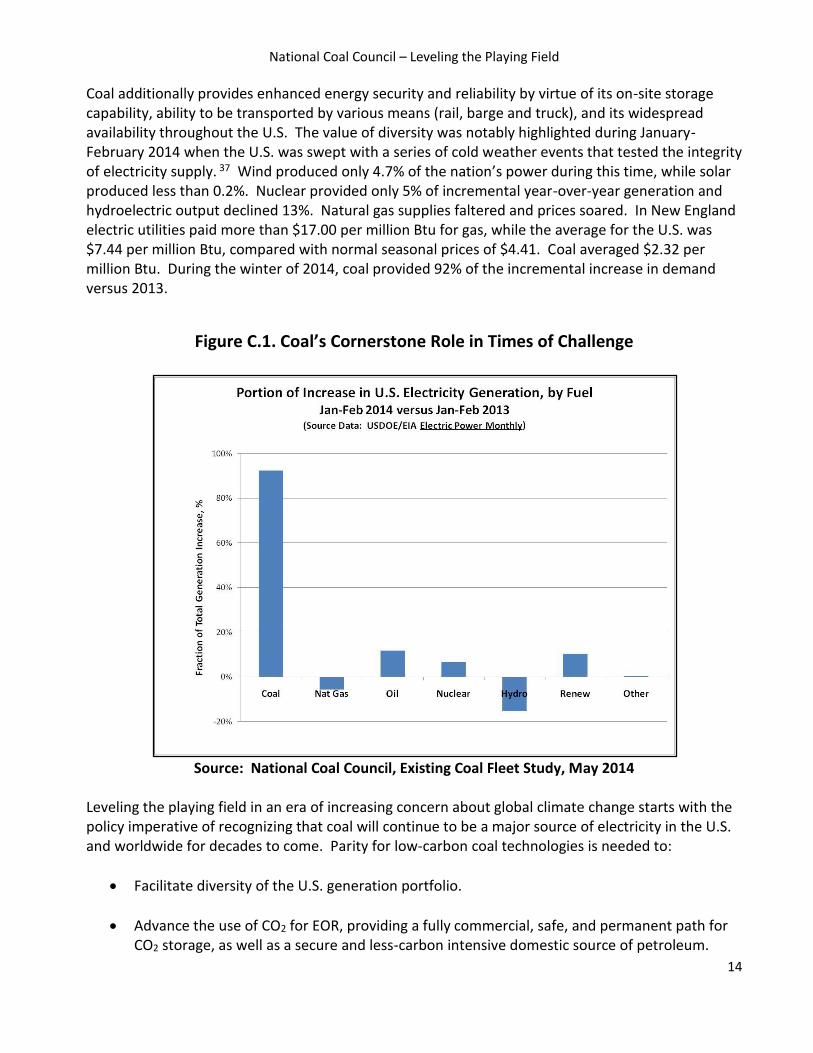
Coal additionally provides enhanced energy security and reliability by virtue of its on-site storage capability, ability to be transported by various means (rail, barge and truck), and its widespread availability throughout the U.S. The value of diversity was notably highlighted during January-February 2014 when the U.S. was swept with a series of cold weather events that tested the integrity of electricity supply. 37 Wind produced only 4.7% of the nation’s power during this time, while solar produced less than 0.2%. Nuclear provided only 5% of incremental year-over-year generation and hydroelectric output declined 13%. Natural gas supplies faltered and prices soared. In New England electric utilities paid more than $17.00 per million Btu for gas, while the average for the U.S. was $7.44 per million Btu, compared with normal seasonal prices of $4.41. Coal averaged $2.32 per million Btu. During the winter of 2014, coal provided 92% of the incremental increase in demand versus 2013.
Figure C.1. Coal’s Cornerstone Role in Times of Challenge
Source: National Coal Council, Existing Coal Fleet Study, May 2014
Leveling the playing field in an era of increasing concern about global climate change starts with the policy imperative of recognizing that coal will continue to be a major source of electricity in the U.S. and worldwide for decades to come. Parity for low-carbon coal technologies is needed to:
Facilitate diversity of the U.S. generation portfolio.
Advance the use of CO2 for EOR, providing a fully commercial, safe, and permanent path for CO2 storage, as well as a secure and less-carbon intensive domestic source of petroleum.
National Coal Council – Leveling the Playing Field
15
Incent the deployment of CCS technologies for use by all fossil fuels in power generation and industrial applications.
Encourage the deployment of polygeneration and coal conversion facilities that domestically produce transportation fuels, chemicals, fertilizers, and other commodities.
Advance environmental performance of CCS while reducing the cost of electricity by 40% compared with new coal power plants built with today’s CCS technology.38
Ensure that advanced baseload coal plants with CCS are available once existing baseload units are retired.
Support compliance with environmental objectives for CO2 reductions from existing and new power plants.
3. Parity and a Level Playing Field CCS is the only technology that can substantially reduce CO2emissions from “always on” baseload power generation from secure fossil resources, domestically and internationally. It is also the only technology with applicability to the existing electric generating fleet as well as industrial sources, addressing both international emission goals and the imperative of electric reliability. There can be no true parity with a one-of-a-kind technology. The policy need at issue is to catalyze the rapid deployment of CCS to facilitate low-carbon fossil-fueled generation. For the purposes of discussion, we will discuss parity for CCS in comparison with other low-carbon energy resources – renewables – whose successful and rapidly increasing deployment in recent years is attributable to policy intervention. A metaphorical playing field is said to be level if no external interferences affect the ability of the players to compete fairly. Policies that disproportionately advantage one resource and erect hurdles for others impede our nation’s economic and environmental objectives while imposing undue hardship on our citizens. Incentives for renewables will persist. CCS, which has greater carbon reduction significance but is not yet commercially available in the power sector, requires additional policy support in order to level the playing field. 4. Immaturity of CCS Policymakers justify incentives on the basis that a favored technology has not yet reached maturity. Many incentives for renewables are quite recent, being employed well after those technologies achieved maturity and became commercially available. Tax credits extended to the wind and solar industries in the U.S. were intended to promote the installation of these technologies by buying down the cost of market penetration. Yet, State and Federal policies already mandate markets for wind and solar, and tax incentives subsidized compliance with those mandates.

National Coal Council – Leveling the Playing Field
16
By comparison, many carbon reduction technologies, including CCS, are in their early stages of development and are highly complex in nature, entailing significant technical and financial risk for developers and investors. The risk profiles of building a 10 MW photovoltaic facility versus a 500 MW supercritical coal power plant with CCS are significantly different. CCS systems entail much higher cost, have not been demonstrated on commercial scale in the power sector, and bind power production with back-end (i.e., transportation and storage) processes that likely will be beyond the generator’s fence line and control. These and other challenges unique to CCS support the need for policy incentives, which if properly designed will result in CO2 emission reductions, even as the use of fossil fuels increases.
Figure C.2. Energy Technology Development Spectrum to Commercialize Technology
Source: National Coal Council, Fossil Forward Study
Cart-before-horse policies that appear to be mandating CCS technologies (i.e., EPA’s 111(d) existing power plant and 111(b) new power plant rules) will not incent CCS development or deployment. People will turn instead to mature alternatives. CCS needs policies recognizing it as a still immature, not commercially available carbon reduction technology. These policies need to account both for cost factors and still uncertain technical performance risk.
National Coal Council – Leveling the Playing Field
17
5. Unique Challenges with Carbon Capture and Storage Technology Deployment Development and deployment of CCS technologies present numerous unique challenges as detailed in the NCC’s January 2015 report for Secretary Moniz, Fossil Forward – Revitalizing CCS.
Capital and operating costs for projects with CCS are more expensive than conventional technologies and carry great technological and commercial risk. Project risks include financing, permitting, public acceptance, cost overruns, schedule delays, performance, environmental compliance, operational flexibility, storage, and long-term liability.
Pioneering FOAK projects typically include a more rigorous investment due diligence process that is conducted during the front end engineering and design study and final investment decision stages, which can significantly add time and complexity to project schedules.
The main challenges for power generation with CCS include high cost (e.g., capital and operating costs, which influence project financing), large scale integration, access to suitable storage sites and high energy requirements (called the “energy penalty”) to run the capture unit, including CO2 compression.
Power plants or polygeneration facilities operating in deregulated electricity markets must account for additional time and complexity of negotiating power purchase agreements (PPA) and other offtake contracts (e.g., CO2, urea).
Unlike earlier DOE-funded clean coal projects that demonstrated technologies such as SOx or mercury control, the central technologies being demonstrated for CCS are not ancillary to power plant operation and must be fully integrated to achieve reasonable cost and performance.
The technical risk of earlier DOE-funding demonstrations of environmental control technologies was not as great. With integrated CCS demonstrations, the central technologies must operate in order for the plant to function and to generate revenue for commercial operation. Thus, the developer has both a technological risk and a financial risk.
Acknowledging the unique attributes of the various energy resources and their associated unique challenges can help guide the crafting of policies and incentives that maximize beneficial use of our nation’s fossil, nuclear, and renewable resources. An appreciation of the policy dis-parities among energy resources is also instructive.
National Coal Council – Leveling the Playing Field
18
D. The Power of Incentives and Policies 1. Policy Dis-parity Between CCS and Other Low-Carbon Energy Resources Policy parity for CCS must be measured against other low-carbon energy resources. Earlier this year, EIA produced a report valuing subsidies and incentives provided to various forms of energy.39 That report evaluated those subsidies targeted at energy, provided by the Federal government, and with an identifiable Federal budget impact were included. The report did not evaluate the impact of all subsidies. For example, the value of State renewable electricity mandates, which mandate that a percentage of electricity sold be produced from renewable sources, were not part of the study. The EIA report shows the single largest recipient category of Federal energy subsidies is, by far, renewables. Confining the discussion to electricity subsidies, where renewables and coal compete (i.e., screening out subsidies for vehicle fuels), in 2013 renewables received more than 12 times the subsidies as received for coal – $13.227 billion for renewables, and just $1.085 billion for coal. EIA reported that renewables received 72% of total subsidies while coal received just 6%. Conversely, support for renewables (i.e., solar, wind, biomass, geothermal, and hydro) has increased from 14.9% in 2007 vs. 72% in 2013. Support for wind alone increased from 10.7% (2007) to 37% (2013); support for solar alone increased from 0.2% (2007) to 27% (2013). Coal’s share of support has declined significantly from 12.7% in 2007 to 6% in 2013. Even these numbers do not accurately capture the extent of the dis-parity between Federal support for renewables and coal. Only $40 million of the total for coal went to a direct credit for production of electricity, and then only for coal produced from refined coal or Indian coal facilities. At the same time, renewable electricity received a direct production tax credit of $1.63 billion, more than 40 times the support provided to coal. Moreover, the subsidy for electricity from renewables is so large that it has enabled renewable energy producers to sell into energy markets at a negative price, which in deregulated markets can have the effect of reducing market prices for non-subsidized fuels – i.e., fossil and nuclear.
In March 2015, the Congressional Research Service (CRS) released a report assessing the value of
energy tax credits for various fuel resources.40 CRS notes that in 2013, the value of Federal tax-
related support for the energy sector was estimated to be $23.3 billion, of which $13.4 billion
(57.4%) supports renewable energy and $4.8 billion (20.4%) supports fossil fuels. In 2014, tax
incentives for renewables constituted an estimated 53% of the estimated total revenue loss
associated with energy tax provisions; revenue losses associated with fossil fuels-related tax
incentives were 27%. The CRS report shows that in both years the investment tax credit for clean
coal facilities did not exceed $200 million.
National Coal Council – Leveling the Playing Field
19
Figure D.1. Public Policy Drives Investment
Source: Carbon Capture and Storage: Perspective from the IEA
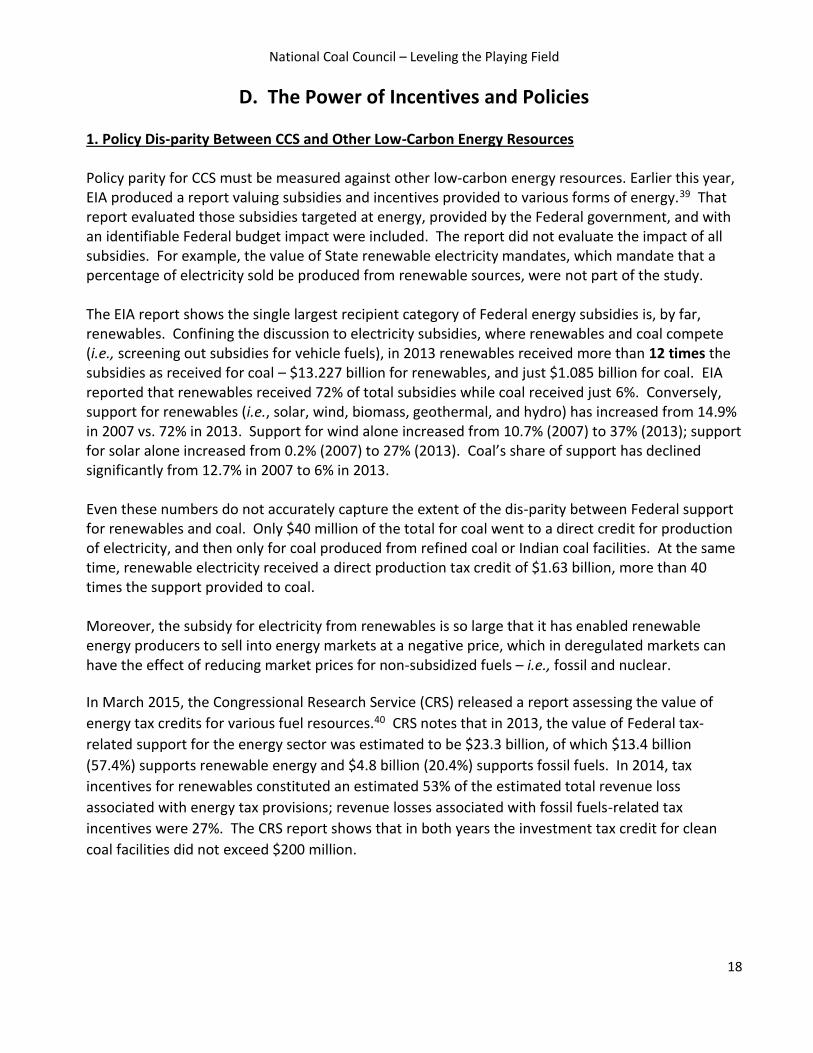
Ellina Levina, Sydney Australia, September 2, 2014 The CRS report also notes, “While the cost of tax incentives for renewables has exceeded the cost of incentives for fossil fuels in recent years, the majority of energy produced in the United States continues to be derived from fossil fuels.” In 2013, fossil fuels produced 78.5% of U.S. primary energy while renewables produced 11.4% and nuclear 10.1%. Financial support outside typical funding mechanisms for energy has also favored renewables over other fuel sources. Funds for renewable projects under the American Recovery and Reinvestment Act (ARRA) were $20 billion versus $3.4 billion for coal.
National Coal Council – Leveling the Playing Field
20
Figure D.2. Subsidies for Renewable Project Deployment in ARRA 2009
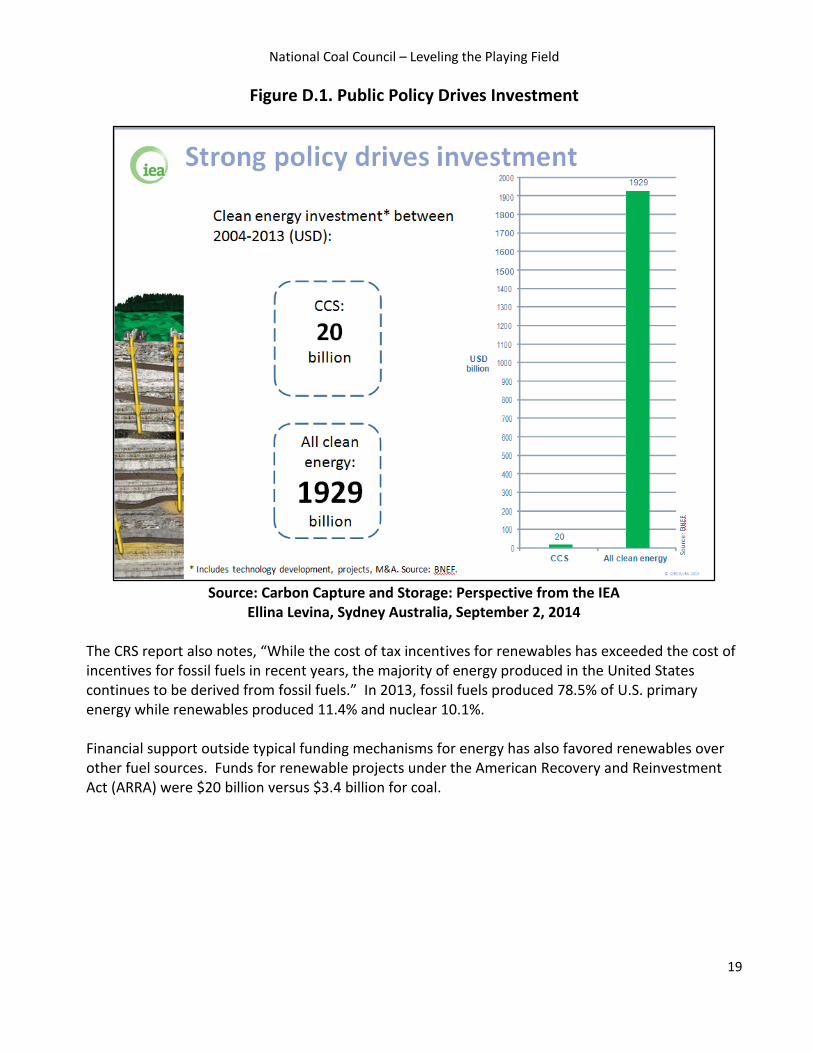
Treasury Grants (ARRA Section 1603), 2009-2013
Source: National Coal Council Fossil Forward Study In addition to financial support, renewables have benefited significantly from regulatory mandates creating a guaranteed market for wind, solar, biomass and other alternatives to fossil and nuclear power. A Renewable Electricity Standard (RES) obligates utilities to produce a specified percentage of their electricity from renewable energy sources. The Public Utility Regulatory Policies Act (PURPA) mandates the purchase of renewable energy from qualifying facilities (QFs) of 20 MW or less. Taken together, Federal production tax credits and State RESs have successfully and quickly spurred the growth of renewable energy in the U.S. It is clear from the graphic that the combination of policy and financial incentives are effective tools that can drive scale and speed in energy technology deployment. Applying similar types of initiatives to the deployment of carbon reduction technologies for fossil fuels can be expected to yield equally impressive production results with even greater CO2 emissions reduction benefits. Policy drove scale and speed for wind; to meet policy objectives, policy needs to do the same for CCS. The interaction of renewables subsidies, particularly the Section 45 PTC, and market structures not only have provided revenue to renewables, but have reduced revenue to fossil and other generators, many of whom have left the market in recent years.41 “[Midwest Independent System Operator’s] [independent market monitor (IMM)] reports that in 2011 wind power generation set the wholesale price of electricity during certain times and in certain locations, at an average price of negative $20 per MWh. The IMM attributes this negatively set wind price to the availability of Federal production tax credit incentives. However, negative price offers may also be incented by the opportunity of wind power projects to sell renewable energy credits (RECs) to entities in order to comply with State RES policies.”42 In PJM, “[t]he IMM reports that an average of 935.5 MW, out of approximately 5,300 MW, of wind resources were offered at a negative price to PJM’s real-time market in 2011.”43

National Coal Council – Leveling the Playing Field
21
Figure D.3. U.S. Wind Industry: Incentives & Growth
Source: ALSTOM
Additional points of disparity between coal and renewables are evident in program funding within DOE. DOE’s CCS R&D Program was launched in 1997 with $1 million in funding. Today, DOE’s CCS R&D program has grown to a $200+ million annual program with a portfolio of nearly 200 projects across the CCS chain in varying stages of development. As a point of contrast, the DOE Office of Energy Efficiency and Renewable Energy has a 2014 budget of $1.9 billion, of which $775 million is in direct support of renewable energy projects. To date, DOE’s Loan Guarantee Program has issued more than $34 billion in “conditional commitments” in the form of either direct loans or loan guarantees, including $8.3 billion for a nuclear plant, $8.5 billion for automotive manufacturing and the remainder mostly to wind and solar projects. No advanced fossil projects currently have a loan guarantee. For the wind and solar loans, the mandated “subsidy cost” – the expected long-term liability cost to the Federal government that must be paid by the borrower or via congressional appropriation – was covered by the Federal government under the Loan Guarantee Program. This “coverage” is not available for CCS projects. A commitment to leveling the playing field from these and other such dis-parities will significantly advance the quick and cost-effective deployment of low carbon coal technologies.
National Coal Council – Leveling the Playing Field
22
2. Existing Incentives for Renewables Below is a list of the primary incentives that have encouraged growth of renewable energy production. The scope of this report is not to include every policy – Federal, State and local – to promote renewables, but only those most relevant to recommendations for policy parity.
Production Tax Credit (PTC) – Section 45 of the Internal Revenue Code provides a tax credit of 1.5¢/kWh for energy produced from qualified energy resources. The credit is indexed to inflation and currently stands at 2.3¢ per-kilowatt-hour (/kWh), or $23/MWh. The credit is received for energy produced from a qualified facility for a period of 10 years after it is placed in service. First enacted as Section 1212 of the Energy Policy Act of 1992, this credit was set to expire on July 1, 1999. However, Congress has extended the credit nine times since its original enactment. Congress is again debating extension of the credit, which expired at the end of 2014, and some have called to make the credit permanent. Eligible energy resources include, among others, wind, solar, geothermal, biomass, incremental hydropower, and wave and tidal energy.44 Wind, closed-loop biomass, geothermal, and certain other facilities receive the full 2.3¢/kWh credit. Others, including open-loop biomass, landfill gas, hydropower, and wave and tidal energy receive one-half of the full credit, rounded up to the nearest tenth-of-cent to 1.2¢/kWh. The American Wind Energy Association testified in 2013 that “without the PTC,” installation of wind generation and related economic benefits and investment “would not have occurred.” 45
Investment Tax Credit (ITC) – Section 48 of the Internal Revenue Code provides up to a 30% tax credit for qualified energy property. It is considered the “solar tax credit” because solar is one of the few types of energy property to which the full credit applies. The rapid expansion of solar installations that has occurred since enactment of the ITC, has been attributed to the credit.46 Other qualified energy property receives a 10% credit.
Cash Payment – ARRA Section 1603 allowed taxpayers to obtain a cash payment instead of receiving either the PTC or ITC. The facilities had to be placed in service in 2009, 2010 or 2011, unless they commenced construction during that time and placed the facility in service later (date dependent upon type of facility).
Loan Guarantees – Title XVII of the Energy Policy Act of 2005 (EPAct ’05) established the Section 1703 loan guarantee program for various types of energy projects that “avoid, reduce, or sequester air pollutants or anthropogenic emissions of greenhouse gases,” including renewables, “advanced fossil energy technology,” and “carbon capture and sequestration practices and technologies” among others. No loan guarantees have been made to fossil projects under the Section 1703 program. By contrast, loan guarantees under Section 1703 and 1705 (described below) have been issued for 18 renewable electricity production facilities totaling more than $12.8 billion, and for renewable electricity manufacturing facilities totaling nearly $1.1 billion.47 As part of the ARRA in 2009, Congress created the Section 1705 loan guarantee program for certain renewables, under which recipients would not be required to pay the credit subsidy cost of the guarantee, further lessening their cost.
National Coal Council – Leveling the Playing Field
23
Mandatory Purchase Requirement – Under PURPA enacted by Congress to address the energy shortage in the ‘70s, utilities are required to purchase power from “qualified facilities” (QFs). QFs can be cogeneration units, where power is used for an industrial purpose, or small power production facilities which are renewable projects of 80 MW or less. To address the overbuild of “PURPA machines” which forced utilities to buy unneeded power from QFs at “avoided costs” typically at above market rates, Congress repealed the application of the mandatory purchase obligation if the U.S. Federal Energy Regulatory Commission (FERC) found that the QFs had access to competitive electricity markets. FERC has exempted most large QFs in the organized markets but continues to grant QF status to all renewable QFs of 20 MW or less, regardless of access to markets. Furthermore, FERC allows large renewable QF projects, such as wind and solar, to be split up into 20 MW projects to be granted QF status requiring utilities to purchase the power produced whether needed or not at “avoided costs” typically higher than market rates.
Research and Development Funding – DOE budgets in recent years have provided substantially more money for renewables research and development than for clean fossil, particularly coal. The FY 2016 DOE budget request of $2.7 billion for the Office of Energy Efficiency and Renewable Energy is more than all of the other applied science budgets combined. The budget request for the entire Federal government detailed approximately $7.4 billion for clean energy programs, including more than $710 million to increase the use and reduce the costs of power from solar, wind, water and geothermal energy. By contrast, the FY 2016 budget request included $560 million for fossil energy R&D, with just $224 million dedicated to CCS research.
Siting and Interconnection Preferences – Renewables also have benefited from special procedures for siting, interconnection, and other approvals necessary for a project to deliver energy to the market. FERC Order No. 792, for example, provides for fast track interconnection approvals for inverter-based generators (such as solar panels) of up to 5 MW, if their capacity is no greater than the minimum load on the line to which they are connecting.
Clean Energy Credits – The Clean Energy Incentive Program in EPA’s final 111(d) existing power plant rule provides extra emission reduction credits for wind and solar projects that begin generation by 2021. EPA will grant one additional credit per MWh of generation from eligible wind and solar projects. Other zero or low-emission projects are not eligible for this special credit, which is limited to a total of 300 million tons. At the current carbon credit prices in California and Regional Greenhouse Gas Initiative (RGGI), the value is $3.505 billion or $1.806 billion, respectively.48 Note that this benefit is being provided notwithstanding that renewables are already flourishing.
National Coal Council – Leveling the Playing Field
24
State Renewable Energy Standards – Twenty-nine States plus the District of Columbia have binding portfolio standards mandating that a certain percentage of energy sold come from certain sources, virtually always renewable generation. They range from a 100% renewable energy mandate by 2045 recently enacted in Hawaii and a recently enacted 50% renewable energy mandates in California by 2030, to 10% mandates to be reached in 2015 in Texas, Michigan and Wisconsin. According to a 2013 study by Lawrence Berkeley National Laboratory (LBNL) (which would not reflect recent increases like those in Hawaii and California), 94 GW of new renewable energy is required by 2035 to meet State renewable energy requirements – 3-5 GW per year of additions through 2020 and 2-3 GW per year through 2035. 49 The LBNL study found these policies drove the addition of 6-13 GW of renewable energy per year in every year but one since 2008. Of this amount, 88% of the capacity additions from 1998-2012 were wind energy.50 The study also found that 67% of non-hydro renewable capacity additions between 1998-2012 were in States with renewable energy requirements.51 The true percentage of renewables constructed to satisfy portfolio standards may be substantially higher, as most States do not require the energy to be sourced in-State.
Net Metering – A number of States provide for “net metering” under which a utility customer can receive credit on their bill for energy they produce and sell to the grid. However, the credit can amount to more than the value of the energy. Some States provide, for example, that net metering customers be paid the delivered electricity price for each kWh they sell to the grid – i.e., if the delivered price is $0.10/kWh, the customer is paid that amount even though that price includes generation, transmission and distribution. A 2013 California Public Utilities Commission report found the State’s net metering program would cost the State $1.1 billion per year by 2020.52
Battery Storage Incentives – Because the sun, wind, and other non-hydro renewable resources do not provide a constant source of energy, renewable-based generation is inherently intermittent. Subsidies are now even being provided for large-scale batteries to store the subsidized electricity generated from renewable resources. These “subsidized-subsidies” come in the form of subsidies to build the batteries and even State funding to build the factories to make the batteries.53
House and Senate legislation introduced in 2015 has proposed additional Federal assistance for renewables.54
National Coal Council – Leveling the Playing Field
25
3. The Difference Between Renewables and CCS-Equipped Facilities
In addition to the tax incentives provided to renewables, the current policy landscape discourages
the construction of CCS-equipped projects by failing to address the investment costs required of
deploying the technology at power and industrial facilities. These costs, coupled with the increased
levelized cost of electricity (LCOE) for new-build power plants with CCS, reveal how an even wider
dis-parity exists than might otherwise be assumed. Although LCOE is one means of measuring the
overall competitiveness of different generating technologies, its use in this comparison does not take
into account all aspects of projected utilization rates and capacity values, two elements that further
favor the construction of coal and other baseload resources.
According to information disseminated in conjunction with the EIA’s Annual Energy Outlook, the
LCOE values for incremental wind capacity coming online in 2020 ranges from $65.6/MWh to
$81.6/MWh, depending on the quality of the resource.55 Although these LCOE values compare
favorably to NGCC facilities, the former is a non-dispatchable technology, one with just a 36%
capacity factor. This means almost three times more capacity is needed when building wind as
opposed to either conventional coal, advanced coal equipped with CCS, NGCC or NGCC equipped
with CCS. However, equipping a conventional coal or NGCC plant with CCS technology carries
significant costs.
Recognizing that LCOE values for coal-fueled power plants equipped with CCS change depending on
the type of power plant (i.e., subcritical or supercritical), coal rank, and the type of technology
deployed, the current cost of adding carbon capture virtually prohibits widespread adoption at new
and existing facilities. The Global CCS Institute recently estimated LCOE values of coal with CCS at
$115-160/MWh, some 35-85% higher than a coal plant without CCS.56 Data prepared by EIA
estimates an LCOE value of $144/MWh for “advanced coal” equipped with CCS. Conventional and
advanced combustion natural gas turbines also experience significant price increases once CCS is
added, $141.5/MWh and $113.5/MWh, respectively.57
National Coal Council – Leveling the Playing Field
26
E. The Playing Field for Carbon Capture and Storage Technologies
1. Building Success The NCC and others have performed gap analyses to define the difference between the current trajectory of CCS and what is needed to propel its progress. Fossil Forward reported that substantial additional financial support is needed. It described desired endpoints for each link in the CCUS chain – capture, transportation, and storage/utilization – then provided recommendations to meet those endpoints. Fossil Forward described the desired endpoint for CO2 capture as facilitating widespread deployment of CCS in the 2030s. In order for this to occur, CO2 capture must be ready for commercial deployment in the decade before. The benchmark for being commercially available used in the NCC report is for a technology to have operated reliably at full commercial scale for at least one year with reasonable cost and performance so it can be commercially insurable and financeable. Today the world has only one power plant with CCS operating at commercial scale. After one year of operation, it does not exhibit the reliable performance hoped. SaskPower’s Boundary Dam Unit 3, retrofitted with carbon capture through the help of government incentives, is designed to achieve a capture rate of 99% of the plant’s CO2. The plant achieved a peak-performance capture rate of approximately 80% in June 2014, but since mid-January 2015 has achieved a best capture rate of 65%. Furthermore, the plant has operated only 40% of the time in its first year because of technical complications.58 Reaching the desired benchmark should be the intended outcome of DOE’s CCS program. Among others, the report made the following recommendations:59
Have 5-10 GW of CCS demonstration projects operating in the U.S. by 2025.
Provide budget and have a plan to fund 25-50 MW of demonstrations of second generation CO2 capture technologies in the U.S. by 2020.
Continue to “feed the pipeline” by sponsoring early stage R&D on transformational technologies.
DOE’s program needs to address the risk that a CCS project developer may not timely find economic CO2 storage.
There is a need for financing mechanisms beyond those currently available.
National Coal Council – Leveling the Playing Field
27
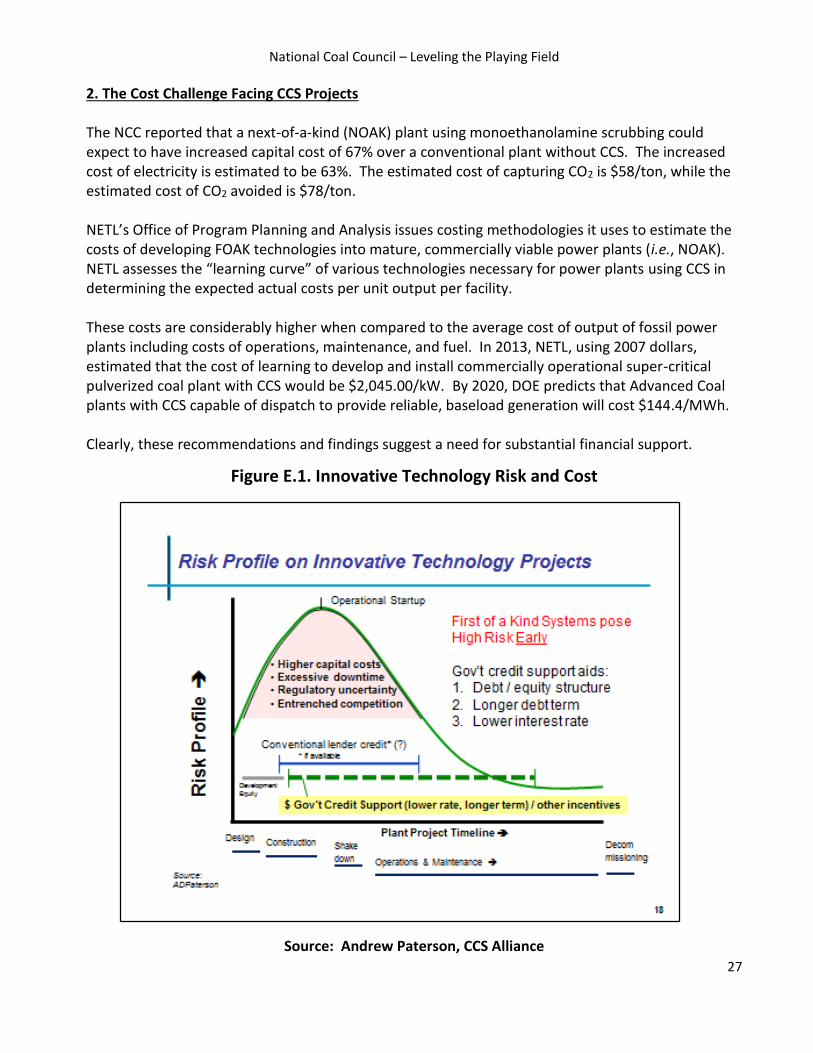
2. The Cost Challenge Facing CCS Projects The NCC reported that a next-of-a-kind (NOAK) plant using monoethanolamine scrubbing could expect to have increased capital cost of 67% over a conventional plant without CCS. The increased cost of electricity is estimated to be 63%. The estimated cost of capturing CO2 is $58/ton, while the estimated cost of CO2 avoided is $78/ton. NETL’s Office of Program Planning and Analysis issues costing methodologies it uses to estimate the costs of developing FOAK technologies into mature, commercially viable power plants (i.e., NOAK). NETL assesses the “learning curve” of various technologies necessary for power plants using CCS in determining the expected actual costs per unit output per facility. These costs are considerably higher when compared to the average cost of output of fossil power plants including costs of operations, maintenance, and fuel. In 2013, NETL, using 2007 dollars, estimated that the cost of learning to develop and install commercially operational super-critical pulverized coal plant with CCS would be $2,045.00/kW. By 2020, DOE predicts that Advanced Coal plants with CCS capable of dispatch to provide reliable, baseload generation will cost $144.4/MWh. Clearly, these recommendations and findings suggest a need for substantial financial support.
Figure E.1. Innovative Technology Risk and Cost
Source: Andrew Paterson, CCS Alliance
National Coal Council – Leveling the Playing Field
28
Costs of CCS can be offset by the sale of co-products. Southern Company’s Kemper County facility, for example, will make and sell fertilizer from chemical streams resulting from the gasification process. It also has agreements to sell the CO2 to oil producers for enhanced oil recovery (EOR). These revenues are significant, but not nearly sufficient to cover the capital and operating costs associated with carbon capture. Market prices for CO2 for EOR in some areas have been above $25/ton.60 However, lower market prices for oil affect what oil producers can and will pay for industrial-sourced CO2. A steady revenue stream is needed for financing industrial facilities with carbon capture. The Coal Utilization Research Council (CURC) has proposed a variable price support mechanism for the price of CO2 pegged to the oil price, which would provide industrial CO2 producers with a steady CO2 income stream to make their capture projects financeable. An often-cited issue with CO2-EOR is that the opportunities for its deployment are not currently geographically widespread enough to present a nearby opportunity for a coal fleet scattered widely across the country. However, the estimate of the CO2-EOR opportunity has grown substantially as detailed in research that has emerged over the past three years.61 CURC and the Electric Power Research Institute (EPRI) publish a periodically updated Roadmap for Advanced Coal Technology, including CCS.62 The purpose of the Roadmap is to provide recommendations that will substantially drive down the cost and increase efficiencies of advanced coal technology, including CCS. The 2015 update re-examined technology development needs in light of new factors, such as persistent low natural gas prices, GHG regulations, and increasing renewable generation. The CURC-EPRI Roadmap looked at what is needed to support development of transformational technologies that will deliver cost, efficiency, and environmental performance improvements, as well as the need for a large-scale pilot program to test technologies under real operating conditions before commercial-scale demonstration. The Roadmap identifies a need for increased Federal funding. In particular, it calls for 100% Federal financing for large pilot-scale testing of these new technologies. It also calls for the Federal government to fully fund a 50% cost share for commercial scale demonstration, a share which has not been met for any of the CCPI projects (the W.R. Parish project receiving the highest percentage at 16.7%).63
National Coal Council – Leveling the Playing Field
29
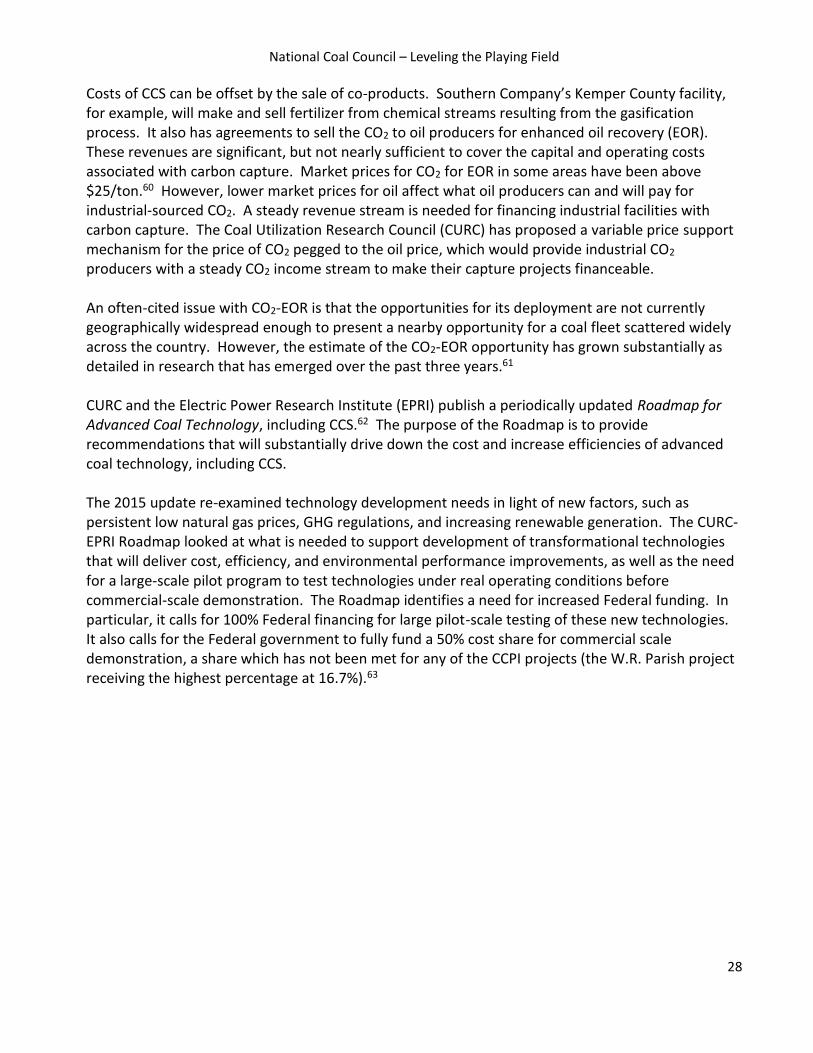
Figure E.2. Matching Incentives to Commercial Risk
Source: Scully Capital
DOE support and incentives to bridge the gap must be flexible to account for local differences in market structure, as well as local, technical, and financing vagaries. States are divided between those with traditional cost-of-service utility regulation, and those with deregulated markets. In areas with cost-of-service regulation, a utility proposing construction of a new power plant would be required to undergo hearings before State utility regulators to determine whether the construction of a new facility is justified in light of the alternatives, and will be cost-effective. State regulators may take into account special benefits of a facility, such as its use of in-State resources and similar factors that may benefit the State and consumers. Regardless, rates charged to consumers to pay for the facility must be “just and reasonable.”
In deregulated market areas, no approval to build generation is required from rate regulators. Markets determine whether a new facility is cost-justified. Absent subsidies and mandates, such as those that apply for renewables, facilities that cannot recover their cost through rates earned in the market do not get built. In both regulated and deregulated market areas, CCS is in essence competing with new-build natural gas without CCS, a low cost option. CCS must be able to be cost competitive in both markets. Access to a variety of financing options, taking into account both regulated and deregulated market areas and other considerations, is a recommendation that has consistently emerged over the years from meetings on CCS financing, such as those hosted by the Carbon Sequestration Leadership Forum. The rationale is quite simple. Incentives need to fit local circumstances.
National Coal Council – Leveling the Playing Field
30
3. Existing CCS and Clean Coal Incentives and Proposed Incentives CCS and clean coal technologies currently benefit from several Federal programs and some State programs to encourage development, demonstration, and deployment. While these programs could spur CCS development if revised, enhanced, and complemented with other incentives, they are not sufficient as is (which is evident from the lack of projects resulting from them, and in some cases even lack of bids to use the incentives). These programs provide far less support than policies supporting renewables. Below is a description of the main existing incentives for CCS technologies.
Research and Development – DOE’s budget includes line items for both carbon capture and storage. This funding supports pilot-scale carbon capture projects as well as projects focused on storage infrastructure. However, funding for renewable research and development is regularly more than twice that spent on CCS.
Demonstration – EPAct ’05 authorized the Clean Coal Power Initiative (CCPI) to “advance efficiency, performance, and cost competitiveness well beyond” commercial technologies.64 In 2009 and 2010, DOE announced a Round Three of CCPI funding for 3 CCS power plant projects: Texas Clean Energy Project (TCEP), Hydrogen Energy California Project (HECA), and W.A. Parish Post-Combustion CCS Project.65 However, neither TCEP nor HECA have begun construction, and their DOE funding has been removed or reduced. Indeed, as of 2013, only $228 million of the $1.04 billion obligated to CCPI Round Three had been spent.66 Notably, CCS demonstration projects have not received an appropriation since 2009.
FutureGen 2.0 – Utilizing $1 billion in funding made available from ARRA and additional funding from annual appropriations, the FutureGen 2.0 effort was announced on August 5, 2010 to repower Unit 4 of the Meredosia Energy Center with oxycombustion technology and to capture and sequester approximately 1 million metric tons of CO2 per year. FutureGen has suspended operations. A case study of the project is included in Appendix 6.
Loan Guarantees – EPAct ‘05 established a loan guarantee program for various types of energy projects that “avoid, reduce, or sequester air pollutants or anthropogenic emissions of greenhouse gases,” including “advanced fossil energy technology” and “carbon capture and sequestration practices and technologies.” In 2009 and again in 2013, DOE issued solicitations for coal-based power generation projects and advanced fossil energy technology with carbon capture. Although several applications were received, no clean coal project, or any fossil project, with our without CCS, has received any loan guarantee since EPAct ’05 was enacted.67
Investment Tax Credits – EPAct ’05 established investment tax credits under new Sections 48A and 48B of the Internal Revenue Code for qualifying advanced coal power projects and industrial gasification facilities. These credits provide a credit of up to 15% or 20% (depending on project type), but are limited in the amount of dollars that can be provided to all projects in total. Credits have been unallocated or forfeited due to inability to meet statutory requirements for the credits.68
National Coal Council – Leveling the Playing Field
31
Carbon Sequestration Tax Credit – Section 45Q of the Internal Revenue Code provides a
$10/ton credit for CO2 stored through enhanced oil or gas recovery, and a $20/ton credit for
CO2 stored in other formations. The credit is limited to 75 million tons total of sequestered
CO2 for all recipients. Due to restrictions in the credit (e.g., a requirement that the taxpayer
both own the industrial facility from which the CO2 is captured, and inject the CO2; lack of
transferability of the credit), only slightly more than one-third of the credit (27,114,815
metric tons) has been claimed since its enactment in 2008.69 Virtually none of these credits
went towards CO2 captured from electric generating facilities.
State Portfolio Standards – Five States – Utah, Michigan, Ohio, West Virginia, and
Massachusetts – allow electricity generated using CCS to be included in their electricity
portfolio standards.70 However, electricity generated using CCS has not been applied as part
of any of these State’s portfolio standards.
Numerous incentives to promote CCS research, development, demonstration and deployment have
been proposed in recent years, with the pace accelerating during 2015. Appendix 2 sets forth a list
of Federal incentives proposed by the Obama Administration or Congress this year.

National Coal Council – Leveling the Playing Field
32
F. Recommendations The NCC recommends a significant ramping up of incentives to “bridge the chasm” for CCS and, per the Secretary’s request, to provide policy parity. These recommendations will address the policy mismatch between actual and needed CCS technology funding, and between funding for CCS and other low-carbon energy resources. The recommendations provide a menu of financial support options that will provide the necessary support for CCS and constitute policy parity. As with incentives for other energy resources, it is not intended that all of these incentives will be available for each project. Several of the proposed incentives should be crafted as alternatives – much as with renewables the production tax credit, investment tax credit, and cash grant programs have operated as alternatives. No single proposed incentive should be viewed as a self-sufficient independent recommendation. A combination of support mechanisms spurred renewables development, and that is what is needed for CCS. If offering loan guarantees alone was sufficient to spur commercial CCS deployment, we would have more projects in development today. A key recommendation is to institute a “contracts for differences” or CFD structure, available for a limited number of CCS projects, under which projects would bid for financial support making use of a combination of the proposed incentives. This structure is in use in the United Kingdom, whose program is described in Appendix 5. By way of example, a CFD structure could provide a power plant contract recipient with a CCPI grant to reduce capital cost, provide a loan guarantee to reduce borrowing cost, and make use of tax credits to reduce the cost of electricity over time. Another applicant may prefer to request variable price support for electricity, as offered in the U.K, or variable price support for CO2 sold from the facility, in place of other incentives. The CFD structure may be the single most important mechanism to spur CCS development and deployment, but only if the incentives underlying it are sufficient. Former Senate Energy & Natural Resources Committee Chairman Jeff Bingaman (D-NM) proposed legislation several years ago authorizing DOE to enter into up to 10 contracts for technical and financial support for CCS projects. We recommend providing the CFD structure for at least the first 5-10 GW of projects with CCS on a competitive basis. This could include projects already in the CCPI program. While several projects received limited grants and underwent substantial planning, only two are under construction and none are complete. These options should be deployed in a manner to result in operating projects (particularly commercial demonstrations and large-scale pilots), support a diverse set of technologies in a variety of circumstances and locations, minimize Federal outlays, and minimize distortions of markets that have occurred from implementation of incentives for other low-carbon energy sources.
National Coal Council – Leveling the Playing Field
33
In its 2014 annual survey of power generators and technology developers, the Global CCS Institute found that the top three enablers for CCS projects were 1) access to direct subsidies, 2) access to viable CO2 storage, and 3) offtake arrangements offering guaranteed prices.71 We include proposals for each of these below. As will be apparent, many of these recommendations require congressional enactments. Appendix 2 shows interest in Congress in supporting CCS, including recently among senior congressional leaders.72
Financial Incentives
Contracts for Differences – DOE should provide for a CFD structure under which a limited
number of projects – at a minimum the first 5-10 GW of output from facilities with CCS – can
receive a combination of the incentives described below.
Limited Guaranteed Purchase Agreements – In order to obtain financing, a limited number
of pioneering facilities with CCS should receive a guarantee that their output will be
purchased. This is key to the development of an immature technology with a yet uncertain
risk profile and a potential for significantly lower cost. It also is a key element in parity, as
renewables have benefited from PURPA mandatory purchase requirements. This incentive
should be limited in scope to cover at least the first 10 GW of output from facilities with CCS,
be designed to encourage geographically diverse projects, and minimize impacts on
electricity markets.
Market Set Aside – True parity would entail a mandatory market set-aside, akin to State
renewable energy requirements. As noted by LBNL, the vast majority of renewables
construction has occurred in States with an active or impending RES. One mechanism to
provide a market set aside is a “baseload allowance.” Fossil technologies that deploy CCS or
other immature carbon reducing technologies and meet a define carbon emissions rate while
providing baseload power would be eligible for the credit. Given the importance of CCS to
meeting climate goals, we recommend a Federal mechanism be explored to authorize a
portion of any State-mandated RES to be met through use of qualifying low-carbon fossil
baseload, similar to those in Utah, Michigan, Ohio, West Virginia, and Massachusetts.
Clean Energy Credits – Fossil projects with CCS should receive credit under applicable
programs for 100% of CO2 emissions avoided by deployment of CCS. Programs that currently
allocate extra clean energy credits for renewables either should make the same credit
available to fossil with CCS, or the extra crediting should be removed to assure parity.
National Coal Council – Leveling the Playing Field
34
Tax Credits and Price Interventions – Guaranteed purchase agreements, and the ability to
attract financing that accompanies it, is only part of the equation. Facilities will not be built
by entities subject to traditional utility regulation if State utility commissions determine the
cost is too high. In areas with EOR opportunity, incentives could involve price support for CO2
sales. Below are specific proposals:
o Production Tax Credit – Policy makers should provide a tax credit for production of
electricity with CCS equivalent to that for renewables in Section 45. Options for
structuring the credit could include (a) applying the credit consistent with the lower
available inflation-indexed rate in Section 45 (i.e., 1.2¢/kWh) for capture at a new
facility that brings the rate of emissions to 1,400 lbs./MWh, increasing
proportionately to 2.3¢/kWh as the capture and storage rate increases toward 100%;
or (b) applying the full 2.3¢/kWh credit to the number of kWh dispatched, multiplied
by the capture percentage.
o CO2 Price Stabilization – Establish a “variable price support” program for CO2
sequestration under which applicants would bid to DOE for financial support
payments for CO2, tied to the market price for oil (where EOR opportunities are
available). This variable price support would be used under CFD agreements.
o Electricity Price Stabilization – Establish a price support program for electricity under
which applicants would bid to DOE for financial support for a limited number of
projects. The support would be based on the delta between the amount needed to
achieve a commercial rate of return and the amount that can be earned, in the case of
regulated markets, at just and reasonable rates, or in the case of deregulated
markets, at projected market rates. This variable price support would be used under
CFD agreements.
o Revise CO2 Injection Credit – The Section 45Q tax credit should be revised as follows:
Eliminate the requirement that the recipient both capture and inject the CO2
(which may not be the case, for example, with a power plant selling CO2 to the
oil field)
Assure that injection that qualifies under existing verification mechanisms as
sequestration is satisfactory to obtain the credit
Provide for transferability of the credit between parties in the capture and
injection chain of custody; and
Increase the credit to $40/ton for beneficial reuse (e.g., EOR storage) and
$60/ton for other geologic storage.
National Coal Council – Leveling the Playing Field
35
Tax-Preferred Bonds – A variety of activities can be funded by tax-preferred and tax-exempt
bonds. Renewable projects funded by local governments and electric cooperatives may issue
Clean Renewable Energy Bonds under Section 54 of the Internal Revenue Code to finance
clean energy projects (those which also are covered by the Section 45 tax credit).
Approaches could include extending the Section 54 approach to CCS, or qualifying CCS
projects for use of exempt facility bonds issued under Section 142.
Master Limited Partnerships (MLPs) – Section 7704 of the Internal Revenue Code provides
that business structures receiving at least 90% of their income from “qualifying income” can
be treated as master limited partnerships for tax purposes; therefore, their income will be
taxed only at the individual level, rather than both the corporate and individual level.
Currently neither renewables nor low-carbon fossil technologies such as CCS qualify for this
treatment. If renewables are made eligible for such treatment, parity requires that CCS also
qualify.73
Loan Guarantees – As indicated above, DOE’s loan guarantee program has helped
renewables, but not CCS. Congress enacted a special $6 billion program to pay for the credit
subsidy cost of renewables, another dis-parity with fossil deploying CCS. The loan guarantee
program should be revised to provide opportunity for the same credit subsidy relief for fossil
projects as has been provided to renewable projects under the Section 1705 program.
Regulatory Improvements
Regulatory Blueprint – DOE must take the lead in developing a regulatory blueprint which removes barriers to the construction and development of projects with CCS. This blueprint would be applicable to facilities for carbon capture (e.g., industrial facilities such as power stations), transportation, and injection. Given its charter and expertise, DOE is central to the development of this blueprint with sister agencies, which would include such elements as addressing the specific regulatory barriers below.
Remove Injection Barriers – EPA’s 111(d) existing power plant and 111(b) new power plant
rules both provide that CO2 from power plants regulated by the rule that is injected at oil and
gas wells be reported under more stringent reporting rules than is currently required. Some
CO2 users have said this will discourage rather than encourage their use of CO2 from these
sources in the oilfield, and that associated regulatory obligations may conflict with State
natural resource law. Federal policy should encourage and facilitate reuse of CO2 from CCS
operations, not discriminate against it.
National Coal Council – Leveling the Playing Field
36
New Source Review – Concerns have been raised that retrofits of existing power plants to
install carbon capture could trigger NSR requirements of the Clean Air Act. Such retrofits
would constitute a “physical change” at the facility, and some may argue this could result in a
significant net emissions increase. If we are to reduce CO2 emissions from existing facilities in
the U.S., government policy must eliminate this uncertainty in order to encourage rather
than discourage installation of CO2 emission control equipment.
Infrastructure Siting – Federal policy makers should consider Federal eminent domain
authority for the siting and construction of CO2 pipelines, like the authority provided under
the Natural Gas Act for natural gas pipelines could be provided. If a State does not have
authority to provide for siting of a pipeline, or fails to act within a reasonable period, FERC
should be available as a backstop siting and permitting authority.
Storage Siting – The NCC recommends that DOE identify and certify at least one reservoir
which is capable of storing a minimum of 100 million tons of CO2 at a cost of less than
$10/ton in each of the seven regions covered by DOE’s Regional Carbon Sequestration
Partnership program.
Research, Development and Demonstration
Align Research, Development, & Demonstration (RD&D) Funding With Other Fuels – DOE needs to increase substantially the budget for RD&D funding for CCS. The CURC-EPRI Roadmap is the industry’s best-supported estimate of the funding needed for CCS RD&D. Even if fully funded, the CURC-EPRI Roadmap falls short of parity with renewables RD&D. The NCC recommends fully funding CCS RD&D at a minimum as recommended in the Roadmap. That would include funding an 80% Federal cost share for early stage RD&D, 100% Federal cost share for large-scale pilots, and a fully funded 50% cost share for commercial demonstrations.74
Communication and Collaboration
Vigorously Explain Reality – First and foremost, DOE must be a tireless advocate in all venues
for recognition that fossil fuels will be used in coming decades to a greater extent than today
to fuel a more populous, developed, urban world. Those who deny these facts in the name of
addressing climate change not only harm fossil fuels and ambitions for improved health and
quality of life, but diminish the likelihood of meaningful CO2 emission reductions.
Initiate Projects Immediately – The NCC recommends that DOE propose an international
pool of funds specifically set up for the implementation of CCS demonstration projects at
scale. The U.S. should initiate collaboration within the next year on 5-10 GW of international
demonstration projects (in addition to the 5-10 GW of U.S.-based projects recommended
earlier) advancing DOE’s program objectives and promoting foreign policy interests.
National Coal Council – Leveling the Playing Field
37
G. Appendices
Appendix 1 – Abbreviations
ARRA – American Recovery and Reinvestment Act CCPI – Clean Coal Power Initiative CCS – Carbon Capture and Storage CCPS – Illinois Clean Coal Portfolio Standard CCUS – Carbon Capture Use and Storage CFD – Contract for Differences CO2 – Carbon Dioxide CRS – Congressional Research Service CURC – Coal Utilization Research Council DOE – U.S. Department of Energy EIA – U.S. Energy Information Administration EPA – U.S. Environmental Protection Agency EOR – Enhanced Oil Recovery EPAct ’05 – Energy Policy Act of 2005 (P.L. 109-58) EPRI – Electric Power Research Institute EU – European Union FERC – U.S. Federal Energy Regulatory Commission FOAK – First-of-a-Kind (technology) GDP – Gross Domestic Product GHG – Greenhouse Gas GW -- Gigawatt HELE – High Efficiency, Low Emission IEA – International Energy Agency IGCC – Integrated Gasification Combined Cycle ITC – Investment Tax Credit kWh – Kilowatt-hour LBNL – Lawrence Berkeley National Laboratory LCOE – Levelized Cost of Electricity MLP – Master Limited Partnership MW – Megawatt MWh – Megawatt Hours NCC – National Coal Council NGCC – Natural Gas Combined Cycle NETL – DOE National Energy Technology Laboratory NOAK – Next-of-a-Kind (technology) NSR – New Source Review PPA – Power Purchase Agreement PTC – Production Tax Credit PURPA – The Public Utility Regulatory Policies Act (P.L. 95-617) OECD – Organisation for Economic Co-operation and Development

National Coal Council – Leveling the Playing Field
38
QF – Qualifying Facility REC – Renewable Energy Credit RGGI – Regional Greenhouse Gas Initiative RES – Renewable Energy Standards W – Watt

National Coal Council – Leveling the Playing Field
39
Appendix 2 – Federal CCS/CCUS Incentive Proposals Introduced in 2015
FY 2016 Budget Proposal – The President’s FY 2016 budget proposal included two tax incentives to assist CCS/CCUS:
o A 30% investment tax credit for new and retrofitted power plants with CCS capturing at least 75% of the facility’s CO2 emissions, limited to $2 billion total for all projects. Retrofit projects must be on facilities 250 MW or greater in capacity, and must capture at least 1 million tpy. 70% percent of the credit must go to projects whose fuel source is at least 75% coal. No more than 60% of the credit can be applied to either new plants or retrofits.
o A CO2 sequestration tax credit of $50/ton for permanently sequestered CO2 that is not beneficially used (e.g., EOR), and a $10/ton credit for CO2 permanently sequestered and beneficially reused. The credit would have a 20-year term. This would be a revision and expansion of the existing Section 45Q credit, which provides a $20/ton credit for non-EOR sequestration, and a $10/ton credit for EOR sequestration. That credit is an annual credit with no duration limit. However, the credit is limited to 75 million tons total for all projects.
Federal Legislation – A number of bills have been introduced in the 114th Congress to provide incentives for CCS. They include the following:
o S. 2012 – On July 30, 2015, the Senate Committee on Energy & Natural Resources favorably reported by a vote of 18-4 the Energy Policy Modernization Act of 2015, subsequently introduced as S. 2012. Section 3402 of the bill, offered as an amendment to the bill by Senator Joe Manchin (D-WV), would repeal the existing coal technologies program and carbon capture research and development program and establish a new coal technology RD&D program to focus DOE’s efforts on development of large-scale pilot testing for CCS and other technologies “under real operational conditions and commercial scale.” The amendment’s funding authorization specifically would designate $285 million per year for commercial-scale demonstration between FY 2017-21. Section 3401 would list carbon capture, utilization, and storage as a specific priority of DOE’s Office of Fossil Energy.
o S. 2089 – On September 28, Senate Energy & Natural Resources Committee Ranking Democrat Maria Cantwell (D-WA) introduced the American Energy Innovation Act, with support from Senate Minority Leader Harry Reid (D-NV), Minority Whip Richard Durbin (D-IL), and Democratic Conference Chairman Chuck Schumer (D-NY) among others. The bill includes several provisions to support CCS. Section 2141 lists carbon capture, utilization, and storage as a specific priority of DOE’s Office of Fossil Energy. Section 5011 provides a production tax credit of 1.5¢/kWh for clean energy produced, to be reduced proportionately depending on by what percentage the facility’s CO2 emission rate is below 820 lbs./MWh. Section 5012 provides a 30% investment tax credit for CCS equipment, and up to a 30% tax credit for clean technologies, depending on by what percentage their CO2 emission rate is below 820 lbs./MWh.
National Coal Council – Leveling the Playing Field
40
o S. 601 – On February 26, 2015, Senator Heidi Heitkamp (D-ND) introduced S. 601, the
Advanced Clean Coal Technology In Our Nation Act of 2015. The Heitkamp bill
provides a number of incentives for CCS and CCUS, including among other things the
following:
Amends the EPAct ‘05 to broaden the purposes of DOE’s existing coal technologies program, and establish a new Transformational Coal Technology research, development and demonstration program to study technologies such as chemical looping, supercritical CO2 generation cycles, pressurized oxycombustion, and carbon utilization.
Establishes a new Section 48E tax credit of 30% for equipment capable of capturing, transporting and storing CO2.
Establishes a Clean Energy Coal Bond program to provide tax credits for bonds issued for clean coal projects to reduce the cost of borrowing.
Provides accelerated (seven years) tax depreciation for certain equipment installed at coal facilities to reduce CO2 emissions.
Establishes a “variable price support” program for CO2 sequestration under which applicants would bid to DOE for financial support payments for CO2, tied to the market price for oil (the contract price for anthropogenic CO2 is often dependent upon the price of oil, which is not stable enough to provide sufficient future revenue stream certainty for project financing).
Provides $2 billion for loan guarantees specifically for CCS projects under DOE’s loan guarantee program. This is 25% of the program’s total funding for all energy loan guarantees.
Establishes a CCS risk management program under which the Secretary of Energy would competitively select up to 10 projects to receive financial and technical assistance, including indemnification for liability arising from the site.
o H.R. 1806 – On May 20, 2015, the House of Representatives passed H.R. 1806, reauthorization of the America COMPETES Act. Among other things, this bill would amend the coal and related technologies program authorization in Section 962 of the EPAct ‘05 by authorizing research into chemical looping, supercritical CO2 generation cycles, pressurized oxycombustion, and carbon utilization. The COMPETES Act also would require a study on creation of an expanded CO2 pipeline network.
o H.R. 2883 – On June 24, 2015, Rep. Ted Poe (R-TX) introduced the “Master Limited Partnerships Parity Act,” legislation that would authorize use of the tax-preferred MLP structure for numerous types of clean energy projects, including gasification projects that capture and sequester at least 75% of CO2 produced, and other CCS projects that capture and sequester at least 30% of CO2 produced.
National Coal Council – Leveling the Playing Field
41
o H.R. 3392 – On July 29, 2015, Rep. Scott Peters (D-CA) introduced “The Carbon Capture Research and Development Act,” that would amend Section 961(a) of the EPAct ‘05 to require the Secretary of Energy to consider the objective of ‘improving the conversion, use and storage of CO2 produced from fossil fuels’ in carrying out R&D programs.
o S. 1282 – On May 11, 2015, Sen. Joe Manchin (D-WV) introduced legislation to make “improving the conversion, use, and storage of carbon dioxide produced from fossil fuels” a specific objective of DOE’s fossil energy RD&D program.
o S. 1283 – On May 11, 2015, Sen. Joe Manchin (D-WV) introduced a bill to repeal the existing coal technologies program and carbon capture research and development program under the EPAct ‘05 and establish a new coal technology RD&D program to focus DOE’s efforts on development of large-scale pilot testing for CCS and other technologies “under real operational conditions and commercial scale.” It would allocate $610 million for each of fiscal years 2017 through 2020, plus $560 million for FY 2021, setting aside $285 million per year for demonstration projects. It also would repeal cost sharing for projects funded by the program.
o S. 1285 – On May 19, 2015, Sen. Heidi Heitkamp (D-ND) introduced the “Coal with Carbon Capture and Sequestration Act of 2015” that would authorize the Secretary of Energy to enter contracts for up to 25 years to provide ‘price stabilization’ support for electricity or for CO2 captured at an electric generating facility to advance the recovery of crude oil or other purposes.
o S. 1293 – On Jun 9, 2015, Sen. Heidi Heitkamp (D-ND) offered legislation that would establish the Department of Energy as the lead agency for coordinating permitting at “eligible projects,” including CCS and CCUS projects and other clean coal projects. The bill would require that Federal permit decisions and environmental reviews be completed within one year after a complete application is submitted.
o S. 1656 – On June 24, 2015, Sen. Chris Coons (D-DE) introduced the “Master Limited Partnerships Parity Act,” which would authorize use of the tax-preferred master limited partnership structure for numerous types of clean energy projects, including gasification projects that capture and sequester at least 75% of CO2 produced, and other CCS projects that capture and sequester at least 30% of CO2 produced.
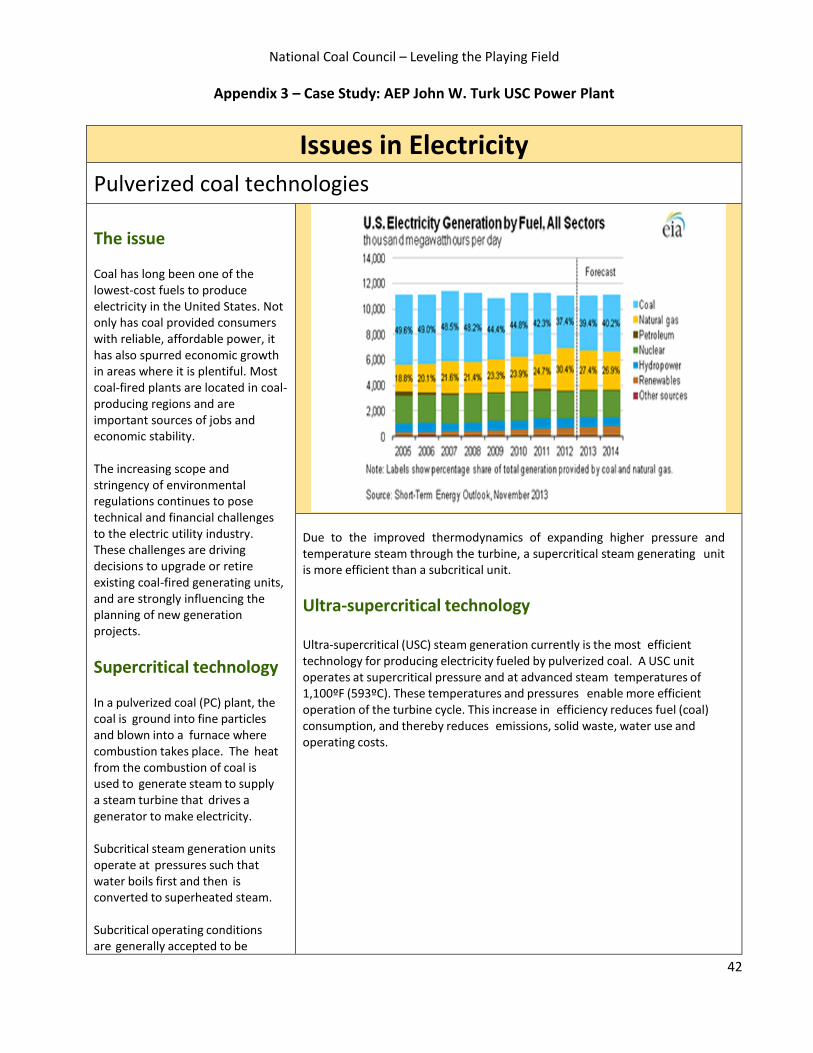
National Coal Council – Leveling the Playing Field
42
Appendix 3 – Case Study: AEP John W. Turk USC Power Plant
Issues in Electricity
Pulverized coal technologies
The issue Coal has long been one of the lowest-cost fuels to produce electricity in the United States. Not only has coal provided consumers with reliable, affordable power, it has also spurred economic growth in areas where it is plentiful. Most coal-fired plants are located in coal-producing regions and are important sources of jobs and economic stability. The increasing scope and stringency of environmental regulations continues to pose technical and financial challenges to the electric utility industry. These challenges are driving decisions to upgrade or retire existing coal-fired generating units, and are strongly influencing the planning of new generation projects.
Supercritical technology In a pulverized coal (PC) plant, the coal is ground into fine particles and blown into a furnace where combustion takes place. The heat from the combustion of coal is used to generate steam to supply a steam turbine that drives a generator to make electricity. Subcritical steam generation units operate at pressures such that water boils first and then is converted to superheated steam. Subcritical operating conditions are generally accepted to be
Due to the improved thermodynamics of expanding higher pressure and temperature steam through the turbine, a supercritical steam generating unit is more efficient than a subcritical unit.
Ultra-supercritical technology
Ultra-supercritical (USC) steam generation currently is the most efficient technology for producing electricity fueled by pulverized coal. A USC unit operates at supercritical pressure and at advanced steam temperatures of 1,100ºF (593ºC). These temperatures and pressures enable more efficient operation of the turbine cycle. This increase in efficiency reduces fuel (coal) consumption, and thereby reduces emissions, solid waste, water use and operating costs.
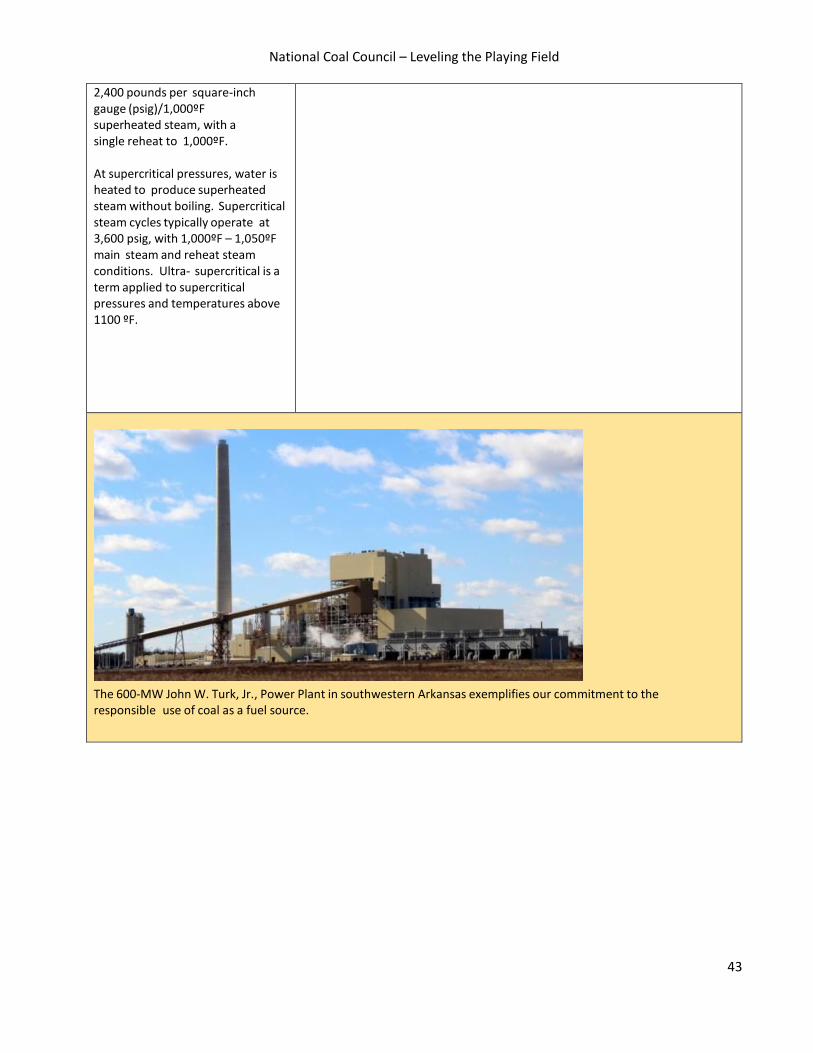
National Coal Council – Leveling the Playing Field
43
2,400 pounds per square-inch gauge (psig)/1,000ºF superheated steam, with a single reheat to 1,000ºF. At supercritical pressures, water is heated to produce superheated steam without boiling. Supercritical steam cycles typically operate at 3,600 psig, with 1,000ºF – 1,050ºF main steam and reheat steam conditions. Ultra- supercritical is a term applied to supercritical pressures and temperatures above 1100 ºF.
The 600-MW John W. Turk, Jr., Power Plant in southwestern Arkansas exemplifies our commitment to the responsible use of coal as a fuel source.

National Coal Council – Leveling the Playing Field
44
USC and AEP Our decision to build the 600-megawatt (MW) John W. Turk, Jr., Power Plant in southwestern Arkansas exemplifies our continued commitment to the responsible use of coal as a fuel source. The Turk Plant is the first coal-fired plant AEP has built in more than two decades and represents the future of coal-based technology that we continue to advance. The Turk Plant is the only operating U.S. power plant to use ultra-supercritical technology and is among the nation’s cleanest, most efficient pulverized coal plants. Turk began commercial operation in December 2012 after a variety of regulatory and legal challenges were resolved and Turk was officially dedicated in April 2013. AEP SWEPCO and the Turk Plant received several project awards in 2013:
Edison Electric Institute's (EEI) Edison Award, the electric power industry's most prestigious honor, for the completion and commercial operation of the plant
Power Engineering Magazine's "Best Coal-fired Project" for its cleaner, more efficient source of power generation and new technology, and the magazine's "Plant of the Year" award
Engineering News Record Texas & Louisiana Magazine's "Best Project Winner" in the Energy/Industrial category and "Best Safety Award" winner by for its outstanding construction quality and craftsmanship, and the high-priority safety culture of site management
Helpful links
http://fossil.energy.gov
http://www.netl.doe.gov/technologies/coalpower/index.html
http://www.worldcoal.org/coal-the-environment/coal-use-the-environment/improving-efficiencies/
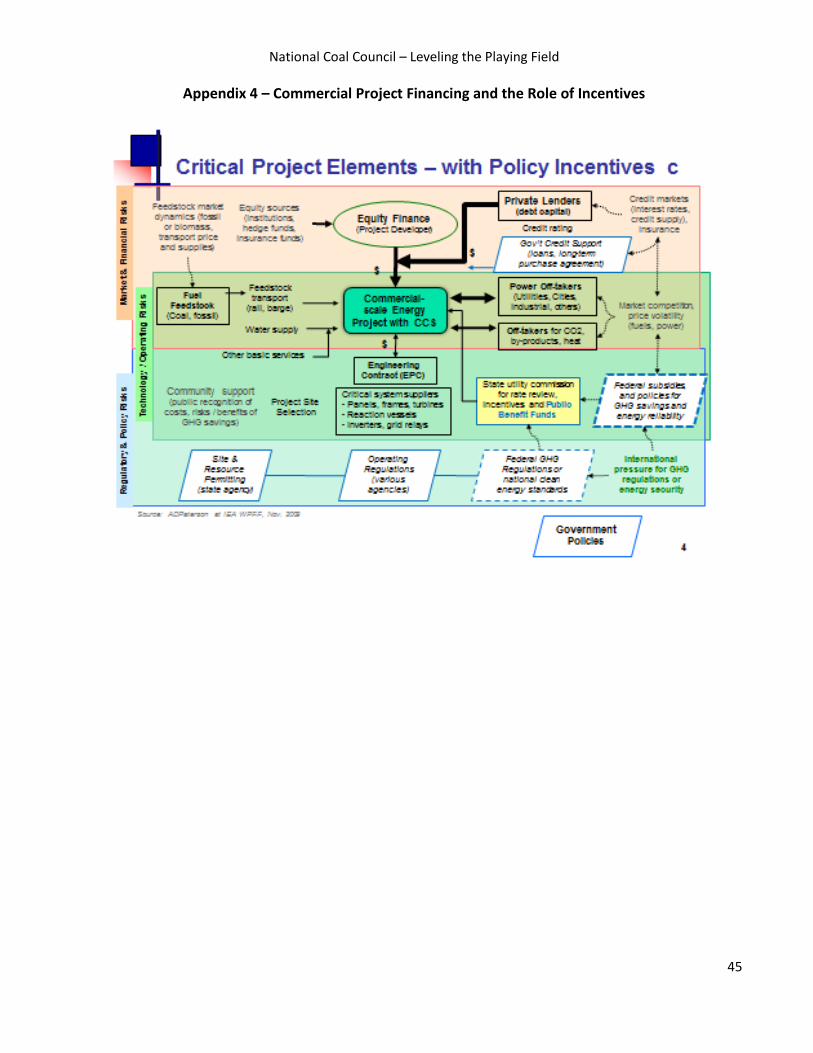
National Coal Council – Leveling the Playing Field
45
Appendix 4 – Commercial Project Financing and the Role of Incentives
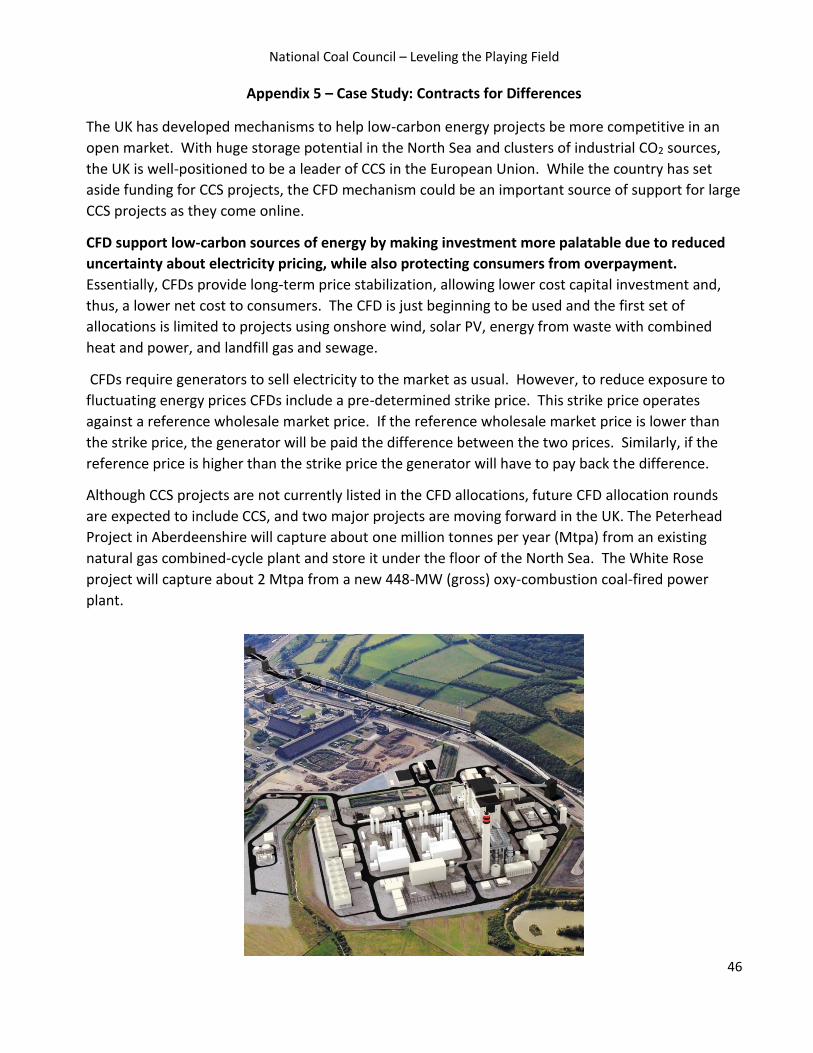
National Coal Council – Leveling the Playing Field
46
Appendix 5 – Case Study: Contracts for Differences
The UK has developed mechanisms to help low-carbon energy projects be more competitive in an
open market. With huge storage potential in the North Sea and clusters of industrial CO2 sources,
the UK is well-positioned to be a leader of CCS in the European Union. While the country has set
aside funding for CCS projects, the CFD mechanism could be an important source of support for large
CCS projects as they come online.
CFD support low-carbon sources of energy by making investment more palatable due to reduced
uncertainty about electricity pricing, while also protecting consumers from overpayment.
Essentially, CFDs provide long-term price stabilization, allowing lower cost capital investment and,
thus, a lower net cost to consumers. The CFD is just beginning to be used and the first set of
allocations is limited to projects using onshore wind, solar PV, energy from waste with combined
heat and power, and landfill gas and sewage.
CFDs require generators to sell electricity to the market as usual. However, to reduce exposure to
fluctuating energy prices CFDs include a pre-determined strike price. This strike price operates
against a reference wholesale market price. If the reference wholesale market price is lower than
the strike price, the generator will be paid the difference between the two prices. Similarly, if the
reference price is higher than the strike price the generator will have to pay back the difference.
Although CCS projects are not currently listed in the CFD allocations, future CFD allocation rounds
are expected to include CCS, and two major projects are moving forward in the UK. The Peterhead
Project in Aberdeenshire will capture about one million tonnes per year (Mtpa) from an existing
natural gas combined-cycle plant and store it under the floor of the North Sea. The White Rose
project will capture about 2 Mtpa from a new 448-MW (gross) oxy-combustion coal-fired power
plant.
National Coal Council – Leveling the Playing Field
47
Appendix 6 – Case Study: FutureGen
The FutureGen 2.0 project was to demonstrate the retrofitting of an existing coal-fueled power plant with oxy-combustion technology and fully integrated CO2 capture. All captured CO2 was to be transported via pipeline to a deep saline geologic formation for permanent storage. Ultimately, the project did not proceed to full construction due to the DOE’s decision to suspend Federal cost-sharing after concluding that there would be insufficient time to expend the project’s Federal funds prior to expiration. As the project had secured all its major permits, had negotiated most commercial contracts, and was in the final phase of commercial financing, substantial policy-related lessons-learned can be drawn from it. It is important to highlight that being a FOAK project, both with respect to the oxy-combustion technology and the fully integrated geologic storage, the State of Illinois and the Federal government took certain policy-related measures to help reduce the FOAK cost and risk down to a level that a commercial financing could bear. Inevitably, FOAK technologies require more aggressive policy-related incentives than mature CCS technologies will require. Further, in the power sector, policy-related incentives must be robustly designed to be effective in different corporate environments. That is, policy-related incentives must meet the needs of regulated utilities, merchant plants, contracted plants, and non-profit rural electric generation companies, if CCS is to effectively penetrate the coal-based generation market. Further, a robust policy framework for CCS deployment must include complementary changes to both Federal and State policies. Policy-related lessons-learned are discussed below in the context of selected project accomplishments and challenges. Capital Cost Buy-Downs – As a FOAK project, the capital cost buy-down provided by DOE’s commitment of $1 billion dollars to the project was a necessary first step to establishing financial credibility in the marketplace. While Federal budgets are likely to be tight in coming years, the Department should consider whether larger investments in a limited number of projects versus spreading DOE funding broadly in smaller amounts would increase the likelihood of FOAK project success. CCS projects are by their very nature large capital allocations as distinct from smaller MW low carbon technologies (e.g., wind and solar). However this is the balance between stable baseload power and intermittent power. Further, there is no policy parity between renewable projects and coal projects when it comes to DOE grant taxation. Many energy projects are structured as partnerships (e.g., LLCs or MLPs). While DOE renewable grants are non-taxable when received by a partnership, fossil grants are taxed as income nominally resulting in a loss of approximately one-third of the grant funds. To avoid this untenable taxation, fossil projects must be structured as a C-corporation, which subsequently complicates commercial financing and increases project risk. DOE should advocate for policy parity on grant taxation.
National Coal Council – Leveling the Playing Field
48
Capital Financing Guarantees – DOE currently lacks the statutory authority to combine loan guarantees and grant funding on individual project. This is not the best use of two complementary policy tools. The Department should advocated for increased statutory authority that would allow the use of both guarantees and grants on the same project with an aggregate cap on DOE’s cost exposure (e.g., 80% of total capital) Operating Cost Coverage – Operating a coal-fueled power plant with CCS, particularly when employing geologic storage, requires a mechanism to cover the increased cost of generating low-carbon power. FutureGen 2.0 was the first project to secure an investment-grade PPA under the Illinois Clean Coal Portfolio Standard (CCPS), which provided a level playing field for low carbon technologies (i.e., renewables and CCS). The structure of the PPA allowed FutureGen 2.0 to engage financial markets as a long-term contracted asset. In FutureGen 2.0’s case, the PPA covered the incremental cost of deep saline storage for which there is no traditional economic driver. The CCPS could serve as a model for other States. At a Federal level a substantial refundable tax credit would help offset the cost of operation for a deep saline storage site. Power Plant Air Permitting – FutureGen 2.0 benefited from Illinois EPA’s modification of the power plant’s existing permit. The nature of the permit provided substantial flexibility that would have proved valuable in the early years of operating a FOAK plant. DOE, working with EPA, should consider what air permitting flexibility could be provided to other FOAK projects. CO2 Pipeline Permitting – The State of Illinois passed new legislation regarding the siting of CO2 pipelines that enabled FutureGen 2.0 to receive a final pipeline permit as well as the right of eminent domain for pipeline siting. Through substantial stakeholder involvement activity, the FutureGen 2.0 project remained hopeful that the exercise of eminent domain would not be necessary; however, on most projects this policy mechanism will be required. CO2 Storage Rights – A remarkable project achievement was the project’s ability to work with local landowners to acquire control, on a free-market basis, 100% of the necessary pore space. This success is due in part to the public community placing a high value on the job creation and the project’s associated training center. On most CCS projects, it will likely be necessary to have some form of unitization or eminent domain when private property is involved. This is predominantly a State policy issue. On Federal lands, a granting of pore space rights would be necessary. CO2 Storage Liability – The State of Illinois passed unique legislation that required certain operator responsibility, as well as having the State taking on certain long-term stewardship and liability responsibilities. Unquestionably, this help improve the commercial financeability of the project. This landmark legislation could serve as a model for Federal or State policy.
National Coal Council – Leveling the Playing Field
49
Appendix 7 – Case Study: Government Support and a Strong Business Case Energize Boundary Dam
The Boundary Dam Power Plant in Saskatchewan, Canada has become a flagship clean energy
project and has set the bar for CCS/CCUS projects around the world. The world’s first-ever, large-
scale, coal-fired post-combustion CO2 capture project began operation on October 2, 2014.
However, as with most first-of-its-kind energy projects CCS at Boundary Dam would never have
come to fruition without the support of the Saskatchewan and Canadian governments. According to
a report issued by the IEA, “Federal funding was the catalyst for converting SaskPower’s clean coal
power concept into a fully engineered design.”
Active support from the Saskatchewan government began in 2007 to secure the Federal funding
needed to support SaskPower’s landmark clean coal project. The Saskatchewan government was, in
part, motived by the business case made by SaskPower beyond the demonstration of coal-fired CCS.
Royalties from CO2-EOR, extending the life of an important oil field in the region, maintaining jobs in
oil production, and supporting a technology to allow for Saskatchewan to continue using its vast
lignite reserves in a carbon-constrained future helped support the business case.
SaskPower created the business case—and the Saskatchewan government took that case to the
highest levels of government, successfully securing $240 million in Federal funding in 2008. These
funds were instrumental in completing the plant design—a critical step where similar projects
have stumbled.
This support was especially visionary because when it was provided there were no regulations in
place, at either the Federal or provincial level, that required CO2 to be captured and stored. Thus,
there were also no offsets available to help support the project. Regulations were not enacted for
four years after government support was committed.
CCS at Boundary Dam can be considered a joint venture between the Canadian and Saskatchewan
governments and SaskPower. In addition to the financial support, the governments have been vocal
on the merits of the project, both nationally and internationally. The Boundary Dam project,
including the role of government in advancing the project, is a prominent example of the public-
sector collaboration necessary to advance clean coal projects around the world.
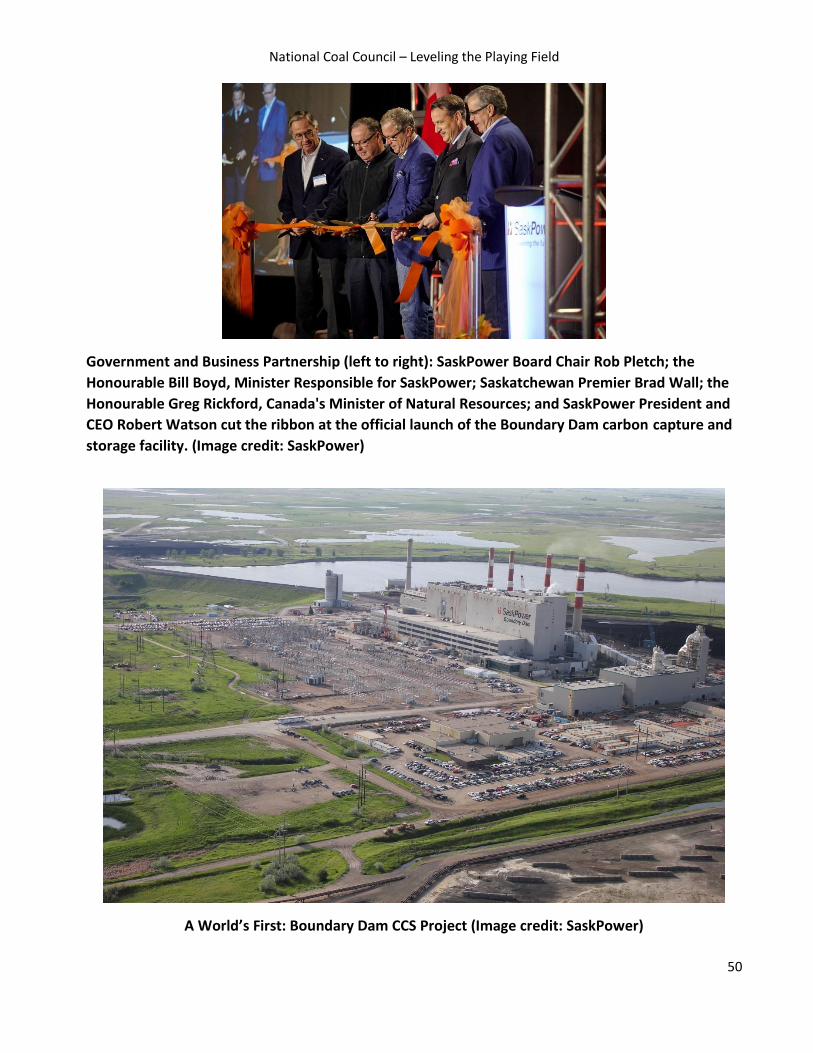
National Coal Council – Leveling the Playing Field
50
Government and Business Partnership (left to right): SaskPower Board Chair Rob Pletch; the
Honourable Bill Boyd, Minister Responsible for SaskPower; Saskatchewan Premier Brad Wall; the
Honourable Greg Rickford, Canada's Minister of Natural Resources; and SaskPower President and
CEO Robert Watson cut the ribbon at the official launch of the Boundary Dam carbon capture and
storage facility. (Image credit: SaskPower)
A World’s First: Boundary Dam CCS Project (Image credit: SaskPower)
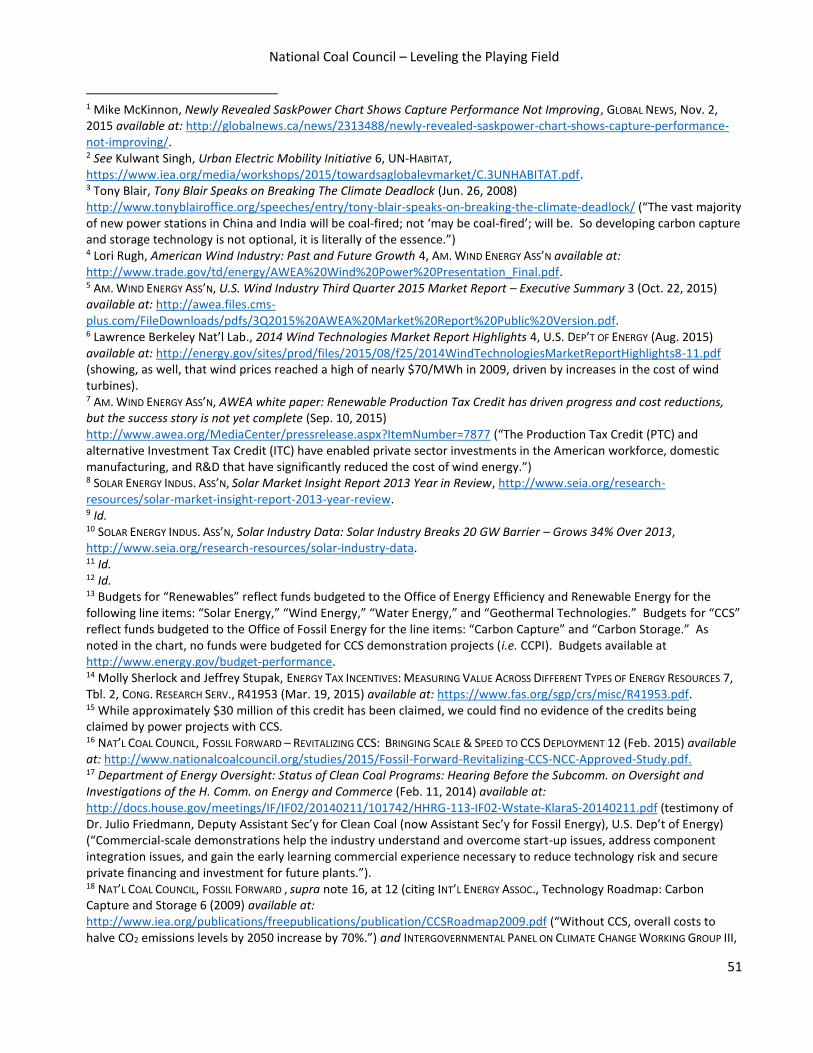
National Coal Council – Leveling the Playing Field
51
1 Mike McKinnon, Newly Revealed SaskPower Chart Shows Capture Performance Not Improving, GLOBAL NEWS, Nov. 2, 2015 available at: http://globalnews.ca/news/2313488/newly-revealed-saskpower-chart-shows-capture-performance-not-improving/. 2 See Kulwant Singh, Urban Electric Mobility Initiative 6, UN-HABITAT, https://www.iea.org/media/workshops/2015/towardsaglobalevmarket/C.3UNHABITAT.pdf. 3 Tony Blair, Tony Blair Speaks on Breaking The Climate Deadlock (Jun. 26, 2008) http://www.tonyblairoffice.org/speeches/entry/tony-blair-speaks-on-breaking-the-climate-deadlock/ (“The vast majority of new power stations in China and India will be coal-fired; not ‘may be coal-fired’; will be. So developing carbon capture and storage technology is not optional, it is literally of the essence.”) 4 Lori Rugh, American Wind Industry: Past and Future Growth 4, AM. WIND ENERGY ASS’N available at: http://www.trade.gov/td/energy/AWEA%20Wind%20Power%20Presentation_Final.pdf. 5 AM. WIND ENERGY ASS’N, U.S. Wind Industry Third Quarter 2015 Market Report – Executive Summary 3 (Oct. 22, 2015) available at: http://awea.files.cms-plus.com/FileDownloads/pdfs/3Q2015%20AWEA%20Market%20Report%20Public%20Version.pdf. 6 Lawrence Berkeley Nat’l Lab., 2014 Wind Technologies Market Report Highlights 4, U.S. DEP’T OF ENERGY (Aug. 2015) available at: http://energy.gov/sites/prod/files/2015/08/f25/2014WindTechnologiesMarketReportHighlights8-11.pdf (showing, as well, that wind prices reached a high of nearly $70/MWh in 2009, driven by increases in the cost of wind turbines). 7 AM. WIND ENERGY ASS’N, AWEA white paper: Renewable Production Tax Credit has driven progress and cost reductions, but the success story is not yet complete (Sep. 10, 2015) http://www.awea.org/MediaCenter/pressrelease.aspx?ItemNumber=7877 (“The Production Tax Credit (PTC) and alternative Investment Tax Credit (ITC) have enabled private sector investments in the American workforce, domestic manufacturing, and R&D that have significantly reduced the cost of wind energy.”) 8 SOLAR ENERGY INDUS. ASS’N, Solar Market Insight Report 2013 Year in Review, http://www.seia.org/research-resources/solar-market-insight-report-2013-year-review. 9 Id. 10 SOLAR ENERGY INDUS. ASS’N, Solar Industry Data: Solar Industry Breaks 20 GW Barrier – Grows 34% Over 2013, http://www.seia.org/research-resources/solar-industry-data. 11 Id. 12 Id. 13 Budgets for “Renewables” reflect funds budgeted to the Office of Energy Efficiency and Renewable Energy for the following line items: “Solar Energy,” “Wind Energy,” “Water Energy,” and “Geothermal Technologies.” Budgets for “CCS” reflect funds budgeted to the Office of Fossil Energy for the line items: “Carbon Capture” and “Carbon Storage.” As noted in the chart, no funds were budgeted for CCS demonstration projects (i.e. CCPI). Budgets available at http://www.energy.gov/budget-performance. 14 Molly Sherlock and Jeffrey Stupak, ENERGY TAX INCENTIVES: MEASURING VALUE ACROSS DIFFERENT TYPES OF ENERGY RESOURCES 7, Tbl. 2, CONG. RESEARCH SERV., R41953 (Mar. 19, 2015) available at: https://www.fas.org/sgp/crs/misc/R41953.pdf. 15 While approximately $30 million of this credit has been claimed, we could find no evidence of the credits being claimed by power projects with CCS. 16 NAT’L COAL COUNCIL, FOSSIL FORWARD – REVITALIZING CCS: BRINGING SCALE & SPEED TO CCS DEPLOYMENT 12 (Feb. 2015) available at: http://www.nationalcoalcouncil.org/studies/2015/Fossil-Forward-Revitalizing-CCS-NCC-Approved-Study.pdf. 17 Department of Energy Oversight: Status of Clean Coal Programs: Hearing Before the Subcomm. on Oversight and Investigations of the H. Comm. on Energy and Commerce (Feb. 11, 2014) available at: http://docs.house.gov/meetings/IF/IF02/20140211/101742/HHRG-113-IF02-Wstate-KlaraS-20140211.pdf (testimony of Dr. Julio Friedmann, Deputy Assistant Sec’y for Clean Coal (now Assistant Sec’y for Fossil Energy), U.S. Dep’t of Energy) (“Commercial-scale demonstrations help the industry understand and overcome start-up issues, address component integration issues, and gain the early learning commercial experience necessary to reduce technology risk and secure private financing and investment for future plants.”). 18 NAT’L COAL COUNCIL, FOSSIL FORWARD , supra note 16, at 12 (citing INT’L ENERGY ASSOC., Technology Roadmap: Carbon Capture and Storage 6 (2009) available at: http://www.iea.org/publications/freepublications/publication/CCSRoadmap2009.pdf (“Without CCS, overall costs to halve CO2 emissions levels by 2050 increase by 70%.”) and INTERGOVERNMENTAL PANEL ON CLIMATE CHANGE WORKING GROUP III,
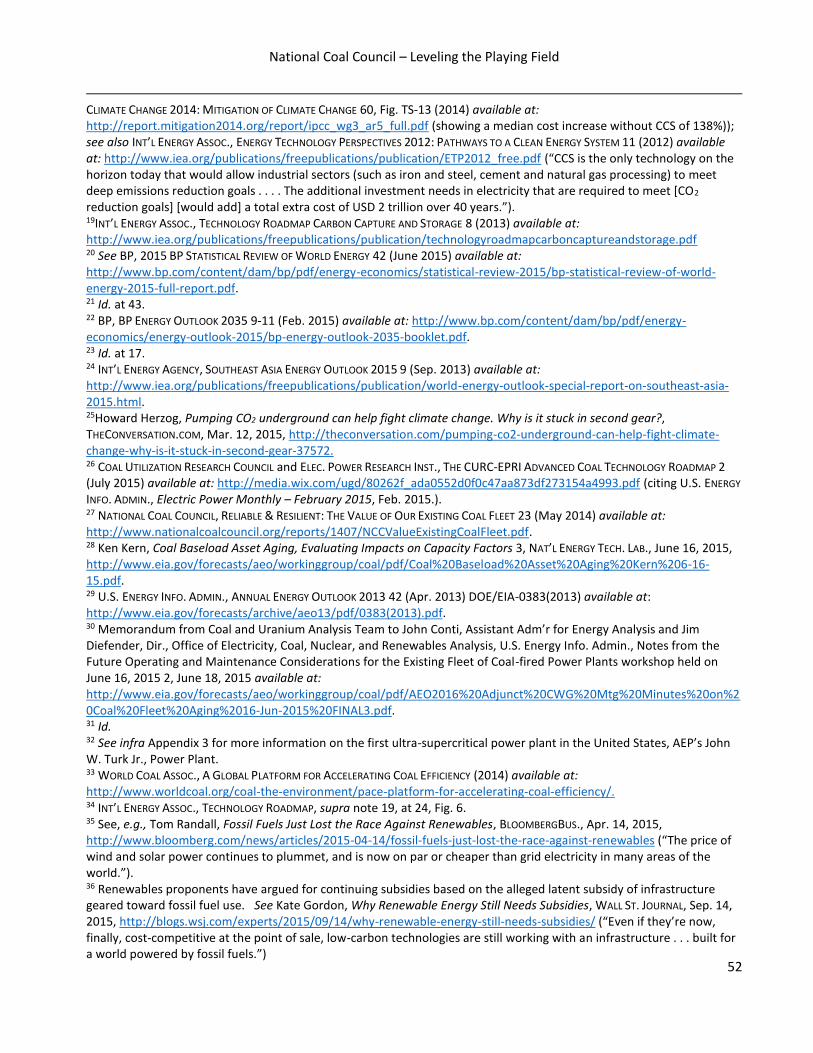
National Coal Council – Leveling the Playing Field
52
CLIMATE CHANGE 2014: MITIGATION OF CLIMATE CHANGE 60, Fig. TS-13 (2014) available at: http://report.mitigation2014.org/report/ipcc_wg3_ar5_full.pdf (showing a median cost increase without CCS of 138%)); see also INT’L ENERGY ASSOC., ENERGY TECHNOLOGY PERSPECTIVES 2012: PATHWAYS TO A CLEAN ENERGY SYSTEM 11 (2012) available at: http://www.iea.org/publications/freepublications/publication/ETP2012_free.pdf (“CCS is the only technology on the horizon today that would allow industrial sectors (such as iron and steel, cement and natural gas processing) to meet deep emissions reduction goals . . . . The additional investment needs in electricity that are required to meet [CO2 reduction goals] [would add] a total extra cost of USD 2 trillion over 40 years.”). 19INT’L ENERGY ASSOC., TECHNOLOGY ROADMAP CARBON CAPTURE AND STORAGE 8 (2013) available at: http://www.iea.org/publications/freepublications/publication/technologyroadmapcarboncaptureandstorage.pdf 20 See BP, 2015 BP STATISTICAL REVIEW OF WORLD ENERGY 42 (June 2015) available at: http://www.bp.com/content/dam/bp/pdf/energy-economics/statistical-review-2015/bp-statistical-review-of-world-energy-2015-full-report.pdf. 21 Id. at 43. 22 BP, BP ENERGY OUTLOOK 2035 9-11 (Feb. 2015) available at: http://www.bp.com/content/dam/bp/pdf/energy-economics/energy-outlook-2015/bp-energy-outlook-2035-booklet.pdf. 23 Id. at 17. 24 INT’L ENERGY AGENCY, SOUTHEAST ASIA ENERGY OUTLOOK 2015 9 (Sep. 2013) available at: http://www.iea.org/publications/freepublications/publication/world-energy-outlook-special-report-on-southeast-asia-2015.html. 25Howard Herzog, Pumping CO2 underground can help fight climate change. Why is it stuck in second gear?, THECONVERSATION.COM, Mar. 12, 2015, http://theconversation.com/pumping-co2-underground-can-help-fight-climate-change-why-is-it-stuck-in-second-gear-37572. 26 COAL UTILIZATION RESEARCH COUNCIL and ELEC. POWER RESEARCH INST., THE CURC-EPRI ADVANCED COAL TECHNOLOGY ROADMAP 2
(July 2015) available at: http://media.wix.com/ugd/80262f_ada0552d0f0c47aa873df273154a4993.pdf (citing U.S. ENERGY
INFO. ADMIN., Electric Power Monthly – February 2015, Feb. 2015.). 27 NATIONAL COAL COUNCIL, RELIABLE & RESILIENT: THE VALUE OF OUR EXISTING COAL FLEET 23 (May 2014) available at: http://www.nationalcoalcouncil.org/reports/1407/NCCValueExistingCoalFleet.pdf. 28 Ken Kern, Coal Baseload Asset Aging, Evaluating Impacts on Capacity Factors 3, NAT’L ENERGY TECH. LAB., June 16, 2015, http://www.eia.gov/forecasts/aeo/workinggroup/coal/pdf/Coal%20Baseload%20Asset%20Aging%20Kern%206-16-15.pdf. 29 U.S. ENERGY INFO. ADMIN., ANNUAL ENERGY OUTLOOK 2013 42 (Apr. 2013) DOE/EIA-0383(2013) available at: http://www.eia.gov/forecasts/archive/aeo13/pdf/0383(2013).pdf. 30 Memorandum from Coal and Uranium Analysis Team to John Conti, Assistant Adm’r for Energy Analysis and Jim Diefender, Dir., Office of Electricity, Coal, Nuclear, and Renewables Analysis, U.S. Energy Info. Admin., Notes from the Future Operating and Maintenance Considerations for the Existing Fleet of Coal-fired Power Plants workshop held on June 16, 2015 2, June 18, 2015 available at: http://www.eia.gov/forecasts/aeo/workinggroup/coal/pdf/AEO2016%20Adjunct%20CWG%20Mtg%20Minutes%20on%20Coal%20Fleet%20Aging%2016-Jun-2015%20FINAL3.pdf. 31 Id. 32 See infra Appendix 3 for more information on the first ultra-supercritical power plant in the United States, AEP’s John W. Turk Jr., Power Plant. 33 WORLD COAL ASSOC., A GLOBAL PLATFORM FOR ACCELERATING COAL EFFICIENCY (2014) available at: http://www.worldcoal.org/coal-the-environment/pace-platform-for-accelerating-coal-efficiency/. 34 INT’L ENERGY ASSOC., TECHNOLOGY ROADMAP, supra note 19, at 24, Fig. 6. 35 See, e.g., Tom Randall, Fossil Fuels Just Lost the Race Against Renewables, BLOOMBERGBUS., Apr. 14, 2015, http://www.bloomberg.com/news/articles/2015-04-14/fossil-fuels-just-lost-the-race-against-renewables (“The price of wind and solar power continues to plummet, and is now on par or cheaper than grid electricity in many areas of the world.”). 36 Renewables proponents have argued for continuing subsidies based on the alleged latent subsidy of infrastructure geared toward fossil fuel use. See Kate Gordon, Why Renewable Energy Still Needs Subsidies, WALL ST. JOURNAL, Sep. 14, 2015, http://blogs.wsj.com/experts/2015/09/14/why-renewable-energy-still-needs-subsidies/ (“Even if they’re now, finally, cost-competitive at the point of sale, low-carbon technologies are still working with an infrastructure . . . built for a world powered by fossil fuels.”)
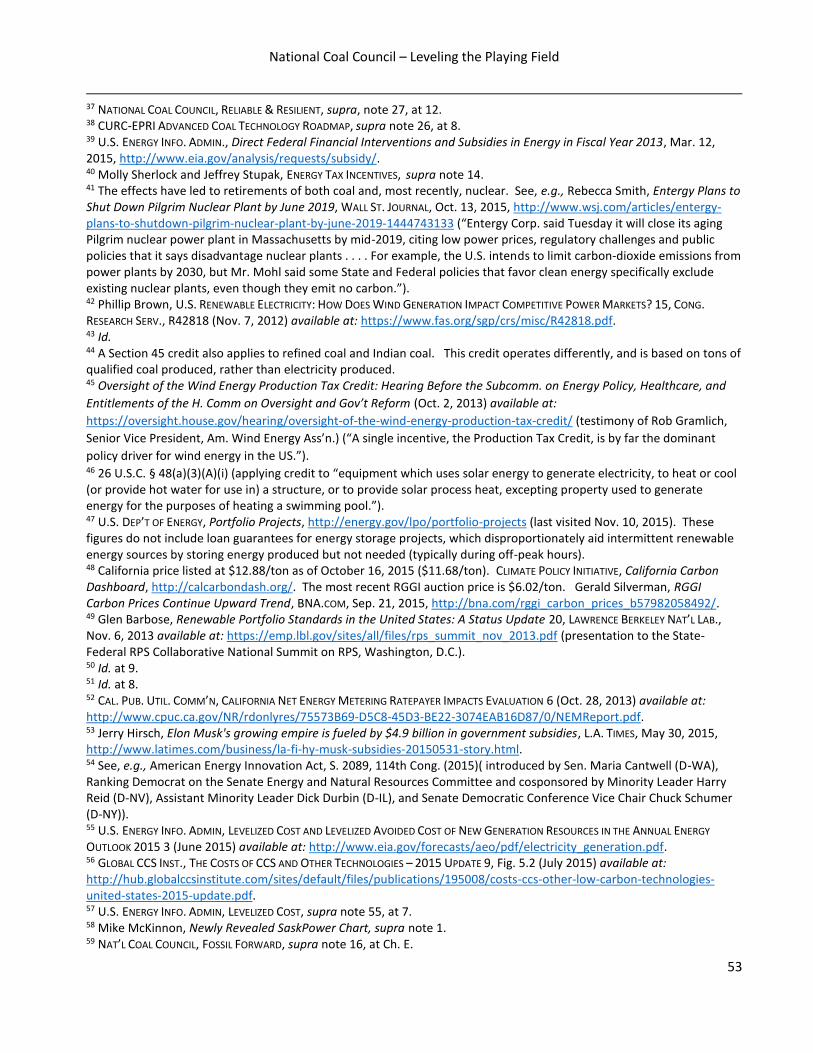
National Coal Council – Leveling the Playing Field
53
37 NATIONAL COAL COUNCIL, RELIABLE & RESILIENT, supra, note 27, at 12. 38 CURC-EPRI ADVANCED COAL TECHNOLOGY ROADMAP, supra note 26, at 8. 39 U.S. ENERGY INFO. ADMIN., Direct Federal Financial Interventions and Subsidies in Energy in Fiscal Year 2013, Mar. 12, 2015, http://www.eia.gov/analysis/requests/subsidy/. 40 Molly Sherlock and Jeffrey Stupak, ENERGY TAX INCENTIVES, supra note 14. 41 The effects have led to retirements of both coal and, most recently, nuclear. See, e.g., Rebecca Smith, Entergy Plans to Shut Down Pilgrim Nuclear Plant by June 2019, WALL ST. JOURNAL, Oct. 13, 2015, http://www.wsj.com/articles/entergy-plans-to-shutdown-pilgrim-nuclear-plant-by-june-2019-1444743133 (“Entergy Corp. said Tuesday it will close its aging Pilgrim nuclear power plant in Massachusetts by mid-2019, citing low power prices, regulatory challenges and public policies that it says disadvantage nuclear plants . . . . For example, the U.S. intends to limit carbon-dioxide emissions from power plants by 2030, but Mr. Mohl said some State and Federal policies that favor clean energy specifically exclude existing nuclear plants, even though they emit no carbon.”). 42 Phillip Brown, U.S. RENEWABLE ELECTRICITY: HOW DOES WIND GENERATION IMPACT COMPETITIVE POWER MARKETS? 15, CONG. RESEARCH SERV., R42818 (Nov. 7, 2012) available at: https://www.fas.org/sgp/crs/misc/R42818.pdf. 43 Id. 44 A Section 45 credit also applies to refined coal and Indian coal. This credit operates differently, and is based on tons of qualified coal produced, rather than electricity produced. 45 Oversight of the Wind Energy Production Tax Credit: Hearing Before the Subcomm. on Energy Policy, Healthcare, and
Entitlements of the H. Comm on Oversight and Gov’t Reform (Oct. 2, 2013) available at:
https://oversight.house.gov/hearing/oversight-of-the-wind-energy-production-tax-credit/ (testimony of Rob Gramlich,
Senior Vice President, Am. Wind Energy Ass’n.) (“A single incentive, the Production Tax Credit, is by far the dominant
policy driver for wind energy in the US.”). 46 26 U.S.C. § 48(a)(3)(A)(i) (applying credit to “equipment which uses solar energy to generate electricity, to heat or cool (or provide hot water for use in) a structure, or to provide solar process heat, excepting property used to generate energy for the purposes of heating a swimming pool.”). 47 U.S. DEP’T OF ENERGY, Portfolio Projects, http://energy.gov/lpo/portfolio-projects (last visited Nov. 10, 2015). These figures do not include loan guarantees for energy storage projects, which disproportionately aid intermittent renewable energy sources by storing energy produced but not needed (typically during off-peak hours). 48 California price listed at $12.88/ton as of October 16, 2015 ($11.68/ton). CLIMATE POLICY INITIATIVE, California Carbon Dashboard, http://calcarbondash.org/. The most recent RGGI auction price is $6.02/ton. Gerald Silverman, RGGI Carbon Prices Continue Upward Trend, BNA.COM, Sep. 21, 2015, http://bna.com/rggi_carbon_prices_b57982058492/. 49 Glen Barbose, Renewable Portfolio Standards in the United States: A Status Update 20, LAWRENCE BERKELEY NAT’L LAB., Nov. 6, 2013 available at: https://emp.lbl.gov/sites/all/files/rps_summit_nov_2013.pdf (presentation to the State-Federal RPS Collaborative National Summit on RPS, Washington, D.C.). 50 Id. at 9. 51 Id. at 8. 52 CAL. PUB. UTIL. COMM’N, CALIFORNIA NET ENERGY METERING RATEPAYER IMPACTS EVALUATION 6 (Oct. 28, 2013) available at: http://www.cpuc.ca.gov/NR/rdonlyres/75573B69-D5C8-45D3-BE22-3074EAB16D87/0/NEMReport.pdf. 53 Jerry Hirsch, Elon Musk's growing empire is fueled by $4.9 billion in government subsidies, L.A. TIMES, May 30, 2015, http://www.latimes.com/business/la-fi-hy-musk-subsidies-20150531-story.html. 54 See, e.g., American Energy Innovation Act, S. 2089, 114th Cong. (2015)( introduced by Sen. Maria Cantwell (D-WA), Ranking Democrat on the Senate Energy and Natural Resources Committee and cosponsored by Minority Leader Harry Reid (D-NV), Assistant Minority Leader Dick Durbin (D-IL), and Senate Democratic Conference Vice Chair Chuck Schumer (D-NY)). 55 U.S. ENERGY INFO. ADMIN, LEVELIZED COST AND LEVELIZED AVOIDED COST OF NEW GENERATION RESOURCES IN THE ANNUAL ENERGY
OUTLOOK 2015 3 (June 2015) available at: http://www.eia.gov/forecasts/aeo/pdf/electricity_generation.pdf. 56 GLOBAL CCS INST., THE COSTS OF CCS AND OTHER TECHNOLOGIES – 2015 UPDATE 9, Fig. 5.2 (July 2015) available at: http://hub.globalccsinstitute.com/sites/default/files/publications/195008/costs-ccs-other-low-carbon-technologies-united-states-2015-update.pdf. 57 U.S. ENERGY INFO. ADMIN, LEVELIZED COST, supra note 55, at 7. 58 Mike McKinnon, Newly Revealed SaskPower Chart, supra note 1. 59 NAT’L COAL COUNCIL, FOSSIL FORWARD, supra note 16, at Ch. E.
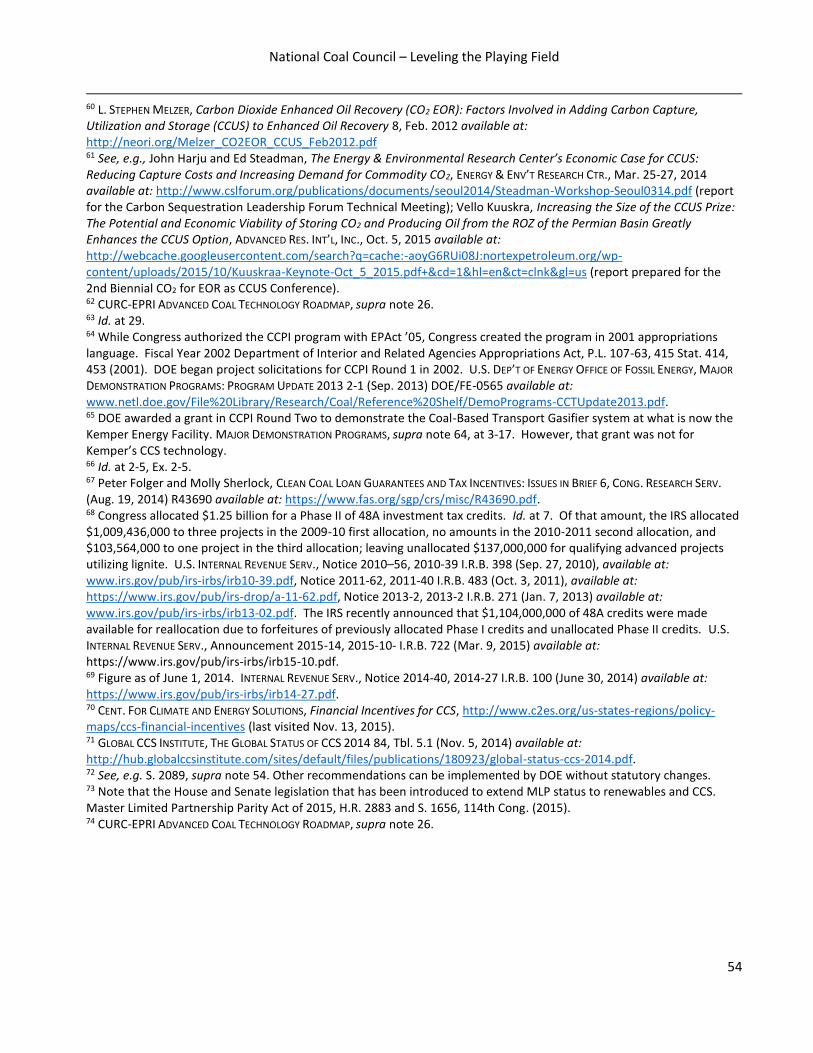
National Coal Council – Leveling the Playing Field
54
60 L. STEPHEN MELZER, Carbon Dioxide Enhanced Oil Recovery (CO2 EOR): Factors Involved in Adding Carbon Capture, Utilization and Storage (CCUS) to Enhanced Oil Recovery 8, Feb. 2012 available at: http://neori.org/Melzer_CO2EOR_CCUS_Feb2012.pdf 61 See, e.g., John Harju and Ed Steadman, The Energy & Environmental Research Center’s Economic Case for CCUS: Reducing Capture Costs and Increasing Demand for Commodity CO2, ENERGY & ENV’T RESEARCH CTR., Mar. 25-27, 2014 available at: http://www.cslforum.org/publications/documents/seoul2014/Steadman-Workshop-Seoul0314.pdf (report for the Carbon Sequestration Leadership Forum Technical Meeting); Vello Kuuskra, Increasing the Size of the CCUS Prize: The Potential and Economic Viability of Storing CO2 and Producing Oil from the ROZ of the Permian Basin Greatly Enhances the CCUS Option, ADVANCED RES. INT’L, INC., Oct. 5, 2015 available at: http://webcache.googleusercontent.com/search?q=cache:-aoyG6RUi08J:nortexpetroleum.org/wp-content/uploads/2015/10/Kuuskraa-Keynote-Oct_5_2015.pdf+&cd=1&hl=en&ct=clnk&gl=us (report prepared for the 2nd Biennial CO2 for EOR as CCUS Conference). 62 CURC-EPRI ADVANCED COAL TECHNOLOGY ROADMAP, supra note 26. 63 Id. at 29. 64 While Congress authorized the CCPI program with EPAct ’05, Congress created the program in 2001 appropriations language. Fiscal Year 2002 Department of Interior and Related Agencies Appropriations Act, P.L. 107-63, 415 Stat. 414, 453 (2001). DOE began project solicitations for CCPI Round 1 in 2002. U.S. DEP’T OF ENERGY OFFICE OF FOSSIL ENERGY, MAJOR
DEMONSTRATION PROGRAMS: PROGRAM UPDATE 2013 2-1 (Sep. 2013) DOE/FE-0565 available at: www.netl.doe.gov/File%20Library/Research/Coal/Reference%20Shelf/DemoPrograms-CCTUpdate2013.pdf. 65 DOE awarded a grant in CCPI Round Two to demonstrate the Coal-Based Transport Gasifier system at what is now the Kemper Energy Facility. MAJOR DEMONSTRATION PROGRAMS, supra note 64, at 3-17. However, that grant was not for Kemper’s CCS technology. 66 Id. at 2-5, Ex. 2-5. 67 Peter Folger and Molly Sherlock, CLEAN COAL LOAN GUARANTEES AND TAX INCENTIVES: ISSUES IN BRIEF 6, CONG. RESEARCH SERV. (Aug. 19, 2014) R43690 available at: https://www.fas.org/sgp/crs/misc/R43690.pdf. 68 Congress allocated $1.25 billion for a Phase II of 48A investment tax credits. Id. at 7. Of that amount, the IRS allocated $1,009,436,000 to three projects in the 2009-10 first allocation, no amounts in the 2010-2011 second allocation, and $103,564,000 to one project in the third allocation; leaving unallocated $137,000,000 for qualifying advanced projects utilizing lignite. U.S. INTERNAL REVENUE SERV., Notice 2010–56, 2010-39 I.R.B. 398 (Sep. 27, 2010), available at: www.irs.gov/pub/irs-irbs/irb10-39.pdf, Notice 2011-62, 2011-40 I.R.B. 483 (Oct. 3, 2011), available at: https://www.irs.gov/pub/irs-drop/a-11-62.pdf, Notice 2013-2, 2013-2 I.R.B. 271 (Jan. 7, 2013) available at: www.irs.gov/pub/irs-irbs/irb13-02.pdf. The IRS recently announced that $1,104,000,000 of 48A credits were made available for reallocation due to forfeitures of previously allocated Phase I credits and unallocated Phase II credits. U.S. INTERNAL REVENUE SERV., Announcement 2015-14, 2015-10- I.R.B. 722 (Mar. 9, 2015) available at: https://www.irs.gov/pub/irs-irbs/irb15-10.pdf. 69 Figure as of June 1, 2014. INTERNAL REVENUE SERV., Notice 2014-40, 2014-27 I.R.B. 100 (June 30, 2014) available at: https://www.irs.gov/pub/irs-irbs/irb14-27.pdf. 70 CENT. FOR CLIMATE AND ENERGY SOLUTIONS, Financial Incentives for CCS, http://www.c2es.org/us-states-regions/policy-maps/ccs-financial-incentives (last visited Nov. 13, 2015). 71 GLOBAL CCS INSTITUTE, THE GLOBAL STATUS OF CCS 2014 84, Tbl. 5.1 (Nov. 5, 2014) available at: http://hub.globalccsinstitute.com/sites/default/files/publications/180923/global-status-ccs-2014.pdf. 72 See, e.g. S. 2089, supra note 54. Other recommendations can be implemented by DOE without statutory changes. 73 Note that the House and Senate legislation that has been introduced to extend MLP status to renewables and CCS. Master Limited Partnership Parity Act of 2015, H.R. 2883 and S. 1656, 114th Cong. (2015). 74 CURC-EPRI ADVANCED COAL TECHNOLOGY ROADMAP, supra note 26.