energy shareholder alignment review: leveling the playing ......energy shareholder alignment review:...
TRANSCRIPT

Energy Shareholder Alignment Review:
Leveling the Playing Field
Doug Terreson
Steve Richardson
James West
Thursday, August 8th, 2019
11:00 am ET

Webinar Agenda
1) Doug Terreson
Integrated Oil & Gas
+1 251 928-6440
2) Stephen Richardson
Exploration & Production
+1 212 446-5639
3) James West
Oilfield Services, Equipment & Drilling
+1 212-653-9047
2

3
Energy Corporate Governance “State of the Union 2019”
• How Did We Get Here?
• Annual Pay Factors: Do They Matter?
• Long-Term Pay: The “Low Bar” in Energy
• Caveat Emptor For Energy Investors vs. S&P 500, Cyclical Peers
• Generalists Will Continue to Avoid Energy Until Boards Make 4 Changes
4
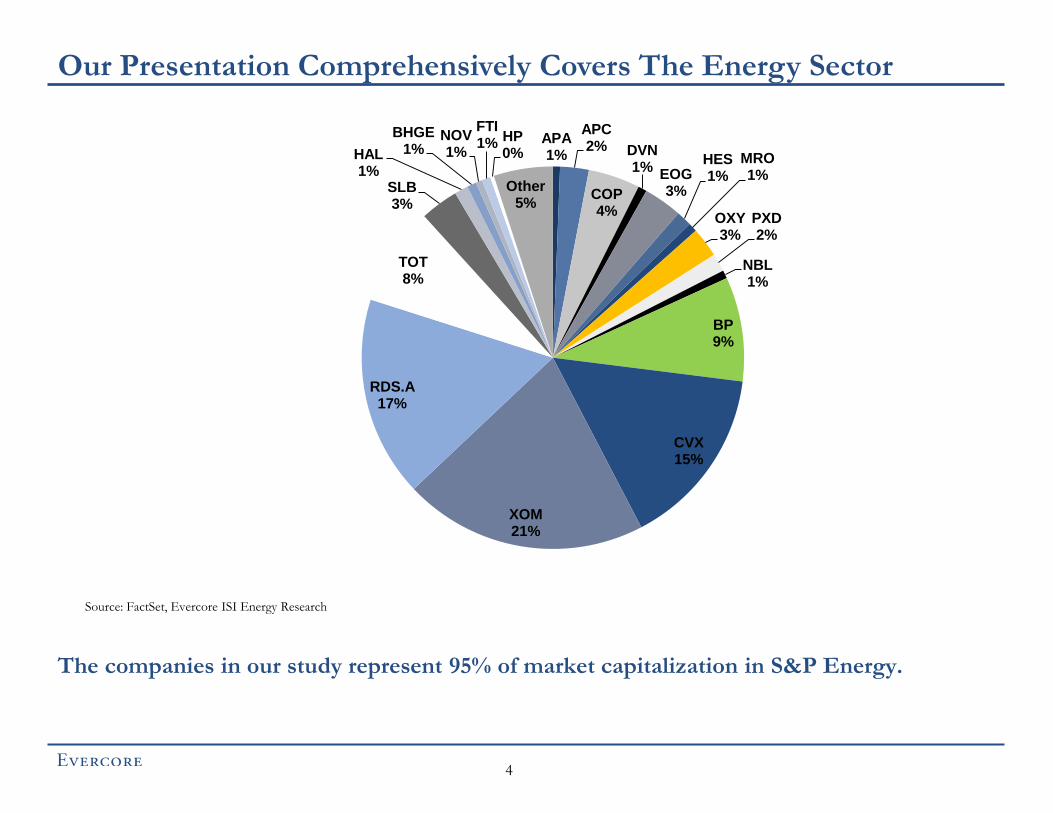
Our Presentation Comprehensively Covers The Energy Sector
Source: FactSet, Evercore ISI Energy Research
The companies in our study represent 95% of market capitalization in S&P Energy.
APA 1%
APC 2%
COP 4%
DVN 1%
EOG 3%
HES 1%
MRO 1%
OXY 3%
PXD 2%
NBL 1%
BP 9%
CVX 15%
XOM 21%
RDS.A 17%
TOT 8%
SLB 3%
HAL 1%
BHGE 1%
NOV 1%
FTI 1% HP
0%
Other 5%
5
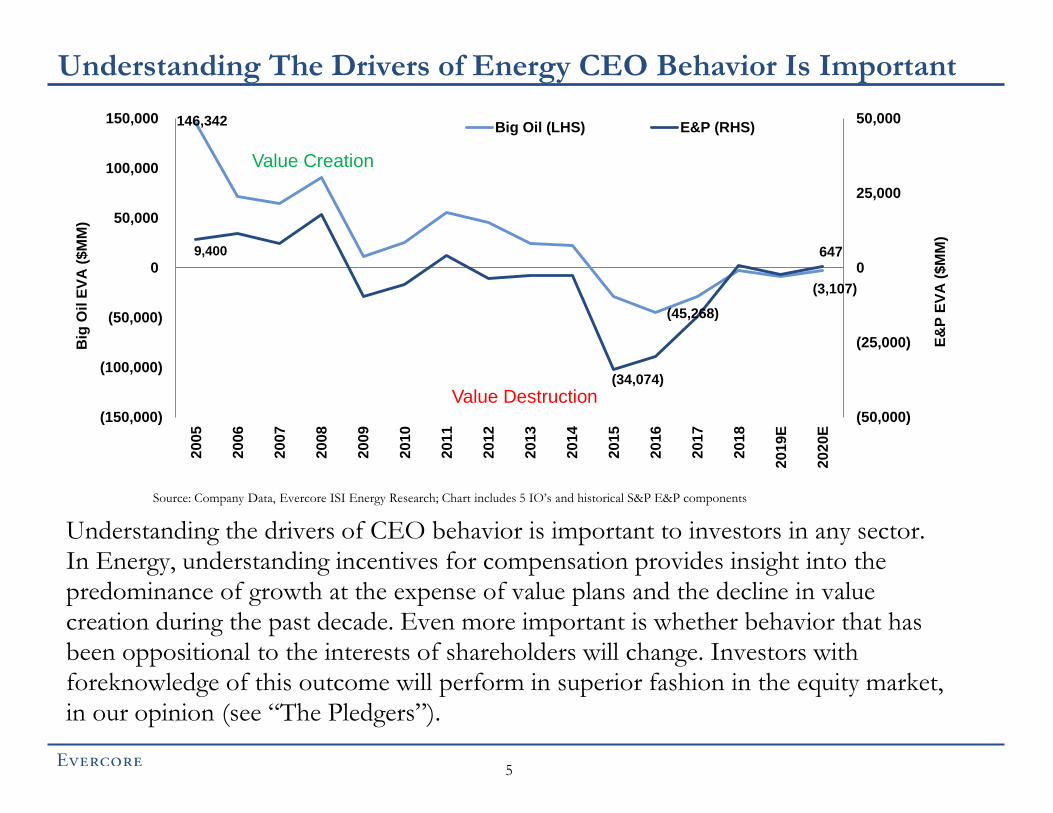
Understanding The Drivers of Energy CEO Behavior Is Important
Understanding the drivers of CEO behavior is important to investors in any sector. In Energy, understanding incentives for compensation provides insight into the predominance of growth at the expense of value plans and the decline in value creation during the past decade. Even more important is whether behavior that has been oppositional to the interests of shareholders will change. Investors with foreknowledge of this outcome will perform in superior fashion in the equity market, in our opinion (see “The Pledgers”).
Value Creation
Value Destruction
Source: Company Data, Evercore ISI Energy Research; Chart includes 5 IO’s and historical S&P E&P components
146,342
(45,268)
(3,107)
9,400
(34,074)
647
(50,000)
(25,000)
0
25,000
50,000
(150,000)
(100,000)
(50,000)
0
50,000
100,000
150,000
2005
2006
2007
2008
2009
2010
2011
2012
2013
2014
2015
2016
2017
2018
2019E
2020E
E&
P E
VA
($M
M)
Big
Oil
EV
A (
$M
M)
Big Oil (LHS) E&P (RHS)
6
The CEO Pay Setting Process in Energy
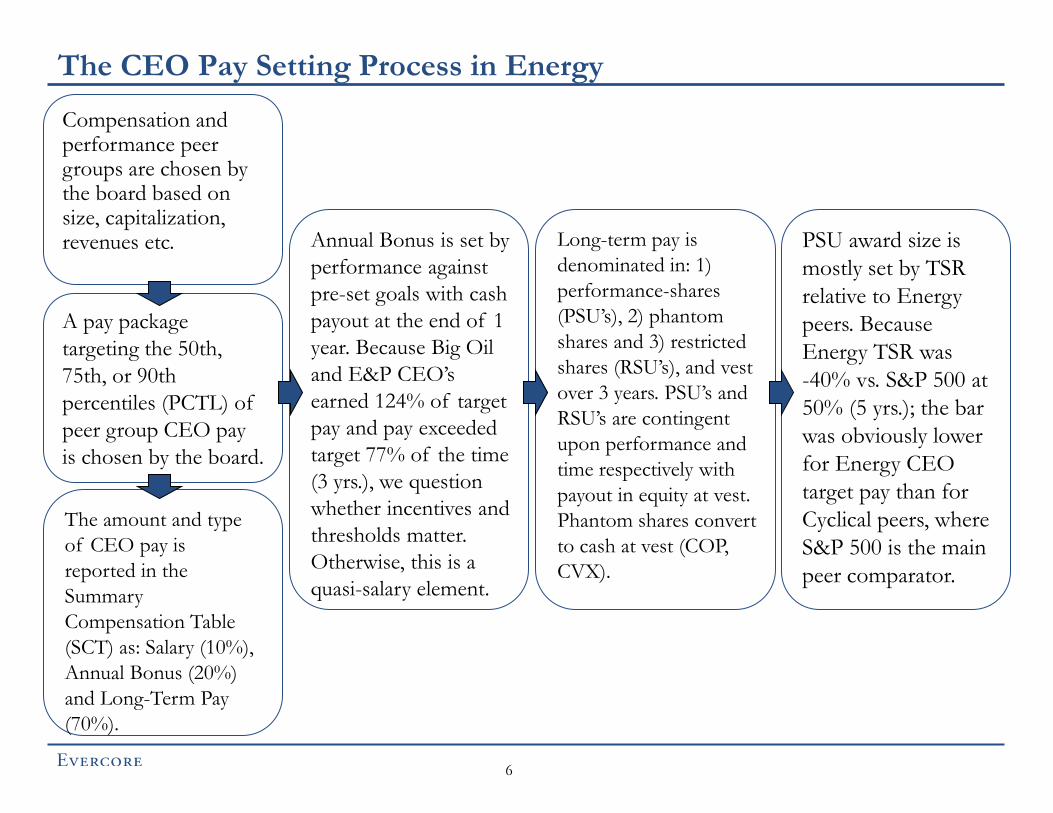
Compensation and performance peer groups are chosen by the board based on size, capitalization, revenues etc.
A pay package
targeting the 50th,
75th, or 90th
percentiles (PCTL) of
peer group CEO pay
is chosen by the board.
The amount and type
of CEO pay is
reported in the
Summary
Compensation Table
(SCT) as: Salary (10%),
Annual Bonus (20%)
and Long-Term Pay
(70%).
Annual Bonus is set by
performance against
pre-set goals with cash
payout at the end of 1
year. Because Big Oil
and E&P CEO’s
earned 124% of target
pay and pay exceeded
target 77% of the time
(3 yrs.), we question
whether incentives and
thresholds matter.
Otherwise, this is a
quasi-salary element.
Long-term pay is
denominated in: 1)
performance-shares
(PSU’s), 2) phantom
shares and 3) restricted
shares (RSU’s), and vest
over 3 years. PSU’s and
RSU’s are contingent
upon performance and
time respectively with
payout in equity at vest.
Phantom shares convert
to cash at vest (COP,
CVX).
PSU award size is
mostly set by TSR
relative to Energy
peers. Because
Energy TSR was
-40% vs. S&P 500 at
50% (5 yrs.); the bar
was obviously lower
for Energy CEO
target pay than for
Cyclical peers, where
S&P 500 is the main
peer comparator.

7
Peer Grouping = Pay Setting
Compensation Benchmark Companies
AT&T Boeing Chevron
Ford General Electric General Motors
IBM Johnson & Johnson Pfizer
Procter & Gamble United Technologies Verizon
Performance Peers
Chevron Shell Total BP
ExxonMobil’s Compensation Peers
Source: Company Data, Evercore ISI Energy Research
Pioneer’s Compensation and Performance Peers
The CEO pay level for every Big Oil plus ConocoPhillips emanates from compensation
peer group pay ranges (see ExxonMobil above). In E&P, Performance peers serve both
“Peer Grouping” functions including: 1) setting the level of CEO pay and 2) measurement
of CEO performance vs. peers (see Pioneer above).

8
Enterprise Value Vs. CEO Pay: Prominent in Energy
After selecting the peer group, the board creates a pay package that targets the 50th, 75th, or 90th
percentiles (PCTL) of CEO pay in the group. Targeting pay levels below the 50th PCTL is rarely, if
ever, done because it could send a message regarding the merit of an executive, as embodied in pay
relative to peers. Of course, if all companies in all industries target above the 50th PCTL, then there
will be an upward bias to pay irrespective of CEO performance and shareholder outcomes.
Key points on “peer grouping” are: 1) given the lack of subjective criteria for inclusion, the peer
group is prone to manipulation, 2) above median targeting creates upward bias for pay, and 3) high
performance and pay for a few top executives’ raises wages for others, even if performance by the
others is poor.
APA APC
COP
DVN EOG
HES
MRO
OXY
PXD
NBL
R² = 49%
10
11
12
13
14
15
16
17
18
19
20
0 20 40 60 80 100
SC
T P
ay (
$M
M)
Enterprise Value ($B)
BP
CVX
XOM
RDS
TOT
R² = 38%
0
5
10
15
20
25
30
100 150 200 250 300 350 400
SC
T P
ay (
$M
M)
Enterprise Value ($B)
Source: Company Data, FactSet, Evercore ISI Energy Research
Pay = $10.9 MM + 0.6 * EV Pay = $3.7 MM + 0.5 * EV

9
Pay Plan Design Seeks Alignment of Interests
Boards seek to structure compensation to align interests of senior executives with business
priorities and sustainable growth in long-term shareholder value. An appropriate mix of short
and long term, variable and non-variable, retention and performance-based incentives are
utilized to attain objectives.
Source: Company Data, Evercore ISI Energy Research
10
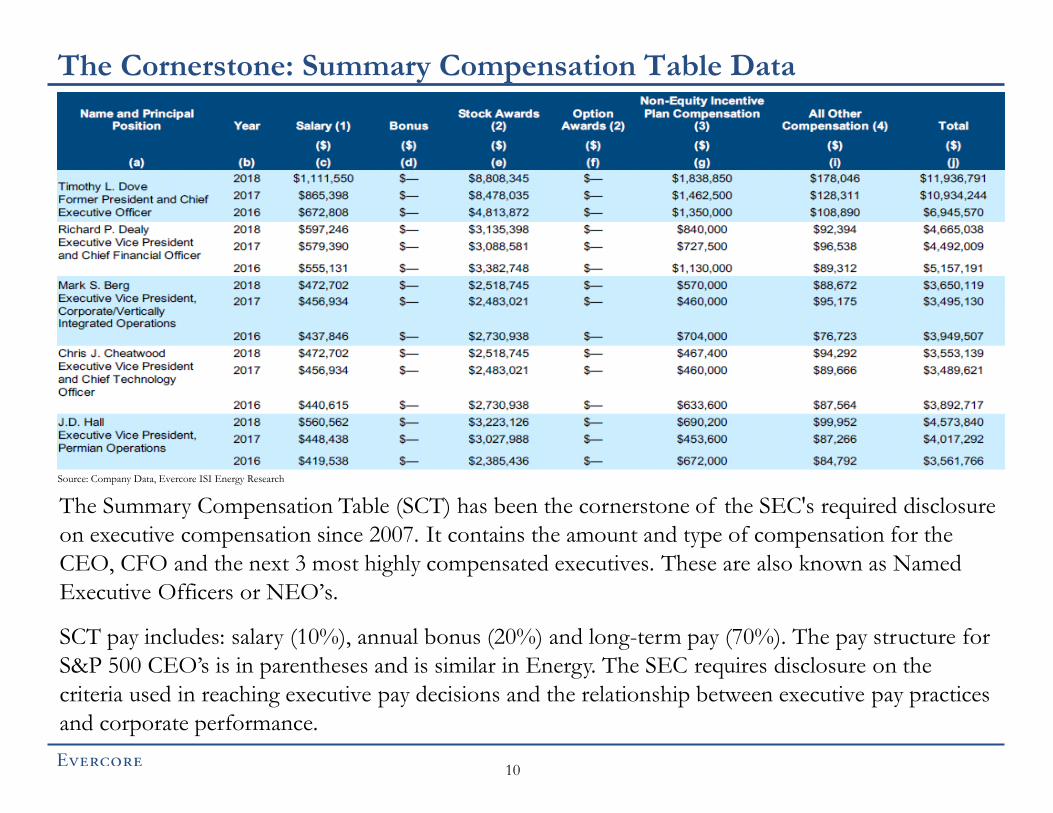
The Cornerstone: Summary Compensation Table Data
The Summary Compensation Table (SCT) has been the cornerstone of the SEC's required disclosure
on executive compensation since 2007. It contains the amount and type of compensation for the
CEO, CFO and the next 3 most highly compensated executives. These are also known as Named
Executive Officers or NEO’s.
SCT pay includes: salary (10%), annual bonus (20%) and long-term pay (70%). The pay structure for
S&P 500 CEO’s is in parentheses and is similar in Energy. The SEC requires disclosure on the
criteria used in reaching executive pay decisions and the relationship between executive pay practices
and corporate performance.
Source: Company Data, Evercore ISI Energy Research

11
Annual Pay: Emphasizes Safety, Resource Growth
Annual bonus pay represents 17% of target compensation for Big Oil and E&P’s. Almost every
company holds an incentive for safety. Incentives for production, cash flow and operating costs
are utilized by most entities too.
ROCE, CROCE, and EPS were utilized by a minority of companies for annual bonuses. EVA
is not used by any Energy company as a CEO pay incentive, which may explain the significant
decline in ROCE, EVA and valuation in Energy during the past 5 and 10 years, and poor equity
market performance too (page 5).
Source: Company Data, Evercore ISI Energy Research; Chart includes 5 IO’s and 14 E&P components
80%
60% 60%
40% 40%
20%
60%
0% 0%
79%
93%
64%
79%
57% 50%
7%
57%
43%
0%
20%
40%
60%
80%
100%
HSE Production Cash Flow OperationalExpense
ROCE Reserves EPS CROCE TSR
% C
om
pa
nie
s
Big Oil E&P

12
Incentives: Big Oils - Financial Factors, E&P’s - Resource Growth
Source: Company Data, Evercore ISI Energy Research; Chart includes 5 IO’s and 14 E&P components
Integrated Oils place the highest emphasis on financial factors such as EPS, CF and ROCE
(47% of total incentives). In E&P, operational expense and resource growth is prominent with
EPS, CF and ROCE having a weighting of only 25%.
While many incentives are used, Big Oils and E&P CEO pay incentives fall into 4 primary
categories: 1) resource growth, 2) expense management, 3) “other” 4) and financial related (see
next page).
28% 26%
15% 14%
5% 5% 4% 3%
0% 0% 0% 0% 1%
21%
10% 9% 7%
1%
12%
15%
5% 7% 7%
5%
0%
5%
10%
15%
20%
25%
30%
EPS Other HSE CF ROCE Projects Prod. Op. Exp Reserves CROCE Strategic TSR
An
nu
al
Bo
nu
s F
ac
tors
Big Oil E&P

13
Big Oils: Preserving and Creating Value. E&P: Resource Growth
Source: Company Data, Evercore ISI Energy Research
XEC doesn’t allocate specific % to performance factors. We manually allocate % to performance factors for XEC.
Resource Growth
4%
Cost Control
3%
Financial 47%
Other 46%
Big Oil
Resource Growth
18%
Cost Control
15% Financial
30%
Other 37%
E&P
2018 Resource Growth Control
Big Oil Prod. Reserves Op. Exp HSE StrategicProjects Other EPS CF ROCE CROCE TSR
BP 10% 20% 30% 20% 20%
CVX 5% 5% 15% 10% 15% 20% 20% 10%
XOM 100%
RDS 13% 20% 13% 25% 30%
TOT 2% 2% 19% 60% 17%
Average 4% 0% 3% 15% 0% 5% 26% 28% 14% 5% 0% 0%
Cost
Diversified Resource Growth Control
E&P Prod. Reserves Op. Exp HSE StrategicProjects Other EPS CF ROCE CROCE TSR
APA 5% 5% 10% 10% 27% 10% 5% 8% 20%
APC 20% 20% 20% 20% 20%
COP 5% 5% 20% 30% 10% 10% 20%
DVN 15% 10% 10% 40% 15% 10%
HES 20% 15% 15% 20% 15% 8% 8%
MRO 18% 18% 7% 11% 33% 15%
OXY 10% 10% 12% 32% 12% 12% 12%
NBL 10% 6% 20% 8% 12% 15% 17% 2% 2% 8%
Average 13% 6% 12% 13% 6% 0% 19% 2% 9% 3% 13% 5%
Cost
Onshore Growth Resource Growth Control
E&P Prod. Reserves Op. Exp HSE StrategicProjects Other EPS CF ROCE CROCE TSR
EOG 4% 8% 8% 16% 39% 5% 15% 5%
PXD 15% 10% 15% 10% 20% 15% 15%
XEC 17% 8% 8% 8% 42% 8% 8%
CXO 20% 30% 10% 30% 10%
FANG 60% 20% 20%
CLR 15% 10% 5% 30% 25% 15%
Average 12% 5% 19% 4% 8% 1% 23% 0% 10% 14% 0% 5%
Financial
Other Growth Value
Financial
Other Growth Value
Other Growth Value
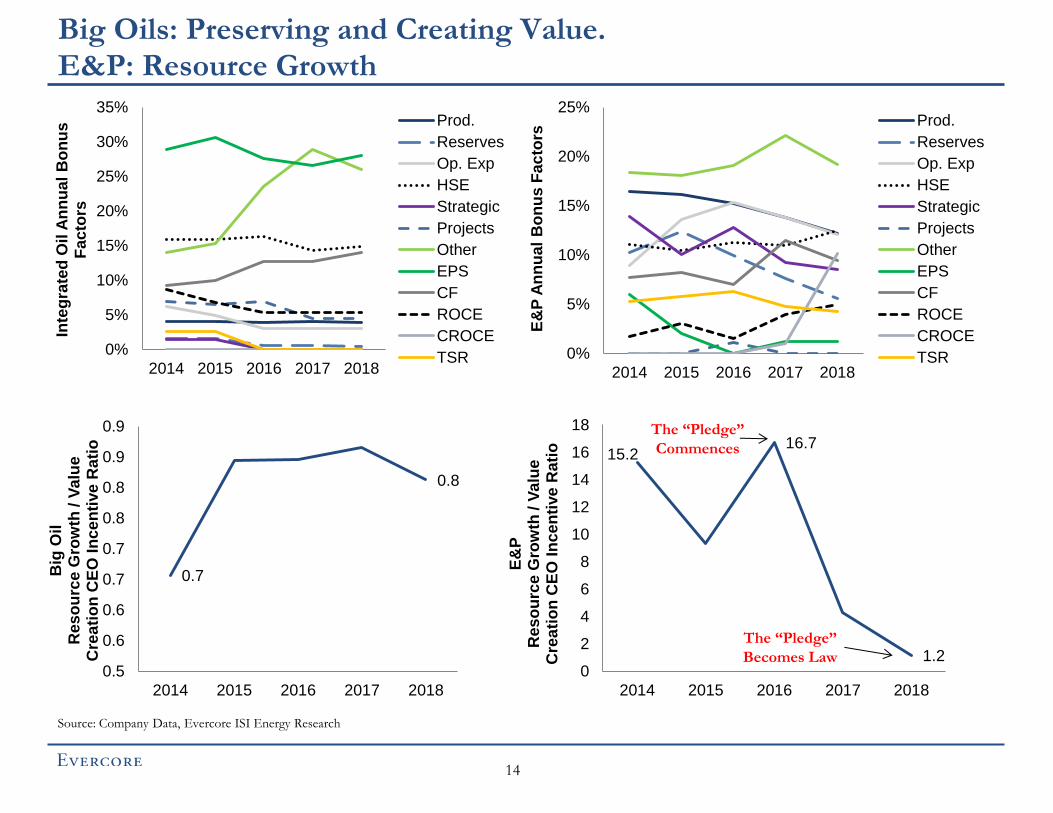
14
Big Oils: Preserving and Creating Value. E&P: Resource Growth
0%
5%
10%
15%
20%
25%
30%
35%
2014 2015 2016 2017 2018
Inte
gra
ted
Oil
An
nu
al
Bo
nu
s
Fac
tors
Prod.
Reserves
Op. Exp
HSE
Strategic
Projects
Other
EPS
CF
ROCE
CROCE
TSR 0%
5%
10%
15%
20%
25%
2014 2015 2016 2017 2018
E&
P A
nn
ual
Bo
nu
s F
ac
tors
Prod.
Reserves
Op. Exp
HSE
Strategic
Projects
Other
EPS
CF
ROCE
CROCE
TSR
Source: Company Data, Evercore ISI Energy Research
0.7
0.8
0.5
0.6
0.6
0.7
0.7
0.8
0.8
0.9
0.9
2014 2015 2016 2017 2018
Big
Oil
R
es
ou
rce
Gro
wth
/ V
alu
e
Cre
ati
on
CE
O I
nce
nti
ve
Ra
tio
15.2 16.7
1.2 0
2
4
6
8
10
12
14
16
18
2014 2015 2016 2017 2018
E&
P
Res
ou
rce
Gro
wth
/ V
alu
e
Cre
ati
on
CE
O I
nce
nti
ve
Rati
o
The “Pledge”
Becomes Law
The “Pledge”
Commences

15
Annual Bonus Calculation
Source: Company Data
Annual pay is set by performance on metrics which are deemed to be important to all stakeholders.
These metrics provide management with information with which to ensure measurable progress
toward company-wide goals. If metrics are well selected and pay thresholds are challenging, strategic
planning transforms positive actions into higher shareholder value. Because these factors are disclosed
to investors, shareholders can evaluate the rigor of company goals and their goal-setting processes.
Pioneer’s board required the CEO to deliver ROCE over 7% in 2018, which exceeded consensus
expectations at the time. However, because ROCE was only 15% of annual bonus, which was only
15% of total pay; ROCE was only 2% of total CEO pay. The Board and management were not
overly committed to ROCE, which may be why financial results disappointed and the CEO was
replaced. Pioneer management’s score of 123% is multiplied by its pre-set target bonus of $1.5 MM
to attain its 2018 CEO bonus award of $1.8 MM (page 11).

16
Do Incentives Matter if Bonuses Exceed 100% of Target Most Years?
Source: Company Data, Evercore ISI Energy Research
Big Oil and E&P CEO’s earned 123% and 116% of target bonus pay on annual TSR of 1.2% and
-11.0% (5 years). Energy CEO’s earned target pay 72% of the time. Brent was $65/bbl during the
period. By contrast, S&P 500 CEO’s earned target pay 76% of the time but posted annual TSR of
8.4% during the same period. The Energy Pay For Performance (P4P) outcome was obviously
inferior to that for S&P 500 i.e. alternative areas of investment.
If annual CEO pay exceeds target almost every year we question whether: 1) pay incentives and
performance thresholds even matter and 2) annual pay is truly “at-risk” or variable, at least to the
downside? If not, annual pay is a quasi-salary element and the Boards annual pay process lacks
credibility.
1.8 1.8 1.8 1.6 1.6 1.6 1.5 1.5
1.4 1.4 1.4 1.3 1.2 1.2
0.9 0.9 0.8
0.0
0.5
1.0
1.5
2.0
CLR COP XOM CVX FANG HES CXO MRO XEC APA EOG RDS TOT PXD DVN NBL BP
Ac
tua
l B
on
us/T
arg
et
Mu
ltip
le
Average = 1.4

17
Long-Term Pay: Performance/Time Vesting Awards (60/40)
Long-term pay awards are granted annually and usually vest over a 3 year period. Award types
include: 1) performance vesting units (PSU’s – equity received at vest), 2) phantom stock (shares
convert to cash at vest) and 3) time vesting restricted stock units (RSU’s).
Performance-based awards foster alignment between executives’ interests and company-specific
performance and are usually denominated in company shares at vest. Time-based awards are
contingent upon continued employment and contain a retention incentive. Glass Lewis excludes
time-vesting stock options from performance based compensation calculations.
Source: Company Data, Evercore ISI Energy Research; Charts include 5 IO’s and historical S&P E&P components
61%
32%
10% 7%
0%
10%
20%
30%
40%
50%
60%
70%2
00
6
200
7
200
8
200
9
201
0
201
1
201
2
201
3
201
4
201
5
201
6
201
7
201
8
% $
W
eig
ht
Big Oil
Performance Shares
RSU
Options
Time-based vesting
56%
31%
46%
13%
0%
10%
20%
30%
40%
50%
60%
200
6
200
7
200
8
200
9
201
0
201
1
201
2
201
3
201
4
201
5
201
6
201
7
201
8
% $
We
igh
t
E&P Performance Shares
RSU
Options
Time-based vesting

18
Long-Term Pay: CEO Award Structure
CEO Name SCT Pay
($M)
Performance
Shares (PSU)
Payouts in
Shares
Performance
Shares (PSU)
Payouts in
Cash
Restricted
Stock (RSU)
(Time
Based)
Stock
Options Total
Post 3-Yr.
Vest Holding
Period
BP Bob Dudley 14,587 100% 100% 3
CVX Michael Wirth 19,713 50% 25% 25% 100% 0
XOM Darren Woods 15,512 100% 100% 7
RDS Ben van Beurden 23,316 100% 100% 3
TOT Patrick Pouyanné 6,771 100% 100% 2
APA John Christmann IV 14,705 50% 35% 15% 100% 0
APC Al Walker 14,703 50% 25% 25% 100% 0
COP Ryan Lance 17,575 65% 35% 100% 0
DVN Dave Hager 11,377 50% 50% 100% 0
EOG Bill Thomas 11,898 50% 25% 25% 100% 0
HES John Hess 12,550 60% 40% 100% 0
MRO Lee Tillman 11,725 50% 30% 20% 100% 0
OXY Vicki Hollub 13,563 70% 30% 100% 0
PXD Scott Sheffield 11,759 50% 50% 100% 0
NBL Dave Stover 10,887 50% 35% 15% 100% 0
XEC Tom Jorden 9,617 50% 50% 100% 0
CXO Tim Leach 13,022 67% 33% 100% 0
FANG Travis Stice 10,504 100% 100% 0
CLR Harold Hamm LLM 13,256 100% 100% 0
Source: Company Data, Evercore ISI Energy Research

19
Long-Term Pay: Dominated By TSR vs. Energy Peers
Source: Company Data, Evercore ISI Energy Research; Charts include 5 IO’s and 14 E&P components
100%
60% 60%
20% 20%
0% 0% 0% 0%
100%
15% 8% 8% 8%
15% 8%
0% 0% 0%
20%
40%
60%
80%
100%
120%
TSR Cash Flow ROCE HSE Other CROCE Reserves EPS Production
% C
om
pa
nie
s
Big Oil E&P
50%
25%
16%
5% 4% 0% 0% 0% 0%
86%
6% 1% 0% 1% 4% 2% 0% 0%
0%
10%
20%
30%
40%
50%
60%
70%
80%
90%
TSR CF ROCE HSE Other CROCE Reserves Prod. EPS
Lo
ng
Te
rm In
ce
nti
ve
Fa
cto
rs Big Oil E&P

2018 Resource Growth
Big Oil Prod. Reserves HSE Other EPS CF ROCE CROCE TSR
BP 20% 30% 50%
CVX 100%
XOM 25% 25% 25% 25%
RDS 50% 25% 25%
TOT 50% 50%
Average 0% 0% 5% 4% 0% 25% 16% 0% 50%
Diversified Resource Growth
E&P Prod. Reserves HSE Other EPS CF ROCE CROCE TSR
APA 25% 25% 50%
APC 100%
COP 5% 15% 15% 15% 50%
DVN 50% 50%
HES 100%
MRO 100%
OXY 36% 64%
NBL 100%
Average 0% 3% 1% 2% 0% 9% 2% 6% 77%
Onshore Growth Resource Growth
E&P Prod. Reserves HSE Other EPS CF ROCE CROCE TSR
EOG 100%
PXD 100%
XEC 100%
CXO 100%
FANG 100%
CLR
Average 0% 0% 0% 0% 0% 0% 0% 0% 100%
Financial
Other Growth Value
Financial
Other Growth Value
Other Growth Value
20
Long-Term Pay: Dominated by TSR vs Energy Peers
Source: Company Data, Evercore ISI Energy Research
CLR doesn’t have performance shares program.
TSR 50%
Financial 41%
Other 9%
Big Oil
TSR 86%
Financial 11%
Resource Growth
2%
Other 1%
E&P
* S&P 500 is 25% of Chevron’s comparator peer group

21
Beware Relative TSR in Energy
For PSU’s, Energy and Utility companies utilize relative TSR more than the other 8 groups of S&P
500. An important distinction is that Energy TSR is relative to Big Oil and E&P peers. The
problem is that when the industry is in value-destruction mode as Big Oil and E&P were during
the past decade (page 5), CEO compensation can remain high as long as management teams
destroy less value than peers.
This is obviously not the path to prosperity for shareholders in any industry and undermines
shareholder alignment. Investors have divested the sector with S&P Energy declining from 14% to
5% of S&P 500 during the past decade. While all companies surely seek higher absolute returns
(ROCE, EVA) because they connect to intrinsic value in equity market; CEO incentives in this
area (ROCE, EVA etc) remain scarce in Energy CEO pay plans (see next page).
Percent of companies
using relative TSR
97%
86% 77%
59%
48% 47% 45% 41% 38% 37%
0%
20%
40%
60%
80%
100%
120%
% o
f C
om
pan
ies
Us
ing
Re
lati
ve
T
SR
Source: Company Data, Evercore ISI Energy Research

22
Caveat Emptor For Energy Investors
While almost every Materials,
Tech and Industrial company
utilizes absolute value-based
measures for CEO pay and S&P
500 as a peer comparator for
relative TSR, these features are
conspicuously absent from Big
Oil and E&P CEO pay plans.
This is probably why returns,
valuation and shareholder
outcomes remain superior in
other Cyclical sectors.
Use of Big Oil and E&P’s as
peer comparators represent a
“low bar” for CEO pay. Until
this practice changes, it’s Caveat
Emptor for Energy investors (see
next page).

23
Caveat Emptor For Energy Investors
Source: FactSet, Evercore ISI Energy Research; * S&P 500, NASDAQ or similar broad index
Big Oil E&P
Oil Services
Materials (Chemicals)
Industrials (Aerospace,Defense)
Electrical Equipment
Industrial Conglomerates
Machinery Air Freight & Logistics
Airlines
Road & Rail
IT Services
Software
Communications Equip
Tech Hardware Storage Perip
Semi & Semi Equip
Telecomm Srv
R² = 65%
0
1
2
3
4
5
6
7
-5% 0% 5% 10% 15% 20% 25% 30%
EV
/CE
5Y Avg ROCE
The majority of Energy CEO pay is set by TSR relative to Big Oil and E&P peers. When considering Big Oil
and E&P ROCE of only 4.3% and TSR of -6.9%/yr. vs S&P 500 of 10.5% and 8.4%/yr. (5 years); the bar is
obviously lower for Energy CEO pay than for CEOs in other Cyclical industries (which use S&P 500 as a peer
comparator).
Companies in S&P Industrials, Materials and Technology rewarded shareholders with superior returns,
valuation (see chart) and shareholder outcomes. If Energy ROCE declines during 2019-2020 as consensus
envisions, this shareholder alignment defect will compound further.
Investors prefer CEO pay incentives to be benchmarked against S&P 500 similar to that of their investment
management performance fees.

24
Long-Term Pay Calculation
Pioneer’s TSR of 5% was 6th out of 12 E&P companies and led to 110% payout on the PSU award.
The CEO’s share award increased from 14,847 to 16,332 shares for this reason. However, if S&P
500, which posted 22% TSR, were a peer comparator (see other Cyclicals), then realized pay would
have been lower. The “lower bar” for Pioneer’s CEO led to higher pay but questionable alignment.

25
Long-Term Pay: Performance Share Payout Ranges
0%
50%
100%
150%
200%
250%
1 2 3 4 5 6 7 8 9 10 11 12 13 14 15
% P
ayo
ut
on
Sh
are
Gra
nt
TSR Rank vs Peers
APA DVN EOG HES MRO PXD NBL
E&P CEO’s receive 0-200% of performance share payouts in long-term plans depending on TSR vs.
Energy peers. Target pay of 100% is attained when equity market performance is near the mid-point of
peers. Because payout ranges are much wider than performance ranges, small incremental performance
changes are levered into larger payout ranges for most CEO’s. Half of Big Oil and E&P CEO’s do not
have modifiers for relative TSR, which limit payouts when TSR is negative. Executives can therefore
earn above-target payouts as long as TSR is less negative than peers.
Until relative TSR vs. Energy peers no longer dominates Energy CEO pay plans, Energy CEOs will be
more incented to “follow the herd” or “closet index” than to grow value on an absolute basis, in our
view. Indeed, returns and economic value declined steadily at every Big Oil and E&P during the past
decade during a period in which relative TSR was prominent in Energy CEO pay plans. Whether
intentional or not, relative TSR vs. Energy appears to have fostered this unfavorable outcome.
Source: Company Data, Evercore ISI Energy Research
Target CEO pay earned at
TSR mid-point (-4% (3yrs.))
26
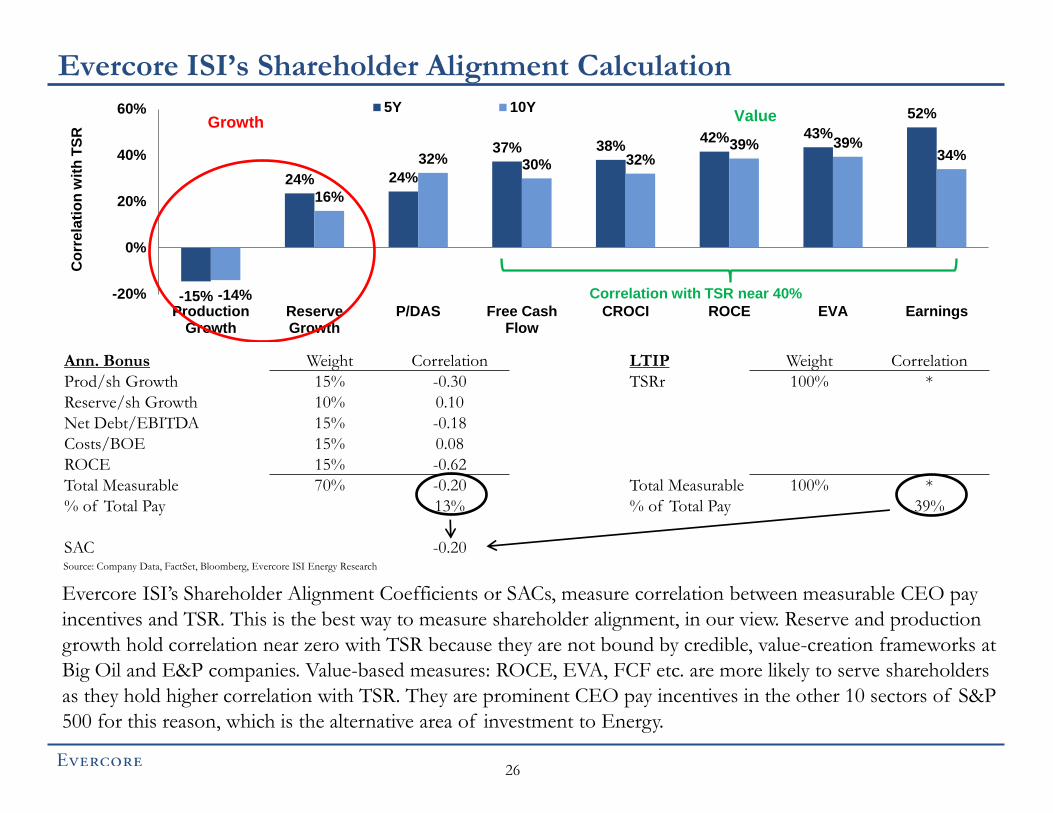
Evercore ISI’s Shareholder Alignment Calculation
Ann. Bonus Weight Correlation LTIP Weight Correlation
Prod/sh Growth 15% -0.30 TSRr 100% *
Reserve/sh Growth 10% 0.10
Net Debt/EBITDA 15% -0.18
Costs/BOE 15% 0.08
ROCE 15% -0.62
Total Measurable 70% -0.20 Total Measurable 100% *
% of Total Pay 13% % of Total Pay 39%
SAC -0.20
-15%
24% 24%
37% 38% 42% 43%
52%
-14%
16%
32% 30% 32% 39% 39%
34%
-20%
0%
20%
40%
60%
ProductionGrowth
ReserveGrowth
P/DAS Free CashFlow
CROCI ROCE EVA Earnings
Co
rrela
tio
n w
ith
TS
R
5Y 10YGrowth Value
Correlation with TSR near 40%
Source: Company Data, FactSet, Bloomberg, Evercore ISI Energy Research
Evercore ISI’s Shareholder Alignment Coefficients or SACs, measure correlation between measurable CEO pay
incentives and TSR. This is the best way to measure shareholder alignment, in our view. Reserve and production
growth hold correlation near zero with TSR because they are not bound by credible, value-creation frameworks at
Big Oil and E&P companies. Value-based measures: ROCE, EVA, FCF etc. are more likely to serve shareholders
as they hold higher correlation with TSR. They are prominent CEO pay incentives in the other 10 sectors of S&P
500 for this reason, which is the alternative area of investment to Energy.

27
“The Pledger’s” offer the highest correlation between corporate strategies & CEO pay incentives
(SACs) and the best TSR over 5 and 10 years (“Pledgers” are dark blue bars). The companies
with the highest SACs are ConocoPhillips (0.8), BP (0.6) and EOG (0.4). These are all Buy rated
equities. APC, COP and OXY had the greatest change in their SAC this year.
PXD (-0.2) and DVN (-0.1) posted the lowest shareholder alignment with their boards enabling
management to employ strategies and CEO pay incentives that hold negative correlation with
TSR. Both companies indicate plans for value based measures in the future.
Beware Companies with Low Shareholder Alignment Coefficients (SAC’s)
-0.2 -0.1
-0.1 0.0
0.1 0.2
0.2 0.3 0.3 0.4
0.4 0.5
0.8
(0.4)
(0.2)
0.0
0.2
0.4
0.6
0.8
1.0
PX
D
DV
N
NB
L
XO
M
HE
S
MR
O
AP
A
TO
T
RD
S
CV
X
EO
G
BP
CO
P
CE
O P
ay I
ncen
tive
Co
rrela
tio
n
wit
h T
SR
(S
AC
)
Source: Company Data, Bloomberg, FactSet, Evercore ISI Energy Research
Non-Pledgers Pledgers

28
Shareholder Alignment Matters to Investors
Source: FactSet, Bloomberg, Company Data, Evercore ISI Energy Research
Incentives for value creation are warranted in Energy CEO pay, in our opinion. Otherwise, Energy
companies are unlikely to receive serious consideration from broad groups of investors, as was the
case during 1999-2008, in our view.
Our Red Queen call has envisioned declining production growth and ROCE and lower valuations in
US E&P. While our call has unfolded as expected with E&P valuations falling from 21 to 12x (LTM),
further declines are likely if Energy ROCE declines as we expect during 2019-2020. Corporate
consolidation appears to be the best outcome either in 2019 or at lower equity values in the future.
While Generalist investors have abandoned the Energy sector, they will continue to avoid it until
shareholder alignment becomes competitive with other Cyclical sectors and S&P 500, in our view.
$110
$77 $72 $63 $58 $58 $58 $55 $55 $51 $50 $46 $44 $41
$32 $32 $31 $28 $24
($4) ($2)
($32) ($30)
($3) $0
($3)
($22)
($0)
($13) ($18)
($0) ($1) ($5) ($4)
$4
($24)
($4) ($8)
($40)
($20)
$0
$20
$40
($120)
($60)
$0
$60
$120
CX
O
FA
NG
CV
X
BP
PX
D
XO
M
EO
G
RD
S
AP
C
HE
S
CO
P
XE
C
CL
R
NB
L
DV
N
TO
T
AP
A
OX
Y
MR
O
5Y
Cu
mu
lati
ve
EV
A (
$B
)
5Y
CE
O R
ea
lize
d P
ay (
$M
M)
CEO Realized Pay (LHS) EVA (RHS)

29
Shareholder Alignment Matters to Investors
Source: FactSet, Bloomberg, Company Data, Evercore ISI Energy Research
Economic Value Added (EVA) = (ROCE – WACC) X Capital Employed
Market Value Added (MVA) = (Share Price – Book Value) X Shares Outstanding
APA
COP
DVN
EOG
HES
MRO
OXY PXD
NBL
CVX
XOM
XEC CXO FANG
CLR
y = 6.1x + 5,260 R² = 0.90
(100)
(80)
(60)
(40)
(20)
0
20
40
(18) (13) (8) (3) 2
MV
A D
elt
a O
ver
5 Y
Ears
($B
)
EVA Delta Over 5 Years ($B)
EVA accounts for the market value that management adds to, or subtracts from, the shareholder
capital that it has employed. EVA is also regarded as the economic earnings that are capitalized by the
market in arriving at a company’s MVA. MVA reflects how well management has invested capital in
the past and how successful investors expect it to invest capital in the future. MVA is equal to the
discounted present value of all the EVA that is expected to be generated in the future.
The charts indicate that value creation matters to investors. That no Big Oil or E&P CEO has EVA
as a pay incentive represents a deterrent to investment, in our view
APA
COP
DVN
EOG
HES
MRO
OXY
PXD
NBL
XEC CXO
FANG
CLR
(15)
(10)
(5)
0
5
10
15
20
25
30
(2) (1) 0 1 2
MV
A D
elt
a O
ver
5 Y
Ears
($B
)
EVA Delta Over 5 Years ($B)
Y = 6.1x +5,260
R2 = 0.90
CVX, XOM

30
Value Creation Rewards Investors & Vice Versa
All roads lead to consolidation in Energy, in our view. What matters in an acquisition is how much cash and
cash equivalents are paid to consummate transactions, in relation to how much cash is likely to flow in
afterwards (see chart).
Investors penetrate accounting fictions and are not fooled by use of partial-cycle E&P measures to justify
transactions. While economic value creation (EVA etc) almost always leads to positive market outcomes
(MVA); frameworks of this type were not prominent in the most value-destructive transactions contained
above.
The value-based model informs companies as to whether prices being considered for acquisitions will be
rewarded by the equity market and vice versa.
Source: Company Data, FactSet, Evercore ISI Energy Research, MVA uses pre and post merger market capitalization minus book values, EVA uses pre and post merger (ROCE-WACC) X Capital
Employed, announced G&A synergies and 20 year depreciation for difference between transaction value and acquiree book value
CXO-RSPP
FANG-EGN XEC-REN
CHK-WRD
CNQ-DVN Canada
CPE-CRZO
OXY-APC
PDCE-SRCI
R² = 94%
-2,500
-2,000
-1,500
-1,000
-500
0
500
1,000
-25,000 -20,000 -15,000 -10,000 -5,000 0 5,000
Ch
an
ge
in
Ec
on
om
ic V
alu
e
Ad
de
d (
$M
M)
Change in Market Value Added ($MM)
Value Destruction Value Creation

31
IS E&P CEO Pay an Obstacle to M&A
Credible models for value creation and sustained distributions to shareholders will remain elusive for E&P
companies, especially if returns and output growth have peaked in US shale per our Red Queen call. That S&P
E&P declined and underperformed S&P 500 by a whopping 35 and 65 PP over 3 and 5 years suggests that the
Buy-Side concurs; and that investors will avoid many Energy stocks until financial profiles and the incentives
and behaviors which created them, change in a way that is aligned with shareholders.
While positive shareholder outcomes are available thru large-scale M&A; strategic activity was conspicuously
low in recent years. One reason may be that Energy CEO financial outcomes were much more positive than
that of shareholders in their companies. That is, the increase in value from annual CEO share awards
significantly surpassed unfavorable effects from poor E&P share price performance; leading to positive
financial outcomes for CEO’s. This Energy corporate governance and shareholder alignment defect is not lost
on the investment community. Generalist investors have abandoned the sector and will continue to avoid it
until Boards make the 4 changes we highlight on page 32.
Chart contains: APA, COP, DVN, EOG, MRO, FANG, NBL, OXY, PXD, Source: Company Data, Evercore ISI Energy Research
$26
$54
$20
$1 $7
$0
$10
$20
$30
$40
$50
$60
2016 CEOShareholding
New Share Awards Sh. Px. Change Other Pay (Salary,Bonus, etc)
2019 CEO Pay Value(Pre-Sales)
E&
P C
EO
Pa
y V
alu
e
(Avg
. $
MM
)

32
Generalist Investors Will Continue to Avoid Energy Until…
• Boards require: 1) annual pay factors that correlate with TSR and 2) more challenging
performance thresholds for CEOs to make target pay.
• Boards no longer allow Energy CEOs to make or exceed annual target pay levels almost
every year. Otherwise, annual pay is a quasi-salary element, and the Boards’ annual
compensation process lacks credibility.
• Boards require CEO performance on absolute, value-based performance metrics such as
ROCE, EVA etc which connect to intrinsic value in the equity market (see all other Cyclical
sectors). Entities can control for oil prices in value-based CEO pay metrics with the same
“normalized” oil price they use in the annual capital budgeting and planning process.
• Boards raise the performance bar for Energy CEOs to the same level as CEOs in other
Cyclical industries (Materials, Industrials, Technology) by requiring S&P 500 as a peer
comparator for relative TSR. Otherwise, Energy shareholder outcomes will surely remain
inferior to alternative areas of investment.
• Shareholder alignment becomes competitive with the rest of S&P 500. Realized pay for
Big Oil and E&P CEOs of $2 B rendered TSR of 0%, vs. S&P 500 at 290% during the
past decade.

33
Is Change Ahead in the Fall CEO Pay Cycle?
Energy underperformed all 10 S&P sectors with 10-year performance, its worst on record.
Investors doubt that Energy relative performance will improve until Energy Boards require
change in the CEO pay incentives and behaviors that drove poor performance in the first
place.
The opportunity to realign with shareholders is available during the Fall Strategy and CEO
Pay Cycle, and thus the timing of todays call. Investors will be watching closely for change
and will invest accordingly in the aftermath, in our view.
0.30 0.32
0.35
0.0
0.2
0.4
0.6
0.8
1.0
1.2
1.4
1.6
1.8
2.02009
2010
2011
2012
2013
2014
2015
2016
2017
2018
2019
Pe
rfo
rma
nc
e V
s. S
&P
50
0
OFS E&P Integrated Oil

34
Factors Determining Annual Bonus – More Value, Less Volume
Returns-based metrics increased in the last compensation cycle for annual bonuses as the % of
companies incorporating ROCE and/or CROCI into annual bonus calculations more than
tripled (from 21% to 73%) while use of production and reserve metrics ticked lower.
Nevertheless, production growth hurdles (which are largely achievable) remain more common
Note: Group includes APA, DVN, EOG, MRO, NBL, CXO, FANG, PXD, and HES
Source: Company Data, Evercore ISI Energy Research
69%
48% 48%
62%
21%
28%
7%
67%
20%
33%
73% 73%
20% 25%
0%
10%
20%
30%
40%
50%
60%
70%
80%
Production Reserves Cash Flow OperationalExpenses
ROCE/CROCI TSR EPS
% o
f C
om
pa
nie
s U
sin
g F
ac
tor Prior Current
E&P

35
Weighting of return metrics grew last year, while still modest
Note: Group includes APA, DVN, EOG, MRO, NBL, CXO, FANG, PXD, and HES
Source: Company Data, Evercore ISI Energy Research
Returns based metrics weighting in the bonus determination cycle increased last year to ~18%
of our sample, but still trails growth in production / reserves and other discretionary factors
which typically average 30-40% of total weight.
Value and Return-based metrics better capture whether investment and specifically upstream
development is being achieved in a value accretive way and should play a more prominent role in
chosen performance metrics. We are not saying that E&P performance metrics should disregard
some of the key deliverables of management, particularly in a depletion industry.
14%
8%
12% 13%
4% 5%
9%
13%
8%
19%
16%
18%
10%
12%
0%
2%
4%
6%
8%
10%
12%
14%
16%
18%
20%
Production Reserves Cash Flow OperationalExpenses
ROCE/CROCI TSR Capex/F&D
Ave
rag
e F
ac
tor
We
igh
t
Prior Current
E&P

36
Exceeding Payout Targets Despite Negative TSR & ROCE
Source: Company Data, Evercore ISI Energy Research
Performance-based compensation does not vary to the extent one might expect. A majority of
E&P CEOs within our study group received payouts at 120-160% of target despite many
posting total shareholder returns which lagged the sector, broader energy, and the market.
Two reasons payouts remain elevated:
• Highly achievable performance targets
• Payout skew that allow beats to more than offset misses
APA
DVN
EOG
MRO CXO
FANG
PXD
XEC CLR
COP
70
80
90
100
110
120
130
140
150
160
170
0.0% 2.5% 5.0% 7.5% 10.0% 12.5% 15.0% 17.5%
Perf
orm
an
ce T
arg
et
Payo
ut
ROCE (2018)
Co
vera
ge
APA
DVN
EOG
MRO
NBL
CXO FANG
PXD
XEC CLR
COP
70
80
90
100
110
120
130
140
150
160
170
-50% -40% -30% -20% -10% 0% 10% 20%
Perf
orm
an
ce T
arg
et
Payo
ut
Total Shareholder Return (2018)
XO
P
S&
P 5
00
E&P

37
Change of Control: Removes the CEO Pay Obstacle to M&A?
Change of control or CIC provisions incentivize management to explore the potential for value
creation via M&A vs entrenching management and dis-incentivizing change of control.
Change of control payouts for our study group average ~$30 mm equating to ~2.6x annual pay
(2018 awarded). CEO equity ownership not only encourages the exploration of value unlock
opportunities but also incentivizes management to negotiate the best transaction terms for
shareholders in a change of control and these two elements work in concert.
Source: Company Data, FactSet, Evercore ISI Research Source: Company Data, FactSet, Evercore ISI Research
($mm)
Chg of Control
Provision
CEO Awarded
Pay (2018)
Chg of Control /
Annual Pay
FANG $46.1 $10.5 4.4x
DVN $41.7 $11.4 3.7x
MRO $37.3 $11.7 3.2x
EOG $34.6 $11.9 2.9x
NBL $13.4 $4.9 2.8x
XEC $24.6 $9.6 2.5x
PXD $19.5 $10.3 1.9x
CLR $25.5 $13.3 1.9x
APA $25.0 $14.7 1.7x
CXO $14.8 $10.8 1.4x
Avg $28.2 $10.9 2.6x
Change of Control CEO Payments Higher ‘Chg of Control / Annual Pay’ ratios
encourage value unlock vs. entrenching management
$13 $15
$19
$25 $25 $25
$35 $37
$39 $41 $42
$46
$79
$0
$10
$20
$30
$40
$50
$60
$70
$80
NB
L
CX
O
PX
D
XE
C
AP
A
CL
R
EO
G
MR
O
CO
P
CV
X
DV
N
FA
NG
HE
S
Ch
an
ge i
n C
on
tro
l ($
mm
)E&P

88% 79%
88% 76%
87%
50%
60%
70%
80%
90%
100%
2015 2016 2017 2018 2019
OFS OFS Average S&P Average
38
Oilfield Services: Much Work Needs to Be Done
We went and evaluated the Say-on-Pay (SOP) proxy voting outcomes for our entire coverage
universe going back five years and found that the OFS sector fares unfavorably
Using the S&P 500’s average SOP vote of 92%, our coverage universe has underperformed that
benchmark every year for the past five years and has an average shareholder vote of 84%
There were eight separate instances of companies failing their SOP votes which is a 3% failure rate,
below the S&P’s average of 7%. However, an average score of 84% is unacceptable
considering that as it further adds to the list of reasons why the sector lacks broader
institutional support
Say-On-Pay Voter Outcomes
OFS

39
Oilfield Services: How Are Management Teams Incentivized?
2% 4% 3%
16%
29%
0%
4% 3%
14%
28%
0%
5%
10%
15%
20%
25%
30%
35%
Top Line Personal /Strategic
BottomLine
Cash Flow Returns
Current Year
Prior Year
7% 10% 10%
27%
43%
7% 10% 10%
23%
47%
0%
10%
20%
30%
40%
50%
Top Line Personal /Strategic
BottomLine
Cash Flow Returns
Current Year
Prior Year
Using the six largest companies in our coverage as a proxy, we found that the achievement of
returns (EVA, ROIC, TSR, EPS) and Cash Flows had the highest annual bonus factor weights
We prefer that companies eschew performance goals related to personal / strategic targets and top-
line growth. Comprehensible metrics targeting value creation is what’s needed
Our critique on performance goals is muted based on our initial analysis however we believe that
the group can do a better job of putting pay at risk as payout levels remain elevated
OFS Average Annual Bonus Factor Weights Frequency of Companies Using Bonus Factor Weights
OFS

40
Oilfield Services: Are They Goals or Just “Goals”?
Largely speaking, we do not believe that a substantial amount of pay is truly at risk given
the elevated payouts over the past two years.
For 2018 we found that executives on average were paid 1.25x their target Short-Term Incentive
bonus despite the average TSR being -34% (vs. -5% for the S&P)
While payouts decreased YoY (in sync with TSR), the average multiple for the target and maximum
bonus (versus base salary) increased in 2018 vs. 2017 despite negative TSRs
0.4x
1.6x
1.0x
1.3x 1.2x 1.3x
2.0x
-45% -45% -30% -34% -28% -36%
-23%
-1.0x
-0.5x
0.0x
0.5x
1.0x
1.5x
2.0x
2.5x
SLB HAL BHGE Average NOV FTI HP
Payout Multiple TSR
1.5x 1.5x 1.5x 1.4x 1.4x
1.4x
1.0x
3.2x
3.0x
2.5x
2.7x 2.9x
2.7x
1.3x
0.0x
0.5x
1.0x
1.5x
2.0x
2.5x
3.0x
3.5x
SLB HAL BHGE Average NOV FTI HP
Target / Base Max / Base
Current Year Short-Term Bonus / Base Salary Multiple Current Year Payout Multiples and TSRs (2018)
OFS

APPENDIX
41

LTIP-TSRr 28%
LTIP-Other
Factors 13%
LTIP-RSUs 23%
LTIP-Options
7%
Bonus 18%
Salary 11%
42
Beware Relative TSR in Energy
Other 6%
CF 15%
ROCE/CROCE 11% TSR
Vs. Big Oil, E&P’s 68%
LTIP - Performance Shares CEO Target Pay
Energy CEO pay is set by salary (11%), annual bonus (18%), and long-term pay or LTIP (71%). Because Big Oil and E&P CEO’s earned 119% of target annual bonuses (5 years), many consider bonuses to be a quasi-salary element. Restricted stock is contingent upon continued employment and along with options are not considered performance based pay by proxy advisors. Accordingly, the majority of performance-based pay for Energy CEO’s is set by TSR relative to Energy peers. When considering Big Oil and E&P CEO pay exceeded $2 billion with TSR of 0% (10 years); its caveat emptor for Energy investors. Generalists will continue to avoid Energy until shareholder alignment becomes competitive with the other 10 sectors of S&P 500, in our view.
Time-
Based
CEO
Pay*
* Assumes annual bonus is quasi-salary (CEO’s received 119% of target over 5 years)

43
Integrated Oils: ROCE Progression 2020E
8% 8%
7%
5%
12%
1%
0%
5%
10%
15%
20%
25%
2018 ROCE PriceRealizations
Volume Cost, Taxes,etc
CapitalIntensity
Effect
2020 ROCE
RO
CE
BP
9% 9%
10%
3%
13%
0%
0%
5%
10%
15%
20%
25%
2018 ROCE PriceRealizations
Volume Cost, Taxes,etc
CapitalIntensity
Effect
2020 ROCE
RO
CE
CVX
9% 8%
10%
3%
13%
0%
0%
5%
10%
15%
20%
25%
2018 ROCE PriceRealizations
Volume Cost, Taxes,etc
CapitalIntensity
Effect
2020 ROCE
RO
CE
XOM
8% 9%
7%
1%
7%
0%
0%
2%
4%
6%
8%
10%
12%
14%
16%
18%
2018 ROCE PriceRealizations
Volume Cost, Taxes,etc
CapitalIntensity
Effect
2020 ROCE
RO
CE
RDS

44
E&P
6%
4%
3%
4% -8%
0%
-3%
-2%
-1%
0%
1%
2%
3%
4%
5%
6%
7%
2018 ROCE PriceRealizations
Volume Cost, Taxes,etc
CapitalIntensity
Effect
2020 ROCE
RO
CE
APA
13% 11%
6%
4%
12%
0%
0%
5%
10%
15%
20%
25%
2018 ROCE PriceRealizations
Volume Cost, Taxes,etc
CapitalIntensity
Effect
2020 ROCE
RO
CE
COP
7% 9%
8%
4%
1% 12%
0%
2%
4%
6%
8%
10%
12%
14%
16%
2018 ROCE PriceRealizations
Volume Cost, Taxes,etc
CapitalIntensity
Effect
2020 ROCE
RO
CE
DVN
14% 12%
12%
5%
5%
2%
0%
5%
10%
15%
20%
25%
2018 ROCE PriceRealizations
Volume Cost, Taxes,etc
CapitalIntensity
Effect
2020 ROCE
RO
CE
EOG
1%
3% 4%
6% 7%
0%
2%
4%
6%
8%
10%
12%
2018 ROCE PriceRealizations
Volume Cost, Taxes,etc
CapitalIntensity
Effect
2020e ROCE
RO
CE
HES

45
E&P : ROCE Progression 2020E
8% 11%
2%
6% 4%
2%
0%
2%
4%
6%
8%
10%
12%
14%
16%
18%
2018 ROCE PriceRealizations
Volume Cost, Taxes,etc
CapitalIntensity
Effect
2020 ROCE
RO
CE
PXD
4% 4%
5%
1%
4%
0%
1%
2%
3%
4%
5%
6%
7%
8%
9%
2018 ROCE PriceRealizations
Volume Cost, Taxes,etc
CapitalIntensity
Effect
2020 ROCE
RO
CE
NBL
16%
10%
11%
6%
6%
5%
0%
5%
10%
15%
20%
25%
2018 ROCE PriceRealizations
Volume Cost, Taxes,etc
CapitalIntensity
Effect
2020 ROCE
RO
CE
XEC
4% 5%
7%
0%
5%
0%
0%
2%
4%
6%
8%
10%
12%
2018 ROCE PriceRealizations
Volume Cost, Taxes,etc
CapitalIntensity
Effect
2020 ROCE
RO
CE
CXO
4%
9% 1%
17%
12%
1%
0%
5%
10%
15%
20%
25%
2018 ROCE PriceRealizations
Volume Cost, Taxes,etc
CapitalIntensity
Effect
2020 ROCE
RO
CE
FANG
11% 10%
8%
2%
6%
1%
0%
5%
10%
15%
20%
2018 ROCE PriceRealizations
Volume Cost, Taxes,etc
CapitalIntensity
Effect
2020 ROCE
RO
CE
CLR

46
Shell Outperform $88 32% Composite Score 79%Price Target CEO Pay Incentive CEO P4P Score 83%
CEO Ben van Beurden TSR Correlation Financial Performance Score 74%
TSR (Annualized) 3 Yr: 14.7% 5 Yr: 1.3% (ROCE, FCF, CF, Earnings)Realized Pay ($M) $23,316 Note: 0-Worst, 100-Best
Shareholding/Ann. Pay 0.9x 0.9x
Termination Pay ($M) Involuntary: NA
Limit CF, FCF ROCE Maintain Debt &
Spending Targets Target & Grow EquityThru 2021 Thru 2021 Thru 2021 Dividend Reduction
Long Term Pay Factors
$M Cash LNG R&M, Chems Rel ROCE Rel CFO Rel
CEO Ben van Beurden Vested Pay Total Flow ProductionLiquefaction Utilization Other FCF Growth Growth TSR
Salary $1,804 8%
ST Pay Incentive $3,544 15% 30% 13% 13% 13% 33%
LT Pay Incentive $17,968 77% 25% 25% 25% 25%
$23,316 100%
Correlation with TSR 2019 2018 7.6% 3% 3% 3% 14% 14% 14%
CEO Pay Incentives 0.32 0.30 0.49 0.11 0.35 0.26 0.01 0.43 0.49 *
Brent 0.80Peers 0.81 *Shell has 81% correlation with "Super-Majors", which have 80% correlation with Brent
Stated Strategy
Pay For Performance: Proxy advisors and investors approved Shell’s executive pay packages in recent years. Granted CEO pay of $9.6 M
was $3.0 M below median, peer CEO pay. Shell’s CEO pay and financial performance were in the 75th and 69th PCTL vs. peers. The
company places in the 83rd PCTL vs. peer CEO's on relative degree of alignment, play multiple of median and relative degree of alignment
(100th PCTL is best), placing 1st of 5 peer CEO's on P4P. Pay for performance concerns at Shell are low.
Strategy & CEO Pay Incentives: Shell employs one of the strongest financial frameworks and pathways to value creation in the Big Oil and
E&P. Targets are present for capital spending, FCF and ROCE in both its Upstream and Downstream businesses thru 2021. Transparency to
value is high with Shell's value proposition and its path, targets and timeframes for value creation forming its "World Class Investment Case".
Changes to Shell's CEO incentives evolved in recent years consistent with changes in strategic and financial priorities. Emphasis is now
placed on LNG, FCF and ROCE. Shell's CEO pay incentives hold correlation to TSR of 0.32 (Shareholder Alignment Coefficient or SAC) which
compares to 0.26 for the peer group. All CEO pay incentives hold positive correlation to TSR. Shell is a "Pledger" for greater capital discipline
and enhanced corporate governance and shareholders have been rewarded.
Annual Bonus Pay Factors
P4P Scorecard

Doug Terreson Head of Energy Research Evercore ISI
Doug Terreson provides research coverage on the Integrated Oil and Refining and Marketing sectors. He is responsible for the firm’s global forecast for crude oil and refined products and Energy Portfolio Strategy. He has been the #1 or 2 Integrated Oil analyst in the Institutional Investor poll 18 times and a member of the All-America Research (II) team 22 times. He is currently the #1 ranked Integrated Oil analyst on Wall Street.
Doug came to ISI after managing the Global Energy Group at Morgan Stanley in New York and Houston. He previously managed Putnam’s energy mutual fund in Boston. Prior to entering the investment industry, he was an engineer with Schlumberger Limited on the Gulf Coast of the United States. He has a BS in Petroleum Engineering from Mississippi State University and an MBA from Rollins College.
47

Steve Richardson Head of Oil and Gas, Exploration and Production Research Evercore ISI
Stephen Richardson is a Senior Managing Director and Head of Oil and Gas, Exploration and Production Research. Coverage includes 30+ stocks in the broader North American upstream sector including Canada. Mr. Richardson was ranked #1 on the Institutional Investor's All America Research Team for Oil and Gas Exploration and Production in 2018, and has been ranked since 2012.
Prior to joining Evercore ISI, he was at Deutsche Bank covering the same sector in equity research. In addition, Mr. Richardson has held positions at Morgan Stanley and Bombardier. Mr. Richardson is a graduate of McGill University and holds an MBA from École des Hautes Études Commerciales.
48

James West Head of Oil Services, Equipment and Drilling Research Evercore ISI
James West is a Senior Managing Director responsible for the research coverage of the Oil Services, Equipment and Drilling industry consisting of detailed fundamental research on over 60 companies. Prior to joining Evercore ISI, Mr. West was a Managing Director and Senior Research Analyst at Barclays and Lehman Brothers for a combined 15 years.
Since assuming lead coverage in 2011, Mr. West has been top ranked in Institutional Investor, including number three in 2011, number two in 2012, and number one every year since 2013. Prior to joining Lehman Brothers, Mr. West worked at Donaldson, Lufkin & Jenrette. Mr. West received his B.A. in Economics and a minor in History from the University of North Carolina at Chapel Hill.
49

50
TIMESTAMP
(Article 3(1)e and Article 7 of MAR)
Time of dissemination:
ANALYST CERTIFICATION
The analysts, Doug Terreson, James West, Stephen Richardson, primarily responsible for the preparation of this research report attest to the following: (1) that the views and opinions rendered in
this research report reflect his or her personal views about the subject companies or issuers; and (2) that no part of the research analyst’s compensation was, is, or will be directly related to the
specific recommendations or views in this research report.
DISCLOSURES
This report is approved and/or distributed by Evercore Group L.L.C. ("Evercore Group"), a U.S. licensed broker-dealer regulated by the Financial Industry Regulatory Authority ("FINRA"),
and Evercore ISI International Limited ("lSI UK''), which is authorised and regulated in the United Kingdom by the Financial Conduct Authority. The institutional sales, trading and research
businesses of Evercore Group and lSI UK collectively operate under the global marketing brand name Evercore lSI ("Evercore lSI"). Both Evercore Group and lSI UK are subsidiaries of
Evercore Inc. ("Evercore"). The trademarks, logos and service marks shown on this report are registered trademarks of Evercore.
The analysts and associates responsible for preparing this report receive compensation based on various factors, including Evercore’s Partners' total revenues, a portion of which is generated by
affiliated investment banking transactions. Evercore lSI seeks to update its research as appropriate, but various regulations may prevent this from happening in certain instances. Aside from
certain industry reports published on a periodic basis, the large majority of reports are published at irregular intervals as appropriate in the analyst's judgment.
Evercore lSI generally prohibits analysts, associates and members of their households from maintaining a financial interest in the securities of any company in the analyst's area of coverage. Any
exception to this policy requires specific approval by a member of our Compliance Department. Such ownership is subject to compliance with applicable regulations and disclosure. Evercore lSI
also prohibits analysts, associates and members of their households from serving as an officer, director, advisory board member or employee of any company that the analyst covers.
This report may include a Tactical Call, which describes a near-term event or catalyst affecting the subject company or the market overall and which is expected to have a short-term price impact
on the equity shares of the subject company. This Tactical Call is separate from the analyst's long-term recommendation (Outperform, In Line or Underperform) that reflects a stock's forward 12-
month expected return, is not a formal rating and may differ from the target prices and recommendations reflected in the analyst's long-term view.
Applicable current disclosures regarding the subject companies covered in this report are available at the offices of Evercore lSI, and can be obtained by writing to Evercore
Group L.L.C., Attn. Compliance, 666 Fifth Avenue, 11th Floor, New York, NY 10103.
Evercore and its affiliates, and I or their respective directors, officers, members and employees, may have, or have had, interests or qualified holdings on issuers mentioned in this report. Evercore
and its affiliates may have, or have had, business relationships with the companies mentioned in this report.
Additional information on securities or financial instruments mentioned in this report is available upon request.
Ratings Definitions
Current Ratings Definition
Evercore lSI's recommendations are based on a stock's total forecasted return over the next 12 months. Total forecasted return is equal to the expected percentage price return plus gross dividend
yield. We divide our stocks under coverage into three primary ratings categories, with the following return guidelines:
Outperform- the total forecasted return is expected to be greater than the expected total return of the analyst's coverage universe
In Line- the total forecasted return is expected to be in line with the expected total return of the analyst's universe
Underperform- the total forecasted return is expected to be less than the expected total return of the analyst's universe
Coverage Suspended- the rating and target price have been removed pursuant to Evercore lSI policy when Evercore is acting in an advisory capacity in a merger or strategic transaction
involving this company and in certain other circumstances.*
Rating Suspended- Evercore lSI has suspended the rating and target price for this stock because there is not sufficient fundamental basis for determining, or there are legal, regulatory or policy
constraints around publishing, a rating or target price. The previous rating and target price, if any, are no longer in effect for this company and should not be relied upon.*
*Prior to October 10, 2015, the "Coverage Suspended" and "Rating Suspended" categories were included in the category "Suspended."
FlNRA requires that members who use a ratings system with terms other than "Buy," "Hold/Neutral" and "Sell" to equate their own ratings to these categories. For this
purpose, and in the Evercore lSI ratings distribution below, our Outperform, In Line, and Underperform ratings can be equated to Buy, Hold and Sell, respectively.

51
Historical Ratings Definitions
Prior to March 2, 2017, Evercore lSI's recommendations were based on a stock's total forecasted return over the next 12 months:
Buy- the total forecasted return is expected to be greater than 10%
Hold- the total forecasted return is expected to be greater than or equal to 0% and less than or equal to 10%
Sell -the total forecasted return is expected to be less than 0%
On October 31, 2014, Evercore acquired International Strategy & Investment Group LLC ("lSI Group") and lSI UK (the "Acquisition") and transferred Evercore Group's research, sales and
trading businesses to lSI Group. On December 31, 2015, the combined research, sales and trading businesses were transferred back to Evercore Group in an internal reorganization. Since the
Acquisition, the combined research, sales and trading businesses have operated under the global marketing brand name Evercore lSI.
lSI Group and lSI UK:
Prior to October 10, 2014, the ratings system of lSI Group and lSI UK which was based on a 12-month risk adjusted total return:
Strong Buy- Return > 20%
Buy- Return 10% to 20%
Neutral - Return 0% to 10%
Cautious- Return -10% to 0%
Sell- Return< -10%
For disclosure purposes, lSI Group and lSI UK ratings were viewed as follows: Strong Buy and Buy equate to Buy, Neutral equates to Hold, and Cautious and Sell equate to Sell.
Evercore Group:
Prior to October 10, 2014, the rating system of Evercore Group was based on a stock's expected total return relative to the analyst's coverage universe over the following 12 months. Stocks under
coverage were divided into three categories:
Overweight- the stock is expected to outperform the average total return of the analyst's coverage universe over the next 12 months.
Equal-Weight- the stock is expected to perform in line with the average total return of the analyst's coverage universe over the next 12 months. Underweight -the stock is expected to underperform
the average total return of the analyst's coverage universe over the next 12 months. Suspended- the company rating, target price and earnings estimates have been temporarily suspended.
For disclosure purposes, Evercore Group's prior "Overweight," "Equal-Weight" and "Underweight" ratings were viewed as "Buy," "Hold" and "Sell," respectively.
Ratings Definitions for Portfolio-Based Coverage
Evercore lSI utilizes an alternate rating system for companies covered by analysts who use a model portfolio-based approach to determine a company's investment recommendation. Covered
companies are included or not included as holdings in the analyst's Model Portfolio, and have the following ratings:
Long- the stock is a positive holding in the model portfolio; the total forecasted return is expected to be greater than 0%.
Short- the stock is a negative holding in the model portfolio; the total forecasted return is expected to be less than 0%.
No Position- the stock is not included in the model portfolio.
Coverage Suspended- the rating and target price have been removed pursuant to Evercore lSI policy when Evercore is acting in an advisory capacity in a merger or strategic transaction involving
this company, and in certain other circumstances; a stock in the model portfolio is removed.
Rating Suspended - Evercore lSI has suspended the rating and/or target price for this stock because there is not sufficient fundamental basis for determining, or there are legal, regulatory or
policy constraints around publishing, a rating or target price. The previous rating and target price, if any, are no longer in effect for this company and should not be relied upon; a stock in the model
portfolio is removed.
Stocks included in the model portfolio will be weighted from 0 to 100% for Long and 0 to -100% for Short. A stock's weight in the portfolio reflects the analyst's degree of conviction in the stock's
rating relative to other stocks in the portfolio. The model portfolio may also include a cash component. At any given time the aggregate weight of the stocks included in the portfolio and the cash
component must equal100%.
Stocks assigned ratings under the alternative model portfolio-based coverage system cannot also be rated by Evercore lSI's Current Ratings definitions of Outperform, In Line and Underperform.
FlNRA requires that members who use a ratings system with terms other than "Buy," "Hold/Neutral" and "Sell," to equate their own ratings to these categories. For this purpose,
and in the Evercore lSI ratings distribution below, our Long, No Position and Short ratings can be equated to Buy, Hold and Sell respectively.
52
Historical Ratings Definitions
Prior to March 2, 2017, Evercore lSI's recommendations were based on a stock's total forecasted return over the next 12 months:
Buy- the total forecasted return is expected to be greater than 10%
Hold- the total forecasted return is expected to be greater than or equal to 0% and less than or equal to 10%
Sell -the total forecasted return is expected to be less than 0%
On October 31, 2014, Evercore acquired International Strategy & Investment Group LLC ("lSI Group") and lSI UK (the "Acquisition") and transferred Evercore Group's research, sales and
trading businesses to lSI Group. On December 31, 2015, the combined research, sales and trading businesses were transferred back to Evercore Group in an internal reorganization. Since the
Acquisition, the combined research, sales and trading businesses have operated under the global marketing brand name Evercore lSI.
lSI Group and lSI UK:
Prior to October 10, 2014, the ratings system of lSI Group and lSI UK which was based on a 12-month risk adjusted total return:
Strong Buy- Return > 20%
Buy- Return 10% to 20%
Neutral - Return 0% to 10%
Cautious- Return -10% to 0%
Sell- Return< -10%
For disclosure purposes, lSI Group and lSI UK ratings were viewed as follows: Strong Buy and Buy equate to Buy, Neutral equates to Hold, and Cautious and Sell equate to Sell.
Evercore Group:
Prior to October 10, 2014, the rating system of Evercore Group was based on a stock's expected total return relative to the analyst's coverage universe over the following 12 months. Stocks under
coverage were divided into three categories:
Overweight- the stock is expected to outperform the average total return of the analyst's coverage universe over the next 12 months.
Equal-Weight- the stock is expected to perform in line with the average total return of the analyst's coverage universe over the next 12 months. Underweight -the stock is expected to underperform
the average total return of the analyst's coverage universe over the next 12 months. Suspended- the company rating, target price and earnings estimates have been temporarily suspended.
For disclosure purposes, Evercore Group's prior "Overweight," "Equal-Weight" and "Underweight" ratings were viewed as "Buy," "Hold" and "Sell," respectively.
Ratings Definitions for Portfolio-Based Coverage
Evercore lSI utilizes an alternate rating system for companies covered by analysts who use a model portfolio-based approach to determine a company's investment recommendation. Covered
companies are included or not included as holdings in the analyst's Model Portfolio, and have the following ratings:
Long- the stock is a positive holding in the model portfolio; the total forecasted return is expected to be greater than 0%.
Short- the stock is a negative holding in the model portfolio; the total forecasted return is expected to be less than 0%.
No Position- the stock is not included in the model portfolio.
Coverage Suspended- the rating and target price have been removed pursuant to Evercore lSI policy when Evercore is acting in an advisory capacity in a merger or strategic transaction involving
this company, and in certain other circumstances; a stock in the model portfolio is removed.
Rating Suspended - Evercore lSI has suspended the rating and/or target price for this stock because there is not sufficient fundamental basis for determining, or there are legal, regulatory or
policy constraints around publishing, a rating or target price. The previous rating and target price, if any, are no longer in effect for this company and should not be relied upon; a stock in the model
portfolio is removed.
Stocks included in the model portfolio will be weighted from 0 to 100% for Long and 0 to -100% for Short. A stock's weight in the portfolio reflects the analyst's degree of conviction in the stock's
rating relative to other stocks in the portfolio. The model portfolio may also include a cash component. At any given time the aggregate weight of the stocks included in the portfolio and the cash
component must equal100%.
Stocks assigned ratings under the alternative model portfolio-based coverage system cannot also be rated by Evercore lSI's Current Ratings definitions of Outperform, In Line and Underperform.
FlNRA requires that members who use a ratings system with terms other than "Buy," "Hold/Neutral" and "Sell," to equate their own ratings to these categories. For this purpose,
and in the Evercore lSI ratings distribution below, our Long, No Position and Short ratings can be equated to Buy, Hold and Sell respectively.

53
Evercore ISI ratings distribution (as of 08/07/2019)
Coverage Universe Investment Banking Services / Past 12 Months
Ratings Count Pct. Rating Count Pct.
Buy 394 51% Buy 268 68%
Hold 317 41% Hold 170 54%
Sell 39 5% Sell 16 41%
Coverage Suspended 18 2% Coverage Suspended 14 78%
Rating Suspended 11 1% Rating Suspended 4 36%
Issuer-Specific Disclosures (as of August 07, 2019)
Evercore ISI or an affiliate has acted as a manager or co-manager of a public offering of securities by these subject companies Baker Hughes A GE Company LLC in the last 12 months.
Evercore ISI or an affiliate expects to receive or intends to seek compensation for investment banking services from these subject companies Anadarko Petroleum, Apache, Chevron Corp,
Concho Resources, Continental Resources, Devon Energy, Exxon Mobil Corp, Hess Corp, Marathon Oil Corporation, Noble Energy, Occidental Petroleum Corp, Pioneer Natural Resources
and Schlumberger Ltd. within the next three months.
Evercore ISI has a client relationship with, or has received compensation for non-investment banking, securities-related services from these subject companies Baker Hughes A GE Company
LLC and ConocoPhillips in the last 12 months.
The analyst(s) or a member of his or her household has a financial interest in the securities of these subject companies Schlumberger Ltd. (this may include, without limitation, whether it
consists of any option, right, warrant, future, long or short position).
An employee, employee's immediate family member, director or consultant of Evercore ISI or one of its affiliates (but not a research analyst or a member of a research analyst's household) is a
director of the subject companies BP and Schlumberger Ltd..
Evercore ISI or an affiliate has received compensation from these subject companies Anadarko Petroleum, Apache, Cimarex Energy, Hess Corp, Marathon Oil Corporation and Noble Energy
for investment banking services in the last 12 months.
Price Charts
GENERAL DISCLOSURES
This report is approved and/or distributed by Evercore Group L.L.C. (“Evercore Group”), a U.S. licensed broker-dealer regulated by the Financial Industry Regulatory Authority (“FINRA”)
and by Evercore ISI International Limited (“ISI UK”), which is authorised and regulated in the United Kingdom by the Financial Conduct Authority. The institutional sales, trading and research
businesses of Evercore Group and ISI UK collectively operate under the global marketing brand name Evercore ISI ("Evercore ISI"). Both Evercore Group and ISI UK are subsidiaries of
Evercore Inc. ("Evercore"). The trademarks, logos and service marks shown on this report are registered trademarks of Evercore Inc.
This report is provided for informational purposes only. It is not to be construed as an offer to buy or sell or a solicitation of an offer to buy or sell any financial instruments or to participate in
any particular trading strategy in any jurisdiction. The information and opinions in this report were prepared by registered employees of Evercore ISI. The information herein is believed by
Evercore ISI to be reliable and has been obtained from public sources believed to be reliable, but Evercore ISI makes no representation as to the accuracy or completeness of such information.
Opinions, estimates and projections in this report constitute the current judgment of the author as of the date of this report. They do not necessarily reflect the opinions of Evercore and are
subject to change without notice. In addition, opinions, estimates and projections in this report may differ from or be contrary to those expressed by other business areas or groups of Evercore
and its affiliates. Evercore ISI has no obligation to update, modify or amend this report or to otherwise notify a reader thereof in the event that any matter stated herein, or any opinion,
projection, forecast or estimate set forth herein, changes or subsequently becomes inaccurate. Facts and views in Evercore ISI research reports and notes have not been reviewed by, and may
not reflect information known to, professionals in other Evercore affiliates or business areas, including investment banking personnel.

54
Evercore ISI does not provide individually tailored investment advice in research reports. This report has been prepared without regard to the particular investments and circumstances of the
recipient. The financial instruments discussed in this report may not suitable for all investors and investors must make their own investment decisions using their own independent advisors as
they believe necessary and based upon their specific financial situations and investment objectives. Securities and other financial instruments discussed in this report, or recommended or offered
by Evercore ISI, are not insured by the Federal Deposit Insurance Corporation and are not deposits of or other obligations of any insured depository institution. If a financial instrument is
denominated in a currency other than an investor’s currency, a change in exchange rates may adversely affect the price or value of, or the income derived from the financial instrument, and such
investor effectively assumes such currency risk. In addition, income from an investment may fluctuate and the price or value of financial instruments described in this report, either directly or
indirectly, may rise or fall. Estimates of future performance are based on assumptions that may not be realized. Furthermore, past performance is not necessarily indicative of future
performance.
Evercore ISI salespeople, traders and other professionals may provide oral or written market commentary or trading strategies to our clients that reflect opinions that are contrary to the
opinions expressed in this research. Our asset management affiliates and investing businesses may make investment decisions that are inconsistent with the recommendations or views expressed
in this research.
Electronic research is simultaneously available to all clients. This report is provided to Evercore ISI clients and may not be redistributed, retransmitted or disclosed, in whole or in part, or in any
form or manner, without the express written consent of Evercore ISI. Receipt and review of this research report constitutes your agreement not to redistribute, retransmit, or disclose to others
the contents, opinions, conclusion or information contained in this report (including any investment recommendations, estimates or target prices) without first obtaining express permission
from Evercore ISI.
This report is not intended for distribution to, or use by any person or entity in any jurisdiction or country where such distribution or use would be contrary to local law or regulation.
For investors in the UK: In making this report available, Evercore makes no recommendation to buy, sell or otherwise deal in any securities or investments whatsoever and you should neither
rely or act upon, directly or indirectly, any of the information contained in this report in respect of any such investment activity. This report is being directed at or distributed to, (a) persons who
fall within the definition of Investment Professionals (set out in Article 19(5) of the Financial Services and Markets Act 2000 (Financial Promotion) Order 2005 (the “Order”)); (b) persons
falling within the definition of high net worth companies, unincorporated associations, etc. (set out in Article 49(2) of the Order); (c) other persons to whom it may otherwise lawfully be
communicated (all such persons together being referred to as “relevant persons”). This report must not be acted on or relied on by persons who are not relevant persons.
Applicable current disclosures regarding the subject companies covered in this report are available at the offices of Evercore ISI, and can be obtained by writing to Evercore Group L.L.C., Attn.
Compliance, 666 Fifth Avenue, 11th Floor, New York, NY 10103.
In compliance with the European Securities and Markets Authority's Market Abuse Regulation, a list of all Evercore ISI recommendations disseminated in the preceding 12 months for the
subject companies herein, may be found at the following site: https://evercoreisi.mediasterling.com/disclosure.
© 2019. Evercore Group L.L.C. All rights reserved.