lethbridge community outlook · the community outlook report evaluates the current state of the...
TRANSCRIPT

LethbridgeCommunity
Outlook2015 - 2022

This report is produced by the City of Lethbridge in cooperation with Economic Development Lethbridge.

1
Table of ConTenTs
Executive Summary 3
Part 1: Global Outlook 5
1.1: World 6
1.2: United States of America 6
1.3: Canada 6
1.4: Alberta 6
Part 2: Economic Outlook 8
2.1: The Lethbridge Economy 9
2.1.1: Business Investment 10
2.1.2: Construction Activity 12
2.1.3: Housing Markets 14
2.2: Key Indicators for Lethbridge 16
2.2.1: Consumer Price Index and Inflation 16
2.2.2: Labour Market (Employment) 18
2.2.3: Population 22
2.3: Industry Trends 26
2.3.1: Agricultural Markets 26
2.3.2: Energy Markets (Oil and Gas) 28
2.3.3: Public Sector 30
2.3.4: Development Sector 31
2.4: Economic Forecasts 38
2.4.1: Population Forecasts 38
2.4.2: Employment Forecasts 42
Part 3: Social Outlook 46
3.1: Demographic Change 47
3.1.1: Diversity 48
3.1.2: Families and Children 52
3.1.3: Seniors 54
3.1.4: Persons Living with a Disability 55
3.2: Health 56
3.2.1: Housing Needs 58
3.2.2: Poverty Profile 60
3.3: Education 62
3.4: Public Safety 64
3.5: Community Resilience (Fire/Flood) 65
Part 4: Appendices 67
4.1: Lethbridge Population Projections 68
4.2: Lethbridge Employment Projections 69
4.3: Crime Severity Index 70 4.4: Social-Demographic and Economic Characteristics 72
PAGE PAGE

2 City of Lethbridge2015-2022 Lethbridge Community Outlook
InTroduCTIon

2015-2022 Lethbridge Community OutlookCity of Lethbridge
Header
3
InTroduCTIon
Executive Summary
The Community Outlook Report evaluates the current state of the City of Lethbridge within the context of the Global, National, Provincial and Regional settings. It is intended to provide a snapshot of how well the City is positioned to continue to prosper and to balance the needs of the community through time. It includes an analysis of the City of Lethbridge from an economic as well as a social perspective to provide insights into the current state of the community along with future projections that are intended to enable the community to anticipate and plan for future services and needs.
FACTS AND FIGURES• The global economic growth is projected to be 2.9-3.2%
for 2016 and growth in Canada is projected to be 1.3-1.7%. Alberta will continue to be challenged as a result of the downturn in the energy sector and growth is expected to contract.
• The outlook for the Lethbridge and Region’s economy is positive. Stability in the public service sector and traditional industries, along with growth in the agri-business sector and in emerging industries, will lead to positive growth. Economic Growth in Lethbridge increased by 1.1% in 2015 and is expected to see moderate growth in 2016 and 2017.
• Lethbridge’s core industries include agri-food processing, manufacturing and supply chain and logistics. Significant investment in recent years has included construction of a new PepsiCo Beverage Canada warehouse distribution centre, expansion of the Lethbridge Frito-Lay plant, and upgrading and modernization by Richardson Oilseed of their operations in Lethbridge.
• Construction activity in Lethbridge reached a new high in 2015 with $249.8 million dollars of building permit value being recorded. Commercial activity was particularly strong in 2015, up 83% from 2014, and residential activity was up 6% from the previous year. Significant investments in institutional projects include the expansion to the Lethbridge Regional Hospital (165,270 sq. ft.), Lethbridge Trades and Technology Building ($65 million), initiated in 2015, and the new 36,000 sq. ft. Science and Academic Building
(Destination Project) at the University of Lethbridge ($248 million) initiated in 2016.
• While housing starts in other cities in the province declined sharply from 2014, Lethbridge was one of two jurisdictions (Edmonton being the other) that actually saw a 23% increase in housing starts. Multifamily starts in the Region increased 88% from 121 in 2014 to 228 in 2015. It is expected that housing starts in 2016 will remain strong, though the effect of the economic downturn in Alberta will likely dampen expectations for 2016 and 2017.
• Inflation in 2015 in Alberta, following the Consumer Price Index (CPI), was 1.2% in 2015. Forecasts for 2016 suggest inflation between 1.3% and 1.6% and for 2017 in the range of 1.6% to 2.3%.
• Unemployment in the Lethbridge-Medicine Hat region was 5% in 2015 and had a participation rate of 67.2%, the highest annual figure since 2012. With eight of Lethbridge largest employers being in the public sector, Lethbridge has benefited with growth in public administration, health and education. Continued growth in traditional industries such as agri-business and manufacturing will also benefit Lethbridge in 2016 and 2017.
TRENDS AND OBSERVATIONS• Population growth in Lethbridge has traditionally been
stable averaging about 1.7% annually. The jumps in population experienced in other cities in Alberta have not tended to take place in Lethbridge. Growth between 2014 and 15 was 1.9% and can be expected to be similar for 2016, 2017 and 2018 with Lethbridge reaching a population of 100,000 in 2019. Growth remains strongest in West Lethbridge and this will remain the case in the foreseeable future.
• The largest growth segment in the population is the 30-39 age category followed by the 60-69 and then the 0-9 age group. This suggests that there will need to be consideration given to variation in the type of housing that is provided and diversification of the range of supports that might be required locally. Seniors housing will also be an important segment as that age cohort continues to grow. This population will continue to diversify as new immigrants are welcomed into the city. Efforts should also be made in stemming the observed

2015-2022 Lethbridge Community Outlook City of Lethbridge4
InTroduCTIon
exodus of people completing university or college as these individuals are highly skilled and tend to work in higher wage jobs.
• Demographic shifts are presently taking place in Lethbridge including an increase in diversity and immigration, an aging population, challenges and barriers experienced by youth, urbanization of indigenous peoples, significant poverty and people living with vulnerabilities, lack of adequate housing options and an increase in the birth rate amongst indigenous families. Monitoring these emerging social trends will need to take place so as to be able proactive and responsive to the unique needs of the community.
• The Agriculture Sector continued to be a significant part of the Lethbridge economy. Strong prices for cattle producers, supported by a lower Canadian dollar, created favorable conditions for producers. Healthy gains for local crop producers was also posted in 2015.
• The Oil and Gas Sector plays a significant role in Alberta. Oil averaged $49 a barrel in 2015 and is anticipated to be between $45 and $55 by the end of 2016. The public sector will continue to be a stabilizing effect on the local economy.
• The Development Sector remains strong with housing showing resiliency despite the downturn elsewhere in the Province. Despite stable construction activity in new homes there is a declining amount of land being serviced resulting from a reduction in lot sizes and an slowly emerging trend towards infill construction in older neighbourhoods. These trends suggest consideration should be given to focusing new growth in a manner that maximizes investment in infrastructure as well as reinvestment in older communities.
• Employment is expected to remain relatively steady within the forecast horizon of this report. Lethbridge has been insulated from the downturn that resulted from the oil price declines. It is expected that retail employment will increase as the underserved West Lethbridge continues to see growth in the Crossings and West Lethbridge Employment Sector. Public Sector employment will also continue to bring stability to the City with expansion at the University, College and Lethbridge Regional Hospital.

City of Lethbridge 2015-2022 Lethbridge Community Outlook 5
Part 1: Global outlook

2015-2022 Lethbridge Community Outlook City of Lethbridge6
Global ouTlook
We live in an interconnected world where market forces tend to be increasingly correlated. As a result, it is always best to analyze a municipal economy in the context of the bigger global picture. This Global Outlook highlights the economic conditions in a variety of areas that help shape the Lethbridge picture. It will focus specifically on 2015-16 economic conditions in the following areas:
• World• United States of America• Canada• Alberta
1.1 World• Global economic growth is projected to increase by 2.9-
3.2% in 2016, which follows the 2015 figure of 2.7%. • While this figure remains elevated compared to pro-
jected growth rates for the developed world, it is far below the 3.9% average attained between 2000 and 2014.
• The transition towards a service-based economy in China has had reverberations for commodity producing countries everywhere.
• Economic conditions also remain subpar in Brazil, Japan, and the Euro Zone.
• Commodity-importing emerging market economies generally held up best in 2015, with India leading the way.
• Indonesia, Malaysia, the Philippines and Turkey also managed GDP growth of 4% or better in 2015.
• Uncertainty regarding free trade (highlighted by Brexit and dwindling prospects for the Trans-Pacific Partnership) has the potential to adversely affect global growth
1.2 United States of America• American growth is expected to remain steady with
projected GDP growth in 2016 of around 2.2-2.3%. • This comes on the heels of a 2.4% increase in 2015 and
is suggestive of an economy that is moving at a steady pace.
• Healthy consumer spending and a rebounding housing market are generally viewed as the segments that will drive growth this year, balancing out deteriorating net exports and further cuts in the energy sector.
1.3 Canada• The national economy is projected to witness GDP
growth by 1.3-1.7% in 2016, which follows growth of 1.2% last year.
• The effects of retreating commodity prices will continue to limit the momentum in energy-reliant areas, curtailing overall economic growth in Alberta, Saskatchewan, and Newfoundland.
• The outlook appears different for the rest of the country, where a lower Canadian dollar coupled with increasing American consumer demand should lead to an increase in manufacturing activity geared towards American exports (i.e. cars, lumber).
1.4 Alberta• The general consensus is that 2016 will be another
challenging year for the Alberta economy, with economists projecting a GDP contraction ranging from 0.3% to 2.3% and an unemployment rate that should average between 7.2% and 8.3%.
• Weakness related to the downturn in the energy sector will continue to adversely affect provincial economic conditions.
• While the province has promised an influx of infrastructure expenditures to stimulate the economy, Alberta may experience a decline in building permit values over the course of 2016 as both office and residential segments are experiencing tepid demand given the present circumstances.
2015-2022 Lethbridge Community OutlookCity of Lethbridge 7
Global ouTlook
ATB Financial, Economics & Research. (11 Jan. 2016). Alberta Economic Outlook – Q1 2016 Retrieved from 13. Mar. 2016. http://www.atb.com/SiteCollectionDocuments/About/Alberta-Economic-Outlook-Q1-2016.pdf.
CIBC Economics. (17 Dec. 2015). A Not-So-Sweet ’16. Retrieved from 13 Mar. 2016. http://research.cibcwm.com/economic_public/download/fdec15.pdf.
BMO Capital Markets. (11 Mar. 2016). Canadian Economic Outlook. Retrieved from 13 Mar. 2016. http://www.bmonesbittburns.com/economics/forecast/ca/cdamodel.pdf.
RBC Economics. (Mar. 2016).Economic and Financial Market Outlook. Retrieved from 13 Mar. 2016. http://www.rbc.com/economics/economic-reports/pdf/quarterly-economic-update/fcst_mar2016.pdf.
Scotiabank. (2 Mar. 2016). Global Forecast Update. Retrieved from 13 Mar. 2016. http://www.gbm.scotiabank.com/English/bns_econ/forecast.pdf.
BMO Capital Markets. (11 Mar. 2016). International Economic Outlook. Retrieve from 13 Mar. 2016. http://www.bmonesbittburns.com/economics/forecast/int/intmodel.pdf.
BMO Capital Markets. (4 Mar 2016). It’s a Slow World After All. Retrieved from 13 Mar. 2016. http://www.bmonesbittburns.com/economics/focus/20160304/feature.pdf.
BMO Capital Markets. (9 Mar. 2016). North American Outlook. Retrieved from 13. Mar. 2016. http://www.bmonesbittburns.com/economics/outlook/20160309/nao.pdf.
TD Economics. (26 Jan. 2016). Provincial Economic Forecast. Retrieved from 13 Mar. 2016. https://www.td.com/document/PDF/economics/qef/ProvincialEconomicForecast_Jan2016.pdf.
BMO Capital Markets. (11 Mar 2016). Provincial Economic Outlook. Retrieved from 13 Mar. 2016. http://www.bmonesbittburns.com/economics/forecast/prov/ProvincialOutlook.pdf.
CIBC Economics. (4 Mar. 2016). Provincial Forecast Update. Retrieved from 13 Mar. 2016. http://research.cibcwm.com/economic_public/download/provincial_forecast_update_2016-0304.pdf.
RBC Economics. (Mar. 2016). Provincial Outlook – Alberta. Retrieved from 13 Mar. 2016. http://www.rbc.com/economics/economic-reports/pdf/provincial-forecasts/alta.pdf.
TD Economics. (17 Dec. 2015). Quarterly Economic Forecast. Retrieved from 13 Mar. 2016. https://www.td.com/document/PDF/economics/qef/qefdec2015_canada.pdf.
BMO Capital Markets. (11 Mar. 2016). United States Economic Outlook. Retrieved from 13 Mar. 2016. http://www.bmonesbittburns.com/economics/forecast/us/usmodel.pdf.
SOURCES

8 City of Lethbridge2015-2022 Lethbridge Community Outlook
ParT 2: eConomIC ouTlook
2015-2022 Lethbridge Community OutlookCity of Lethbridge 9
2.1 Lethbridge Economy
Based on the many economic indicators outlined in this report there are plenty of reasons to maintain a continued positive outlook for the city and region. That’s not to say we are completely immune from the challenges facing the provincial economy. However, stability in traditional industries, growth of emerging industries and strength in the public sector create an environment for both stability and new opportunity.
In terms of economic growth, at $5.8 billion, Lethbridge’s GDP increased 1.1% in 2015 and is expected to see modest growth in both 2016 and 2017 according to the Conference Board of Canada. From a sector perspective, Agriculture grew by 2.3% and continues to be a significant driver of the Lethbridge economy representing 20% ($1 Billion) of the total gross domestic product. Lethbridge also experienced modest GDP growth in Construction (1.0%), while the emerging Information and Cultural Industry experienced the highest sector growth at 3.4%. The report highlights this sector as a ‘bright spot’ locally, as industry output has grown an average of 4% annually during the last decade. Trends like this highlight the need to focus on this type of continued diversification while building on the strength and innovation happening in core industries.
Public sector employment in Lethbridge remains strong with nine of the top 10 major employers in health care, education, and government services. These nine public sector organizations employ over 12,000 people, which accounts for almost 20% of the employed workforce in the city. Lethbridge has historically benefitted from the significance of public sector employment and it is reasonable to expect this will continue to influence the labour market in the future.
In terms of the labour market, 2015 was a challenging time for employment in the province. The Lethbridge-Medicine Hat region’s average unemployment rate in 2015 was 5%. This is an increase of 1.0 percentage points on an annual basis (4.0% in 2014). While this is an increase, the region remains the second lowest in the province sitting well below the provincial unemployment rate which averaged 6.0% and the national rate of 6.9%. This reflects some of the diversity in the local business landscape as well as the need to focus on innovation that comes through education and entrepreneurship.
Innovation can be driven by education as well as entrepreneurship, and Lethbridge continues to demonstrate strength in both of these areas. 2017 will be a milestone year for the post-secondary institutions in this city. Lethbridge College will celebrate its 60th anniversary and will also open the final phase of the Trades and Technology Facility – one of the largest projects in its history. The University of Lethbridge will mark it’s 50th anniversary and, with provincial funding in place, has begun work on the Destination Project – a new science and academic building that will shape the future of education in southern Alberta. With two prominent post-secondary institutions, there also comes the need for quality opportunities to encourage graduates to stay and work in this region. The tecconnect centre for entrepreneurship and innovation provides training opportunities and support services as well as a welcoming place for innovative thinkers to collaborate, grow and in some cases, build their own careers.
As our population moves towards 100,000, work is being done by the municipality, and its many partners, to build a great community and plan for a bright future. Over the next five years, there is nearly $1 Billion in major developments underway or planned and much of this is in the public and institutional sector. Major projects like Legacy Park and the ATB Centre (Leisure Complex) add value to the lifestyle already enjoyed by Lethbridge citizens.
Quality of life is also impacted by housing prices which have historically experienced steady growth in the city. This is an important data point as the housing market is generally seen as one of the first economic indicators to rise or fall when conditions change. In 2015 these indicators showed positive activity in Lethbridge with new home construction up 23% over the previous year. With the addition of 833 new units, Lethbridge added more new residential builds than other similar sized cities in Alberta. At the same time, residential resales had the strongest year since 2007 in terms of a record volume of transactions. Potential concerns about a housing slowdown elsewhere in the province do not appear to have significantly affected Lethbridge at this point in time.
Lethbridge is certainly not immune to the pressures affecting the province even with a diverse mix of industry and significant employment within the public sector. The majority of the tracked economic indicators support Lethbridge’s claim as a stable market supported by a reasonable level of economic diversification.
eConomIC ouTlook

2015-2022 Lethbridge Community Outlook City of Lethbridge10
2.1.1 Business InvestmentLethbridge has close to 5,700 businesses operating in multiple sectors with new businesses opening their doors every year. The market has experienced strong investment over the past five years in the commercial, industrial, institutional and residential sectors.
Over the past five years more than 1,730 new businesses have been licensed to operate in Lethbridge, 755 of those are regular brick and mortar businesses, with the remaining 977 home-based businesses licensed.
Lethbridge and the surrounding area enjoy a wide range of industrial and commercial opportunities – serviced land in industrial and commercial parks, big box power centres, small strip malls, and downtown retail space and office buildings. Our core industries enjoy favourable real estate market conditions that allow many options for investment now and in the future.
CORE INDUSTRIESLethbridge’s developed core industries include, agri-food processing, manufacturing, and supply chain and logistics. Together these industries account for 32% of the GDP, valued at $1.6 billion per year and the source of 9,300 jobs.
Emerging industries include environmental and information technologies (IT). Development in these areas is supported by the breadth of research and scientific capacity provided by the University of Lethbridge, Lethbridge College and two federal research facilities in the community. Recent government announcements to support new environmental technology may created opportunity for companies to innovate and grow. New products and services utilizing clean and/or alternative energy technologies such as solar, wind and bio-mass are well suited for the Lethbridge region.
BUSINESS DEVELOPMENTEconomic Development Lethbridge (EDL) is an arm’s length organization, supported by the City of Lethbridge, governed by a 25-member volunteer Board of Directors and managed by a team of professionals dedicated to promoting prosperity in Lethbridge. As part of the core mandate EDL works to attract new business to the city while also helping existing businesses expand and grow.
PROJECTS 2011-2015:Over the past five-years many new business investments as well as expansions have positively impacted the Lethbridge marketplace. The following are just a few examples of private sector activities tracked or supported by EDL:
• Red Arrow Motor Coach announced services to, and offices in, Lethbridge. (2011)
• PepsiCo Beverages Canada announced the start of construction on a 9,600 square foot LEED-certified warehouse distribution facility in Lethbridge. (2012)
• Richardson Oilseed Ltd. invested $15 million to expand and upgrade Canola Manufacturing Operations. (2012)
• Egg Processing Innovations Cooperative (EPIC) plant began operation in Lethbridge. It is the first egg breaking plant of its kind in Alberta. (2013)
• Richardson Oilseed Limited, one of the largest canola oil processors in North America, announced it will enhance efficiencies at the Lethbridge location through upgraded technology and modernization, which will more than double the capacity of the facility. (2016)
• Sunnyrose Cheese (a division of Agropur) successfully created a new wastewater agreement with the City of Lethbridge to build a pipeline from their Diamond City plant to the Lethbridge Water Treatment facility. (2013)
eConomIC ouTlook
New Business in Lethbridge
0
100
200
300
400
500
20152014201320122011Home Occupations Regular
Source: �e City of Lethbridge, Regulatory Services, New Business License List
387
172146
208 195256
286314
334
411
155
139106
140
215

2015-2022 Lethbridge Community OutlookCity of Lethbridge 11
• The tecconnect centre for entrepreneurship and innovation celebrated it fifth anniversary with seven incubator companies and five alumni companies demonstrating a growing positive influence on entrepreneurial success. Since opening, 95 jobs have been created thorough the centre with 52% of the companies in the tecconnect started by, or employing, grads from the local post-secondary institutions. (2015)
• Laporte acquired Lethbridge-based firm, Trimark Engineering and established their sixth Canadian office and first Alberta location. Laporte specializes in biopharmaceutical, food and beverage, and industrial engineering. (2014)
• Coulee Brew Company broke ground for a new restaurant and brewery. (2014)
• Federated Co-Operative Ltd. choose Lethbridge for Alberta expansion. Following information-based support over several months, South County CO-OP opened two new gas bars in the Chinook Business Park South and in Westgate, adding to an Agro Centre in Broxburn Business Park in Lethbridge County. (2014)
• Lowe’s, a new retail store opened in Lethbridge. • Mint Smartwash opened a carwash in Lethbridge.• PepsiCo Foods completed construction of a nine-story
expansion to their Lethbridge Frito-Lay plant adding a state-of-the-art automated storage and retrieval warehouse system. (2015)
SUMMARY New and emerging industries such as crop-innovations, agri-technologies, bio-industrials, and renewable energy opportunities can build off of the core agri-processing and manufacturing clusters strengths of Southern Alberta. Supporting growth in existing, emerging and entrepreneurial ventures remains a high priority, particularly in the emerging sectors of environmental and information technologies (IT).
eConomIC ouTlook
2015-2022 Lethbridge Community Outlook City of Lethbridge12
eConomIC ouTlook
2.1.2 Construction Activity
Building permits are an important leading indicator as this capital investment allows us to gauge where a market is headed. When permit values increase, it is a sign that developers have confidence in a local economy and its ability to generate growth.
HIGHLIGHTS:• Total construction value of building permits were
$249.8M in 2015, which is the highest figure on record (tracking under these categories began in 1962)
• Commercial permit values were up 83% year-over-year and 63% compared with the five-year average from 2010-2014
• The total per-capita building permit value in Lethbridge was $2,635, up 2% from the 2014 comparative
• When looking at new-in-the-ground projects construc-tion values based on permits were down 25% on an annual basis and down 3% compared with the five-year average
• Addition and alteration permit values were up 131% year-over-year and 82% compared with the five-year average
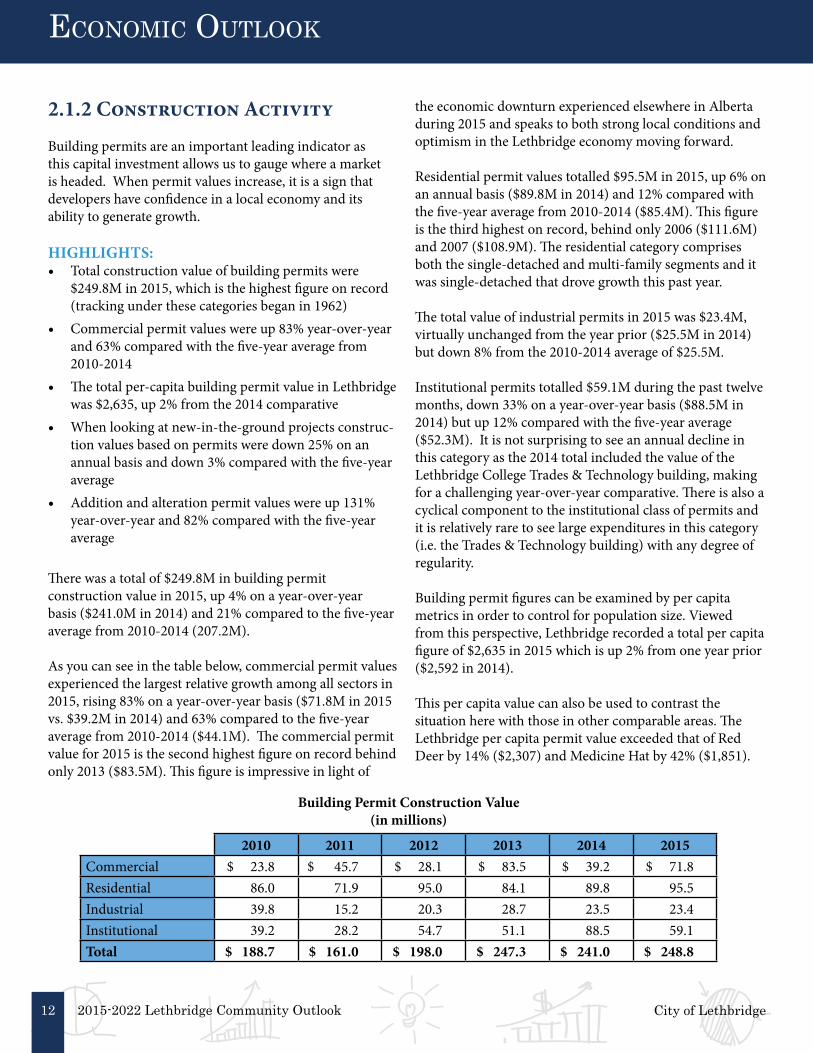
There was a total of $249.8M in building permit construction value in 2015, up 4% on a year-over-year basis ($241.0M in 2014) and 21% compared to the five-year average from 2010-2014 (207.2M).
As you can see in the table below, commercial permit values experienced the largest relative growth among all sectors in 2015, rising 83% on a year-over-year basis ($71.8M in 2015 vs. $39.2M in 2014) and 63% compared to the five-year average from 2010-2014 ($44.1M). The commercial permit value for 2015 is the second highest figure on record behind only 2013 ($83.5M). This figure is impressive in light of
the economic downturn experienced elsewhere in Alberta during 2015 and speaks to both strong local conditions and optimism in the Lethbridge economy moving forward.
Residential permit values totalled $95.5M in 2015, up 6% on an annual basis ($89.8M in 2014) and 12% compared with the five-year average from 2010-2014 ($85.4M). This figure is the third highest on record, behind only 2006 ($111.6M) and 2007 ($108.9M). The residential category comprises both the single-detached and multi-family segments and it was single-detached that drove growth this past year.
The total value of industrial permits in 2015 was $23.4M, virtually unchanged from the year prior ($25.5M in 2014) but down 8% from the 2010-2014 average of $25.5M.
Institutional permits totalled $59.1M during the past twelve months, down 33% on a year-over-year basis ($88.5M in 2014) but up 12% compared with the five-year average ($52.3M). It is not surprising to see an annual decline in this category as the 2014 total included the value of the Lethbridge College Trades & Technology building, making for a challenging year-over-year comparative. There is also a cyclical component to the institutional class of permits and it is relatively rare to see large expenditures in this category (i.e. the Trades & Technology building) with any degree of regularity.
Building permit figures can be examined by per capita metrics in order to control for population size. Viewed from this perspective, Lethbridge recorded a total per capita figure of $2,635 in 2015 which is up 2% from one year prior ($2,592 in 2014).
This per capita value can also be used to contrast the situation here with those in other comparable areas. The Lethbridge per capita permit value exceeded that of Red Deer by 14% ($2,307) and Medicine Hat by 42% ($1,851).
Building Permit Construction Value(in millions)
2010 2011 2012 2013 2014 2015Commercial $ 23.8 $ 45.7 $ 28.1 $ 83.5 $ 39.2 $ 71.8Residential 86.0 71.9 95.0 84.1 89.8 95.5Industrial 39.8 15.2 20.3 28.7 23.5 23.4Institutional 39.2 28.2 54.7 51.1 88.5 59.1Total $ 188.7 $ 161.0 $ 198.0 $ 247.3 $ 241.0 $ 248.8

2015-2022 Lethbridge Community OutlookCity of Lethbridge 13
New construction value captures the investment in new foundation and buildings, while stripping out permits related to building additions and alterations. It is an important indicator as it isolates growth and new expenditures, which are of particular importance to an economy.
The value of all new construction permits in Lethbridge during 2015 was $144.7M, down 25% from 2014 ($193.5M) which equates to 3% below the five-year average of $148.4M. The annual contrast in this category is skewed by the impact of the Trades & Technology building on the 2014 total so the five-year average offers an adjusted comparative.
One factor that cannot be overlooked when analyzing permit values over the past twelve months was the sizeable growth in additions and alterations permits. These totalled $100.5M in 2015 across all categories (residential, commercial, industrial and institutional), which represents an increase of 131% from 2014 ($43.5M) and an 82% increase, compared to the five-year average of $55.1M.
SUMMARYLethbridge experienced a record year in terms of the value of construction in the community at $249.8M. Strong growth was reported in both residential and commercial development, with industrial holding steady year-over-year. Institutional construction slowed in 2015, but this is the most volatile development category as this is based on government priorities and not necessarily market driven factors. There were less new-in-the-ground building projects in Lethbridge this year, however, the growth in investment into additions and alterations on existing buildings saw significant growth. With close to a billion dollars of development projects moving ahead over the next five years we anticipate building development and construction values to remain on par with the Lethbridge five-year average.
0
$10
$20
$30
$40
$50
201520142013201220112010
Industrial Building Permit Values(in millions)
0
$20
$40
$60
$80
$100
201520142013201220112010
Institutional Building Permit Values(in millions)
eConomIC ouTlook
City of Lethbridge (2015, December). City of Lethbridge Month End Report. Retrieved from http://www.lethbridge.ca/Doing-Business/Planning-Development/Permits-Applications/Documents/Stats/Stats%202015.12.pdf.
SOURCES
Residential Building Permit Values(in millions)
0
$20
$40
$60
$80
$100
201520142013201220112010
2015-2022 Lethbridge Community Outlook City of Lethbridge14
2.1.3 Housing Markets
LETHBRIDGE AND REGION HOUSINGHousing markets are an important leading indicator as they are one of the first sectors to shift when economic conditions change. An increase in housing starts suggests heightened demand to live in an area, which is usually linked to a strong local economy. Population growth, in concert with strong economic fundamentals, can lead to higher housing prices and overall wealth generation. Housing comprises the core financial asset of most Canadian families, so fluctuations in the value of this market has reverberations for local macroeconomic conditions and overall wealth generation.
HIGHLIGHTS:• Lethbridge was one of two Alberta jurisdictions to
witness an increase in housing starts in 2015• Overall housing starts were the highest on-record since
2009• Re-sale prices demonstrated healthy annual price
growth of 2%
The Lethbridge housing market had a strong year in 2015, maintaining growth while light turbulent market forces were at work elsewhere in the province.
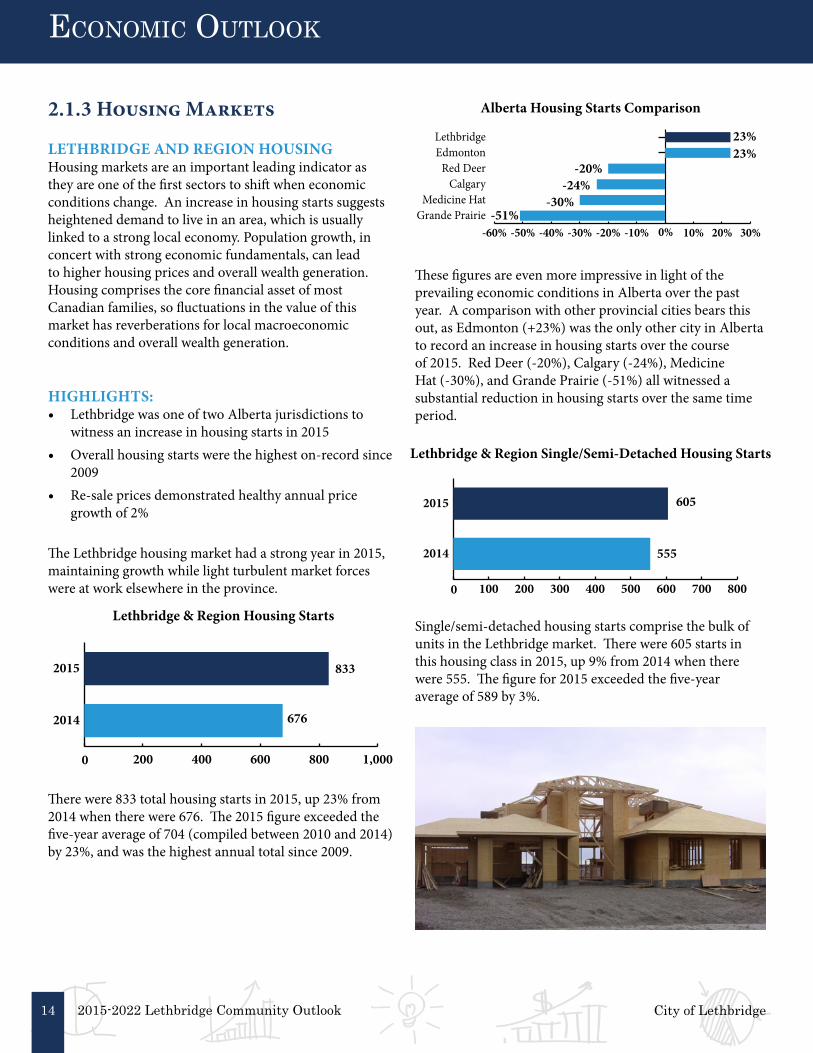
There were 833 total housing starts in 2015, up 23% from 2014 when there were 676. The 2015 figure exceeded the five-year average of 704 (compiled between 2010 and 2014) by 23%, and was the highest annual total since 2009.
These figures are even more impressive in light of the prevailing economic conditions in Alberta over the past year. A comparison with other provincial cities bears this out, as Edmonton (+23%) was the only other city in Alberta to record an increase in housing starts over the course of 2015. Red Deer (-20%), Calgary (-24%), Medicine Hat (-30%), and Grande Prairie (-51%) all witnessed a substantial reduction in housing starts over the same time period.
Single/semi-detached housing starts comprise the bulk of units in the Lethbridge market. There were 605 starts in this housing class in 2015, up 9% from 2014 when there were 555. The figure for 2015 exceeded the five-year average of 589 by 3%.
Alberta Housing Starts Comparison
-60% -50% -40% -30% -20% -10% 0% 10% 20% 30%Grande Prairie
Medicine HatCalgary
Red DeerEdmontonLethbridge
Lethbridge & Region Single/Semi-Detached Housing Starts
0 100 200 300 400 500 600 700 800
2014
2015
eConomIC ouTlook
605
555
Lethbridge & Region Housing Starts
0 200 400 600 800 1,000
2014
2015 833
676
23%23%
-20%-24%
-30%-51%

2015-2022 Lethbridge Community OutlookCity of Lethbridge
Header
15
eConomIC ouTlook
The largest growth rates witnessed in the Lethbridge market in 2015 came from the multi-unit housing sector. There were 228 starts in this segment, up 88% on a year-over-year basis (121 in 2014) and up 99% compared with the five-year average of 115. Total starts in this category were the highest on record since we began tabulating these figures in 2009, representing a key force driving overall starts over the course of the past year.
The increase in housing starts are an encouraging barometer when gauging economic conditions in Lethbridge at the moment. Developers are likely to take advantage of the current low-interest environment to facilitate new construction. Steady, balanced growth has likely attracted interest from outside investors as well, many of whom will be seeking downside protection in the current Alberta market. Most important of all is a stable labour market, which underpins the Lethbridge economy and ultimately drives the housing market. With a 4.0% unemployment rate in 2015 and a participation rate that continues to grow, Lethbridge continues to be a safe investment moving forward.
Re-sale average housing prices demonstrated steady growth over the past year, increasing by 2% ($263,408 in 2015 vs $257,008 in 2014). The 2015 figure was 5% higher than the five-year average obtained between 2010 and 2014 ($249,514). After a down year in 2013, re-sale prices have now witnessed steady price acceleration in consecutive years although there is still room for growth, as Lethbridge remains among the most affordable markets in Western Canada.
SUMMARYIn spite of upheaval elsewhere in the province, the Lethbridge housing market had a strong year in 2015. Overall housing starts were up 23% on a year-over-year basis, with annual growth in both the single/semi-detached (+9%) and multi-unit (+88%) segments. Prices also witnessed healthy growth, with re-sale average housing prices rising by 2% on an annual basis and 5% compared to the most recent five-year average.
Lethbridge & Region Multi-Family Housing Starts
0 50 100 150 200 250
2014
2015
Canada Mortgage and Housing Corporation. (5 Apr. 2016). Canada Mortgage and Housing Corporation - Housing Portal. Retrieved from 5 Apr. 2016. https://www03.cmhc-schl.gc.ca/hmiportal/en/#TableMapChart/48/2/Alberta.
Canadian Real Estate Association. (7 Apr. 2016).
SOURCES
228
Average
Lethbridge & Region Re-sale Average Housing Prices
0 $50 $100 $150 $200 $250 $300 $350 $400
2010-2014
2015 $263,408
$249,514121

2015-2022 Lethbridge Community Outlook City of Lethbridge16
eConomIC ouTlook
2.2 Key Indicators for Lethbridge2.2.1 Consumer Price Index and Inflation
Inflation is typically defined as a consistent increase in the overall price levels of goods and services and is usually measured and reported as an annual percentage increase. Inflation matters because when it goes up, every dollar in that economy buys a smaller percentage of a good or a service, meaning the value of a dollar declines. A tool used to measure inflation in Canada is the Consumer Price Index. According to Statistics Canada, “The Consumer Price Index (CPI) is an indicator of changes in consumer prices experienced by Canadians. It is obtained by comparing, over time, the cost of a fixed basket of goods and services purchased by consumers.” 1
Predicting the rate of inflation is a full-time job for many economic and financial institutions. Knowing what the cost will be in a market in the future, compared to today, is incredibly important to both public sector and private institutions, particularly in terms of planning for future costs in the areas of human resources, operations and long-term projects. In an effort to provide a tool to assist with longer term planning we have summarized the inflation outlooks from five key Alberta financial institutions and provided a scale of inflation rates. Unfortunately, CPI data is not available at the regional level and provincial level data is the only measure available to use for decision making across Alberta. The CIP forecasts below are based on three common themes expressed by all the economic outlooks reviewed:
• Alberta’s economy in 2016 started off weak and the devastation caused by the wildfire in Alberta’s north further impacted the economy. Growth for Alberta
is predicted to be low and/or negative in 2016, but is expected to modestly pick up in 2017.
• Canada’s direct export exposure to the United Kingdom is fairly low, however with the resent Brexit referendum, there is concern that global trade will slow, which has the possibility to negatively impact Canada.
• Across Canada, BC and Ontario are now the provinces driving Canada’s growth.
SUMMARYBased on the economic forecasts presented by these five outlooks, the following CPI forecast scale is presented as a tool to help organizations select the index that they believe best capture their local economic situation and the rate of inflation in their market.
1 www.statcan.gc.ca/imdb-bmdi/2301-eng.htm
2 http://www.atb.com/SiteCollectionDocuments/About/Q32016Outlook.pdf
3 http://www.bmonesbittburns.com/economics/forecast/prov/provincialoutlook.pdf
4 https://www.nbc.ca/content/dam/bnc/en/rates-and-analysis/economic-analysis/economic-outlook-summer-29juil2016.pdf
5 http://www.rbc.com/economics/economic-reports/pdf/provincial-forecasts/alta.pdf
6 https://www.td.com/document/PDF/economics/qef/ProvincialEconomicForecast_Jul2016.pdf
SOURCES
Alberta CPI, % change year-over-yearAge Demographic 2015 2016
(forecast)2017
(forecast)
ATB Alberta Economic Outlook2
1.2 1.4 1.6
BMO, Provincial Economic Outlook3
1.2 1.4 1.6
National Bank Economic Outlook4
1.2 1.6 2.3
RBC Economist: Provincial Outlook5
1.2 1.3 2.1
TD Economics, Provincial Economic Outlook6
1.2 1.6 2.2
Forecast Year Low Medium High
2016 1.3 1.4 1.62017 1.6 2.0 2.3
Alberta Consumer Price Index Scale

2015-2022 Lethbridge Community OutlookCity of Lethbridge 17
eConomIC ouTlook

2015-2022 Lethbridge Community Outlook City of Lethbridge18
2.2.2 Labour Market (Employment)
Labour Force statistics are helpful in assessing the economic strength of an area. Generally speaking, an area with a flourishing economy will have a relatively low unemployment rate and a high participation rate. The unemployment rate is calculated by dividing the number of employed individuals in a given area by the size of the labour force while the participation rate measures the number of individuals age 15 and above who are either employed or are actively looking for work. Alberta is broken into seven employment regions and Lethbridge is part of the Lethbridge-Medicine Hat employment region.
This report shares labour metrics (unemployment rates, participation rates, and workforce data) for both the employment region as well as the Lethbridge census agglomeration, an area defined by Statistics Canada, which primarily includes the city of Lethbridge.
HIGHLIGHTS:• The unemployment rate in the Lethbridge-Medicine
Hat employment region averaged 5.0% in 2015, up 1.0 percentage point from 2014
• The Lethbridge-Medicine Hat participation rate averaged 67.2% during 2015, the highest annual figure since 2012
• Lethbridge’s labour force grew to 68,200 people in 2015, up more than 5% from the number reported by Statistics Canada in 2014 (Note: they advise this data be used with caution)
UNEMPLOYMENTThe annual unemployment rate for the Lethbridge-Medicine Hat Region in 2015 was 5.0%, up 1.0 percentage point on an annual basis (4.0% in 2014). This was the second lowest figure in the province during this period behind only the Camrose-Drumheller region (annual unemployment rate of 4.9% in 2015). Furthermore, the incremental change of 1.0 percentage point was the second lowest among all the provincial employment regions. Only Edmonton (up 0.9 percentage points) experienced a lower uptick in its unemployment rate in 2015.
For the year as a whole, the provincial unemployment rate averaged 6.0% while the national figure was 6.9%. As mentioned previously, the Camrose-Drumheller (4.9%) region had the lowest average unemployment rate in Alberta in 2015, followed by Lethbridge-Medicine Hat (5.0%). The Wood Buffalo-Cold Lake region recorded the highest figure in Alberta with a 2015 average of 7.9% (up from 4.7% in 2014); Calgary was next highest at 6.3%, followed by Red Deer at 6.2%. This is not particularly surprising as the economy in these regions is heavily reliant on the oil and gas sector, which was down substantially over the course of 2015.
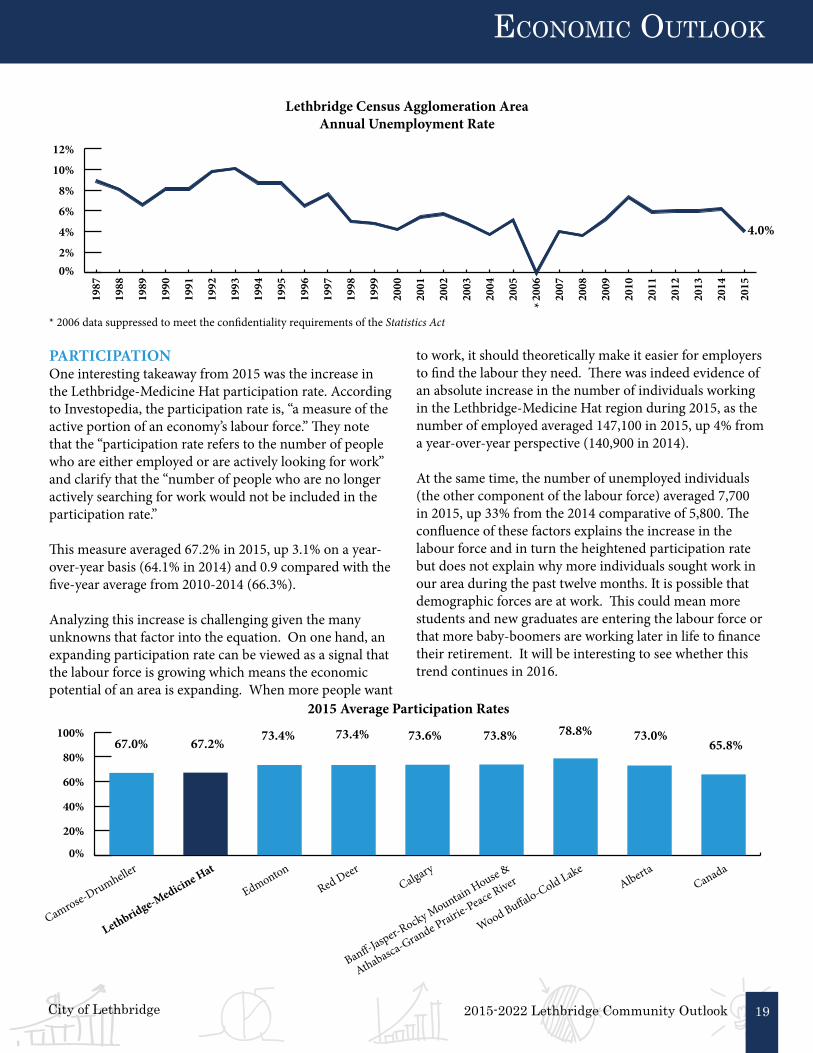
When reviewing Statistics Canada Data for the Lethbridge Census Agglomeration area (which we are advised to use with caution), the annual Lethbridge unemployment rate is reported as 4.0% for 2015, slightly lower than the Lethbridge-Medicine Hat employment region average of 5.0% as discussed above.
eConomIC ouTlook
0%
2%
4%
6%
8%
10%
2015 Average Unemployment Rates, Alberta Employment Region
Banff-Jasper-Rocky Mountain House &
Athabasca-Grande Prairie-Peace River
Camrose-Drumheller
EdmontonCalgary
Red Deer
Wood Buffalo-Cold LakeAlberta
Canada
Lethbridge-Medicine Hat
4.9% 5.0%5.9% 5.9% 6.2% 6.3% 6.0%
7.9%6.9%
Camrose-Drumheller
2015-2022 Lethbridge Community OutlookCity of Lethbridge 19
PARTICIPATIONOne interesting takeaway from 2015 was the increase in the Lethbridge-Medicine Hat participation rate. According to Investopedia, the participation rate is, “a measure of the active portion of an economy’s labour force.” They note that the “participation rate refers to the number of people who are either employed or are actively looking for work” and clarify that the “number of people who are no longer actively searching for work would not be included in the participation rate.”
This measure averaged 67.2% in 2015, up 3.1% on a year-over-year basis (64.1% in 2014) and 0.9 compared with the five-year average from 2010-2014 (66.3%).
Analyzing this increase is challenging given the many unknowns that factor into the equation. On one hand, an expanding participation rate can be viewed as a signal that the labour force is growing which means the economic potential of an area is expanding. When more people want
to work, it should theoretically make it easier for employers to find the labour they need. There was indeed evidence of an absolute increase in the number of individuals working in the Lethbridge-Medicine Hat region during 2015, as the number of employed averaged 147,100 in 2015, up 4% from a year-over-year perspective (140,900 in 2014).
At the same time, the number of unemployed individuals (the other component of the labour force) averaged 7,700 in 2015, up 33% from the 2014 comparative of 5,800. The confluence of these factors explains the increase in the labour force and in turn the heightened participation rate but does not explain why more individuals sought work in our area during the past twelve months. It is possible that demographic forces are at work. This could mean more students and new graduates are entering the labour force or that more baby-boomers are working later in life to finance their retirement. It will be interesting to see whether this trend continues in 2016.
0%2%
4%
6%
8%
10%
12%
2015
2014
2013
2012
2011
2010
2009
2008
2007
2006
2005
2004
2003
2002
2001
2000
1999
1998
1997
1996
1995
1994
1993
1992
1991
1990
1989
1988
1987
Lethbridge Census Agglomeration Area Annual Unemployment Rate
eConomIC ouTlook
0%
20%
40%
60%
80%
100%
2015 Average Participation Rates
Banff-Jasper-Rocky Mountain House &
Athabasca-Grande Prairie-Peace River
Lethbridge-Medicine Hat
EdmontonCalgary
Red Deer
Wood Buffalo-Cold LakeAlberta
Canada
Camrose-Drumheller
65.8%73.0%78.8%73.8%73.6%73.4%73.4%67.2%67.0%
4.0%
* 2006 data suppressed to meet the confidentiality requirements of the Statistics Act*
2015-2022 Lethbridge Community Outlook City of Lethbridge20
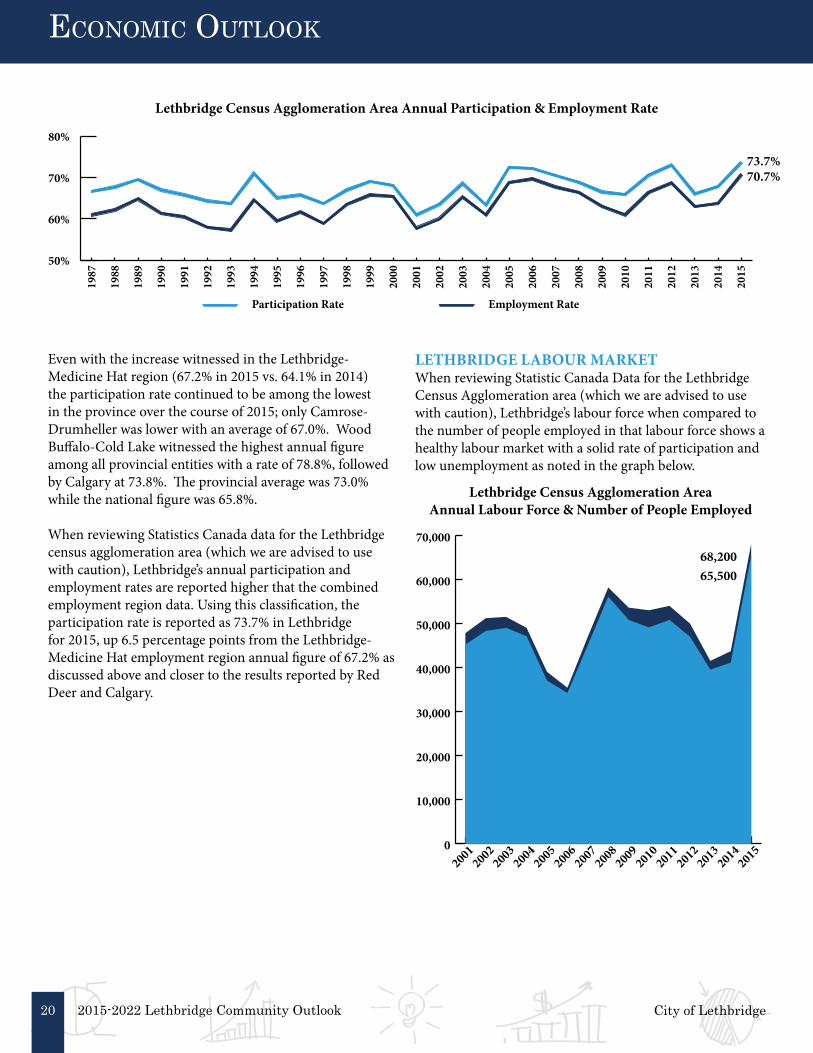
Even with the increase witnessed in the Lethbridge-Medicine Hat region (67.2% in 2015 vs. 64.1% in 2014) the participation rate continued to be among the lowest in the province over the course of 2015; only Camrose-Drumheller was lower with an average of 67.0%. Wood Buffalo-Cold Lake witnessed the highest annual figure among all provincial entities with a rate of 78.8%, followed by Calgary at 73.8%. The provincial average was 73.0% while the national figure was 65.8%.
When reviewing Statistics Canada data for the Lethbridge census agglomeration area (which we are advised to use with caution), Lethbridge’s annual participation and employment rates are reported higher that the combined employment region data. Using this classification, the participation rate is reported as 73.7% in Lethbridge for 2015, up 6.5 percentage points from the Lethbridge-Medicine Hat employment region annual figure of 67.2% as discussed above and closer to the results reported by Red Deer and Calgary.
LETHBRIDGE LABOUR MARKETWhen reviewing Statistic Canada Data for the Lethbridge Census Agglomeration area (which we are advised to use with caution), Lethbridge’s labour force when compared to the number of people employed in that labour force shows a healthy labour market with a solid rate of participation and low unemployment as noted in the graph below.
50%
60%
70%
80%
2015
2014
2013
2012
2011
2010
2009
2008
2007
2006
2005
2004
2003
2002
2001
2000
1999
1998
1997
1996
1995
1994
1993
1992
1991
1990
1989
1988
1987
Participation Rate Employment Rate
Lethbridge Census Agglomeration Area Annual Participation & Employment Rate
eConomIC ouTlook
0
10,000
20,000
30,000
40,000
50,000
60,000
70,000
20152014
20132012
20112010
20092008
20072006
20052004
20032002
2001
Lethbridge Census Agglomeration AreaAnnual Labour Force & Number of People Employed
73.7%70.7%
68,20065,500

2015-2022 Lethbridge Community OutlookCity of Lethbridge 21
INDUSTRY PERSPECTIVEAlthough not reported at the mid-sized city level, the industry employment trends reported in Alberta during 2015 seemed reflective of what was generally happening in the overall market. Employment cutbacks by sector were highest in Forestry, Fishing, Mining, Oil & Gas (-20,900 jobs), followed by Accommodation & Food Services (-15,900) and Transportation & Warehousing (-14,600). On the other side of the ledger, the industry that expanded its head count more than any other in Alberta during the past twelve months was Educational Services, where staffing counts were up by 16,100. Health Care & Social Assistance was next (+15,600), followed by Public Administration (+13,500).
The industry trends here are not very surprising given what we know about the prevailing economic conditions but it is worth keeping an eye on the public vs. private sector dichotomy as we move into 2016. Average public sector employment was up 10.7% in 2015 (when compared with the previous twelve month period) while private sector employment in Alberta was actually down 0.2% over the same time frame. This will place an increased burden on the provincial coffers and pressure on industry to add jobs in 2016.
SUMMARYThe Lethbridge-Medicine Hat employment region performed well in 2015, with annual unemployment of just 5.0%, an increased participation rate of 67.2% and overall labour force growth.
With eight of Lethbridge’s largest employers in the public sector, Lethbridge surely benefited from sector growth in public administration, health and education. However, supporting diversification and growth in traditional industries such as agri-processing and manufacturing, in addition to fostering new and emerging sectors, will continue to benefit Lethbridge’s employment market in 2016.
-25,000 -20,000 -15,000 -10,000 -5,000 0 5,000 10,000 15,000 20,000
Forestry, Fishing, Mining, Oil & Gas
Accommodation & Food Services
Transportation & Warehousing
Public Administration
Health Care & Social Assistance
Educational Services
2015 Employment by Industry: Number of Jobs Added/Subtracted in Alberta
eConomIC ouTlook
Statistics Canada. Table 282-0087 – Labour force survey estimates (LFS), by sex and age group, seasonally adjusted and unadjusted, monthly.
Statistics Canada. Table 282-0089 – Labour force survey estimates (LFS), employment by class of worker and sex, seasonally adjusted and unadjusted, monthly.
Statistics Canada. Table 282-0123 – Labour force survey estimates (LFS), by provinces and economic regions based on 2011 Census boundaries, annual.
Statistics Canada. Table 282-0134 – Labour force survey estimates (LFS), by selected census agglomerations based on 2011 Census boundaries, annual.
SOURCES
16,100
15,600
13,500
-20,900
-15,900
-14,600

2015-2022 Lethbridge Community Outlook City of Lethbridge22
2.2.3 Population
Population and demographic indicators are important benchmarks that offer insight into the economic and social health of an area. These figures are used as the basis for infrastructure and market based planning as they provide the impetus for allocating funding towards specific initiatives. Population statistics are also used by site selectors in determining whether an area is a good fit for business development and local investment.
HIGHLIGHTS:• Lethbridge is 2% of Alberta’s overall population• The Lethbridge population increased by 1.9% in 2015
and now stands at 94,804 • This is down from growth of 2.9% in 2014, but exceeds
the average growth rate between 2010-2014 of 1.7%• Population growth in west Lethbridge significantly out-
paced growth in the north and south• The largest absolute population growth between 2011
and 2015 was witnessed among the 30-39 age group (+1,747)
Lethbridge continued to witness steady growth in 2015 as its population increased by 1.9% on an annual basis and now stands at 94,804.
This growth rate exceeds the five-year average witnessed between 2010 and 2014 of 1.7%, although it was down on a year-over-year basis from the 2.9% growth in 2014.
When compared to Alberta’s other mid-sized cities of Red Deer, Medicine Hat and Fort McMurray, Lethbridge’s growth has been stable over the past fifteen years and has not seen the population jumps associated with times of economic growth, nor the sharp declines in times of recession.
Growth in Lethbridge fell below the provincial average in 2015 of 2.3% although it exceeded the national figure of 0.9%. Alberta legislation dictates that jurisdictions do not have to run an annual census which makes comparatives with other cities difficult. Red Deer is the only other comparably sized city in the province that conducts an annual census and it witnessed population growth of 2.3% in 2015 and an average of 1.9% between 2010 and 2014.
0.0%
0.5%
1.0%
1.5%
2.0%
2.5%
3.0%
20152014201320122011
Lethbridge Population Growth Rate
2015 Provincial Population Comparison
0.0%
1.0%
2.0%
3.0%
4.0%
5.0%
20152014201320122011
Canada Alberta Lethbridge
Lethbridge Annual Population Growth Comparative
Population Mid-Sized Alberta Cities
Red Deer Lethbridge Medicine Hat Fort McMurray
30,00040,00050,00060,00070,00080,00090,000
100,000110,000
2015
2014
2013
2012
2011
2010
2009
2008
2007
2006
2005
2004
2003
2002
2001
eConomIC ouTlook
Edmonton 877,926
Calgary 1,230,915
Red Deer 100,807
Lethbridge 94,804
Fort McMurray 82,724
Medicine Hat 63,018
1.4% 1.3%1.5%
2.9%
1.9%
100,80794,80482,724
63,018

2015-2022 Lethbridge Community OutlookCity of Lethbridge
Header
23
Population growth in West-Lethbridge has outpaced gains made in the other longstanding sectors of the city. The West-Lethbridge population increased by 3.8% in 2015 which is double the rate of the city as a whole. This figure also exceeded the annual average growth for West-Lethbridge from 2010-2014 of 3.0%. North-Lethbridge witnessed a 1.1% population growth in 2015 which is down slightly from its 2010-2014 average of 1.3% while South Lethbridge recorded an increase of 0.5%, down marginally from its 2010-2014 average of 0.7%.
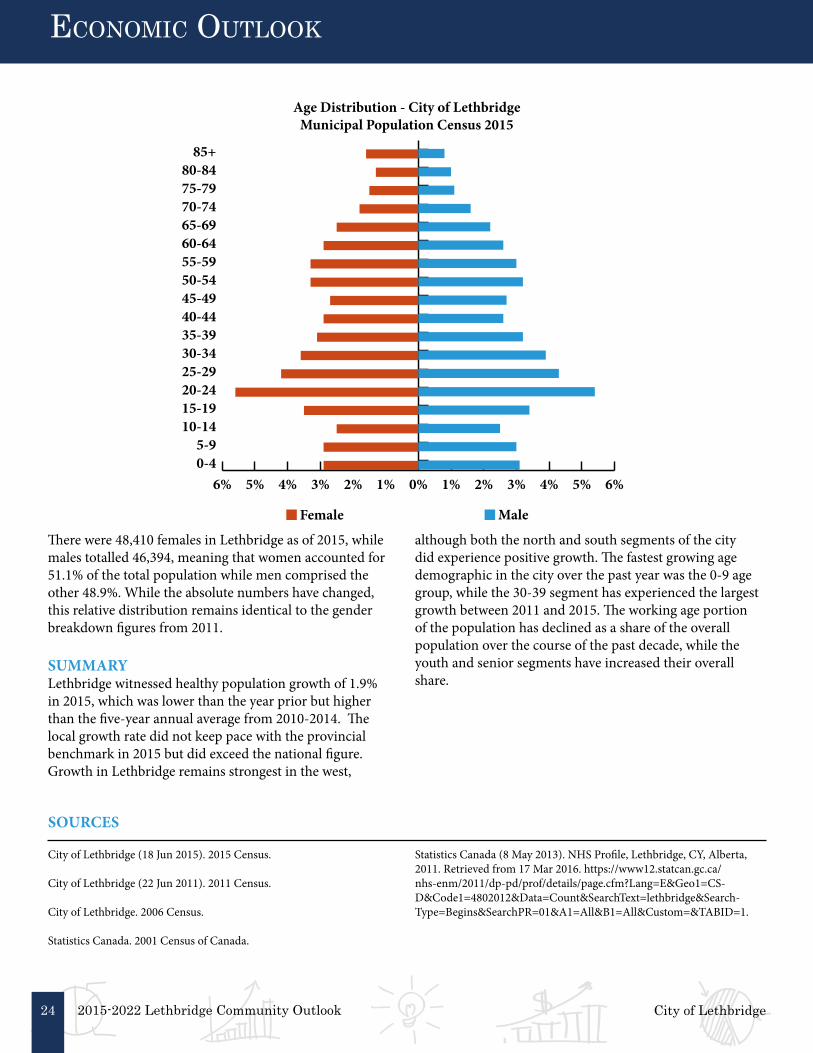
The average age in Lethbridge as of 2015 was 38, with an average male age of 37 and an average female age of 39. The biggest annual growth among age-based subgroups was recorded among those in the 0-9 category, which increased by 414 people year-over-year. This was followed by the 30-39 age-group (+326) and the 10-19 segment (+316).
The 30-39 aged segment of the population experienced the largest growth between 2011 and 2015 as this subgroup increased by 1,747 individuals during this period. Growth in the 60-69 age-group (+1,508) and 0-9 demographic (+1,393) recorded the second and third largest increases over the same time span.
Dependency groups break the population into categories in order to compare the youth and senior portions of the population with those of working age. As this chart highlights, the working age portion of the population has declined slightly in terms of its share of the overall population in Lethbridge over the course of the past decade. The total portion of youth as a percentage of the total population has increased over the past decade by 0.8 percentage points while the share of seniors as a percentage of the overall population is up by 1.0 percentage point. This is somewhat surprising given the increase in the 30-39 aged segment of the population since 2011 but can be attributed in part to a reduction in the number of individuals aged 40-49, as this number was actually down between 2015 and 2011 (-1). As of 2015, there are 2.2 working age people for every dependent in Lethbridge.
Top Three Largest Population Growth in 2015by Age Group
Age Demographic Population Change between2015 & 2014 (# of Individuals)
0-9 41430-39 32610-19 316
Top Three Largest Population Growth over 5 yearsby Age Group
Age Demographic Population Change between2015 & 2011 (# of Individuals)
30-39 1,74760-69 1,508
0-9 1,393
-1
0
1
2
3
4
5
20152014201320122011
5.0%
4.0%
3.0%
2.0%
1.0%
0.0%
-1.0%
South West North
Lethbridge Population Growth by Sector
Lethbridge Population - Dependency Group
0%
20%
40%
60%
80%
100%
65+15-640-14
20152006
eConomIC ouTlook
15.8% 16.6% 14.0% 15.0%
70.2% 68.4%
2015-2022 Lethbridge Community Outlook City of Lethbridge24
There were 48,410 females in Lethbridge as of 2015, while males totalled 46,394, meaning that women accounted for 51.1% of the total population while men comprised the other 48.9%. While the absolute numbers have changed, this relative distribution remains identical to the gender breakdown figures from 2011.
SUMMARYLethbridge witnessed healthy population growth of 1.9% in 2015, which was lower than the year prior but higher than the five-year annual average from 2010-2014. The local growth rate did not keep pace with the provincial benchmark in 2015 but did exceed the national figure. Growth in Lethbridge remains strongest in the west,
although both the north and south segments of the city did experience positive growth. The fastest growing age demographic in the city over the past year was the 0-9 age group, while the 30-39 segment has experienced the largest growth between 2011 and 2015. The working age portion of the population has declined as a share of the overall population over the course of the past decade, while the youth and senior segments have increased their overall share.
Age Distribution - City of LethbridgeMunicipal Population Census 2015
Female Male
6% 5% 4% 3% 2% 1% 0% 1% 2% 3% 4% 5% 6%0-45-9
10-1415-1920-2425-2930-3435-3940-4445-4950-5455-5960-6465-6970-7475-7980-84
85+
eConomIC ouTlook
City of Lethbridge (18 Jun 2015). 2015 Census.
City of Lethbridge (22 Jun 2011). 2011 Census.
City of Lethbridge. 2006 Census.
Statistics Canada. 2001 Census of Canada.
SOURCES
Statistics Canada (8 May 2013). NHS Profile, Lethbridge, CY, Alberta, 2011. Retrieved from 17 Mar 2016. https://www12.statcan.gc.ca/nhs-enm/2011/dp-pd/prof/details/page.cfm?Lang=E&Geo1=CS-D&Code1=4802012&Data=Count&SearchText=lethbridge&Search-Type=Begins&SearchPR=01&A1=All&B1=All&Custom=&TABID=1.

2015-2022 Lethbridge Community OutlookCity of Lethbridge 25
eConomIC ouTlook

2015-2022 Lethbridge Community Outlook City of Lethbridge26
eConomIC ouTlook
2.3 Industry Trends2.3.1 Agricultural Markets
According to the Conference Board of Canada’s 2015 Mid-Sized Cities Outlook, the agriculture sector contributed $1 billion (or 20%) to the Lethbridge GDP in 2014. In addition, agriculture based employment accounted for 4,300 jobs in our city in 2014. Lethbridge is powered by agriculture, with both crops and livestock as major contributions to the area. The bovine sector makes up the largest proportion of the local industry, as it accounted for 67% of the total economic contribution from agriculture in 2014. Crops account for approximately one-third of the local economic contribution from this sector, with three crops (wheat, barley and canola) accounting for over 80% of this figure. Due to the outsized importance of cattle and these three crops to our area, this analysis will focus exclusively on these commodities.
HIGHLIGHTS• The average price of slaughter cattle in Alberta was up
19% in the most recent twelve-month period (Jan 2015-Dec 2015) vs the previous period (Jan 2014-Dec 2014)
• All three major crop prices were up in the most recent twelve-month period vs the previous period
• Production of spring wheat and canola were down in Alberta in 2015 while barley was up
LIVESTOCKSlaughter cattle prices remained strong in 2015, with prices averaging $176.19 per hundredweight in Alberta in 2015 (compared to an average of $146.44 per hundredweight in 2014). The last two years have been exceptional for the cattle industry due to the persistently strong demand. A low Canadian dollar has aided this sector, with the Canadian dollar averaging 78 cents vs. the U.S. dollar in 2015 (compared to an average of 91 cents in 2014).
Mitigating factors for the cattle market over the past year include the drought that hit Alberta in the summer of 2015. This increased feed prices which cut into farmers profit margins. Despite the strong prices of recent years, farmers remain reluctant to expand their herd with Alberta witnessing a herd expansion of only 0.4% in 2015. While the expansion here has been relatively muted, the U.S. cattle herd was up by 1% year-over-year as of July 2015. This increase in supply might be behind lower prices towards the end of 2015, as monthly prices fell consecutively for six months to end the year.
The year ahead for local producers will depend on a few factors which include the fluctuations of the Canadian dollar, weather patterns, and overall herd supply. The Canadian dollar is projected to remain between 70 and 75 cents vs. the U.S. dollar over the course of 2016, which should provide a boost to this sector. On the other hand, there are signs that 2016 is shaping up as another dry year which could lead to elevated feed prices and reduced profit margins. In addition, rising American cattle herds could also stunt price growth.
CROPSPrices for all three of the predominant local crops (wheat, barley and canola) remained strong in 2015. Barley prices for Alberta producers were up 24% in the January-December 2015 period compared with the previous twelve-months ($214.64 per metric tonne from Jan-Dec 2015 vs. $173.57 from Jan-Dec 2014). Wheat prices in Alberta averaged 7% more in the most recent period ($222.45 per metric tonne in Jan-Dec 2015 vs. $207.80 in Jan-Dec 2014) while canola prices were up 4% over the same time period ($458.62 per metric tonne in Jan-Dec 2015 vs. $442.06 in Jan-Dec 2014). Crop prices have been aided by the lower Canadian dollar, as these commodities are generally priced in American currency.
$0 $100 $200 $300 $400 $500
Canola
Wheat
Barley
2015 2014
Average Alberta Crop Prices
$0 $50 $100 $150 $200
2014
2015
Average Alberta Cattle prices per Hundredweight
$176.19
$146.44

2015-2022 Lethbridge Community OutlookCity of Lethbridge 27
eConomIC ouTlook
Statistics Canada figures indicate that Alberta production totals in 2015 were down for both spring wheat (-13% year-over-year) and canola (-6%) although barley production was up 4%. Wheat production was likely adversely affected by the summer drought while canola production was damaged by late frost in May.
The next twelve months could see many of these same factors at work again. The Canadian dollar is projected to average between 70 and 75 cents vs. the U.S. dollar which should provide a buffer for local producers. On the other hand, high stockpiles could crimp further price growth. There is also some uncertainty with regards to growing conditions. A mild winter could mean an earlier planting season but the lack of snowfall during the winter means that prevalent dryness could factor into the equation again for farmers in 2016.
SUMMARYThe past year witnessed strong prices for Alberta cattle producers, although this began to wane towards the end of 2015. Price growth was supported by a lower Canadian dollar which created favourable terms of trade for local producers. A lack of moisture in the summer months did increase feed costs and an expansion of the U.S. cattle herd likely cut into profit margins which helped put a buffer on price growth towards the end of the year.
The past twelve months also posted healthy gains for local crop producers, with price growth witnessed for all three major local crops in 2015. A lower Canadian dollar again offered support to local producers by creating a favourable discount rate compared to the U.S. market. A lack of moisture likely hurt wheat production in 2015, while canola was adversely affected by the spring frost. In addition, rising global stockpiles and lower demand kept a lid on further price growth over the past year.
Agriweek.com. Century Publishing, 14 Mar. 2016. Web. 14 Mar. 2016. http://agriweek.com/.
ATB Financial. (8 Jan. 2016). Alberta Economic Outlook – Q1 2016. Retrieved from 14 Mar. 2016. http://www.atb.com/SiteCollectionDocuments/About/Alberta-Economic-Outlook-Q1-2016.pdf.
TD Economics. (6 Nov. 2015). Canadian Agriculture Sector: Prices Down, But Loonie Providing Some Offset. Retrieved from 14 Mar. 2016. https://www.td.com/document/PDF/economics/special/Canadian_Agriculture.pdf.
TD Economics. (22 Feb. 2016). Dollars & Sense. Retrieved from 14 Mar. 2016. https://www.td.com/document/PDF/economics/finances/DollarsAndSense_February2016.pdf.
Serecon Services Inc. (14 Sept 2014). Economic Impact of Agriculture in Lethbridge County.
Scotiabank. (Mar. 2016). Foreign Exchange Outlook. Retrieved from 14 Mar. 2016. http://www.gbm.scotiabank.com/English/bns_econ/fxout.pdf.
Statistics Canada. Table 002-0043 – Farm Product Prices, Crops and Livestock, Monthly (Dollars per Metric Tonne Unless Otherwise Noted), CANSIM. Web. 14 Mar. 2016.
Statistics Canada. Table 001-0010 – Estimates Areas, Yield, Production and Average Farm Price of Principal Field Crops, In Metric Units, Annual, CANSIM. Web. 14 Mar. 2016.
Canadian Forex. (n.d.). Yearly Average Exchange Rates for Currencies. Retrieved from 14 Mar. 2016. http://www.canadianforex.ca/forex-tools/historical-rate-tools/yearly-average-rates.
SOURCES

2015-2022 Lethbridge Community Outlook City of Lethbridge28
eConomIC ouTlook
2.3.2 Energy Markets (Oil and Gas)
Oil and gas play a central role in the Alberta economy, but have a substantially less significant impact on the Lethbridge market. That said, this sector is central to the health of the overall Alberta economy and its indirect impact can affect all provincial jurisdictions in a multitude of ways.
HIGHLIGHTS• Oil averaged $49 a barrel in 2015, down from $93 in
2014• It is projected to average $35-$42 a barrel over the
course of 2016• Oil prices could potentially rise as high as $45-$55 a
barrel by the end of 2016
After averaging $93 a barrel over the course of 2014, oil prices plunged in 2015 and averaged just $49. The net effect of this reduction on the Alberta economy was severe. Provincial unemployment averaged 6.0% in 2015, which was up from 4.7% the year prior and the overall economy contracted by 0.3%-2.3%, which followed growth of 4.8% in 2014. The government deficit will be higher than projected and overall wages have fallen on a year-over-year basis.
Analysts expect more of the same this year, with oil projected to average between $35-$42 a barrel in 2016. Global supply continues to outpace demand and a price increase at this point hinges on production cuts. Some analysts think this will happen towards the end of the year, as both OPEC (Nigeria, Venezuela) and non-OPEC (U.S.) producers pullback due to cost overages and lack of investment. These projections mean prices will continue to be unprofitable for many provincial entities, which could result in a sustained downturn for both oil-dependent cities and government revenues.
This scenario described could have divergent effects in Lethbridge. The energy sector does not have a direct impact on the local economy, so heightened unemployment as a result of the current cost environment is not a major concern. The downturn might actually have some positive effects on local industry, as labour might be more accessible for manufacturing and industrial companies. Lower wages should also help Lethbridge businesses, many of which struggled to compete with booming oil and gas salaries. There is the potential to attain positive attention as well, due to the diversified economic conditions that prevail in the area. This could attract accolades in a province that is seeking positive examples of regions that are thriving in the downturn.
The downside to the slide in oil prices is that it could crimp government finances and the fallout from this might put pressure on public sector employment. Lethbridge is somewhat dependent on public sector employment so any job losses could have adverse effects on the labour market. However, the Alberta government has indicated a commitment to the public sector, so any effects will likely be relatively muted in comparison to the changes that have afflicted the broader private sector.
It is also worth noting that while the Lethbridge economy does not depend directly on the energy sector, there are companies whose bottom line might be affected indirectly. The downturn in oil prices could have effects on local metal and mobile home manufacturing activity who have exposure to oil and gas.
SUMMARYOil prices averaged $49 a barrel over the course of 2015, down significantly from 2014 when the average price was $93 a barrel. Lower prices are expected to hold up for the duration of 2016, although prices could witness an uptick towards the end of the year. It is too early to say how this will ultimately impact the Lethbridge economy, but lower oil prices could lead to more accessible labour and lower wage inflation for local employers. On the other hand, the slide in prices could adversely affect government finances, the result of which could ultimately spillover to the local public sector workforce.
$0 $20 $40 $60 $80 $100
2014
2015
Average Oil Prices - Alberta
$49
$93
2015-2022 Lethbridge Community OutlookCity of Lethbridge
Header
29
eConomIC ouTlook
ATB Financial, Economics & Research. (11 Jan. 2016). Alberta Economic Outlook – Q1 2016. Retrieved from 13. Mar. 2016. https://www.atb.com/SiteCollectionDocuments/About/Alberta-Economic-Outlook-Q1-2016.pdf.
TD Economics. (19 Feb. 2016). Commodity Price Report. Retrieved from 13 Mar. 2016. https://www.td.com/document/PDF/economics/commodity/commodity_feb2016.pdf.
Scotiabank. (2 Mar. 2016). Global Forecast Update. Retrieved from 13 Mar. 2016. http://www.gbm.scotiabank.com/English/bns_econ/forecast.pdf.
BMO Capital Markets. (Feb. 2016). The Goods. Retrieved from 13 Mar. 2016. http://www.bmonesbittburns.com/economics/goods/201602/goods.pdf.
SOURCES

2015-2022 Lethbridge Community Outlook City of Lethbridge30
eConomIC ouTlook
2.3.3 Public Sector
Public sector employment has been the stabilizing force behind the Lethbridge economy over the years. It tends to experience less turnover than the private sector and pays competitive wages which serve as a catalyst for other secondary industry. Nine of the ten largest employers in Lethbridge are public sector or not-for-profit (NFP) organizations, which further solidifies the important role these institutions play in shaping the local labour market.
HIGHLIGHTS• As of 2015, there were 13 public sector/not-for-profit
(NFP) major employers in Lethbridge with a total of 14,169 staff
• This represents a 7% increase from 2013 and a 49% jump from 2006
• Public sector employment in Alberta increased by 12% and 28% over the same time periods
• Of the 13 public sector major employers, only one reduced its staff number over the past two years
The figures for public sector employees in Lethbridge are from the Major Employers Survey which is tabulated on a biennial basis by Economic Development Lethbridge. The results of the 2015 survey show that there are 13 public sector/not-for-profit (NFP) major employers in the city with a combined staff total of 14,169. This is up 7% from 2013 and 49% from 2006, which is the closest data we have to offering a ten-year comparative. To contrast, the Alberta public sector increased in size by 12% in the two-year timespan between December 2013 and 2015, and experienced gains of 28% between December 2006 and 2015. These comparatives suggest that the expansion of the public sector in Lethbridge has not exceeded the provincial benchmark over the past few years, but has been an outsized source of employment growth over the past decade.
Employment data from Alberta Health Services and the University of Lethbridge augment the importance of the public sector in the city. As these two institutions have been the largest employers in Lethbridge since 2006. Alberta Health Services has increased its number of employees by
64% since that time, while the University of Lethbridge has witnessed a 41% jump in its staff count. The net result of this has been an additional 1,912 jobs here in Lethbridge.
The 2014 Conference Board of Canada Mid-Sized Cities Outlook indicates that public administration in Lethbridge accounts for 4.5% of GDP. The figure is down by 0.2% on a year-over-year basis and represents a reduction of 0.6% from the 2009-2013 five-year average of 5.1%. It should be noted that these figures do not include contributions from health care and education. That said, it is interesting to note that output from other public services appear to be receding in recent years.
SUMMARYThe public sector continues to have a stabilizing effect on the local economy as demonstrated by the most recent Major Employers Survey, which indicates that nine of the ten largest employers in the city are in the public sector. Public sector major employers in Lethbridge have increased their head count by 7% since 2013, representing a healthy increase in employment over this timespan. Employment data from Alberta Health Services and the University of Lethbridge indicate substantial increases in employee totals since 2006, speaking to the important role these institutions play in the local labour market.
Economic Development Lethbridge. (25 Feb. 2016). 2015 Major Employer Survey. Retrieved from http://www.chooselethbridge.ca/charts/D.31.a_2016.pdf
Conference Board of Canada. (30 June 2015). 2015 Mid-Sized Cities Outlook.
SOURCES
Lethbridge GDP by Sector
0%
20%
40%
60%
80%
100%
201420132012201120102009Public AdministrationPersonal ServicesBusiness ServicesNon-Commercial ServicesFinance, Insurance, Real EstateWholesale & Retail Trade
Information & Cultural IndustriesTransportation & WarehousingManufacturingConstructionPrimary & Utilities

2015-2022 Lethbridge Community OutlookCity of Lethbridge 31
eConomIC ouTlook
2.3.4 Development SectorHIGHLIGHTS• Over the past decade, there has been a decline in land
area consumed for residential growth• The average lots size has shrunk by 100 sq. meters over
the past 25 years• The number of permits issued for greenfield
development have remained stable• Two story homes are the most popular type of new
development representing 23% of new single family homes.
• 2015 office vacancy is reported at 14.8% and junior department store vacancy at 15.9%
LETHBRIDGE DEVELOPMENT HISTORYLethbridge originally developed as a tiny coal mining settlement known as “Coalbanks” in the 1880’s, with development predominantly taking place in the river valley next to the mining operations. This original development is all but gone and the development that we are familiar with today dates back to 1885. Early Lethbridge housing development spread out from the core with housing for the more affluent located to the south and housing for poorer segments of the population was left to the land adjacent to industry and railways.
The first dozen years of the 20th century constituted a period of unparalleled prosperity for Lethbridge. The Canadian economy saw strong growth from 1896 to 1913 in a period known as the wheat boom.1 The population rose approximately 36% per year from 2,072 in 1901 to 11,070 in 1913.
Growth in Lethbridge would slow drastically from the onset of World War I in 1914 and throughout the Great Depression in the 1930s. Swift expansion of the city would not occur until after World War II. Post World War II was a period of strong growth for the Canadian economy and Lethbridge grew substantially. For the first 15 years after the war, housing development increased substantially across Canada with the housing stock rose by nearly 50%.2 Lethbridge was no exception, adding a significant amount of housing as new developments in both South and North Lethbridge begun.
By the 1960’s the “golden era” of development came to an end. Inflation across Canada rose into the double digits and as a result, the economy slowed down, unemployment rose, and development stalled.3 This short lived “bust” was quickly followed by an oil boom beginning in the 1970s. Growth and development were spurred by the decision to build the university campus in West Lethbridge.
This boom came to an abrupt end in the mid-1980s as world oil prices dropped severely.4 Again, this bust was short lived as Alberta soon saw a recovery beginning in the 1990s with the increasing price of oil. Lethbridge followed suit, growing steadily until the market turmoil of the late 2000s. Recent development in Lethbridge has followed a pattern of primarily low-density development taking place on the edge of the city. A development model that has emphasized choice and has seen growth on 11 fronts in the West, North, and South sides of the city.
Single Family Homes (Year Built)
0
50
100
150
200
250
300
350
400
450
Res
iden
tial S
truc
ture
s
Single Family Homes (Year Built)
North
SouthWest
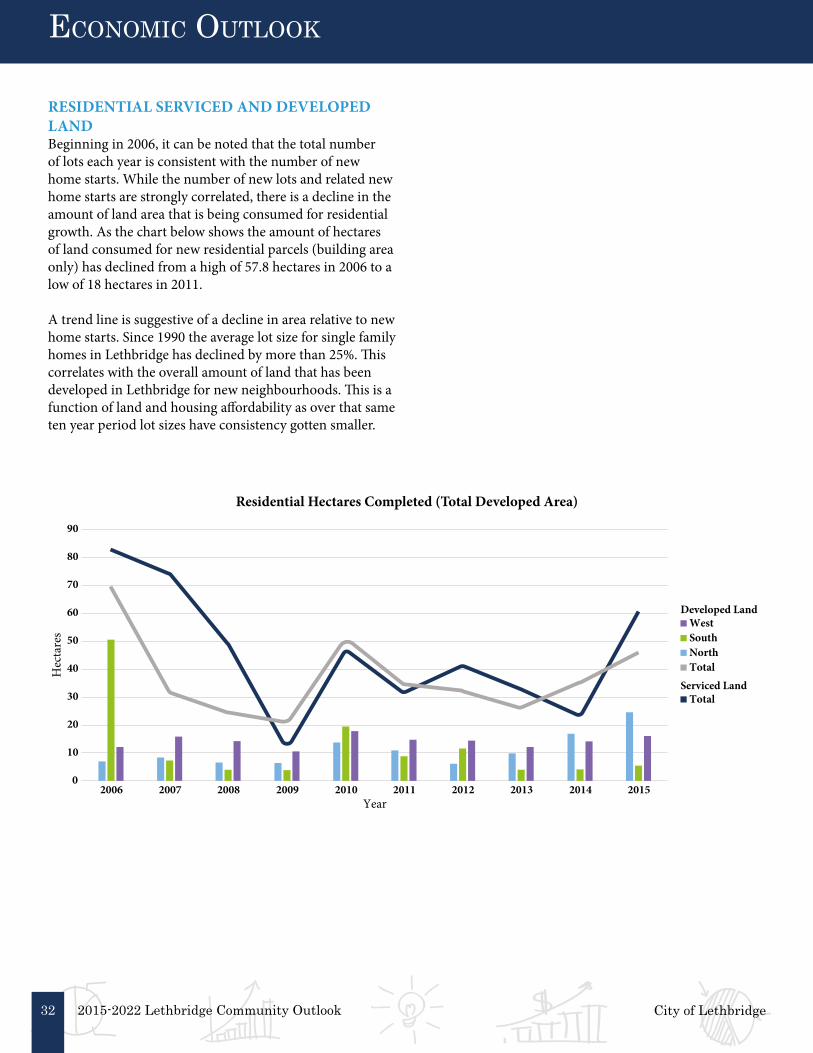
2015-2022 Lethbridge Community Outlook City of Lethbridge32
eConomIC ouTlook
RESIDENTIAL SERVICED AND DEVELOPED LANDBeginning in 2006, it can be noted that the total number of lots each year is consistent with the number of new home starts. While the number of new lots and related new home starts are strongly correlated, there is a decline in the amount of land area that is being consumed for residential growth. As the chart below shows the amount of hectares of land consumed for new residential parcels (building area only) has declined from a high of 57.8 hectares in 2006 to a low of 18 hectares in 2011.
A trend line is suggestive of a decline in area relative to new home starts. Since 1990 the average lot size for single family homes in Lethbridge has declined by more than 25%. This correlates with the overall amount of land that has been developed in Lethbridge for new neighbourhoods. This is a function of land and housing affordability as over that same ten year period lot sizes have consistency gotten smaller.
0
10
20
30
40
50
60
70
80
90
2006 2007 2008 2009 2010 2011 2012 2013 2014 2015
Hec
tare
s
Year
Residential Hectares Completed
NorthSouthWest
Total
TotalServiced Land
Developed Land
Residential Hectares Completed (Total Developed Area)

2015-2022 Lethbridge Community OutlookCity of Lethbridge 33
RESIDENTIAL LOT SIZEResidential lot sizes have shown a clear decline over the past quarter century. Residential lot sizes which averaged over 600 square meters in the early 1990s find themselves below the 500 sq. meter for the majority of the last decade. This reduction in land consumption per lot may be driven by several factors including land and infrastructure costs associated with greenfield development. When observing the average lot size of development in Lethbridge over the past century sub 500 square meter development periods were often during times of economic decline until a persistent decline beginning in the early 1990s.
eConomIC ouTlook
Average Residential Lot Size (Starting 1900)
400
500
600
700
Sq. M
eter
s
Year
Average Residential Lot Size
400
500
600
700
Sq. M
eter
s
Year
Average Residential Lot Size(Previous 25 Years)Average Residential Lot Size (Previous 25 Years)

2015-2022 Lethbridge Community Outlook City of Lethbridge34
HOUSING STARTSThe majority of development in the corporate boundaries of the City of Lethbridge takes place in “greenfield” locations. Greenfield development is the creation of new planned communities in areas that were previously undeveloped or developed for agricultural purposes.
Over time it can be noted that the number of permits issued for various types of greenfield development have remained relatively stable in the City. This is in part due to the diversity of the local economy based in education, government and agriculture. Between 2006 and 2015 the number of housing permits issued has ranged from a low of 394 in 2011 to a high of 793 in 2007.
The years 2006 and 2007 represent the height of the building boom in Lethbridge. Typically the range of permits issued in Lethbridge for new home construction is in the realm of 500 per year. A specific cycle or pattern is difficult to discern in these numbers. However, there is a relatively direct correlation to the number of new lots added to the annual inventory with the number of permits issued.
eConomIC ouTlook
Residential Home Starts
0
100
200
300
400
500
600
700
800
2015201420132012201120102009200820072006
South WestNorth Total
Res
iden
tial P
erm
its Is
sued
Residential Completions
0
100
200
300
400
500
600
700
800
2015201420132012201120102009200820072006
South WestNorth Total
Res
iden
tial P
erm
its C
ompl
eted

2015-2022 Lethbridge Community OutlookCity of Lethbridge
Header
35
eConomIC ouTlook
HOUSING TYPESThe distribution of housing types varies significantly across the three main sectors (West, North, and South). Older development areas such as the North and South sections of Lethbridge have a substantial number of bungalow dwellings. However, West Lethbridge which was not developed until the 1970s consists of mostly split entry homes. Growth on the North and South sectors over the past 5 years has been fairly limited in comparison to the West section of the city. However, a majority of new development in these sectors consists of two story and split entry homes. In particular, it has been observed that two story homes have shown the greatest amount of growth with approximately 155 new dwellings added every year representing 23% of the new developments in Lethbridge. Split entries follow closely behind with a 19% share of the growth observed.
When examining the share of residential dwelling units added over this 5 year period. Detached single family homes have greatly outpaced other living accommodations within the city. In 2012 there was a notable increase in apartment and rental units made available as the University opened up a new residence for students. However, there has been minimal development of apartments and rental units since. In a typical year, multi-family developments represent approximate 23% of dwelling units created. A dwelling unit is defined as an individual suite, apartment, or condo unit within a multifamily structure.
Share of Residential Dwelling Unit Growth by Housing Classification
72%
27%
1%
93%
7%0%
0%
10%
20%
30%
40%
50%
60%
70%
80%
90%
100%
2012 2013 2014 2015
Single Family HomeMulti-Family and Condo Dwelling UnitsApartment and Rental Units
55%
36%
10%
50%
22%
28%

2015-2022 Lethbridge Community Outlook City of Lethbridge36
INFILL DEVELOPMENTInfill development represents a very small portion of the new home starts in Lethbridge. Over the past decade there has been a minor increase in the number of infill permits applied for.
0
5
10
15
20
25
30
2006 2007 2008 2009 2010 2011 2012 2013 2014 2015
In�l
l New
Hom
e St
arts
Infill Development
SouthNorth Total
Infill Development
eConomIC ouTlook
Number of Residential Single-Family Home in Lethbridge by Type and Location
Nor
th
20112012201320142015
Sout
h
20112012201320142015
Wes
t
20112012201320142015
Bungalow
Split Entry
Two Story
Mobile Home
Bungalow
Split Entry
Bungalow
Split Entry
0 500 1,000 1,500 2,000 2,500 3,000 3,500 4,000 4,500 5,000 5,500 6,000
0 500 1,000 1,500 2,000 2,500 3,000 3,500 4,000 4,500 5,000 5,500 6,000
0 500 1,000 1,500 2,000 2,500 3,000 3,500 4,000 4,500 5,000 5,500 6,000
Two Story
Mobile Home
Two Story
Mobile Home
Housing Type Distribution by Sector

2015-2022 Lethbridge Community OutlookCity of Lethbridge
Header
37
NON-RESIDENTIAL ACTIVITYDowntown Lethbridge is home to both hi-rise office properties and department stores. Inventories at the end of 2015 include 560,821 square feet of office space and 1,011,6464 square feet of junior department store space. The market has remained relatively flat at this level of inventory over the past three decades.
While inventory levels have remained flat, the number of vacant properties have grown and 2015 vacancy rates are at the highest level of the past three years, with office vacancy reported at 14.8% and junior department stores at 15.9%.
SUMMARYLethbridge continues to maintain a stable development environment and has not seen dramatic declines in construction. 2016 saw an increase in the total development value primarily driven by Government & Institutional investments in the region. That said, the weak performance in oil markets that began in 2014 may result in a dampening effect in Lethbridge for 2017.
eConomIC ouTlook
Downtown Hi-Rise Office Vacancy Rate
0%
3%
6%
9%
12%
15%
201520142013
13.7% 13.3%
14.8%
Junior Department Store Vacancy Rate
0%
5%
10%
15%
20%
201520142013
2.0%
10.0%
15.9%
1 McInnis, M. (n.d.). Canadian Economic Development in the Wheat Boom Era: A Reassessment. Retrieved from Queen’s University.
2&3 Slater, D. W. (n.d.). Setting the Scene: The Post-WWII Canadian Economy.
4 CBC. (n.d.). Boom and Bust in Alberta. Retrieved from CBC History: http://www.cbc.ca/history/EPISCONTENTSE1EP17CH3PA1LE.html
Johnston, Alex and den Otter, Andy A. Dempsey, Hugh A., Editor. Lethbridge Centennial History. City of Lethbridge and Whoop-up Country Chapter Historical Society. Lethbridge, Alberta. 1985
SOURCES

2015-2022 Lethbridge Community Outlook City of Lethbridge38
2.4 Economic Forecasts2.4.1 Population Forecasts
2015 MUNICIPAL CENSUS RESULTS AND CURRENT CONDITIONS In 2015, the total population of Lethbridge derived from the annual municipal census was 94,804. This represented an overall growth rate of 1.94% from 2014 and an average annual growth rate of 1.82% over the previous twenty-one years (since 1994).
West Lethbridge is the largest of the three sectors of the city (the others being North and South), with a population of 36,716. It has enjoyed most of the city’s growth since it was initially developed in the early 1970’s and there is a number of neighbourhoods that are currently under development in this sector. North Lethbridge has seen a steady pace of growth in previous years and currently has a population of 26,751. The residential communities of Blackwolf and Legacy Ridge are currently under development in North Lethbridge.
South Lethbridge has a population of 31,337 and over the past few years has had a relatively slow rate of growth; even experiencing small population decreases in some years. This can be attributed to the fact that there are currently few areas for new residential expansion in South Lethbridge, as the South Gate neighbourhood is nearly entirely developed and the remaining utility servicing capacity is limited in this area. The Arbour Ridge and South Ridge/Sandstone communities, located south of Six Mile Coulee, cater to the upper, luxury end of the local housing market. The luxury housing market is relatively small in Lethbridge, so growth in these two communities has been slow.
This total population was further broken down into age cohorts of 5 years. The impact of Lethbridge’s two post-secondary institutions is evident when these cohorts are considered, as the 20-24 year old cohort is the largest age cohort consisting of just over 10,000 people. In contrast the age cohorts that are above 24 years old comprise smaller portions of the population. This phenomenon is consistent throughout censuses that have been conducted in the past as well, suggesting that students move here, are educated in their early twenties and then move elsewhere when their education is complete.
eConomIC ouTlook
Female Male
7,000 6,000 5,000 4,000 3,000 2,000 1,000 0 1,000 2,000 3,000 4,000 5,000 6,000 7,0000-45-9
10-1415-1920-2425-2930-3435-3940-4445-4950-5455-5960-6465-6970-7475-7980-84
85+
2015 Lethbridge Population

2015-2022 Lethbridge Community OutlookCity of Lethbridge 39
eConomIC ouTlook
As shown in the graph below, the 15-19 year old and 20-24 year old cohorts also make up a relatively large proportion of the total population of West Lethbridge with these cohorts forming 8.5% and 15.4% of the total population, respectively. The proportion of the 20-24 year old cohort in West Lethbridge is approximately double that found in the North and South sectors of the City (7.4% and 8.3%). This can be attributed to the University of Lethbridge being located in West Lethbridge and a large number of students living near the campus.
West Lethbridge also has a greater proportion of its population under the age of 15, with approximately 19% of its population in this age group. South Lethbridge has the smallest proportion of children with 13% of its total population in this age group. On the other end of the spectrum, South Lethbridge has a greater proportion of residents who are 60 years of age and older than the other two sectors of the City. Approximately 30% of the total population of South Lethbridge is 60 years of age and older while this same age group forms just over 20% of the population of North Lethbridge and only 12% of the population of West Lethbridge. In addition to students, West Lethbridge also contains a large number of young families, which contrasts to South Lethbridge which contains a greater share of senior citizens. An older population accompanied with there being few new residential development areas accounts for the slow pace of South Lethbridge growth and the comparatively rapid pace of West Lethbridge growth.
2022 POPULATION PROJECTIONDespite the recent economic troubles in Alberta leading to decreased population growth in many centres, over the course of this Outlook, Lethbridge’s overall population is expected to maintain a steady rate of growth. This was also observed during the previous provincial economic downturn in 2009. Based on an average annual growth rate of 1.9%, Lethbridge is expected to reach the milestone population of 100,000, by the year 2018 or 2019. By the year 2022- the extent of this Outlook - the population of Lethbridge is expected to further expand to a population of just over 108,000.
In 2022, West Lethbridge will continue to capture a majority of city-wide growth with its population increasing by approximately 8,500 people to 45,224. North Lethbridge will continue to grow and is expected to achieve a population of 29,923. South Lethbridge will continue its trajectory of slow growth, increasing by a population of almost 1,700 to 33,024.
SouthWestNorth
0% 2% 4% 6% 8% 10% 12% 14% 16%
0-4
5-9
10-14
15-19
20-24
25-29
30-34
35-39
40-44
45-49
50-54
55-59
60-64
65-69
70-74
75-79
80-84
85+
2015 Age Proportion by Sector
Lethbridge Population Projection
City Sector
2015 Total
2018 2022Projection
North 26,751 28,436 29,927South 31,337 32,077 33,021West 36,716 39,369 45,219Total 94,804 99,882 108,167

2015-2022 Lethbridge Community Outlook City of Lethbridge40
As the outlook to the year 2022 is in the relative short term, the age composition of each sector of the City is not expected to change very much. Due to a continual supply of students attending the University and College the high proportion of 20-24 year olds living in West Lethbridge, and to a smaller extent South Lethbridge, is expected to remain relatively high. Overall, the proportion of those 60 years of age and older was anticipated to increase by a small amount, increasing by 1.5% of the total population to 21.8%. West Lethbridge is not exempt to an aging population either, as it is expected to see a small uptick of 1.5% in its population that is aged 60 and over to 13.8% of its total population. This is due to the nationwide trend of an aging population, however on a local level this trend is dampened by a few events that have occurred in the past few years. These
developments have increased the relative number of young people in Lethbridge and include provincial migration, immigration and a relatively high birth rate.
When compared to other areas of the city, West Lethbridge will also continue to see a higher proportion of its population being children under 14 years of age and under, with this age group forming 19% of its population. North and South Lethbridge will have 17% and 13% of their populations being 14 years of age and under.
SUMMARYIn contrast to many areas in the rest of Alberta, Lethbridge has a relatively stable population with an annual growth rate that does not often exceed 2% and does not often dip below 1.5%.
West Lethbridge is expected to continue to capture a majority of the city’s future growth, due to the availably of new, serviced and developable residential land in this sector of the city. It is expected that North and South Lethbridge will continue to split the remaining city-wide growth. While South Lethbridge is expected to have very low growth in
eConomIC ouTlook
Female Male
7,000 6,000 5,000 4,000 3,000 2,000 1,000 0 1,000 2,000 3,000 4,000 5,000 6,000 7,0000-45-9
10-1415-1920-2425-2930-3435-3940-4445-4950-5455-5960-6465-6970-7475-7980-84
85+
2022 Lethbridge Population Projection
Anticipated % Share of Total City Population Growth2015-2022
City Sector
%
North 23.9%South 12.5%West 63.6%

2015-2022 Lethbridge Community OutlookCity of Lethbridge 41
eConomIC ouTlook
the short term future, beyond 2022 it is expected that it will grab a larger share of the city’s overall growth, due to additional residential land in the southeast corner of the city that will come online once additional utility servicing to this area is constructed. As can be expected in areas where there is a large amount of new development, West Lethbridge will continue to have a higher proportion of young families with children than other areas of the city.
The out-migration of recent graduates that are in their mid to late twenties that has been experienced in the past is expected to continue into the foreseeable future. This phenomenon should be followed closely, as it illustrates an exodus where students who become highly trained and qualified at Lethbridge’s post-secondary institutions are finding opportunities in other municipalities and are choosing to move away after their post-secondary education is complete. These people are likely to work in relatively high-paying, skilled jobs or will open start-up ventures. Much of this loss is due to the relative close proximity of the much large centres of Calgary and Edmonton which have more amenities to offer and a broader array of employment and capital opportunities. Lethbridge is at a disadvantage in this regard and will likely always experience some type of loss of these recent graduates to these larger centres, no matter what measures are put in place. However, this outflow can be decreased as the city continues to grow. It is also possible for Lethbridge to attract some graduates from these larger centres, as this flow of talent does go both ways. The City of Lethbridge should make a concerted effort to try and retain many of these recent graduates and attract graduates from elsewhere. This can include encouraging the establishment of technological industries that tend to provide well-paying careers and constructing amenities that offer an improved lifestyle and are attractive to both these types of industries and the people they employ.

2015-2022 Lethbridge Community Outlook City of Lethbridge42
eConomIC ouTlook
2.4.2 Employment Forecasts
2015 EMPLOYMENT ESTIMATE AND CURRENT CONDITIONSIn 2015, the total number of people employed within Lethbridge was estimated to be 44,713 with a ratio of employees to population of 0.47. To derive this estimate, employment data gathered from the 2011 federal census was obtained, as this was the last year that employment information was gathered. As an estimated number of employees for the baseline year of 2015 was needed, the annual growth in commercial and industrial square footage from 2012 -2015 was then obtained from the City of Lethbridge’s Taxation and Assessment department. An average ratio of the amount of square footage per employee was then applied to estimate the increase in employees after the 2011 census. For sectors that are not commercial or industrial, such as Educational Services or Healthcare and Social Services, the growth rate from previous years was used to estimate the baseline 2015 number of employees.
Overall, South Lethbridge contains the majority of employment in the City with 24,802 or 56% of all employees working in this sector of the city and North Lethbridge contains 15,785 or 35% of all employees. West Lethbridge is the largest sector of the City in terms of population, but is the smallest in terms of employment as only 4,126 or 9% of all employees work in West Lethbridge.
The total amount of employment was broken down into 20 different categories of employment, based upon the North American Industry Classification System (NAICS), which is the standard used by Statistics Canada. NAICS covers all forms of employment and includes category titles such as, Accommodation and Food Services, and Manufacturing. Within Lethbridge, the three largest employment categories were Retail (8,122), Healthcare and Social Services (6,766), and Accommodation and Food Services (4,189). All told, these three categories composed 42.7% of all employment in Lethbridge. The majority of jobs within these sectors were found in South Lethbridge, due to the fact that the downtown and the Mayor Magrath Drive commercial corridor are found in South Lethbridge, as is the City’s hospital. Most industrial type jobs such as those found in the Manufacturing, Transportation and Warehousing and Construction employment categories are found in North Lethbridge, as this is where the majority of the city’s industrial land is found.
Educational Services also employed a significant number of Lethbridge employees, being the fourth largest employment category with 4,067 employees. This category includes elementary and secondary school teachers as well as much of the staff employed at post-secondary institutions and South and West Lethbridge, where Lethbridge College and the University of Lethbridge are respectively located. South Lethbridge where Lethbridge College is located has 41% of the city’s total educational services staff, while West Lethbridge where the University of Lethbridge is located has 44%. The North sector of the City, which contains elementary, middle and high schools, but does not contain any major post-secondary institutions only has 15% of the of the city’s total educational services staff.
Mining and Oil and Gas Extraction has a relatively small business footprint in Lethbridge, with 118 employees who are employed in Lethbridge. This translates to 0.26% of all employment within the city. The relatively low number of oil, gas and mining employment highlights the fact that there are few energy companies located in Lethbridge and helps to explain why the recent downturn in oil prices has not had a large impact upon the local economy, when compared to the rest of the province. It must be noted that this figure does not represent the number of people who live in Lethbridge who work in this field, as industries classified as Mining and Oil and Gas Extraction are typically very mobile. Workers may choose to live in Lethbridge, but are employed in distant places such as Fort McMurray, the Elk Valley in B.C. or even foreign countries. While only a little over 100 jobs in this category exist in the City, just over 500 residents are employed in this category.

2015-2022 Lethbridge Community OutlookCity of Lethbridge 43
eConomIC ouTlook
SouthWestNorth
0% 20% 40% 60% 80% 100%
Accommodation and Food Services
Administrative/Support, Waste Mgmt./Remediation Services
Agriculture, Forestry, Fishing and Hunting
Arts, Entertainment and Recreation
Construction
Educational Services
Finance and Insurance
Healthcare and Social Services
Information and Cultural
Manufacturing
Mgmt. of Companies and Enterprises
Mining and Oil and Gas Extraction
Other Services
Professional, Scientific and Technical Services
Public Administration
Real Estate and Rental and Leasing
Retail
Transportation and Warehousing
Utilities
Wholesale Trade
2015 Proportion of Employment Category by Sector
Proportion % of Each Employment Category
Empl
oym
ent C
ateg
ory
(NA
ICS)

2015-2022 Lethbridge Community Outlook City of Lethbridge44
eConomIC ouTlook
2022 EMPLOYMENT PROJECTION By 2022 the total number of people employed within Lethbridge is expected to increase by just under 4,400 to a total of 49,096. This growth is expected to be spread amongst the different employment categories relatively evenly. When compared to the forecasted 2022 population of 108,171 this presents an employee to population ratio of 0.45, or roughly one job for every two residents, which is a slight decrease from 2015. The reason for this decrease is due to an aging population with more retirees living in Lethbridge who are no longer employed. This is not surprising as it is part of a larger, nation-wide trend.
While most employment categories are expected to see consistent growth, a small decrease in the Retail category was expected from 2015 to 2018. This was due to a recent number of mergers and closures of retail establishments, such as Safeway and Sobeys supermarkets. Despite this, it is expected that the Retail category will gain employment over the longer term. By 2022 an increase in the amount of retail floor space is anticipated in the local market, with the development of The Crossings and West Lethbridge Employment Centre underway at this time. It should also be noted this forecasted decrease between 2015 and 2018 is very small and it is entirely possible that retail employment growth will defy this forecast. In other words, the forecasted 2015-2018 decrease in employment is not significant enough to warrant any concern at this time.
South Lethbridge will still contain the majority of all employment within the city with 26,352 or 54% of all employees, followed by North Lethbridge with 16,743 or 34% of all employees. West Lethbridge will still contain a relatively small amount of the city’s overall employment, however between 2015 and 2022 it is expected to have the largest employment gain of any city sector. In large part this growth is due to employment in Education Services, as a major expansion to the University of Lethbridge is currently underway with a significant new building expected to open
on campus within the next few years. In addition, two new public schools are also currently under construction in West Lethbridge and will be open well before 2022.While Educational Services will still be the major form of employment in West Lethbridge and is expected to grow, other forms of employment will also increase in West Lethbridge. It is expected that retail employment will more than double from 393 in 2015 to almost 900 in 2022 as additional retail businesses open in West Lethbridge. Healthcare and Social Services were also expected to grow especially in South Lethbridge which was expected to add approximately 450 employees due in part to the nearly complete expansion of the Chinook Regional Hospital. SUMMARYUnlike much of the province, Lethbridge has a relatively small number of positions in the Mining and Oil and Gas Extraction employment category and has employment that is relatively diverse. As a result local employment prospects are expected to continue to be good within the next few years.
Other than the University campus, West Lethbridge does not contain much employment and will not for the near-term future. This presents a few problems, as West Lethbridge residents must commute to other areas of the city for their employment, shopping and lifestyle needs. This puts additional strain on the city’s infrastructure and decreases overall efficiencies. However, in recent years the City has undertaken measures to try and encourage more land uses that generate employment, such as approving the West Lethbridge Area Structure Plan and having a direct role in the development of The Crossings commercial area. In the short term, between now and 2022, it is expected that West Lethbridge’s employment growth will outpace that found in North and South Lethbridge.
In perspective of the recent provincial economic instability, Lethbridge’s employment diversity has served it well. The recent expansion to the Chinook Regional Hospital and the University of Lethbridge’s Destination Project are expected to have a significant impact upon employment within Lethbridge in the future and underscore the importance of the public sector to the local economy. While public sector employment is important within the local context, Lethbridge should continue to diversify its economy so that it becomes increasingly resilient, possibly encouraging investment in the technological industries or knowledge-based industries.
Lethbridge Employment Projection
City Sector
2015 Total
2018 2022Projection
North 15,785 15,976 16,743South 24,802 25,293 26,352West 4,126 4,710 6,002Total 44,713 45,979 49,096

2015-2022 Lethbridge Community OutlookCity of Lethbridge 45
2015 2018
0 2,000 4,000 6,000 8,000 10,000
2022
Number of Jobs
Accommodation and Food Services
Administrative/Support, Waste Mgmt./Remediation Services
Agriculture, Forestry, Fishing and Hunting
Arts, Entertainment and Recreation
Construction
Educational Services
Finance and Insurance
Healthcare and Social Services
Information and Cultural
Manufacturing
Mgmt. of Companies and Enterprises
Mining and Oil and Gas Extraction
Other Services
Professional, Scientific and Technical Services
Public Administration
Real Estate and Rental and Leasing
Retail
Transportation and Warehousing
Utilities
Wholesale Trade
eConomIC ouTlook
Projection of Employment by Category
Empl
oym
ent C
ateg
ory
(NA
ICS)

46 City of Lethbridge2015-2022 Lethbridge Community Outlook
ParT 3: soCIal ouTlook

2015-2022 Lethbridge Community OutlookCity of Lethbridge 47
3.1 Demographic ChangeBy 2041, Alberta is expected to be home to about 6 million people, representing an average annual growth rate of about 1.4%. This is quite a bit slower than the 2.0% experienced over the previous 25 year period (1990 to 2015). Alberta’s population is projected to surpass the 5 million mark by 2025, and reach the 6 million mark by 2041. Lethbridge remains lower in population growth in 2016 than provincial averages with a growth rate of 2.13% from 2015 and provincial growth rates for 2016 being 2.4%. (Alberta, 2016)
By 2022, the population in Lethbridge is anticipated to be at 108,167. This is based on a 1.9% increase each year between 2016 and 2022.
HIGHLIGHTS:• The projections in this report do not take into account
the 2016 fires in Fort McMurray and surrounding region and the influx of displaced residents to Lethbridge.
• Future population growth is mainly driven by migration, particularly international migration.
Looking forward at a population change requires that three components be considered: natural increase, domestic migration, and international migration.
While domestic migration surpassed natural increase as the driver to population growth during the peak years of economic activity in the Lethbridge region, natural increase contributed more to annual population growth in southwest Alberta over the entirety of the 1986 to 2010 period. Over the past two and a half decades natural increase added an average of 1,300 new residents to the Region each year (2,600 births and 1,300 deaths) while net domestic migration added an average of 309 people and net international added 426. (Urban Futures, 2014)
The current economic downturn will weigh on the province’s population growth in the short term, as outflows of some residents put a damper on net migration levels. Over the next five years, average annual growth is expected to be 1.3%, compared to 1.7% over the 2010 to 2015 period. A moderate recovery is expected and, between 2020 and 2022, the average annual gain in population is expected to climb to 1.6%. (Alberta, 2016)
For the period between 2015 and 2022, total net migration is projected to account for just under two-thirds of Alberta’s
population growth, with natural increase accounting for the remaining 37%. Of the anticipated net migrants, almost three-quarters would come from other parts of the world. In the near term, total net migration is expected to slow due to the economic slowdown, before picking up again as the economy improves. (Alberta, 2016)
International migration is a primary population growth driver with about 46% of the expected growth in the province’s population over the projection period will be due to international migration, representing a net gain of about 840,000 people. The addition of new residents from other countries will continue to add to the diversity of the province’s population. (Alberta, 2016)
Alberta remains attractive to interprovincial migrants and due to a slowdown in Alberta’s economy, net interprovincial migration softened in 2015 and is expected to weaken further, leading to net outflows in the first two years of the projection. A return to net inflows is expected as the economy improves. Net interprovincial migration will account for 17% of the growth, or around 300,000 new residents, between 2015 and 2041. (Alberta, 2016)
Males will continue to outnumber females as Alberta has consistently been home to more males than females due to the large proportion of males migrating to the province. This trend in the sex ratio (ratio of males to females) is expected to continue. Although the sex ratio of migrants is forecast to become more balanced over the projection period, the net migration inflows over the projection will tip the province’s overall sex ratio in favour of males. (Alberta, 2016)
SUMMARY:More people depend on the working age population. The number of working age Albertans (aged 15 to 64 years) is expected to grow under all scenarios, increasing from just over 2.9 million in 2015 to almost 3.9 million by 2041 under the medium scenario. However, as a share of the total population, this age group is anticipated to shrink, falling from 70% in 2015 to around 62% in 2025 (Alberta, 2016). Over the projection period, however, the sex ratio will decrease slightly with the aging of the large baby boom cohort into senior ages, in combination with the higher female life expectancies. The sex ratio in Alberta is expected to remain relatively stable at 103 to 104 males per 100 females, which should translate to a consistent sex ratio in Lethbridge.
soCIal ouTlook

2015-2022 Lethbridge Community Outlook City of Lethbridge48
soCIal ouTlook
3.1.1 Diversity
The population of Lethbridge has grown with the needs of the local economy. The concurrent demands for services also continues to grow at a sustainable rate. This population growth is above the national average and has been stable at an annual growth rate of 2% over the past 10 years and resulting in an estimated population of more than 120,000 by 2031. Integral with this growth is the evidence that Lethbridge is a culturally diverse city.
As of 2011, 12,420 immigrants were living in Lethbridge, an increase of 13% since 2006. The largest sub-groups of immigrants are from the United Kingdom, Netherlands, United States, Mexico and Germany. Commencing in 2009, Bhutanese refugees began immigrating to Lethbridge. This is the largest settlement of Bhutanese in Canada. In 2016, Lethbridge also welcomed an influx of new residents from Syria.
In 2011, 4.3% (4,370) of the population of Lethbridge had an Aboriginal identity. Of those, 55.0% (2,405) reported a First Nations identity only, 42.3% (1,850) reported a Métis identity only, and 0.9% (40) reported an Inuit identity only. An additional 45, or 1.0%, reported other Aboriginal identities and 35, or 0.8%, reported more than one Aboriginal identity (Statistics Canada, 2011).
Source: Statistics Canada, Community Profiles 2001 and 2011
HIGHLIGHTS:• The immigrant population makes up 12% of the
Lethbridge census agglomeration and has increased by 13% between 2006 and 2011.
• From an immigration perspective, citizens with Japanese ancestry accounted for the largest population of visible minorities (StatsCan,2011). Citizens of Chinese and South Asian ancestry account for the next highest population of visible minorities.
• The Lethbridge Aboriginal population as reported by Statistics Canada was 4,370 in 2011, a slight increase in urban population since 2006 (Statistics Canada, 2013d). This included self- identified First Nations, Inuit and Metis community members.
• Anecdotally it is known the population and related demographics have changed over the past 5 years. However, the lack of data limits the accuracy of the current conditions and the ability to forecast the Social Outlook. This includes data from StatsCan and related sources.
• Lethbridge is one of the top 10 Cities in Canada to settle new Canadians (Immigration Canada)
FIRST NATIONS, INUIT AND METISLethbridge is bordered to the west by the Blood Tribe Reserve. The Blood (Kainai) Nation, is the largest reserve in Canada, with an area of over 540 square miles, with a population of 12,800 (2015) members. (Blood Tribe, 2016)
0
500
1,000
1,500
2,000
Popu
latio
n
20112001
Ethno-Cultural Characteristics of Lethbridge
KoreanBlack
ChineseJapanese
Filipino
Latin American
South Asian
Southeast Asian
Arab & West Asian
Other
Ethno-Cultural Group
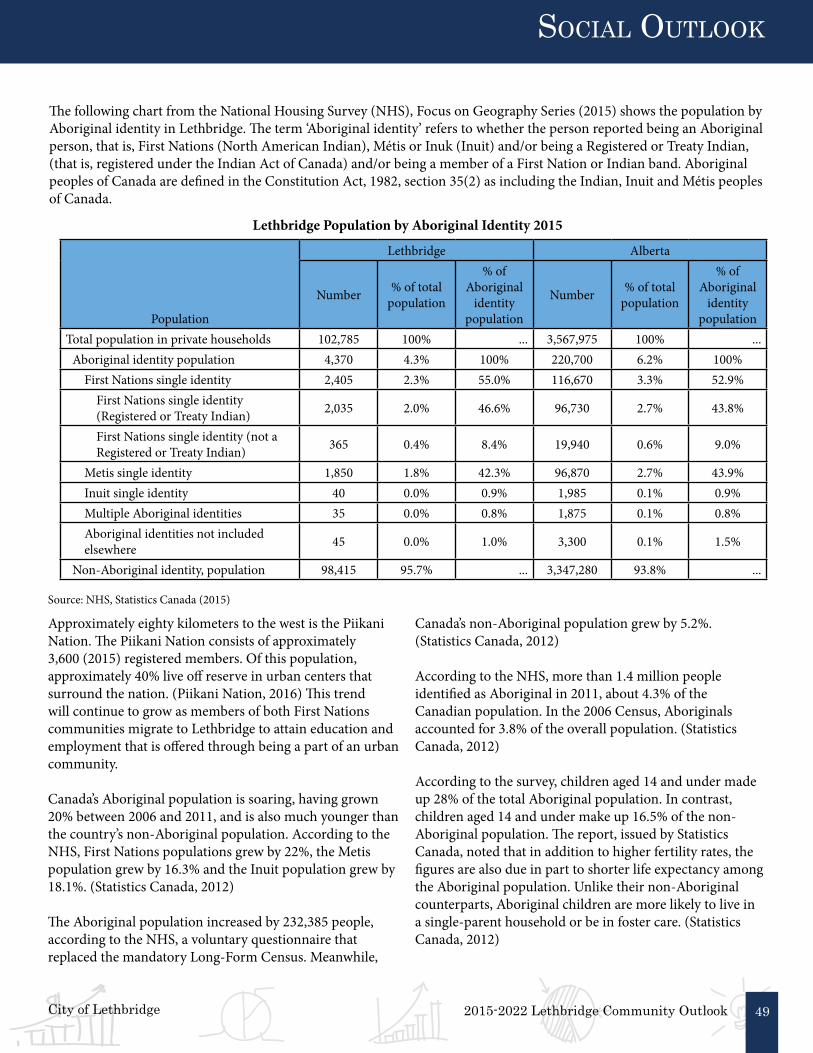
2015-2022 Lethbridge Community OutlookCity of Lethbridge 49
soCIal ouTlook
Approximately eighty kilometers to the west is the Piikani Nation. The Piikani Nation consists of approximately 3,600 (2015) registered members. Of this population, approximately 40% live off reserve in urban centers that surround the nation. (Piikani Nation, 2016) This trend will continue to grow as members of both First Nations communities migrate to Lethbridge to attain education and employment that is offered through being a part of an urban community.
Canada’s Aboriginal population is soaring, having grown 20% between 2006 and 2011, and is also much younger than the country’s non-Aboriginal population. According to the NHS, First Nations populations grew by 22%, the Metis population grew by 16.3% and the Inuit population grew by 18.1%. (Statistics Canada, 2012)
The Aboriginal population increased by 232,385 people, according to the NHS, a voluntary questionnaire that replaced the mandatory Long-Form Census. Meanwhile,
Canada’s non-Aboriginal population grew by 5.2%. (Statistics Canada, 2012)
According to the NHS, more than 1.4 million people identified as Aboriginal in 2011, about 4.3% of the Canadian population. In the 2006 Census, Aboriginals accounted for 3.8% of the overall population. (Statistics Canada, 2012)
According to the survey, children aged 14 and under made up 28% of the total Aboriginal population. In contrast, children aged 14 and under make up 16.5% of the non-Aboriginal population. The report, issued by Statistics Canada, noted that in addition to higher fertility rates, the figures are also due in part to shorter life expectancy among the Aboriginal population. Unlike their non-Aboriginal counterparts, Aboriginal children are more likely to live in a single-parent household or be in foster care. (Statistics Canada, 2012)
The following chart from the National Housing Survey (NHS), Focus on Geography Series (2015) shows the population by Aboriginal identity in Lethbridge. The term ‘Aboriginal identity’ refers to whether the person reported being an Aboriginal person, that is, First Nations (North American Indian), Métis or Inuk (Inuit) and/or being a Registered or Treaty Indian, (that is, registered under the Indian Act of Canada) and/or being a member of a First Nation or Indian band. Aboriginal peoples of Canada are defined in the Constitution Act, 1982, section 35(2) as including the Indian, Inuit and Métis peoples of Canada.
Population
Lethbridge Alberta
Number % of total population
% of Aboriginal
identity population
Number % of total population
% of Aboriginal
identity population
Total population in private households 102,785 100% ... 3,567,975 100% ...Aboriginal identity population 4,370 4.3% 100% 220,700 6.2% 100%
First Nations single identity 2,405 2.3% 55.0% 116,670 3.3% 52.9%First Nations single identity (Registered or Treaty Indian) 2,035 2.0% 46.6% 96,730 2.7% 43.8%
First Nations single identity (not a Registered or Treaty Indian) 365 0.4% 8.4% 19,940 0.6% 9.0%
Metis single identity 1,850 1.8% 42.3% 96,870 2.7% 43.9%Inuit single identity 40 0.0% 0.9% 1,985 0.1% 0.9%Multiple Aboriginal identities 35 0.0% 0.8% 1,875 0.1% 0.8%Aboriginal identities not included elsewhere 45 0.0% 1.0% 3,300 0.1% 1.5%
Non-Aboriginal identity, population 98,415 95.7% ... 3,347,280 93.8% ...
Lethbridge Population by Aboriginal Identity 2015
Source: NHS, Statistics Canada (2015)

2015-2022 Lethbridge Community Outlook City of Lethbridge50
soCIal ouTlook
The NHS data reveal that nearly one-half of Aboriginal children aged 14 and under live in a two-parent home, compared to three-quarters of non-Aboriginal children. About 34% of Aboriginal children live in a single-parent home, compared to just over 17 per cent of non-Aboriginal children. Of children aged 14 and under in foster care, nearly half, 48.1%, were Aboriginal. (Statistics Canada, 2012)
IMMIGRANTS AND ETHNIC ORIGINSAccording to the recent National Household Survey, immigrants represented 12% of the city’s population in 2011—significantly less than the 20% of the Albertan population and the 22% of the Canadian population that were born in other countries. Immigration to Lethbridge in recent years (since 2001) has been lower than what has been seen both provincially and nationally. Of those immigrants living in Lethbridge, almost 61% immigrated to Canada before 2000—a much higher proportion than in Alberta (55%), but still lower than the 65% share seen Canada-wide. (Urban Futures, 2014) Lethbridge is identified as one often preferred settlement cities. (Immigration Canada)
The non-permanent resident population—those people who are living in the Lethbridge temporarily, as they hold work or study visas—accounted for a slightly lesser proportion of the population (1.5%) than the province’s population (1.7%), but more than Canada’s population (1.1%). (Urban Futures, 2014)
The following figure shows the percentage of Canadian born (non-immigrants), foreign born (immigrants) and non-permanent residents in Lethbridge in 2011:
Source: Figure 1 Percentage of Canadian born (non-immigrants), foreign born (immigrants) and non-permanent residents in Lethbridge (CA) (NHS, Statistics Canada, 2015)
The most common countries of birth of immigrants living in Lethbridge were: United Kingdom (accounting for 15.9% of the immigrant population in Lethbridge) and Netherlands (12.3%). In comparison, the top countries of birth of immigrants living in Alberta were: Philippines (accounting for 10.8% of the immigrant population in Alberta), and India (9.2%). (Statistics Canada, 2015)
In 2011, among Lethbridge’s immigrant population, 73.8% spoke English and/or French most often at home. Meanwhile, the three most frequently reported non-official languages spoken most often at home by immigrants in Lethbridge were German, Spanish and Chinese, n.o.s.. This compared to the top three non-official languages for immigrants in Alberta, which were Tagalog (Pilipino, Filipino), Panjabi (Punjabi) and Chinese. (Statistics Canada, 2015)
RELIGIONAccording to the 2011 NHS, 69.0% of the population in the Lethbridge reported a religious affiliation, while 31.0% said they had no religious affiliation. For Alberta as a whole, 68.4% of the population reported a religious affiliation, while 31.6% had no religious affiliation. (Statistics Canada, 2015)
The most frequently reported religious affiliation in Lethbridge was Roman Catholic, reported by 19,920 (19.4%) of the population. Other frequently reported religions included: United Church (9.0%) and Christian (8.5%). In comparison, the top three most frequently reported religions in Alberta were: Roman Catholic (reported by 23.8% of the population of Alberta), United Church (7.5%) and Christian. (7.2%). (Statistics Canada, 2015)
LESBIAN, GAY, BISEXUAL, TRANSGENDER, TWO-SPIRIT, AND QUEER COMMUNITY There is a growing identification of the lesbian, gay, bisexual, transgender, two-spirit, and queer (LGBTTQ) community in Lethbridge. Self- identification has been supported through organizations like The OUTreach Southern Alberta Society, Lethbridge Pride Fest events and community activities in part with the City of Lethbridge, Coalition of Municipalities Against Racism and Discrimination (CMARD), YWCA and Boys and Girls Club, Lethbridge Public Library, school districts and other community associations.
0%10%20%30%40%50%60%70%80%90% CanadaAlbertaLethbridge
Non-immigrants Immigrants Non-permanentresidents

2015-2022 Lethbridge Community OutlookCity of Lethbridge 51
The OUTreach Southern Alberta Society responds to the needs of the local and the broader lesbian, gay, bisexual, trans, two-spirit, and queer (LGBTTQ) community of Lethbridge and the surrounding area by supplying resources, education and opportunities to foster self-determination, civic engagement and community participation. (OUTreach Southern Alberta Society, 2016)
As part of their programming, The OUTreach Community Education Program aims to illuminate local LGBTQ issues and foster growth and understanding by providing a comprehensive in-service program for local organizations and businesses. Developed by members of the OUTreach Board of Directors, the Community Education Program has two main components:
1. The first component focuses on LGBTTQ terminology and language, clarifying terms and providing a space for discussion about sexual orientation and gender identity.
2. The second component of the Community Education Program focuses on issues related to the LGBTTQ community in Southern Alberta, and can be tailored to suit the needs of individual organizations.
Topics covered in sessions presented to date include fostering inclusive workplaces, developing welcoming and inclusive family spaces, and establishing Gay Straight/Queer Straight Alliances in local schools and communities.
The OUTreach Southern Alberta Society are working to ensure the washroom facilities in the new leisure building meet the diverse needs of Lethbridge residents. (2016)
On November 9th, 2015, City Council in Lethbridge passed a motion to make recommendations for changes to the gender question on the census. (2016)
SUMMARY:Given the immigrant status profiles described above, only eight percent of Lethbridge’s population considered themselves to be a visible minority in 2011, versus 18% in Alberta and 19% in Canada as a whole. Of those in the Lethbridge who indicated being part of a visible minority group, 23% were Japanese, followed by 16% who self- identified as being of Chinese origin, and 13% who were of South Asian descent. The remaining 48% identified themselves as being a part of a range of other visible minority groups.
Consistent with both the immigration and visible minority profiles, English was by far the most dominant language spoken at home in Lethbridge in 2011 with 94% of the population (Urban Futures, 2014). This was significantly higher than in the province of Alberta as a whole at 86% and in Canada as a whole, where 65% of people primarily spoke English at home (note that the data at the national level are skewed by the fact that 80% of Quebec residents spoke French at home in 2011). As with the visible minority status profile, there was a narrower diversity of languages spoken at home in Lethbridge relative to the province and country: only 5% of Lethbridge residents spoke a language other than English or French at home compared to 13% of Alberta’s population and 14% of Canada’s.
Lethbridge’s averages for religious affiliation among residents is consistent with Alberta’s averages.
soCIal ouTlook

2015-2022 Lethbridge Community Outlook City of Lethbridge52
soCIal ouTlook
3.1.2 Families and Children
Before considering future demographic, housing, and labour force changes in Lethbridge, it is instructive to draw on recent socio-demographic and economic data from the 2011 Census and National Household Survey (NHS) as a means of establishing a more comprehensive profile of Lethbridge and illustrating how this profile differs from the provincial and national contexts.
In 2011, the number of census families in Lethbridge was 22,840, which represents a change of 10.9% from 2006. This compares to a growth rate for Canada of 5.5% over the same period. In Lethbridge, 71.3% of census families were married couples in 2011, while 13.3% were common-law-couples and 15.4% were lone-parent families. (Statistics Canada, 2016)
HIGHLIGHTS:• The majority of people aged 15-plus who live in
Lethbridge are part of a married or common law relationship.
• The 2011 Census showed that 57% of residents in the City were either married or in a common law relationship; this compares to 59% provincially and 58% nationally.
• A (marginally) greater proportion of residents in Lethbridge are separated, divorced, or widowed than in the province as a whole: 16% in Lethbridge versus only 13% in all of Alberta.
• The remaining share of people aged 15-plus who are single (never married) is the same in Lethbridge, Alberta, and Canada, at 28%.
Between 2006 and 2011, the number of common-law couples rose 13.9%, more than four times the 3.1% increase for married couples. Lone-parent families increased 8.0% over the same period. Growth was higher for male lone-parent families (+16.2%) than for female lone-parent families (+6.0%). The following table from Statistics Canada, 2011 Census of Population shows the Census family structure in Lethbridge:
Family Structure in Lethbridge 2011
Number of children at home
Census family structureTotal - Census family
structure
Total couple
families
Married couple
families
Common-law couple
families
Total lone-
parent families
Female parent
families
Male parent
families
Total - Census families by number of children
22,840 19,325 16,285 3,040 3,520 2,840 675
Without children 10,290 10,285 8,345 1,940 0 0 0With children 12,555 9,035 7,940 1,095 3,515 2,840 680
1 child 5,865 3,670 3,090 575 2,200 1,735 4652 children 4,540 3,610 3,260 345 935 770 1653 or more children 2,150 1,760 1,585 175 385 340 50
Total number of children in census families
22,190 16,830 14,985 1,845 5,360 4,400 955
Average number of children per census family
1.0 0.9 0.9 0.6 1.5 1.6 1.4
Source: Statistics Canada, 2011 Census Population, Census Family Structure (2011)

2015-2022 Lethbridge Community OutlookCity of Lethbridge 53
soCIal ouTlook
The living arrangements of households in Lethbridge do not differ appreciably from those in either Alberta or Canada as a whole. That said, it is worth noting that Lethbridge has a lesser proportion of households occupied by couples with children (26%) then the province as a whole (32%) or Canada (29%). This appears to be consistent with the share of people aged 15-plus in Lethbridge who are in a married or common law relationship.(Statistics Canada, 2016)
Furthermore, a greater proportion of households in the city consist of couples without children (29%) than in either the province or Canada (both 27%). (Statistics Canada, 2016)
Among couples (married and common-law) in Lethbridge, 43.1% were couples with children aged 24 and under at home. In comparison, as a whole, 46.9% of couples in Canada had children aged 24 and under at home. (Statistics Canada, 2016)
The following chart from Statistics Canada, Focus on Geography Series, Census 2011 (2016) tabulates the presence of children within couple families:
YOUTH Currently in Lethbridge, youth are at risk as they experience challenges and barriers at home, school and in the community. Risks that youth experience have been identified at youth serving agencies and programs including Boys and Girls Club, YWCA Girls Space, Youth HUB, Youth ONE, the community and schools. The Youth Advisory Committee, City of Lethbridge, had anecdotally identified key issues, trends and needs that youth are facing today in Lethbridge. These key issues, trends and need may result in risk related behaviours where the youth may not have the strength of support systems, assets and or resilience to effectively utilize healthy choices and coping strategies. (Youth Advisory Council, City of Lethbridge, 2016)
The following are the identified issues, needs and trends:
• Youth are missing adult mentors to support them• Youth experience significant challenges in interpersonal
relationships• Lack of youth services including the following:
• Community Gay-Straight Alliance (GSA) essential for LGBTTQ youth.
• Youth focused opportunities for spontaneous activity including music, sport, etc.
SUMMARY:Notably, couples without children represent the greatest proportion of households in Lethbridge. These data are consistent with the greater proportion of the city’s population being in the 20 to 24 age group in 2016 than in Alberta or Canada, which is largely due to the availability of post-secondary educational opportunities in Lethbridge.
Married couples with children * 7,255Married couples without children * 9,035Common-law-couples with children * 1,070Common-law-couples without children * 1,975* Children aged 24 and under at home
Presence of Children Within Couple Families 2011
Source: Lethbridge - Presence of children within couple families, 2011 Census (2016)

2015-2022 Lethbridge Community Outlook City of Lethbridge54
soCIal ouTlook
3.1.3 Seniors
While increasing male and female labour force participation rates are expected in the coming years, the lifecycle pattern of labour force participation declining through these older age groups suggests that these increases will only partially offset the loss of labour supply as the baby boomers age towards retirement. Viewed slightly differently, for every senior who is actively participating in Lethbridge’s workforce today there would be 2.2 people aged 65-plus by 2041.
The city-wide labour force is expected to increase from 44,700 people in 2015 to 49,000 by 2022. To the extent that there will always be some level of unemployment due to structural adjustments and frictional adjustments, one can anticipate that employment growth in Lethbridge over the longer-term will be, to a large extent, limited by the rate of growth in its labour force and, by extension, given the relationship between the labour force and population, employment growth may ultimately be limited by the rate of anticipated growth in population.
HIGHLIGHTS:• The typical resident age provincially was 28 years old
(70,274 people of this age). • Typical person in Canada in 2015 was 40 years old,
illustrating the impact that younger (and more) migration to Alberta and to Lethbridge has had on the composition of their respective resident populations.
• The baby boom generation in Lethbridge will be senior citizens in 2025.
Setting aside the disproportionate number of 20 to 24 year olds, Lethbridge’s population does show the post war “baby boom” bulge in its age profile, which is common to most regions in Canada. The baby boom generation—people born between 1946 and 1965 (aged 50 to 69 in 2015)—accounted for 22% of the city’s population in 2015. Another important distinction in the city’s age profile is the scale of its seniors population: those aged 65 and older accounted for more than 15% of the city’s population in 2015.
SUMMARY: With so many changes, both internal and external, influencing the city’s demography, it is clear that the future population of the city will be shaped in part by its current residents—namely the one-quarter of whom will age into retirement in the coming two decades—and in part by migration, which will work to fill in the younger age groups.

2015-2022 Lethbridge Community OutlookCity of Lethbridge 55
soCIal ouTlook
3.1.4 Persons Living with a Disability
An estimated 3.8 million adult Canadians reported being limited in their daily activities due to a disability in 2012. This represents 13.7% of the adult population. Over 11% of Canadian adults experienced one of the three most prevalent disability types: pain, mobility or flexibility. Of those who reported at least one of these disability types in 2012, more than 40% experienced all three at the same time. (Statistics Canada, 2012)
The next most commonly reported disabilities were mental/psychological, 3.9%; dexterity, 3.5%; hearing, 3.2%; seeing, 2.7%; followed by memory and learning disabilities, 2.3% each. Less than 1% of Canadian adults reported a developmental disability. (Statistics Canada, 2012)
HIGHLIGHTS:• Senior citizens in 2025 will require assistance due to the
prevalence of disabilities at they increase steadily with age.
• Less than 1% of Canadians report a developmental disability.
• Women are more likely to have a disability than men.
The prevalence of disability increases steadily with age: 2.3 million working-age Canadians (15 to 64), or 10.1%, reported having a disability in 2012, compared to 33.2% of Canadian seniors—those aged 65 or older. Within the working-age population, those reporting a disability was 4.4% for people aged 15 to 24, 6.5% for those 25 to 44 and 16.1% for those 45 to 64. This proportion reaches 26.3% for those aged 65 to 74 and 42.5% among those 75 and older. (Statistics Canada, 2015)
The most prevalent types of disability also vary by age. In the youngest age group, 15 to 24, the most commonly reported types of disability were mental/psychological disabilities, 2.2%; learning disabilities, 2.0%; and pain, 1.9%. Among those aged 45 to 64, the most common were pain, 12.7%; flexibility, 9.8%; and mobility, 8.6%. While these three types of disabilities are also the most commonly reported among seniors, the prevalence was higher: 22.1% for pain, 20.5% for mobility and 19.3% for flexibility. The prevalence of hearing disabilities was also high among seniors, 10.4%. (Statistics Canada, 2015)
Specialized equipment and aids often enable persons with disabilities to carry out their daily activities, for example by facilitating movement (e.g., wheelchairs, hand and arm supports) or helping them hear, see or learn (e.g., hearing aids, magnifiers or specialized computers). Having the appropriate aids can enable an individual to participate more fully in society. In 2012, 81.3% of persons with disabilities reported using some kind of aid or assistive device. (Statistics Canada, 2015)

2015-2022 Lethbridge Community Outlook City of Lethbridge56
soCIal ouTlook
3.2 Health
The Social Determinants of Health influence the health of populations and community. The key determinants of health include:
• Income and Social Status• Social Support Networks • Education and Literacy• Employment and Working Conditions • Social Environments • Physical Environments • Personal Health Practices and Coping Skills • Healthy Child Development• Biology and Genetic Endowment • Health Services• Gender • Culture
Health status improves at each step up the income and social hierarchy. High income determines living conditions such as safe housing and ability to buy sufficient good food.
Alberta Health, Primary Health Care (2015) has created community profiles for Lethbridge by sectors and they include:
• Lethbridge - South• Lethbridge - West• Lethbridge - North
Each of these sectors of Lethbridge has its own unique profile with a large number of demographic, socioeconomic and health related indicators intended to provide a better understanding of the community’s current and future health needs.
LETHBRIDGE - SOUTHIn 2014, the largest age group was 35-64 year olds, accounting for 37.6% of the overall population. Children 17 and under comprised 16.7% of Lethbridge - South’s overall population, compared to 22.2% for Alberta. In addition, residents 65 and older accounted for 22.2% of Lethbridge - South’s overall population, 10.9 percentage points higher than the corresponding provincial proportion.
Compared to Alberta, Lethbridge - South had a similar proportion of First Nations people (3.0% vs. 3.4% AB). The proportion of female lone-parent families was similar to the provincial proportion (11.4% vs. 11.1% AB). In addition,
the proportion of male lone-parent families in Lethbridge - South was lower than the provincial proportion (2.9% vs. 3.4% AB).
Furthermore, a higher percentage of families had an after-tax low-income level compared to the province (11.9% vs. 10.7% AB). Compared to Alberta, the percentage of people who spent 30% or more of their income on housing related expenses was 0.5 percentage points lower in Lethbridge - South. In addition, a lower proportion of people in Lethbridge - South lived in dwellings they owned (66.6% vs. 73.6% AB).
Lethbridge - South had a lower proportion of non-English and non-French speaking people compared to Alberta (0.4% vs. 1.4% AB). Also, a lower proportion of immigrants arrived in the last five years in Lethbridge - South compared to the province (1.6% vs. 4.0% AB). Furthermore, Lethbridge - South reported a similar proportion of people with apprenticeships, trade certificates or diplomas (9.2% vs. 12.2% AB).
On average, the condition with the highest chronic disease prevalence rate reported for Lethbridge - South during 2005 to 2012 was hypertension. The largest rate of change during this time period was reported for hypertension (on average 0.45 people per 100 population average increase per year). In 2012, Lethbridge - South ranked number 94 in hypertension, number 61 in diabetes, number 112 in ischemic heart disease and number 101 in COPD among prevalence rates reported for the 132 local geographical areas.
Lethbridge - South’s combined semi-urgent and non-urgent emergency visit rate per 1,000 population was comparable to the provincial rate in 2013/2014 (263.9 vs. 285.5 AB). Semi-urgent emergency visits occurred at a 0.9 times lower rate in Lethbridge - South compared to Alberta (193.3 vs. 204.8 AB).
The peak total number of emergency visits for Lethbridge - South in 2013/2014 was reported for Sundays between 9 - 10 AM (118 emergency visits). The volume of emergency visits was low during the early morning hours and declined gradually throughout the day after peaking somewhere between late morning and early afternoon.

2015-2022 Lethbridge Community OutlookCity of Lethbridge 57
soCIal ouTlook
LETHBRIDGE - WESTLethbridge - West’s population increased by 116.6% between 1994 and 2014 (compared to a 56% increase for Alberta). The largest age group in the region in 2014, was 35-64 year olds who accounted for 36.5% of the population compared to 40.4% for Alberta. Children 17 and under made up 24.7% of the population compared to 22.2% for Alberta, while individuals 65 and older accounted for 9.0% of the population and 11.3% in Alberta.
Lethbridge - West had a similar proportion of First Nations and Inuit people compared to Alberta (3.4% vs. 3.4% AB). The percentage of female lone-parent families was similar to the provincial percentage (11.2% vs. 11.1% AB). And there was a similar proportion of families with an after-tax low-income level were reported in the Local Geographic Area (LGA) compared to Alberta (10.7% vs. 10.7% AB).
In 2012, the disease with the highest prevalence rate (per 100 population) in Lethbridge - West was hypertension. The rate associated with this disease was similar to the provincial rate (12.1 vs. 12.3 AB).
Mental and behavioural disorders are particularly important from a population health perspective. In 2013, Lethbridge - West’s emergency department (ED) visit rate for mental and behavioural disorders was lower than the provincial ED visit rate per 100,000 population (274.3 vs. 633.3 AB). It is important to note that during 2004 to 2013, mental and behavioural disorders accounted for 5.9% of all deaths in Lethbridge- West.
Lethbridge - West’s combined semi-urgent and non-urgent emergency visit rate per 1,000 population was comparable to the provincial rate in 2013/2014 (198.3 vs. 285.5 AB). Semi-urgent emergency visits occurred at a 0.7 times lower rate in Lethbridge - West compared to Alberta (146.1 vs. 204.8 AB).
Similar to Lethbridge - South, the peak total number of emergency visits for Lethbridge - West in 2013/2014 was reported for Sundays between 9 - 10 AM (102 emergency visits). The volume of emergency visits was low during the early morning hours and declined gradually throughout the day after peaking somewhere between late morning and early afternoon.
LETHBRIDGE - NORTHLethbridge - North’s population increased by 25.6% between 1994 and 2014 (compared to a 56% increase for Alberta). The largest age group in 2014, was 35-64 year olds who accounted for 39.8% of the population compared to 40.4% for Alberta. Children 17 and under made up 20.4% of the population compared to 22.2% for Alberta, while individuals 65 and older accounted for 14.1% of the population in the LGA and 11.3% in Alberta.
Lethbridge - North had a similar proportion of First Nations and Inuit people compared to Alberta (4.9% vs. 3.4% AB). (Table 3.1) The percentage of female lone-parent families was higher than the provincial percentage (14.9% vs. 11.1% AB). A higher proportion of families with an after-tax low-income level were reported in the LGA compared to Alberta (13.6% vs. 10.7% AB).
In 2012, the disease with the highest prevalence rate (per 100 population) in Lethbridge - North was hypertension. The rate associated with this disease was 1.1 times higher than the provincial rate (13.3 vs. 12.3 AB).
In 2013, Lethbridge - North’s emergency department (ED) visit rate for mental and behavioural disorders was higher than the provincial ED visit rate per 100,000 population (1,075.8 vs. 633.3 AB). The inpatient discharge rate associated with mental and behavioural disorders was comparable to Alberta’s discharge rate per 100,000 population (131.7 vs. 120.0 AB). During 2004 to 2013 mental and behavioural disorders accounted for 4.6% of all deaths in the sector.
Lethbridge - North’s combined semi-urgent and non-urgent emergency visit rate per 1,000 population was comparable to the provincial rate in 2013/2014 (271.5 vs. 285.5 AB). Semi-urgent emergency visits occurred at a similar rate in Lethbridge - North compared to Alberta (201.1 vs. 204.8 AB).
Unique to Lethbridge- North, the peak total number of emergency visits for Lethbridge - North in 2013/2014 was reported for Sundays between 2 - 3 PM (94 emergency visits). The volume of emergency visits was low during the early morning hours and declined gradually throughout the day after peaking somewhere between late morning and early afternoon.

2015-2022 Lethbridge Community Outlook City of Lethbridge58
soCIal ouTlook
3.2.1 Housing Needs
Another dimension that can be considered as part of a socio-demographic and economic profile of Lethbridge is the number of households that are in core housing need. This can been done using data from the Canada Mortgage and Housing Corporation’s Housing in Canada Online (HiCO) database—a measure jointly developed by CMHC and Statistics Canada—which calculates the various dimensions of housing need for regions across Canada.
A household is said to be in core housing need if the housing unit that it occupies falls below at least one of the established adequacy, affordability, or suitability standards. In this context:
1. Adequate housing refers to dwellings that are reported by their residents as not requiring any major repairs;
2. Affordable housing refers to dwellings that cost less on a monthly (or annual) basis than 30% of the household’s total before-tax income; and
3. Suitable housing refers to dwellings that have enough bedrooms for the size and make-up of its residents, according to National Occupancy Standard requirements.
A household is therefore not considered to be in core housing need if its housing meets all of the adequacy, suitability and affordability standards, or, if its current housing does not meet one or more of these standards, it has sufficient income to obtain alternative local housing that is acceptable (i.e. that meets the three standards) in another location within the city.
Finally, it is important to note that regardless of their circumstances, non-family households led by maintainers between the ages of 15 and 29 attending school full-time are considered to be in a transitional stage of life and therefore not considered as part of the core housing need assessment. This is particularly relevant in Lethbridge’s context, given the prominence of the University and the College within the city and broader region. (Urban Futures, 2014)
HIGHLIGHTS:• Lone parents comprised a greater proportion of renter
households in core need (25%) than they did in the broader rental stock (14%).
• Non-family households were also overrepresented in the core need segment for renters, accounting for 52 % of all households in core need (versus 50% of all renter households in the city).
• Couples living in rented accommodation (with or without children) were under-represented in the core need segment (accounting for 22% of those renter households in core need, versus 35% in the whole of the rental stock).
• Lone parents in rental households therefore had the greatest propensity to be in core need among the four household types considered here, at 40 % in 2006. This was followed by multi-family households (38% of whom were in core need), non-family households (24%), and finally couples (14%).
• The incidence of core-need among households headed by a resident aged 30 years or older is higher than among households headed by people in younger age groups.
Of the 1.18 million households in Alberta in 2006, 10% were in core housing need (119,045)—lower than the 13% of households in core housing need Canada-wide. The proportion of households in Alberta who are in core need has declined over time, falling from 12.8% in 1991 to 11.3% in 1996, 10.5% in 2001, and further to 10.1% by 2006. (Alberta 2016)
Considered on a tenure basis, although renter households represented one-quarter of households in the province (26%), they accounted for 59% of all households that were in core need in 2006. Owner-occupied households, on the other hand, accounted for 41% of those in core need (versus representing 74% of all households province-wide). Put slightly differently, renter households were over-represented in the core need segment. (Urban Futures, 2014)
With respect to family composition, of the 70,535 households who were in core need in the province in 2006 (including both renters and owner-occupiers), just over half (51%) were non-family households, 27% were couples (with and without children), and 21% were lone parent-led households. Multiple-family households made up the remaining 1%. (Urban Futures, 2014)
In Lethbridge, according to the HiCO data3, of the 35,640 households in the Lethbridge in 2006, 9.6% (3,410 households) were in core housing need. This was significantly below the 15.9% (3,580 households)

2015-2022 Lethbridge Community OutlookCity of Lethbridge 59
reported in 1991. Digging into the data a little deeper, renter households were, as at the provincial level, over-represented among those in core need: while accounting for only 25% of the city’s total households in 2006, the 2,075 renter households in core need accounted for 61% of all households in core need. (Urban Futures, 2014)
In contrast, owner-occupied households made up 39% of those in core need (1,335 households), but represented 75% of the city’s total households (26,565). Viewing the same data in a different way reveals that only 5% of owner-occupied households in Lethbridge were in core need in 2006 compared to 23% of renter households. (Urban Futures, 2014)
Despite representing a smaller share of households in core need, it is worth commenting on a couple of different characteristics relating to the owner-occupied segment before exploring the data for renter households. More specifically, owner-occupied dwellings consisting of lone parents and non-family households were over-represented in the core need segment in Lethbridge in 2006, accounting for 21% and 47% of all owner households in core need (respectively), versus only 9% and 31% of all owner households (respectively). (Urban Futures, 2014)
With respect to the age of the primary household maintainer (the person primarily responsible for the household’s finances), owner-occupied households maintained by someone aged 15 to 29 accounted for 12% of owned households in core need, the 30 to 44 group accounted for 24% the 45 to 64 group for 3 %, and the 65-plus group 27%. No significant difference was seen in the age composition of owner-occupied households in core need versus all owner-occupied households. (Urban Futures, 2014)
soCIal ouTlook
2015-2022 Lethbridge Community Outlook City of Lethbridge60
soCIal ouTlook
3.2.2 Poverty Profile
Poverty is a growing problem in Canada, as well as the rest of the world, due to weakening economies and government decisions about resource allocation and redistribution. Income insecurity and economic deprivation are also included, side by side with family composition, immigration status, race/ethnicity, gender age, disability, and the availability of social supports. Income is a key determinant of health.
New immigrant, visible minority, and non-English/French speaking children and their families are more vulnerable to circumstances of poverty and financial insecurity. Children of female-headed single parent households, families with disabilities, and families with low levels of education are also at an increased risk. (Homeless Hub, 2016)
HIGHLIGHTS:• In 2011, 24.5% of the total Lethbridge Aboriginal
population lived under the Low-Income Measure (Statistics Canada, 2013d). This is:
• A significant reduction in low-income rate since 2006• The 5th highest rate of low-income among urban
Aboriginal people in any Alberta city; a decrease from the 1st highest in 2006
• In general terms, children (under 18 years) were experiencing low-income to a greater degree than that of adults (18+ years). However, the Aboriginal population children and adults are relatively the same in rating with 30 per cent of Aboriginal children in Alberta living in poverty. (Alberta, 2016)
• Young (under 18 years) females experience low-income (23.9%) far greater than males (17.8%), while it is adult males that experience low-income greater than females (Statistics Canada, 2013d).
• Almost 1 in 3 Aboriginal individuals in Alberta does not have a high school diploma (29.7 per cent), and Aboriginal peoples without a high school diploma have a low-income rate of 24.3 per cent.
• The low-income rate of university-educated Aboriginal people is slightly lower than the provincial average, at 8.7 per cent.
Aboriginal and visible minority individuals have a higher low-income rate than the general population of Alberta. While 9.1 per cent of Albertans live in poverty, visible minorities and Aboriginal peoples are overrepresented at 15.8 per cent and 19.2 per cent respectively. • University-educated visible minority Albertans have
a higher low-income rate (13.7 per cent) compared to visible minorities with non-university certificates or diplomas (11.9 per cent).
• 21.2 per cent of visible minority children aged 5-18 live in poverty.
• While recent immigrants, on average, have higher levels of educational attainment than the general population of Alberta, their low-income rates are considerably higher.
Public Interest Alberta (2016) reports that in Lethbridge, more than one in five employed people in the region are low-wage workers.• 12,900 of 58,900 employed people in the region earn
$15 per hour or less (21.9%).• 14,900 earn $16 per hour or less (25.3%).• 5,400 earn the new minimum wage ($12.20 per hour)
or less (9.2%).
They also indicated that the majority of low-wage workers in the region are women.• 6,900 low-wage workers are women (53.5%).• 3,100 workers earning the new minimum wage ($12.20
per hour) or less are women (57.4%).
Public Interest Alberta concludes that more than 4 in 5 low-wage workers in the region are 20 years of age or older.• 10,600 (82.2%) are 20 years of age or older.• 4,300 (33.3%) are between 20 and 24 years old.• 3,700 (28.7%) are between 25 and 44 years old.• 2,600 (20.2%) are 45 years of age or older.
SUMMARY:Children in Alberta’s urban centers are more likely to live in poverty, despite increased social resources and employment opportunities in these centers. In Alberta, the low income rate increases as the size of the community increases. In rural communities, the low income rate is 4.9 per cent, compared to the provincial average of 9.1 per cent.
Youth (under 18 years) experience low-income to a greater degree than that of adults (18+ years) with women at a

2015-2022 Lethbridge Community OutlookCity of Lethbridge 61
soCIal ouTlook
higher risk of poverty than men. In Lethbridge in 2011 there were 26,380 children under the age of 19. Of these, 48.8% were female. (Statistics Canada, 2016)
Non-rural communities with a population under 30,000 (i.e. Airdrie, Lloydminster, Okotoks) report that 5.6 per cent of their population lives in poverty, while communities with a population between 30,000 – 100,000 (i.e. Red Deer, Lethbridge, Medicine Hat) report a rate of 7.9 per cent.
For urban centers with a population greater than 500,000 (Calgary and Edmonton) the low-income rate is 11.4 per cent. With the percentage of low-wage workers (employed at $15/hour or less) in Calgary and Edmonton roughly reflecting the provincial average, at approximately 24 per cent.
Alberta, G. (2016). Office of Statistics and Information (OSI) - Index.Finance.alberta.ca. Retrieved 10 September 2016, from http://finance.alberta.ca/aboutalberta/osi/index.html
(2016). Bringinglethbridgehome.ca. Retrieved 12 September 2016, from http://www.bringinglethbridgehome.ca/sites/default/files/pdf/Low%20Income%20in%20Lethbridge%20-%20A%20Profile%20-%202011-updated%20with%20PIA%20AB%20Stats.pdf
Demographics | Choose Lethbridge. (2016). Chooselethbridge.ca. Retrieved 10 September 2016, from http://chooselethbridge.ca/business/demographics.php
Disability in Canada: Initial findings from the Canadian Survey on Disability. (2016).Statcan.gc.ca. Retrieved 10 September 2016, from http://www.statcan.gc.ca/pub/89-654-x/89-654-x2013002-eng.htm
Focus on Geography Series, 2011 Census - Census subdivision of Lethbridge, CY (Alberta). (2016).Www12.statcan.gc.ca. Retrieved 10 September 2016, from https://www12.statcan.gc.ca/census-recensement/2011/as-sa/fogs-spg/Facts-csd-eng.cfm?LANG=Eng&GK=CSD&GC=4802012
(2016). Homelesshub.ca. Retrieved 10 September 2016, from http://homelesshub.ca/sites/default/files/child_poverty_fact_sheet.pdf
(2016). Lethbridge.ca. Retrieved 10 September 2016, from http://www.lethbridge.ca/City-Government/Document-Library/Documents/Projection%20Report.UrbanFutures.2011StatsCan.pdf
Lethbridge Youth Council, City of Lethbridge (2016). Lethbridge youth: current issues, trends and needs.
NHS Focus on Geography Series – Lethbridge. (2016).Www12.statcan.gc.ca. Retrieved 10 September 2016, from https://www12.statcan.gc.ca/nhs-enm/2011/as-sa/fogs-spg/Pages/FOG.cfm?lang=E&level=3&GeoCode=810#details-panel2
(2016). Health.alberta.ca. Retrieved 12 September 2016, from http://www.health.alberta.ca/documents/PHC-Profile-LethbridgeNorth.pdf
(2016). Health.alberta.ca. Retrieved 12 September 2016, from http://www.health.alberta.ca/documents/PHC-Profile-LethbridgeSouth.pdf
(2016). Health.alberta.ca. Retrieved 12 September 2016, from http://www.health.alberta.ca/documents/PHC-Profile-LethbridgeWest.pdf
(2016). Lethbridge.ca. Retrieved 10 September 2016, from http://www.lethbridge.ca/living-here/Our-Community/Documents/Vibrant%20LethbridgePovertyReport.FINAL.Feb.%202015.pdf
Lethbridge Pride Fest 2016. (2016).Lethbridgeliving.com. Retrieved 12 September 2016, from http://lethbridgeliving.com/component/ohanah/lethbridge-pride-fest-2016?Itemid=0
(2016). Open.alberta.ca. Retrieved 12 September 2016, from http://open.alberta.ca/dataset/d59f1e25-6d97-47ae-bb33-fe721b16c172/resource/85d988e7-2f45-4469-8d34-7016c86475ed/download/PHC-Profile-LethbridgeSouth-2015.pdf
(2016). Outreachsa.ca. Retrieved 12 September 2016, from http://www.outreachsa.ca/sites/default/files/pdf/Annual2016-OUTreach.pdf
Services, A. (2016). Population Health Promotion Program | Alberta Health Services. Alberta Health Services. Retrieved 10 September 2016, from http://www.albertahealthservices.ca/info/service.aspx?id=3677
What Makes Canadians Healthy or Unhealthy? - Population Health Approach - Public Health Agency of Canada. (2016). Phac-aspc.gc.ca. Retrieved 10 September 2016, from http://www.phac-aspc.gc.ca/ph-sp/determinants/determinants-eng.php#income
SOURCES

2015-2022 Lethbridge Community Outlook City of Lethbridge62
soCIal ouTlook
3.3 EducationEducational services are a major strength in Lethbridge. The city is served primarily by two school boards – Lethbridge School Division No. 51, a public school district and Holy Spirit Catholic Schools Division #4, a Catholic school district. Palliser Regional Schools is responsible for the surrounding area. Post-secondary education also plays a pivotal role in the city. Both the University of Lethbridge and Lethbridge College play an outsized role in the local economy. Not only are these institutions among the ten largest employers in the city, they are the primary source of future labour for the area and represent a distinguishing feature for a city of our size. The confluence of these factors helps explain why the continued success of these establishments is critical to both the current and future well-being of Lethbridge.
HIGHLIGHTS:• The fall 2015 headcount at the University of Lethbridge
was up 3% on a year-over-year basis• The total number of unique students registered at
Lethbridge College was up 2% on an annual basis• The number of undergraduate full-time students at the
University of Lethbridge was up 5% compared with figures from the previous year
• Full-time graduate students were up by 13% compared to the five-year average from 2010-2014
• The number of graduates at Lethbridge College increased by 45% on a year-over-year basis and exceeded the five-year average between 2009/10-2013/14 by 59%
• Almost 15,000 students are served by Lethbridge School Division No. 51 and Holy Spirit Schools Division #4, while Palliser Regional Schools serves another 8,000.
PRIMARY AND SECONDARY EDUCATIONLethbridge is committed to quality education from pre-school and kindergarten through to the college and university. Within the Lethbridge public and Catholic school systems, there are 18 elementary schools, five junior high schools, three high schools and one integrated occupational school. Another Christian school operates from pre-kindergarten through grade 12 and a Francophone public community school serves Lethbridge and area from pre-school to grade 12.
LETHBRIDGE SCHOOL DISTRICT NO. 51This school district educates over 10,000 students within Lethbridge and employs over 1,000 staff members. They have a broad range of educational programs in eighteen schools and a number of outreach programs.
All schools provide instruction in the core subjects (language arts, mathematics, social studies and science), physical education and fine arts. French language instruction is provided in grades four through twelve and a French Immersion program is offered for students from kindergarten through grade 12. At the secondary level, students can experience a wide range of options or complementary courses designed to meet their unique needs and interests, including those related to career and technology studies. International Baccalaureate, Advanced Placement, and Knowledge and Employability courses are also offered to high school students.
PALLISER REGIONAL SCHOOLSPalliser’s original geographic area stretches from just south of Lethbridge and to the north of the Bow River on the outskirts of Calgary. With the addition of faith-based alternative programs, Palliser now serves students within the City of Calgary as well. It severs about 8,100 students and has over 1,400 employees. The entire network of schools comprises 17 Hutterian colony schools, 15 community schools, 10 faith-based alternative schools, four outreach programs, two alternative programs for Low German-speaking Mennonite families, a home schooling program and an online and international program.
HOLY SPIRIT ROMAN CATHOLIC SEPARATE REGIONAL DIVISION #4The Holy Spirit Catholic School Division operates a total of 14 schools (ECS to Grade 12) in five communities Coaldale, Lethbridge, Picture Butte, Pincher Creek and Taber. Total student enrolment is 4,835 (as of September 30, 2014). Holy Spirit employs approximately 745 staff members.
In addition to offering a solid program in the core subject areas, additional programs include French Immersion, Native Education and Fine Arts. Special Education support and services are provided. The Holy Spirit Catholic School Division is strongly committed to the ideals of Catholic education and provides opportunities for students to achieve academic excellence and to grow personally, socially and physically in a Christ-oriented environment.

2015-2022 Lethbridge Community OutlookCity of Lethbridge
Header
63
soCIal ouTlook
UNIVERSITY OF LETHBRIDGETotal student enrolment at the University of Lethbridge for the Fall 2015 semester was 8,296, including full-time student enrolment of 7,397. 6,958 full-time students were registered in undergraduate programs while 439 were enrolled in graduate studies.
There were 1,879 graduates from the University of Lethbridge over the course of the 2014/15 academic year. This total represents a decline of 3% from the year prior (1,940 in 2013/14) and a 4% decline compared with the five-year average derived from the 2009/10-2013/14 period (1,953).
LETHBRIDGE COLLEGEThere were a total of 6,524 unique students registered at Lethbridge College during the 2014/15 academic year. The number of Full-Load Equivalents (FLEs) attending Lethbridge College during the 2014/15 academic year was 3,926.
There were a total of 1,556 graduates from Lethbridge College during the 2014/15 academic year, which represents an increase of 45% on an annual basis (1,070 in 2013/14) and 59% compared with the five-year average derived from 2009/10-2013/14 (978).
SUMMARYThe two school boards that serve Lethbridge are responsible for the education of almost 15,000 students while the Palliser Regional Board provides services for another 8,000 students. Lethbridge School District No. 51 and Holy Spirit Catholic Division #4 employ a combined total of 1,800 staff members, with Palliser accounting for another 1,400 jobs. The number of students registered at both the University of Lethbridge and Lethbridge College increased in the past year, with total enrolment at the university up 3% and registration at the college up 2% based on the most recent annual comparatives for each institution. Both of these establishments also witnessed increased totals in the number of full-time students, with the University of Lethbridge recording a spike of 4% and Lethbridge College a 2% jump on a year-over-year basis. One area where the two institutions diverged was in the number of graduates. Total graduates at the University of Lethbridge fell by 3% on an annual basis, while Lethbridge College saw its total jump by 45% over the same time period.
University of Lethbridge Full-Time Student Enrolment
0 1,000 2,000 3,000 4,000 5,000 6,000 7,000 8,000 9,00010,000
2010-2014
2015
Average
Lethbridge College Graduates
0 500 1,000 1,500 2,000 2,500 3,000
2010-2014
2015
Average
Holy Spirit Roman Catholic Separate Regional Division #4. http://www.holyspirit.ab.ca/page.cfm?pgID=16.
Lethbridge College – Department of Institutional Planning, Analysis and Risk Services.
Lethbridge School District No. 51. http://www.lethsd.ab.ca/District.php.
Palliser Regional Schools. http://www.pallisersd.ab.ca/schools/our-schools.
University of Lethbridge – Department of Institutional Analysis.
SOURCES
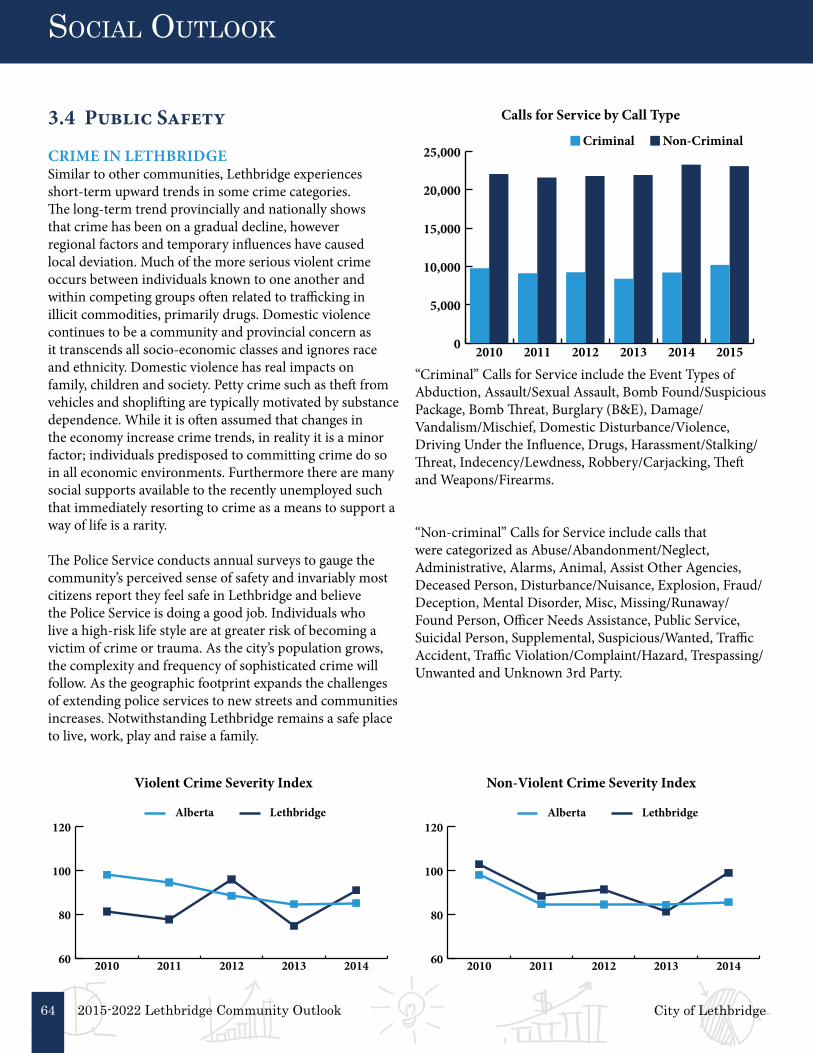
2015-2022 Lethbridge Community Outlook City of Lethbridge64
soCIal ouTlook
3.4 Public Safety
CRIME IN LETHBRIDGESimilar to other communities, Lethbridge experiences short-term upward trends in some crime categories. The long-term trend provincially and nationally shows that crime has been on a gradual decline, however regional factors and temporary influences have caused local deviation. Much of the more serious violent crime occurs between individuals known to one another and within competing groups often related to trafficking in illicit commodities, primarily drugs. Domestic violence continues to be a community and provincial concern as it transcends all socio-economic classes and ignores race and ethnicity. Domestic violence has real impacts on family, children and society. Petty crime such as theft from vehicles and shoplifting are typically motivated by substance dependence. While it is often assumed that changes in the economy increase crime trends, in reality it is a minor factor; individuals predisposed to committing crime do so in all economic environments. Furthermore there are many social supports available to the recently unemployed such that immediately resorting to crime as a means to support a way of life is a rarity.
The Police Service conducts annual surveys to gauge the community’s perceived sense of safety and invariably most citizens report they feel safe in Lethbridge and believe the Police Service is doing a good job. Individuals who live a high-risk life style are at greater risk of becoming a victim of crime or trauma. As the city’s population grows, the complexity and frequency of sophisticated crime will follow. As the geographic footprint expands the challenges of extending police services to new streets and communities increases. Notwithstanding Lethbridge remains a safe place to live, work, play and raise a family.
“Criminal” Calls for Service include the Event Types of Abduction, Assault/Sexual Assault, Bomb Found/Suspicious Package, Bomb Threat, Burglary (B&E), Damage/Vandalism/Mischief, Domestic Disturbance/Violence, Driving Under the Influence, Drugs, Harassment/Stalking/Threat, Indecency/Lewdness, Robbery/Carjacking, Theft and Weapons/Firearms.
“Non-criminal” Calls for Service include calls that were categorized as Abuse/Abandonment/Neglect, Administrative, Alarms, Animal, Assist Other Agencies, Deceased Person, Disturbance/Nuisance, Explosion, Fraud/Deception, Mental Disorder, Misc, Missing/Runaway/Found Person, Officer Needs Assistance, Public Service, Suicidal Person, Supplemental, Suspicious/Wanted, Traffic Accident, Traffic Violation/Complaint/Hazard, Trespassing/Unwanted and Unknown 3rd Party.
0
5,000
10,000
15,000
20,000
25,000
201520142013201220112010
Non-CriminalCriminal
Calls for Service by Call Type
Alberta Lethbridge
60
80
100
120
20142013201220112010
Violent Crime Severity Index
Alberta Lethbridge
60
80
100
120
20142013201220112010
Non-Violent Crime Severity Index

2015-2022 Lethbridge Community OutlookCity of Lethbridge 65
soCIal ouTlook
3.5 Community Resilience(Fire/Flood)
Community resilience is a measure of the sustained ability of a community to utilize available resources to respond to, withstand, and recover from adverse situations.1
There are a number of situations that a community must prepare for in order to ensure that people and property are protected. Natural and anthropomorphic caused events occur with varying degrees of frequency in different communities these include fire, flooding, wind, tornados, structural failures (bridges), rail accidents, drought and more. There is some indication that the frequency of some natural events is increasing due in part to changes in climate.
The City of Lethbridge has not been subjected to frequent emergency events. However, it has seen some significant flooding, fire and hail storms that have caused property damage. The City is almost entirely located outside the flood fringe of the Oldman River having made the decision to move all settlements out of the River Valley in 1950. As a result property damage caused by floods has been limited to parklands.
EVENTSFlooding (Spring, 1995) - Flooding occurred in southern Alberta on the heels of the forest fires in the north. Temperatures in the upper 20’s the previous week, as well as spring run-off and rain, led to flooding which started in the Crowsnest Pass area and moved through to Pincher Creek, Fort MacLeod, Medicine Hat and then into Saskatchewan. In total, 27 municipalities were impacted. Communities in the west had no advance warning; however, Medicine Hat had 2-3 days warning which gave them lead time to plan and prepare for the event. The City was able to identify evacuation areas and provide information to citizens. This was Canada’s worst natural disaster at that time.
Flooding (June 9, 2002) - Heavy rain and snowfall caused flooding in southern Alberta. The following municipalities declared a State of Local Emergency: Towns of Pincher
Creek, Coaldale and Magrath; Counties of Lethbridge, Warner and Cardston; Villages of Sterling, Warner and Foremost. The Blood Tribe at Standoff and the Peigan Nation at Brocket passed band council resolutions and evacuated residents. Several boil water orders were issued.
Flooding (July 1-2, 2008) - A State of Local Emergency was declared in the City of Lethbridge on July 1, 2008 due to flooding caused by heavy rain. The Alberta Emergency Management Agency had an officer on scene to relay information back to the Agency Response Readiness Centre. The City reported some breaches at the Wastewater Treatment Plant. Most waste stayed on site, however there was some discharge into the Oldman River. This was reported to Alberta Environment.
Wildfire (September 10, 2012) - Grass fires near West Lethbridge and the Town of Coalhurst forced about 2,500 people from their homes; people were able to return to their homes the next day. About 12,500 acres of land burned from this event which started on the Blood Reserve and which was fueled by winds that were gusting to 110km/hr.2

2015-2022 Lethbridge Community Outlook City of Lethbridge66
leThbrIdGe and reGIon soCIal ouTlooksoCIal ouTlook
Flooding (June, 2013) - Significant rainfall in the Eastern Slopes of the Rocky Mountains resulted in streams and rivers overflowing in large parts of Southern Alberta. Up until the Forest Fires that affected Fort McMurray in 2016, this was the countries costliest natural disaster. The City of Lethbridge saw extensive flooding in the Oldman River Valley.
Hail Storm (July, 2013) - Significant property damage was caused by thunderstorms that flooded streets and backed up sewers. As well, gold ball sized hails created significant damage to homes, vehicles and crops.
Water Turbidity/Shortage Event (March 14, 2014) - An unprecedented quick snow melt caused water to run directly over ice and frozen ground to rivers and streams carrying with it dirt, silt and organic matter – thereby causing filters at the City’s Water Treatment Plant to become clogged, thus reducing the Plant’s capacity to produce potable water. The City declared a State of Local Emergency – water conservation measures implemented – in addition to citizens, major industrial water users had to shut down. Alberta Health Services issued a boil water order.
Flooding (June 17, 2014) - Alberta Environment and Sustainable Resources issued a flood warning for the Oldman River – precipitation expected in the South West of the province to be 120 – 150 mm. River Forecasting Centre anticipated flow to be 4,500 m3/sec (same as 1995) – actual flow was 2,250 m3/sec. Lethbridge County declared a State of Local Emergency. Areas in the city that were evacuated included: Bridgeview Campground, Paradise Canyon, Tollestrup Construction Inc., Fort Whoop Up and the Helen Schuler Nature Centre. The City of Lethbridge did not declare a State of Local Emergency.
LETHBRIDGE FIRE AND EMERGENCY SERVICES
1 www.rand.org/topics/community-resilience.html
2 Grass Fire leaves blackened reminder of its Rage: Western Producer http://www.producer.com/2012/09/grass-fire-leaves-blackened-reminder-of-its-rage%E2%80%A9/
Canadian Disaster Database: Public Safety Canada. http://cdd.publicsafety.gc.ca
SOURCES
Medical Incidents Fire Incidents
0 3,000 6,000 9,000 12,000 15,000
2011
2012
2013
2014
2015
Motor Vehicle
Number of Responses/Incidents

City of Lethbridge 2015-2022 Lethbridge Community Outlook 67
ParT 4: aPPendICes

2015-2022 Lethbridge Community Outlook City of Lethbridge68
aPPendICes
City of Lethbridge 2015Base Forecast
2016 2017 2018 2019 2020 2021 2022Total Population 94,804 96,828 98,351 99,887 102,002 103,794 105,796 108,167
Population by Cohort0-4 5,543 5,692 5,998 6,374 6,541 6,632 6,707 6,3805-9 5,518 5,735 5,482 5,638 5,862 6,050 6,234 6,36110-14 4,698 4,956 5,298 5,399 5,570 5,720 5,897 5,41615-19 6,418 6,545 5,906 5,852 5,889 5,919 5,994 7,41920-24 10,229 10,256 8,122 7,842 7,665 7,550 7,498 11,91225-29 7,922 7,976 8,766 8,741 8,697 8,624 8,554 8,50730-34 6,998 7,198 7,869 8,042 8,211 8,284 8,323 8,01535-39 5,801 5,954 6,904 7,175 7,498 7,749 7,989 6,63940-44 5,419 5,551 6,047 6,272 6,561 6,826 7,108 6,20145-49 5,015 5,066 5,574 5,698 5,880 6,065 6,277 5,71050-54 5,997 5,799 5,740 5,722 5,766 5,823 5,915 6,01255-59 5,896 5,907 5,807 5,789 5,801 5,808 5,834 5,90860-64 5,105 5,406 5,380 5,448 5,531 5,589 5,643 5,67565-69 4,310 4,597 4,514 4,643 4,792 4,919 5,047 5,02570-74 3,150 3,347 3,667 3,785 3,948 4,094 4,257 4,26075-79 2,423 2,398 2,829 2,922 3,074 3,219 3,383 3,40580-84 2,125 2,067 2,155 2,194 2,292 2,421 2,550 2,58785+ 2,237 2,378 2,293 2,351 2,424 2,502 2,586 2,674
Population by SectorNorth 26,751 27,179 28,119 28,436 28,919 29,204 29,538 29,927South 31,337 31,720 31.708 32,077 32,393 32,590 32,830 33,021West 36,716 37,929 38,526 39,369 40,698 42,008 43,438 45,219
4.1 Appendix 1 - Lethbridge Population Projections:
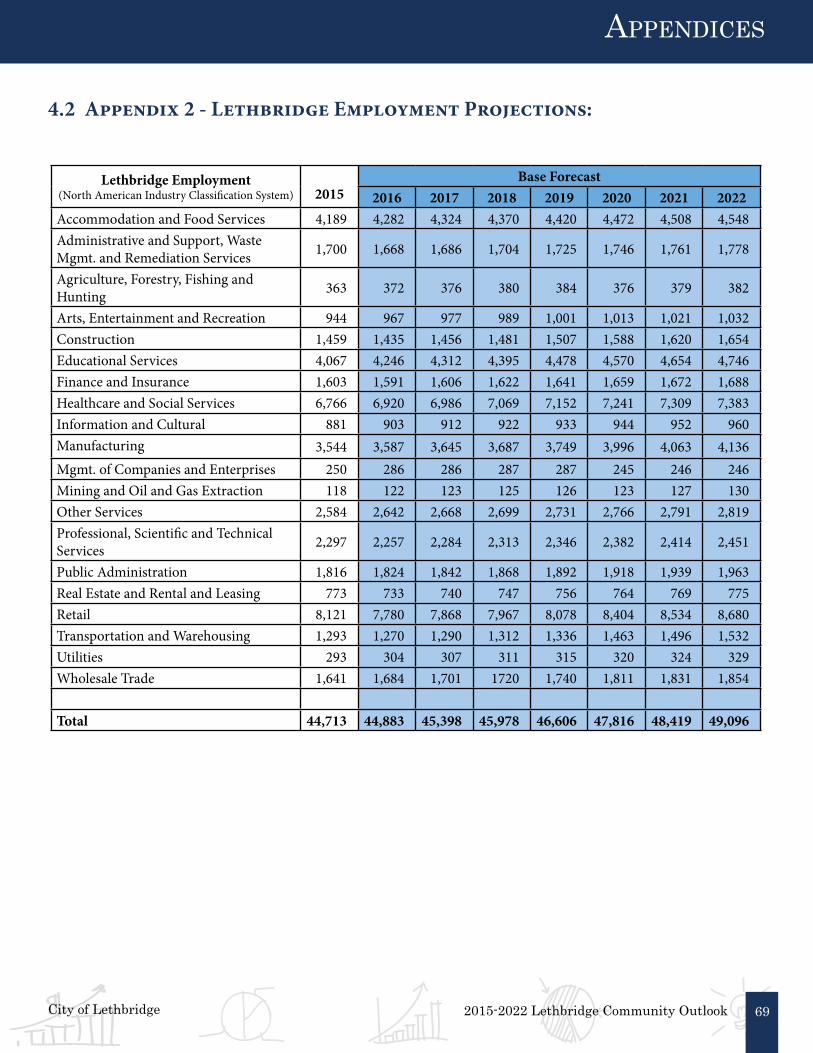
2015-2022 Lethbridge Community OutlookCity of Lethbridge 69
aPPendICes
Lethbridge Employment (North American Industry Classification System) 2015
Base Forecast2016 2017 2018 2019 2020 2021 2022
Accommodation and Food Services 4,189 4,282 4,324 4,370 4,420 4,472 4,508 4,548Administrative and Support, Waste Mgmt. and Remediation Services 1,700 1,668 1,686 1,704 1,725 1,746 1,761 1,778
Agriculture, Forestry, Fishing and Hunting 363 372 376 380 384 376 379 382
Arts, Entertainment and Recreation 944 967 977 989 1,001 1,013 1,021 1,032Construction 1,459 1,435 1,456 1,481 1,507 1,588 1,620 1,654Educational Services 4,067 4,246 4,312 4,395 4,478 4,570 4,654 4,746Finance and Insurance 1,603 1,591 1,606 1,622 1,641 1,659 1,672 1,688Healthcare and Social Services 6,766 6,920 6,986 7,069 7,152 7,241 7,309 7,383Information and Cultural 881 903 912 922 933 944 952 960Manufacturing 3,544 3,587 3,645 3,687 3,749 3,996 4,063 4,136Mgmt. of Companies and Enterprises 250 286 286 287 287 245 246 246Mining and Oil and Gas Extraction 118 122 123 125 126 123 127 130Other Services 2,584 2,642 2,668 2,699 2,731 2,766 2,791 2,819Professional, Scientific and Technical Services 2,297 2,257 2,284 2,313 2,346 2,382 2,414 2,451
Public Administration 1,816 1,824 1,842 1,868 1,892 1,918 1,939 1,963Real Estate and Rental and Leasing 773 733 740 747 756 764 769 775Retail 8,121 7,780 7,868 7,967 8,078 8,404 8,534 8,680Transportation and Warehousing 1,293 1,270 1,290 1,312 1,336 1,463 1,496 1,532Utilities 293 304 307 311 315 320 324 329Wholesale Trade 1,641 1,684 1,701 1720 1,740 1,811 1,831 1,854
Total 44,713 44,883 45,398 45,978 46,606 47,816 48,419 49,096
4.2 Appendix 2 - Lethbridge Employment Projections:

2015-2022 Lethbridge Community Outlook City of Lethbridge70
aPPendICes
4.3 Appendix 3 - Crime Severity Index:
Alberta 2010 2011 2012 2013 2014Crime severity index 98.18 87.50 85.81 84.75 85.73Percent change in crime severity index -7.02 -10.88 -1.93 -1.24 1.16Violent crime severity index 98.19 94.65 88.56 84.77 85.22Percent change in violent crime severity index -7.79 -3.61 -6.43 -4.28 0.53Non-violent crime severity index 98.18 84.71 84.64 84.57 85.73Percent change in non-violent crime severity index -6.72 -13.72 -0.08 -0.08 1.37Weighted clearance rate (number) 42.44 43.85 42.92 41.94 41.21Percent change in weighted clearance rate 3.08 3.32 -2.12 -2.28 -1.74Violent weighted clearance rate (number) 62.5 62.14 63.21 62.7 62.36Percent change in violent weighted clearance rate 2.73 -0.58 1.72 -0.81 -0.54Non-violent weighted clearance rate (number) 34.72 36.41 35.2 34.37 33.55Percent change in non-violent weighted clearance rate 3.58 4.87 -3.32 -2.36 -2.39
Lethbridge 2010 2011 2012 2013 2014Crime severity index 96.97 85.81 90.19 79.84 97.12Percent change in crime severity index -14.44 -11.51 5.1 -11.48 21.64Violent crime severity index 81.38 77.80 96.01 74.82 91.05Percent change in violent crime severity index -23.13 -4.40 10.55 -13.01 21.69Non-violent crime severity index 102.96 88.54 91.52 81.51 99.13Percent change in non-violent crime severity index -11.39 -14.01 3.37 -10.94 21.62Weighted clearance rate (number) 56.14 56.06 57.92 58.88 58.60Percent change in weighted clearance rate 6.77 -0.14 3.32 1.66 -0.48Violent weighted clearance rate (number) 75.95 80.81 89.46 82.13 82.47Percent change in violent weighted clearance rate -0.71 6.40 10.70 -8.19 0.41Non-violent weighted clearance rate (number) 50.12 48.14 47.14 51.11 50.63Percent change in non-violent weighted clearance rate 13.37 -3.95 -2.08 8.42 -0.94

2015-2022 Lethbridge Community OutlookCity of Lethbridge 71
aPPendICes
CRIME SEVERITY INDEX NOTES
• The crime severity index is calculated using Incident-based Uniform Crime Reporting Survey (UCR2) data. For the period from 1998 to 2008 Incident-based UCR2 data are not available for all respondents. In order to report this level of detail for police services still reporting to the Aggregate Uniform Crime Reporting Survey (UCR) over this time, a process of imputation was applied to derive counts for violations that do not exist on their own in the aggregate survey. For approximately 80% of the aggregate offence codes, there is a 1:1 mapping with a new incident-based violation code. For violations where this was not the case, such as the aggregate other Criminal Code category, it was necessary to estimate (impute) this figure using the distribution of other Criminal Code offences from existing Incident-based UCR2 respondents.
• During the production of each year’s crime statistics, data from the previous year are revised to reflect any updates or changes that have been received from the police services. For more information on the concepts, methods and quality of the data contained in this table, please contact the Canadian Centre for Justice Statistics at [email protected] or at 1-800-387-2231.
• The crime severity index includes all Criminal Code violations including traffic, as well as drug violations and all Federal Statutes.
• This represents the year-over-year (current year over last year) percentage change.
• The violent crime severity index includes all Incident-based Uniform Crime Reporting Survey (UCR2) violent violations, some of which were not previously included in the aggregate violent crime category, including uttering threats, criminal harassment and forcible confinement.
• The non-violent crime severity index includes all non-violent Criminal Code violations including traffic, as well as drug violations and all Federal Statutes.
• The Police Reported Crime Severity Index (PRCSI) measures changes in the level of severity of crime in Canada from year to year. In the index, all crimes are assigned a weight based on their seriousness. The level of seriousness is based on actual sentences handed down by the courts in all provinces and territories. More serious crimes are assigned higher weights, less serious offences lower weights. As a result, more serious offences have a greater impact on changes in the index. The PRCSI is standardized to 100 in base year 2006.
• The Crime Severity Index is not available for police services or detachments with populations less than 1,000. Data for police services or detachments with populations less than 5,000 should be used with caution.
• The weighted clearance rate is based on the same principles as the Police Reported Crime Severity Index (PRCSI), whereby more serious offences are assigned a higher “weight” than less serious offences. For example, the clearing of homicides, robberies or break and enters would represent a greater contribution to the overall weighted clearance rate value than the clearing of minor theft, mischief or disturbing the peace.
• The weighted clearance rate is not available for police services or detachments with populations less than 1,000. Data for police services or detachments with populations less than 5,000 should be used with caution.
• With the release of 2012 data, revised population estimates at the respondent level were applied back to and including 2004.
• Police reported statistics may be affected by differences in the way police services deal with minor offences. In some instances, police or municipalities might chose to deal with some minor offences using municipal by-laws or provincial provisions rather than Criminal Code provisions. Counts are based on the most serious violation in the incident.
• The crime statistics reported for this police service contain a notable proportion of incidents that occur within the local correctional facility. For further details, contact the Canadian Centre for Justice Statistics at [email protected] (1-800-387-2231).
• Starting in 2003, populations for all police services including all rural/provincial detachments have been presented. Prior to 2003, populations for rural detachments are not available.

2015-2022 Lethbridge Community Outlook City of Lethbridge72
aPPendICes
4.4 Appendix 4 - Social Demographic & Economic Characteristics(2011 Census & NHS) City of Lethbridge Alberta Canada
No. % No. % No. %Marital Status **
Married or Common Law 39,470 57% 1,756,855 59% 16,084,490 58%Separated or Divorced 6,570 9% 248,235 8% 2,384,275 9%
Widowed 4,235 6% 131,440 4% 1,584,530 6%Single (never married) 19,420 28% 823,935 28% 7,816,045 28%
Household Living Arrangements ***Couples with kids 8,810 26% 438,585 32% 3,921,735 29%
Couples without kids 9,940 29% 374,945 27% 3,538,720 27%Lone Parents 3,225 9% 128,325 9% 1,375,450 10%Single Person 9,270 27% 342,735 25% 3,673,305 28%
Other 2,895 8% 105,690 8% 811,410 6%Language Spoken at Home *
English 77,675 94% 3,095,250 86% 21,457,075 65%French 295 0.4% 24,690 0.7% 6,827,865 21%Other 3,675 4% 379,550 11% 3,673,865 11%
Multiple Languages 1,210 1.5% 110,695 3% 1,162,370 4%Immigrant Status *
Non-immigrants 70,695 87% 2,864,240 80% 25,720,175 78%Immigrated < 2000 6,540 8% 386,885 11% 4,620,770 14%
Immigrated 2001 to 2005 1,045 1% 113,060 3% 992,070 3%Immigrated 2005 to 2011 1,885 2.3% 144,170 4% 1,162,915 4%
Non-permanent Residents 1,225 1.5% 59,620 1.7% 356,385 1.1%Visible Minority Status *
Not a Visible Minority 74,400 91% 2,911,650 82% 26,587,575 81%Japanese 1,575 1.9% 12,415 0.3% 87,270 0.3%Chinese 1,125 1.4% 133,390 3.7% 1,324,750 4.0%
South Asian 920 1.1% 156,665 4.4% 1,567,400 4.8%All Other 3,365 4.1% 353,855 10% 3,285,330 10%
Educational Attainment **No Cert, Dip, Deg 11,860 18% 550,465 19% 5,485,400 20%HS Cert or Equiv 20,025 30% 764,390 26% 6,968,935 26%
Apprentice/Trades Cert or Dip 6,775 10% 318,280 11% 2,950,685 11%College/CEGEP/other non-uni Cert or Dip 13,735 20% 530,100 18% 4,970,020 18%
University Cert or Dip < Bachelor 2,125 3% 122,465 4% 1,200,130 4%University Cert, Dip, Deg 13,245 20% 603,040 21% 5,684,360 21%
Labour Force **Agriculture & Other Resources 1,570 3% 219,700 11% 848,640 5%
Construction 3,975 8% 195,905 9% 1,215,380 7%Manufacturing 3,570 8% 123,465 6% 1,619,295 9%
Trade 8,020 17% 318,225 15% 2,765,110 16%Finance, insurance & real estate 2,560 5% 108,850 5% 1,089,855 6%
Health care & social services 6,210 13% 206,695 10% 1,949,650 11%Education 4,765 10% 141,550 7% 1,301,435 7%
Business services 5,530 12% 342,760 16% 2,814,420 16%Other services 11,185 24% 430,990 21% 3,983,835 23%
Individual Income **Median Income $31,151 $36,306 $29,878
Median After-tax Income $28,580 $32,847 $27,334Composition of total income (100%) 100% 100% 100%
Earnings 77% 81% 75%Govt Transfers 11% 7% 12%
Other Money 12% 12% 13%Shelter Costs ***
Median monthly shelter costs - Rental $895 $1,017 $784Median monthly shelter costs - Owned $1,016 $1,251 $978
* Total Population / ** Population aged 15+ / *** Total Private HouseholdsSource: Urban Futures (2014)
