lessons from covid-19 accounting distortions & past
TRANSCRIPT

Staying Vigilant in 2021:
Lessons from COVID-19 Accounting Distortions &
Past Blowups (Wirecard and Carillion)
Anthony Scilipoti, FCPA, FCA, CPA (Illinois)
President & CEO
Dimitry Khmelnitsky, CPA, CA
Head of Accounting and Special SituationsJanuary 12, 2021

Outline
• The Veritas Forensic Analytical Framework
• Earnings manipulation: • Divergent treatment of COVID-related costs and their nature
• Detecting understated provisions for bad receivables
• IFRS 9 disclosures and risks at Canadian banks
• Creative interest capitalization to meet guidance
• Change in accounting assumptions to boost earnings
• Same Store Sales Growth manipulation • Exclusion of stores closed due to COVID and inclusion of ‘lost’ sales
• Cash flow manipulation: • Selective definitions of FCF
• Supply chain financing pitfalls
• Other items: The usefulness of Going Concern note
• Case studies: Carillion Plc and Wirecard AG

1. Understand the Story.
• What is the market excited or not excited about and on what is that
excitement based?
2. Approach each Story with a blank mind
• “If you look hard enough at something, you can trick yourself into believing its
true.
3. Learn how to read a situation
• Recognize that that nothing happens without a reason. Look for cause and
effect.
4. Deductions should be based on evidence.
• Look for facts; don’t let your hunches blur your perceptions.
5. Focus on the people. Never give up the opportunity to listen.
• Businesses don’t run themselves. Listen/read what is said and not said.
6. Never underestimate anyone.
• Fraudsters are not generally born – focus on the motivation.
7. Learn how to recognize vital facts from incidental facts.
• This requires practice and skepticism to perfect.
The Forensic Mindset

Analytical Framework: Key Areas of Study
• Business Operations
• Accounting & Disclosure
• Cash Flow Sustainability
• Balance Sheet Risks
• Corporate Governance

Analytical Scepticism Framework
Business Innovation = Earnings & Multiple Expansion
Accounting Innovation = Not Sustainable

The Forensic Framework: Identifying Opportunities
Evaluate the Business & Reporting Control
Environment
2) Identify Flammable Items
3) Look For Sparks

1. Evaluate Business & Reporting
Control Environment
• Understand the business
• Understand the story
• Understand accounting/disclosure and key performance metrics relied upon
• Assess control/organizational structure
• Evaluate the management incentive structure
• Adversarial management team
• More concern over stock price than business ops

2. Identify Flammable Items
• Relatively high debt and little room on covenants
• Persistent negative free cash flow
• Strategic reliance on acquisitions or asset sales• Weak internal controls
• Decentralized reporting structure with up or out employee culture
• Changes in accounting policies/estimates
• Non-GAAP metrics that distort economic reality • Powerful CEO/weak CFO
• Newer public companies
• Employee/Supplier/Competitor corroboration
• Change in strategic focus/ management’s tone

• Economic, competitive shocks / business model
disruption
• Missed expectations
• SEC / regulatory investigations
• Short seller report
• Harder to make acquisitions (higher multiples etc.)
• Increase in debt and associated covenants
• Persistent negative FCF
3. Look for Sparks

• We are already seeing signs that companies are
playing with their numbers.
• If economy stalls, incentive to manage results will
intensify
Looking Ahead

11
Where to Look: Finding Regulatory Filings
Local regulatory filings: check for red flags/inconsistencies
I. Ensure you are using the legal subsidiary name
II. Use annual filings and MD&A to see what regulatory bodies
company reports to
III. Find subsidiary website and look for documents / press releases
a. Sometimes subsidiaries file their local regulatory financials
on their websites (eg. Brazil)
IV. Find the applicable organization that regulates the sub (financial or
industry).
a. UK: Companies House
b. Australia: Australian Securities & Investments Commission
c. US Natural Gas Pipelines : Federal Energy Regulatory
Commission
d. India: Ministry of Corporate Affairs
V. Search by board members as they will typically sit on multiple sub
boards

Where to Look?
• Financial Statements & Notes• Internal controls certification • Expanded audit report – critical audit matters • Accounting policies note, receivables, inventory, acquisitions • Consider estimates used• Clarity of disclosures
• MD&A and Investor Presentations• Assess the Non-GAAP metrics used• Clarity of explanations of results• Risk section – monitor YoY changes
• SEC/OSC correspondence letters
• Interview Management/Competitors/Past Employees etc.
12

Where to Look?
• Management Proxy• Management compensation. Ownership?
• Board composition and experience?
• Annual Information Forms
• Insider filings
• Business Acquisition Reports (8K)• Change in accounting policies
• Adjustments to assets/liabilities
• “On the ground”: LinkedIn, Glassdoor, competitors
• Earnings calls: changes in tone
13

Earnings Manipulation
14

COVID Costs: Inconsistent treatment
Medical Device Companies: H1-F20
• Divergent treatment of costs hurts comparability
• COVID-related costs: Plant closure/ramp up, facility cleaning,
protective equipment, bonuses for factory employees
• Similar companies, similar costs, different treatment
In USD per share DexCom Cooper Medtronic
Adjusted EPS 1.23 3.79 1.20
COVID 19 impact excluded / (included) 0.11 0.71 (0.27)
Overstate / (understate) compared to
peers9% 19% -22%
15

COVID Costs: Government Subsidies
• Some are more consistent than others
• Iamgold: Excluded both costs and subsidies
in millions H1-F20
COVID costs, net of est. tax 10.24
Less: government subsidy, net of tax (4.32)
Net impact on reported Adj. earnings 5.92
Adj. earnings reported 16.50
% impact on Adj. earnings 36%
16

COVID Costs: Treatment of Subsidies
• Good stuff in, bad stuff out
• Ulta Beauty (ULTA:NSQ, $15B mkt cap, US Retail
cosmetics chain):
• Excluded costs but include benefits
41.5
(48.2)
(6.7)
17

COVID Costs’ Exclusion: Large Canadian Filers
*YTD Q3-F20 or H1-F20
Company% Impact on Adj
EPS*Nature
Teck Resources Ltd. 75%Labor, remobilization, care and maintenance costs, financing
expense that would be capitalized absent project suspension
Teranga Gold Corp 11% Incremental costs related to personnel and accommodation
First Majestic Silver Corp. 57% Standby costs
Pan American Silver Corp. 79% Care and maintenance costs
Alamos Gold Inc. 11%Labor costs for idle employees and additional transportation and
lodging costs
Torex Gold Resources Inc. 225% COVID-19 screening, safety equipment purchases and cleaning
WSP Global Inc 17% Severances and restructuring
Company% Impact on Adj
EBITDA
Jamieson Wellness Inc. 11%Protective equipment, wage premium, reserve against A/R &
inventory related to bankruptcy of a retail partner due to COVID
Primo Water Corp 11% Front-line incentives protective equipment/supplies
• Watch out for inclusion of unusual costs in the COVID bucket
18

19
Provision Adequacy: BPY• Compare provision expense to collections and tenants’ health
• Provision for credit losses have increased to 4% and 10% of revs.
even though BPY has not collected 65% and 30% of its rents in Q2
and Q3, respectively
-
2%
4%
6%
8%
10%
12%
Cre
dit L
oss P
rovis
ion
as a
% o
f R
evenues
Provision for credit losses as a % of revenues
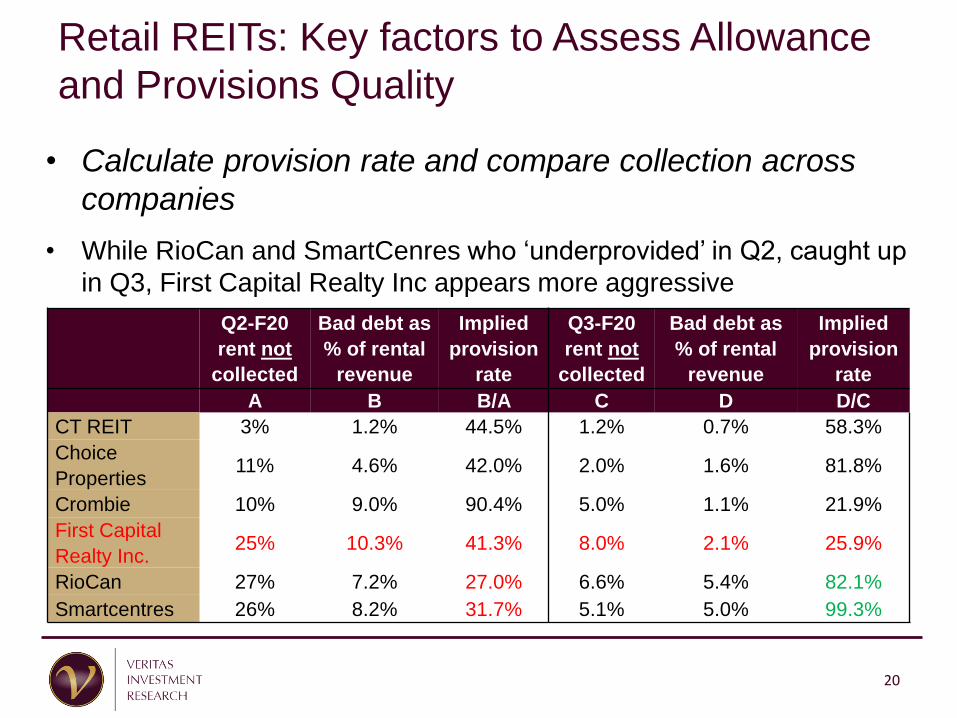
Retail REITs: Key factors to Assess Allowance
and Provisions Quality
• Calculate provision rate and compare collection across
companies
• While RioCan and SmartCenres who ‘underprovided’ in Q2, caught up
in Q3, First Capital Realty Inc appears more aggressive
Q2-F20
rent not
collected
Bad debt as
% of rental
revenue
Implied
provision
rate
Q3-F20
rent not
collected
Bad debt as
% of rental
revenue
Implied
provision
rate
A B B/A C D D/C
CT REIT 3% 1.2% 44.5% 1.2% 0.7% 58.3%
Choice
Properties11% 4.6% 42.0% 2.0% 1.6% 81.8%
Crombie 10% 9.0% 90.4% 5.0% 1.1% 21.9%
First Capital
Realty Inc.25% 10.3% 41.3% 8.0% 2.1% 25.9%
RioCan 27% 7.2% 27.0% 6.6% 5.4% 82.1%
Smartcentres 26% 8.2% 31.7% 5.1% 5.0% 99.3%
20

TC Energy: Capitalized Interest
in millions Q2-F20
Capitalized interest - YoY increase 43
Comparable earnings 863
Impact on non-GAAP earnings 5%
• Check the rationale used to capitalize interest. Is there a >50%
likelihood project will be completed?
• “…the inclusion of previously impaired capital costs in the basis
for calculating capitalized interest following our decision to proceed
with construction of the Keystone XL pipeline.
• TRP now meets its guidance of “flat” YoY comparable earnings
• Helps boost operating cash flow as well
21

UPS: Assumption Changes Inflate Earnings Growth
• Watch out for changes in accounting assumptions
• Lengthened useful life of building improvements, vehicles and
equipment
• Reduced self-insurance reserves from the mid-point to the low
end of the actuarial projected range of loses
in millions 2019 2018%
Change
Adjusted net income 6,543 6,301 4%
Reduction in depreciation expense (167) - n/a
Reduction to self-insurance reserves (72) - n/a
Veritas adjusted net income 6,304 6,301 0.05%
% overstated 4%
22

Learning Moment:
Accounting for Bank Bad Debts -
IFRS 39 & IFRS 9
23

24
Non-Impaired Financial Assets: Financial assets
which have not exhibited a significant increase in
credit risk. Allowance for Credit Losses (ACL) for
Stage 1 loans represent Expected Credit Losses
(ECL) over the next twelve months for the underlying
asset
Financial Assets exhibiting a Significant Increase
in Credit Risk (‘SICR’): While each bank may have
its own internal modeling for SICR events, the most
relevant metric for determining a significant increase
in credit risk is days in arrears with banks typically
setting a threshold of 30 days in arrears. ACLs for
Stage 2 loans represent ECLs over the life of the
underlying asset
Impaired Financial Assets: ACLs for Stage 3 loans,
which are classified as impaired, represent lifetime
ECLs and are equivalent to the prior accounting
standard for PCLs under IAS 39
Stage 1
Stage 2
Stage 3
Banks: IFRS 9 Offers A Lot of Flexibility

25
Stage 3
Stage
2
Stage 1
Visualizing the Impact of Migration on PCLs

26
National Bank
RBC
Bank of Montreal Scotiabank
CIBC
TD Bank
More Conservative Less Conservative
Potential Sensitivity to Performing Loan Losses
• Key factors: higher portion of stage 2/3 loans; % of deferred
loans in stage 2; pessimistic FLIs; higher weighting to
adverse case; and lower threshold for SICR events

COVID 19 Deferrals: Big Six Banks
• More deferred loans = more risk. Higher percentage of deferred
loans in Stage 2 highlights more conservative provisioning for
performing loans
• Deferrals largely expire by the end of Q4-F20
• Scotiabank and RBC had the highest percentage of deferred loans
As % of total
loans Q2-F20BMO BNS CM NA RY TD Consolidated
RESL3.9% 7.7% 8.0% 2.3% 6.1% 4.7% 5.8%
Credit Cards0.1% 0.6% 0.0% 0.0% 0.2% - 0.2%
Other
Personal 0.6% 1.2% 0.2% 0.0%1 0.6%2 0.3%3 0.5%
Non-retail2.3% 2.5% 1.0% 2.8% 2.5% 1.5% 2.0%
Total Q2-F206.8% 12.0% 9.2% 5.0% 9.3% 6.5% 8.6%
27

28
Big Six Banks – Deferred vs. Stage 2 Loans
29
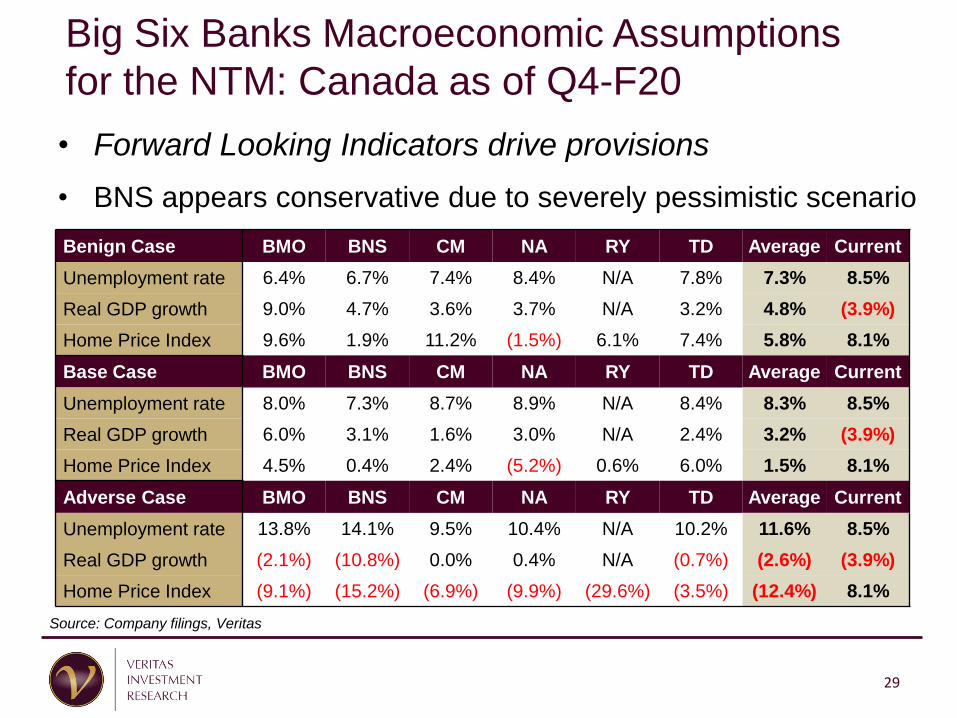
Big Six Banks Macroeconomic Assumptions
for the NTM: Canada as of Q4-F20
Benign Case BMO BNS CM NA RY TD Average Current
Unemployment rate 6.4% 6.7% 7.4% 8.4% N/A 7.8% 7.3% 8.5%
Real GDP growth 9.0% 4.7% 3.6% 3.7% N/A 3.2% 4.8% (3.9%)
Home Price Index 9.6% 1.9% 11.2% (1.5%) 6.1% 7.4% 5.8% 8.1%
Base Case BMO BNS CM NA RY TD Average Current
Unemployment rate 8.0% 7.3% 8.7% 8.9% N/A 8.4% 8.3% 8.5%
Real GDP growth 6.0% 3.1% 1.6% 3.0% N/A 2.4% 3.2% (3.9%)
Home Price Index 4.5% 0.4% 2.4% (5.2%) 0.6% 6.0% 1.5% 8.1%
Adverse Case BMO BNS CM NA RY TD Average Current
Unemployment rate 13.8% 14.1% 9.5% 10.4% N/A 10.2% 11.6% 8.5%
Real GDP growth (2.1%) (10.8%) 0.0% 0.4% N/A (0.7%) (2.6%) (3.9%)
Home Price Index (9.1%) (15.2%) (6.9%) (9.9%) (29.6%) (3.5%) (12.4%) 8.1%
Source: Company filings, Veritas
• Forward Looking Indicators drive provisions
• BNS appears conservative due to severely pessimistic scenario

30
Big Six Banks Macroeconomic Assumptions
for the Medium-Term: Canada as of Q4-F20
Benign Case BMO1 BNS CM NA RY TD3 Average Current4
Unemployment rate 5.9% 4.7% 5.9% 7.3% N/A 5.7% 5.9% 8.5%
Real GDP growth 4.0% 2.7% 4.6% 2.8% N/A 2.8% 3.4% (3.9%)
Home Price Index 5.4% 3.3% 10.4% 2.9% 11.1% 3.1% 6.0% 8.1%
Base Case BMO1 BNS CM NA RY TD3 Average Current4
Unemployment rate 7.1% 5.5% 6.7% 8.0% N/A 6.1% 6.7% 8.5%
Real GDP growth 3.0% 2.2% 3.8% 2.6% N/A 2.2% 2.8% (3.9%)
Home Price Index 2.5% 2.8% 3.0% 2.4% 4.5% 1.1% 2.7% 8.1%
Adverse Case BMO1 BNS2 CM NA RY TD3 Average Current4
Unemployment rate 13.9% 7.1% 8.4% 9.8% N/A 6.2% 9.1% 8.5%
Real GDP growth 0.8% 6.4% 2.0% 2.7% N/A 2.9% 3.0% (3.9%)
Home Price Index (4.6%) 6.8% (0.8%) (0.1%) 2.9% 3.5% 1.3% 8.1%
GDP growth for Q1-2020 provided by Statistics Canada, and YoY change in Teranet – National Bank Housing Price Index as of May 2020 1BMO’s assumptions are for calendar 20212BNS’ adverse case represents severe pessimistic scenario3TD uses average home price instead of a Home Price Index for its macroeconomic forecast4Unemployment rate for May 2020 provided by Statistics Canada, Annualized Real
Source: Company filings, Veritas

31
Reported Allowance 100% base case 100% adverse case
BMO 3,075 2,375 4,875
Difference (22.8%) 58.50%
RY 5,313 4,707 NA
Difference (11.4%) -
BNS 5,863 5,407 7,807
Difference (7.8%) 33.20%
CM 2,806 2,602 3,744
Difference (7.3%) 33.40%
NA 1,029 958 1,279
Difference (6.9%) 24.30%
TD 8,500 8,157 NA
Difference (4.0%) -
Source: Company filings, Veritas
Scenario Weighting Matters
• Excess of reported allowance vs. base case highlights more
conservative provisioning for performing loans

BNS: Making Adjustments
• Consider adjustments to Adjusted EPS
• Scotiabank’s adjusted EPS for Q1-F20 would have fallen well-short of
consensus estimates of $1.75 absent:
• The exclusion of negative impact to provisions from update to ECL
model;
• Positive impact from elimination of a one-month reporting lag in
subs;
• The exclusion of negative impact of a derivatives valuation
adjustment
Items of NoteDiluted
Adjusted EPS
Reported diluted adjusted income $1.83
PCLs related to ‘Severe Pessimistic’ Scenario ($0.09)
One-month reporting lag elimination for Mexico ($0.03)
Derivatives valuation adjustment ($0.07)
Total $1.64
32

Organic Revenue Growth Tricks
33

Not all SSSG Is Created Equal• Carefully read the SSSG definition. Assess the magnitude of
‘overstatement’ by considering the number of closed restaurants
CompanyInclude/Exclude
closed stores?Latest SSS %
Latest SSS
reporting period
% Closed Store/
System-wide
Starbucks Included -43%Month of May
20205%
McDonalds Included -21%Month of
May 31, 202010%
A&W Revenue Royalties Income Fund Included -4%3-Months to
Mar. 22, 202012%
Boston Pizza Royalties Income Fund Included -55%Month of
May 202025%
MTY Food Group Excluded N/D *Quarter ended
Feb. 29, 202029%
Pizza Pizza Royalty Corp. Excluded -26%Month of
April 202033%
Restaurant Brands -Tim Hortons
CanadaExcluded -25%
Third week of
May 202010%
Restaurant Brands -Burger King US Excluded -5%Third week of
May 202010%
Recipe Unlimited Corporation Excluded -27%Week ended
Mar. 15, 202042%
34

PBH: Adjusting for Sales We Would Have Made
Source: Company filings, Veritas
•Watch out for made-up revenues
• PBH reported organic revenue growth rate of 10%,
including $131m of sales they estimate were lost due to
COVID
In millions of Canadian dollars Q2-F20
Q2-F20 total organic revenue 1,037
Less: mgmt's estimate of lost sales due to COVID, included above (131)
Q2-F20 actual organic revenue 906
Q2-F19 revenue 945
Actual organic revenue growth in Q2-F20 -4%
Reported organic revenue growth in Q2-F20 10%
35
Note Disclosure Insights
36

CEMEX: Going Concern Note (year-end)
• Understanding key risks
2019 REPORT OF INDEPENDENT REGISTERED PUBLIC ACCOUNTING
FIRM
Going concern
The accompanying consolidated financial statements have been
prepared assuming that the Company will continue as a going concern.
As discussed in Note 26 to the consolidated financial statements, the
Company´s future compliance with financial covenants under the 2017
Credit Agreement is uncertain given the impact of COVID-19. The
Company plans with regard to this matter, which includes its request of
lenders under the 2017 Credit Agreement to modify the related financial
covenants, are described in the Note 26. This condition raises
substantial doubt about the Company´s ability to continue as a going
concern. The Consolidated financial statements do not include any
adjustments that might result from the outcome of this uncertainty.
37

Sorrento Therapeutics:
Going Concern Note (mid-year)
• Understanding key risks and plans to resolve them. Mid-
year disclosure suggests greater risk
Liquidity and Going Concern Q3-F20
As a result of our recurring losses from operations, recurring negative
cash flows from operations and substantial cumulative losses, there is
uncertainty regarding our ability to maintain liquidity sufficient to operate
our business effectively, which raises substantial doubt about our ability
to continue as a going concern… Furthermore, the spread of COVID-19,
which has caused a broad impact globally, may materially affect the
Company economically… reducing the Company’s ability to access
capital, which could, in the future, negatively affect its liquidity…The
Company has plans in place to obtain sufficient additional fundraising.
38

Inflating Cash Flow
39

GFL: Inflating Free Cash Flow
• Check what’s not included in FCF
• The exclusion of certain interest, leases and early prepayments/
unsustainable income from high cash balance inflate FCFE
in millions of USD Q3-F20
Free cash flow to equity - reported 177
Tangible Equity Units - debt component * (16)
Normalized additional interest ** (29)
Repayment of lease obligations (13)
Adjusted Free Cash Flow to Equity 119
Boost to Free Cash Flow to Equity 48%
Paid In Kind notes - effective Q4 accrete at 7% or $56m/yr (14)
* Quarterly interest and principal repayments. $172m debt component matures in Mar 2023.
** Q3 interest paid of $36M implies annualized cash interest cost of only 2.6%. Per note, the
effective rate is 4.3% or ~$65m/quarter. Made interest pre-payment with proceeds from the IPO.
40
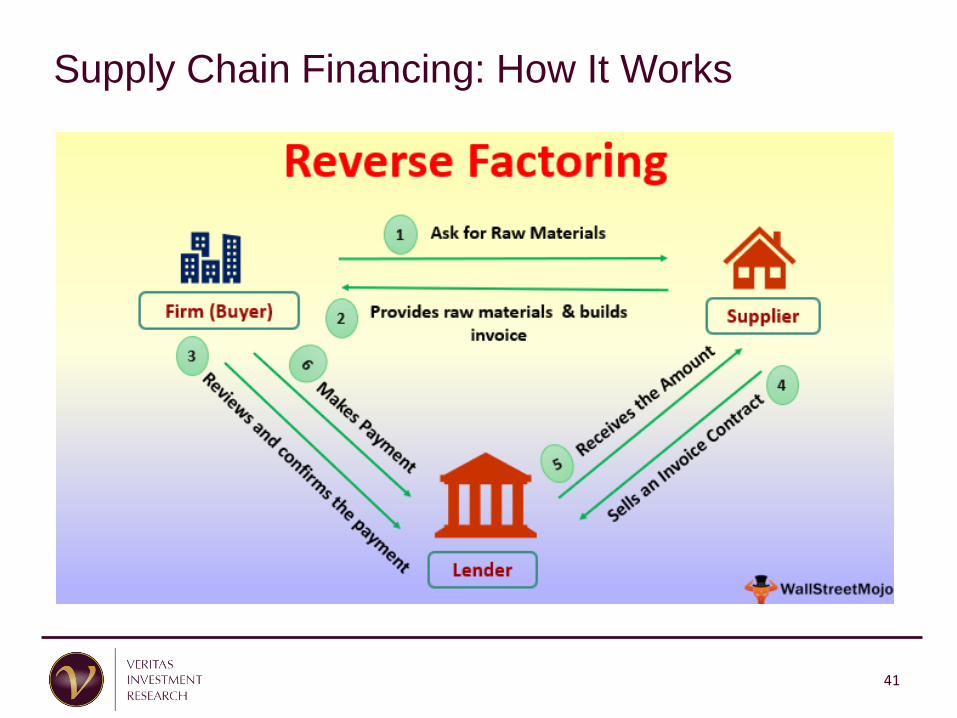
Supply Chain Financing: How It Works
41

Supply Chain Financing
• Akin to revolving line of credit but recorded in payables -companies borrow money to pay their bills
• Extend payment terms
• Often undisclosed
• No uniform definition of when it should be classified as debt
• Impact: Increased cash flow, reduced debt, improvedleverage
• Risks:• Availability
• Shortening of payment terms
• Negative impact on operating cash flow in a downturn
• The SEC is cracking down on supply chain financing
• Look for increase in “other” payables and DPO
42

Business: Engineering & construction, maintaining of
infrastructure assets and concession investments
Market cap: ~£2 billion
Number of employees: 46,000
Liquidated: January 2018
Catalysts: cash losses on major construction projects and
curtailment of reverse factoring facility
43
Carillion Case Study

Carillion: When Words Diverge From Deeds
Carillion 2016 annual report:
• We believe that good governance is an essential part of the way
we undertake our business on a day-to-day basis, while
maintaining effective risk management, control and
accountability…
44

Carillion: Learning points / Key Takeaways
• Aggressive revenue recognition disguised by reverse
factoring
• IFRS operating cash flow manipulated through reverse
factoring
• Reported Days Payables Outstanding (DPO) excluded
key account and distorted trend analysis
• Supply chain financing cut back when need it most
• Blue chip board means nothing
• Management compensation did not reward actual
performance
45

Carillion: Why Did it Fail in H1-F17?
• ~£1 billion loss due to deterioration in the cash flows on four major
construction contracts
• 2017 full-year net debt expected to be between £825m and
£850m, compared to £219m in 2016.
• Banks cut down on Carillion’s reverse factoring facility
46

Carillion: How Did We Get There?
• No signs of a blow-up: Headline numbers don’t tell the full story
• IFRS net operating cash flow was positive
• DSO/DPO moved in right direction
• An increase in net debt offset by higher EBITDA
*Trade and construction receivables
** Trade payables. Material ‘other’ payables were excluded.
In millions of pounds, except
Days Sales and Payable
Outstanding
2016 2015 2014 2013 2012
Increase
through
2016
Increase
through
2015
Days Sales Outstanding as per
management's methodology *70 59 71 66 58 21% 2%
Days Payable Outstanding as
per management
methodology**
83 75 88 80 86 -4% -12%
Operating cash flow (IFRS) 73 73 124 (78) (26) n/m n/m
Net debt 219 170 177 215 156 41% 9%
47

Carillion: Flawed Definitions of DSO/DPO
• Definitions matter
• Days Sales Outstanding (Debtor Days) and Days Payables (Creditor Days) were crucial to detecting a brewing blow-up, but reported numbers showed no warning signs
• Red flags - DSO: Days Sales excluded declines in customer advances. Group (total) revenue muted the problems at construction division
• Red flags – DPO: Days Payable excluded “other” payables
48

Carillion: The Rise of Supply Chain Financing
2014 annual report:The introduction of Carillion’s Early Payment Facility (EPF) at the beginning of 2013 has
also proved to be extremely popular with suppliers…
…suppliers can choose when they take payments in respect of approved invoices and if
they wish to take them even earlier, they can do so at minimal cost…
…Our Early Payment Facility (EPF), which is now used by 396 suppliers and through
which we have made payments totaling £977.6 million in 2014.
2015 annual report:Our Early Payment Facility was extended in 2015 to cover 60 per cent of our UK external
spend with suppliers…
2016 annual report:…our Early Payment Facility, allows our supply chain partners access to their payments
ahead of their contractual terms, reducing their need for working capital and helping them
grow and sustain local communities.
49

Carillion: Supply Chain Financing to the Rescue
• Increasing reliance on reverse factoring may be
dangerous and obscures the impact of rising receivables
• Reverse factoring was rising as a % of relevant costs as cash
outflows were deferred (to be paid in future periods)
• Reduced access to reverse factoring facility could create a cash
crunch
In millions of pounds 2016 2015 2014 2013 2012
Other creditors - reverse
factoring 761 562 511 405 263
CoGS excl. wages,
depreciation3,084 2,665 2,364 2,212 2,487
Other payables as % of
relevant costs 25% 21% 22% 18% 11%
50

Carillion: Disclosure Hides Reverse Factoring
• Include all relevant payables in DPO analysis
• Reported Days Payable excluded ‘other’ payables, obscuringthe impact of reverse factoring
• The line of credit to finance an Early Payment Facility was buried in‘other’ payables
2016 2015 2014 2013 2012
Increase
through
2016
Increase
through
2015
DPO - Trade * 83 75 88 80 86 -4% -12%
DPO – Other ** 90 77 79 67 39 133% 99%
DPO trade and
other 173 152 167 147 125 39% 22%
*Denominator: CoGS + admin expenses
** Denominator: CoGS
51

Carillion: The Missing Link
• When IFRS operating cash flow does not tell the wholestory: Increase in construction receivables was more thanoffset by increased reverse factoring activity
• The result: stable/rising operating cash flow
52

Carillion: Will the Real Debt Please Stand Up
• Make sure to include all debt-like elements in the
leverage ratio
• Reported net debt materially understated the real leverage by
excluding bank financing related to reverse factoring
53
2016 2015 2014 2013 2012
Net debt to EBITDA - reported 0.8 0.6 0.7 0.8 0.6
Net debt to EBITDA - adjusted 2.5 1.7 1.7 1.4 0.6

Carillion: Blue Chip Board Means Nothing
• Board Chairman: Advisor to the Prime Minister on Corporate
Responsibility; former CEO and COO at very large UK and
multinational companies
• Chairman of Audit Committee: Member of the Council of The
Institute of Chartered Accountants; experience as CEO and CFO at
FTSE 100 international business; chaired audit committees at two
other major companies
• Chairman of Remuneration Committee: Chief People Officer and
member of Executive Committee at an iconic multi-billion corporation
• Other members: UK Government Lead Non-Executive Director for
the Scotland Office and Office of the Advocate General; Vice
President Strategy, Royal Dutch Shell, etc…
• Blast from the past: Valeant, SNC…
54

Carillion: Management Compensation Red Flags
• Consider key metrics used in management compensation
• ‘EPS’ was based on non-IFRS
‘underlying earnings’. IFRS based
EPS was substantially lower
• Cash conversion did not reflect net
operating cash flow
• Net debt excluded reverse factoring
facility
55

Carillion: Management Compensation Red Flags
Cash conversion not reflective of actual net operating cash flow
• Defined as: non-IFRS cash from operations / non-IFRS profit from
operations
• Excludes taxes and interest
• Excludes cash restructuring costs
• Includes gross proceeds on sale of JVs and other investments (vs.
gains net of costs of £12 million and £37 million in 2016 and 2015,
respectively
• Net operating cash flow was £73 million in each of 2016 and 2015
56

Business: electronic payment processing, issuing virtual
prepaid credit cards and provision of online payment risk
management services
Market cap: €24 billion
Number of employees: 5,300
Bankruptcy: June 2020
Catalysts: Delayed 2019 filings with no sign-off from
auditors, missing cash, fictitious assets, fraudulent revenue
and regulatory capital transactions
57
Wirecard AG Case Study

Wirecard AG: When Analysis Fails
Negative market commentaries, including from leading
business newspapers, published in each year since 2012
58

Wirecard: Key Takeaways
• No red flags in consolidated financials• Growing cash balance; positive IFRS cash flow; growing IFRS net
income; sensible EBITDA adjustments
• Fraud that faked cash balances, cash flow and carefully avoided
disclosure related to acquisitions
• Local regulatory filings are key to detect irregularities• Great Indian Retail Group and Trans Infotech acquisitions
• Poor corporate governance: Lack of disciplinary actions at the
top to punish wrongdoing in South Asian division
• Management’s attitude: aggressive attacks on journalists
• The word “audited” matters: final press release before blow up
omitted the word “audited”
59

Wirecard: Unusual Deal Making
Wirecard was a serial acquiror, making numerous
individually immaterial acquisitions. Yet digging in these
acquisitions revealed significant red flags
Trans Infotech Acquisition in 2012
• Price: €25 million, or ~2% of Wirecard’s market cap.
• Revelations from Trans Infotech’s regulatory filings:
• A portion of purchase price paid before acquisition to finance
customer relationship assets
• Going concern problem
• Unable to finance growth on its own
60

Wirecard: Unusual Deal Making
Acquisition of Great Indian (GI) Retail Group and GI Technology inOctober 2015 and March 2016, respectively and Star Global CurrencyExchange
• E-commerce payment services and virtual prepaid credit cards
• Price: €230M cash + €110M contingent consideration, including acapital contribution to GI Technology ahead of purchase
61
Great lndian (Gl) Retail Group
Hermes i Tickets
Gl Technology Private Limited
Star Global Currency Exchange

Wirecard: Great Indian Retail Group
• Red flags revealed from local regulatory filings:
• Significant accounting errors in 2014 at major GI sub
(Hermes I Tickets)
• Auditor resignation in 2015
• Per Wirecard: formality
• Payment processing business was a small portion of
acquired operations (e-ticket sales were core)
62

Great Indian Price Discrepancy
• Local regulatory filings revealed price discrepancies
• Cash spent per Wirecard FS much higher than proceeds received by GI
Hermes i Tickets + GI Technology
Proceeds from sale of investment in subsidiary in rupees (Hermes) 2,749,940,988
€ conversion rate 0.014
Proceeds in € 37,674,192
Star Global
Number of shares 504,999
Value per share 100
Investment value in rupees 50,499,900
€ conversion rate 0.013
Investment value in € 664,074
Total proceeds to GI in € 38,338,265
Total purchase price in € 340,000,000
Difference price paid vs. received by sellers in € 301,661,735
63
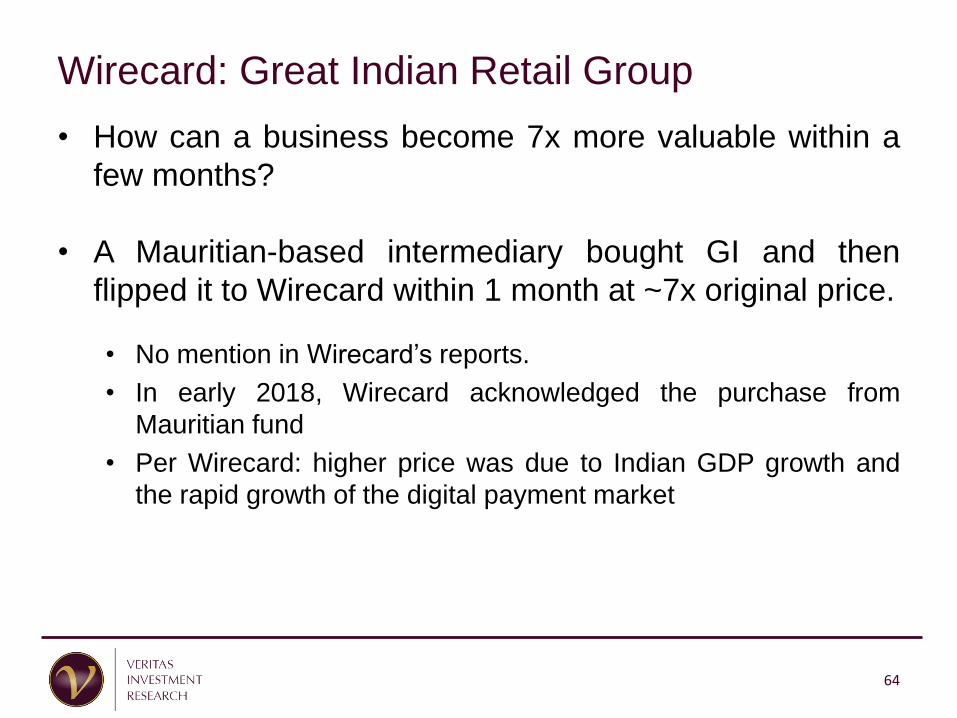
Wirecard: Great Indian Retail Group
• How can a business become 7x more valuable within a
few months?
• A Mauritian-based intermediary bought GI and then
flipped it to Wirecard within 1 month at ~7x original price.
• No mention in Wirecard’s reports.
• In early 2018, Wirecard acknowledged the purchase from
Mauritian fund
• Per Wirecard: higher price was due to Indian GDP growth and
the rapid growth of the digital payment market
64

Wirecard: Allegations of Fraud in Asia Division
• Do not dismiss weak internal controls and corporate governance
even if related errors appear ‘immaterial’
• FT publication from January 2019:
• No actions were taken against Singapore executive suspected of
repeatedly using fake and backdated contracts after internal
investigation commissioned from outside law firm found: “serious
offences of forgery and/or of falsification of accounts”
• Not an isolated event at Wirecard’s Asian operations
• Senior management in Germany (incl. COO, treasurer and head of
accounting) were aware of questionable transactions
• Whistleblowers concerned with no action
• Wirecard’s reaction:
• Immaterial and “…false, inaccurate, misleading and defamatory“
• Sued FT for "unethical reporting" and market manipulation
65

Wirecard: When “Audited” Matters
“Audited” matters, as Wirecard neared bankruptcy andaudited statements were delayed:
• 14 February 2020: “The audited consolidated financial statementsfor 2019 will be published on April 8, 2020.”
• 25 May 2020: Consolidated financial statements 2019 so far withoutmaterial findings; Company expects an unqualified audit opinion
• 3 June 2020 news release (€90/share): “Wirecard will providedetailed reports on growth plans and intended structural measuresat the presentation of its annual financial statement 2019 on June18, 2020.”
66

Final Takeaways
67

2021 Watch List
• Non-GAAP metrics:
• Calculations or formulae, changes, presentation, prominence.
• Exclusion of essential costs; inclusion of subsidies; material lease payments not
captured; SSSG not capturing all the business; non-GAAP revenue recognition
• Revenue
• Provisions for bad debt vs. collections vs. peers; inventory trends
• Capitalized costs
• Going concern notes
• Change in accounting assumptions
• Acquisitions games to hide negative organic growth and boost
earnings
• Misaligned management compensation and change in compensation
structure / metrics
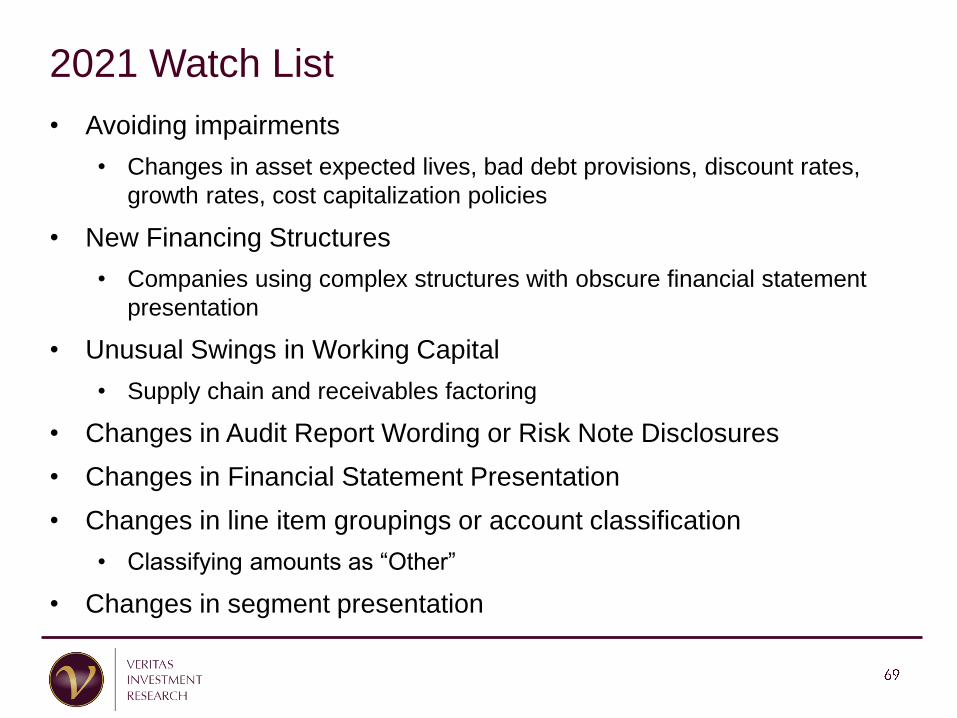
2021 Watch List
• Avoiding impairments
• Changes in asset expected lives, bad debt provisions, discount rates,
growth rates, cost capitalization policies
• New Financing Structures
• Companies using complex structures with obscure financial statement
presentation
• Unusual Swings in Working Capital
• Supply chain and receivables factoring
• Changes in Audit Report Wording or Risk Note Disclosures
• Changes in Financial Statement Presentation
• Changes in line item groupings or account classification
• Classifying amounts as “Other”
• Changes in segment presentation

Forensic Accounting Toolbox
There are no rules only tools
Look for what is not included in the
financial statements
Develop critical questions not certain answers
Ask Better Questions → Make Better Decisions → Get Better Results
70

Flammable Items - What Are We Looking For?
Red Flags Examples
• Aggressive accounting/estimates, incl. non-GAAP metrics
• Opaque disclosures
• High debt
• Negative free cash flow
• Material disconnect between earnings and cash flow
• Flawed executive compensation program
• Change in management’s tone/strategic focus
• Departure of key executives/board members
• Change in auditor

Flammable Items: Red Flags Examples
(Continued) • Strategic reliance on acquisitions or asset sales
• Weak internal controls/governance
• Decentralized reporting structure, coupled with up or out employee
culture
• Insider stock sales
• Powerful CEO/weak CFO
• Adversarial management team
• Excessive concern over stock price
• High/low analyst expectations; unanimous BUY/SELL
recommendations
• Negative employee/supplier/competitor feedback

Aggressive Accounting Implies Deeper Problems

Don’t Blindly Trust the Story: Corroboration Is Key
A
A
A
A
Underwriters
Analysts
Experts
Auditor
Story
Fact
FactFact
Fact

Questions?
75

76
Veritas Investment Research Corporation ("Veritas") its directors, officers, employees and their spouses,
dependent children, and other dependents are prohibited from trading any position in the securities of companies
on Veritas’ restricted trading list. In addition, Veritas’ Analysts and Associates, as well as their spouses,
dependent children, and other dependents ("Persons Restricted by Coverage") are prohibited from holding and
trading any position in the securities of companies which they cover, including in any accounts for which the
Analysts and Associates have trading authority. Persons Restricted by Coverage are permitted to hold or trade
ETFs or Investment Funds that may hold the securities under their coverage. Veritas has not offered any
consulting, financial advisory, investment banking or underwriting services to any company profiled in this report.
Veritas has not accepted, and will not accept, fees from any company profiled in this report for the preparation of
this report. The information contained in this report has been obtained from sources believed reliable however the
accuracy and/or completeness of the information is not guaranteed by Veritas, nor does Veritas assume any
responsibility or liability whatsoever. All opinions expressed are subject to change without notification. This report
is for information purposes only and does not constitute and should in no way be construed as a solicitation to buy
or sell any of the securities mentioned herein. The contents of this research report do not, in any way, purport to
include any manner of legal advice or opinion. The intention of this report is to provide a forthright discussion of
business, accounting and financial reporting issues, as well as generally accepted accounting principles and the
limits of their usefulness to investors. As such, please do not infer from this report that the accounting policies of
any company mentioned herein are not allowed within the broad range of generally accepted accounting
principles, or that the policies employed by that company were not approved by its auditor(s). Veritas Asset
Management Inc. (“VAM”), an affiliate of Veritas by virtue of being under common control that may also from time
to time have certain common directors, officers and/or employees, is registered in Ontario as a Portfolio Manager,
Investment Fund Manager and Exempt Market Dealer (with the same or similar registrations in certain other
jurisdictions in Canada) and may, from time to time, advise and counsel its investment clients, including one or
more investment funds established by VAM, with respect to investments in public companies. VAM is a client of
Veritas and receives research reports from Veritas at the same time as Veritas’ other clients. Veritas and VAM
have implemented policies and procedures to minimize the potential for and to address conflicts of interest, which
are available to clients of Veritas upon request. This report may not be reproduced in whole or in part without the
express prior written consent of Veritas. Veritas is a 100% employee owned firm. ©2021 Veritas Investment
Research Corporation.