distortions to agricultural incentives in...
TRANSCRIPT

Distortions to Agricultural Incentives in Zambia
Peter Robinson, Jones Govereh and Daniel Ndlela
Zimconsult, Harare [email protected]
Research Associate, Michigan State University, Lusaka
Zimconsult, Harare [email protected]
Agricultural Distortions Working Paper 40, December 2007 This is a product of a research project on Distortions to Agricultural Incentives, under the leadership of Kym Anderson of the World Bank’s Development Research Group. The authors are grateful for helpful comments from workshop participants including Marianne Kurzweil and Ernesto Valenzuela, and for funding from World Bank Trust Funds provided by the governments of Ireland, Japan, the Netherlands (BNPP) and the United Kingdom (DfID). This Working Paper series is designed to promptly disseminate the findings of work in progress for comment before they are finalized. The views expressed are the authors’ alone and not necessarily those of the World Bank and its Executive Directors, nor the countries they represent, nor of the countries providing the trust funds for this research project.
Pub
lic D
iscl
osur
e A
utho
rized
Pub
lic D
iscl
osur
e A
utho
rized
Pub
lic D
iscl
osur
e A
utho
rized
Pub
lic D
iscl
osur
e A
utho
rized
Pub
lic D
iscl
osur
e A
utho
rized
Pub
lic D
iscl
osur
e A
utho
rized
Pub
lic D
iscl
osur
e A
utho
rized
Pub
lic D
iscl
osur
e A
utho
rized

Distortions to Agricultural Incentives in Zambia
Peter Robinson, Jones Govereh and Daniel Ndlela Zambia is a landlocked country in central Africa with a population of 12 million people. The
country has abundant land resources (74 million hectares, 47 percent of which is suitable for
agriculture), favorable soils, relatively good rainfall (averaging over 1,000 mm/year) and low
population density (6.4 ha per person) (World Bank 2006, FAO 2006). A study of regional
integration potential in southern Africa concluded that Zambia has the natural resources to be a
major food and agricultural producer for the region (African Development Bank 1993), but this
potential has never been realized. One important reason for this has been the dominance of
copper in the economy. Despite providing a livelihood to the majority of the population, as an
export sector agriculture has always been subsidiary to mining.
During the colonial period, agriculture was developed primarily to serve the mining
sector. Development was limited to the areas close to the line of rail running through the copper
belt and the capital city, Lusaka, to Livingstone (near the Victoria Falls on the Zambezi River).
After independence, a more widespread form of development was intended, but squandering of
the copper wealth in the first decade of independence (1964-1974), when copper prices were
high, was followed by a long period of economic turmoil and decline after the collapse of the
copper price in 1975 (Appendix Figure 1). A change of government at the end of 1991 resulted
in the interventionist policies of the past being replaced by an orientation towards an open, more
liberalized economy.
Changes in agricultural policies started earlier, and agricultural growth has been
relatively high since the mid-1980s. By early in the twenty-first century, the share of agriculture
in GDP had risen to 20 percent. From the viewpoint of diversifying away from dependence on
copper, a more significant change was the growth of agricultural exports, from $10 million in
1987 to $222 million in 2004.1 However, despite recent progress, agriculture is still far from
1 Throughout the report, ‘$’ refers to US$ and uncited values and growth rates are from World Bank (2006).

2
attaining its full potential as a contributor to the economy and to the well-being of the majority
of the population whose livelihood depends directly on it.
In the first decade after independence, GDP grew at an average of 5.6 percent per year.
From 1975, when the price of copper collapsed, through to 1999, average GDP growth was only
0.6 percent. Since 2000, this has risen to 4.5 percent, and the incidence of extreme poverty has
declined slightly to 53 percent (Government of Zambia data). The IMF estimates GDP growth of
close to 6 percent in 2006.
Agricultural GDP growth rates have followed a different pattern to GDP as a whole.
From 1971 to 1984, the average annual growth of agricultural GDP was 2 percent. Thereafter,
there were two five-year periods of much stronger growth (1985-89 at 5.3 percent and 1995-99
at 7.7 percent). The period 1990-1994 produced an average growth of only 2.5 percent, but this
was due to the devastating drought in 1992 (when agricultural GDP declined by one-third) and a
severe drought in 1994 (when agricultural GDP declined by one-fifth).
Despite these and other less significant drought episodes, agriculture’s contribution to
GDP grew between 1985 and 2000 in real terms (see Appendix Figure 2) and as a share of total
GDP (from 15 to 20 percent). That increased agricultural output has come principally from crops
other than maize (c.f. Appendix Figures 2 and 3). This is further illustrated by the fact that the
share of maize in the value of production of key crops has fallen from nearly 80 percent in the
early 1980s to barely 50 percent by 2005 (even though the share of maize in household
consumption has remained much more stable – c.f. Appendix Figures 4 and 5).2
The growth of the agricultural sector is due not only to the changes in agricultural
incentives that are presented in this chapter. The calculations show that agricultural incentives
have been depressed over the entire study period (1955-2005). Negative assistance to agriculture
was particularly evident in the 1970s and 1980s, but even after the opening up of the economy in
the 1990s, agricultural producers have generally continued to receive prices that are well below
border equivalents. There are three main reasons for this: the direct influence of agricultural
policies, the monopsonistic structure of agricultural markets, and the indirect but significant
influence of macro-economic mismanagement, giving rise to the currency being almost always
overvalued throughout the five decades covered by the study.
2 Detailed analysis of changes in cropping mix amongst small-scale farmers is available in Zulu et al. (2000).

3
As is discussed in detail later, currency misalignment is significant from the mid-1960s to
the mid-1990s, accounting for half or more of the magnitude of the distortions in the 1970s and
1980s. Even after the parallel market and official rates converged in the late 1990s (thereby
eliminating currency overvaluation from the calculated distortion measures using the project’s
chosen methodology), there is still reason to suppose that the Kwacha remained overvalued,
depressing agricultural incentives more than has been estimated using the available data.
While the calculations indicate that farmers were most heavily taxed in the 1970s and
1980s, it is important to note that the common perception amongst the farming community,
especially smallholder farmers, was that these were the glory decades for farming. Land was
even more abundant than it is now, and trading costs were low because the state agency,
NAMBOARD, maintained a wide network of depots from which it delivered fertilizer, seed and
other inputs and purchased the crop at the farm gate, not at the depot. NAMBOARD, with its
deficits met by taxpayers, absorbed the transport costs and was not seeking to make a margin on
transactions.
The terms of trade for farmers therefore were perceived to be relatively favorable in the
1970s and 1980s, whereas in the 1990s and beyond farmers are of the view that they have to deal
with ‘unscrupulous’ businessmen, many of whom are not involved in the agricultural sector on a
long-term basis. Contrary to what might have been predicted, private marketing costs may have
increased after liberalization; and certainly a much higher level of risk has been passed on to
farmers.
Over the five decades covered by the study, changes in agricultural and food policies
have at no stage brought unambiguous improvements in the lot of the small-scale farmer. The
extent to which agriculture and food policies have been conducive to the achievement of national
socio-economic goals has been the subject of a number of in-depth studies.3 The broad-brush
picture is that the failure to achieve anything like the potential of Zambia’s agricultural sector,
coupled with largely perverse effects of subsidies and other interventions in food markets, have
imposed immense costs on the economy and account to a significant extent for the widespread
persistence of poverty.
3 See papers produced by the Food Security Research Project (FSRP), a collaboration between the Agricultural Consultative Forum, the Ministry of Agriculture and Cooperatives, Michigan State University and USAID in Lusaka. FSRP papers a down-loadable from http://www.aec.msu.edu/agecon/fs2/zambia/index.htm

4
This is not to say that some policies and actions did not aim to promote agriculture and to
alleviate poverty. However, the pattern of public expenditure reflected misplaced priorities,
focusing on subsidies requiring large recurrent expenditures and delivering restricted benefits
instead of productive investments with more widespread developmental consequences.
Channeling resources into long-term investments in infrastructure, extension and market
development would have had a larger payoff. The recurrent expenditures also invariably
exacerbated differentials, further entrenching dualism. Prior to independence almost all benefits
went to European farmers, while after 1964 those subsidies and policies which did benefit
producers also disproportionately favored farmers located close to the line of rail, who have
better access to inputs, transport and marketing services.4
In recent years rapid decreases in poverty have been measured in some rural areas due to
rapid growth in output, but this has been very unevenly distributed.5 The liberalization of the
maize market and the emergence of hammermills able to compete favorably with industrial mills
on price and nutritional quality have benefitted those rural households that are net food
purchasers plus urban households. However, the removal in the early 1990s of the maize meal
subsidies (which had proved unsustainable in the late 1980s) coincided with the loss of
employment associated with public sector reform and closures of manufacturing firms that were
unable to compete with rapidly liberalized imports. Urban poverty thus rose rapidly in the early
1990s (McCullogh, Baulch and Cherel-Robson 2001).
Agricultural policy in the colonial period
Commercial agriculture was started in the early years of the twentieth century to provide food to
the copper mines and the capital city. European settler farmers were settled along the rail line
and provided with various forms of assistance to encourage production of maize and other crops
to the copper belt and other urban areas. Small-scale black farmers were deliberately
4 This conclusion applies even to the effects of pan-territorial prices. See later discussion under ‘Policies behind the distortions’ and Jansen and Rukovo (1992). 5 See McCullogh Baulch and Cherel-Robson (2001), Balat and Porto (2005a) and Siegel and Alwang (2005).

5
disadvantaged, not least by being given significantly lower prices for their crops. The dualistic
agricultural structure, which constituted a basic distortion in the agricultural sector that persists
to this day, was the result of deliberate policies initiated a century ago.
The settler farmer production system was well established by the 1920s. The
international depression of the 1930s sharply reduced demand for copper. In the face of falling
demand for agricultural goods, European and African farmers suffered extreme hardship during
that period (McPherson 2004). In 1936, the government promulgated the Maize Control
Ordinance, which resulted in the formation of the Maize Control Board (MCB). Its mandate was
to stimulate production of maize while protecting European farmers from competition from
African farmers. These objectives were achieved by raising the producer price of maize above
world market levels for sales to the ‘internal pool’, three quarters of which was reserved for
European farmers. Additional maize was directed to the ‘external pool’ which involved sales at
lower export parity prices (Jansen 1991). Urban consumer prices were set at much lower levels,
with the difference being made up by substantial government subsidies to the MCB which
mainly served urban consumers.
World War II raised the demand for copper and hence for maize to such an extent that
imports became necessary. Producer prices for maize for both African and European farmers
were kept below import parity levels. While African farmers consistently received lower prices
than European farmers, small-scale African farmers in remote areas had to contend with even
lower net returns than their counterparts who were based within the MCB’s restricted area of
operations (eight districts along the rail line).
After World War II, maize production began to exceed internal demand and exports of
maize were resumed. This trend continued during the Federal period (1953-1963), with the
Federal Grain Marketing Board keeping producer prices above export parity levels. A
discriminatory element was still evident, however. “Not all producers were subsidized, nor were
they subsidized equally. The African producer price was still considerably less than the
European producer price because the government diverted part of the proceeds from sales of
domestic maize to an African farming improvement fund.” (Jansen 1991, p. 278).
Measurement of agricultural distortions, 1955 to 2004

6
The main focus of the present study (Anderson et al. 2008) is to measure the extent to which
government-imposed distortionary policies create a gap between domestic prices and what they
would be under free markets. The objective is to have simple measures of policy-induced
distortions to agricultural prices which are uniform and comparable across time periods and
between countries. Since it is not possible to understand the characteristics of agricultural
development with a sectoral view alone, the project’s methodology not only estimates the effects
of direct agricultural policy measures (including distortions in the foreign exchange market), but
it also generates estimates of distortions in non-agricultural sectors for comparative evaluation.
More specifically, this study computes a Nominal Rate of Assistance (NRA) for farmers
including an adjustment for direct interventions on inputs. It also generates an NRA for
nonagricultural tradables, for comparison with that for agricultural tradables via the calculation
of a Relative Rate of Assistance (RRA).
The basis of the approach is a comparison between the prices actually received by
producers (or paid by consumers) and the prices they would have prevailed had there been no
policy distortions. This reflects the small country assumption that the relevant opportunity costs
are reflected in the international border prices for the commodities adjusted for non-policy price
wedges (transport costs, marketing margins, quality differences, etc). Where actual import and
export prices are available, these are to be used in preference to the alternative of constructing a
synthetic cif/fob prices from international reference prices, adjusted for transport and related
costs. Details of the data sources and assumptions made to generate the NRAs are laid out in the
Appendix.
In interpreting the NRA results presented below, the reader needs to bear in mind five
points which arise from the way the domestic to border calculations have been made (as well as
the limitations due to the poor quality of some of the data).
First, the wholesale level has been chosen as the point in the value chain where the ratios
are calculated. Prior to economic liberalization, the wholesale level was constituted by the state
marketing boards, notably (for the crops covered by this study) NAMBOARD. The calculated
NRA measures thus apply to farmers close to the depots and would be lower (which in almost all
years means more negative) for farmers living further away from the depots. In order to improve

7
the position of small farmers in remote areas, the network of marketing board depots was
extended after independence into the rural areas beyond the rail line and pan-territorial pricing
introduced.
Second, for the period up to 1994, the wholesale prices used in the calculations are the
minimum guaranteed prices to farmers. Those farmers able to market their products locally, or
engage in informal cross-border trade with neighboring countries (notably the DRC and
Malawi), would have received higher prices and hence have been subject to higher (less
negative) NRAs than have been calculated. Even in the case of tobacco, which was sold at
auction, the prices available for and used in this study are the floor prices which government set
to protect farmers. In years where the floor price applied, this should be reflected in positive
rates of assistance.
Third, farmers who received inputs from NAMBOARD were required to sell their crops
through the official channels, with a ‘stop order’ system ensuring that the loans due on the inputs
were repaid. While this often may have involved low selling prices, the inputs themselves were
typically subsidized, and the farmers nonetheless may have tried to enhance their incomes by
selling at least part of their crops at higher prices.
Fourth, farmers able to store their crops until later in the season usually did much better
than farmers who were forced to sell immediately after harvest at the minimum guaranteed
prices. Studies have shown that even small farmers are well aware of the changing prices over
the season and try to delay sales, but typically have to sell a portion of their crops immediately
after the harvest at the lowest prices to raise some cash (Coulter et al. 1996, Mundia 1999). Even
where monthly producer price data are available, there is no corresponding volume data, and so
no basis to calculate a proper weighted average price for the year. Data from a 2003 survey on
the month when the household had the largest sales, however, suggest that most is sold in the
early part of the marketing season. Averaging the prices alone is obviously unsatisfactory when
there is a large range of selling prices over a particular cropping season (Appendix Figure 6).6
6 There are reasons to suspect that the price variations in Kabwe were particularly large in the 1998/99 season, one of the main ones being that the FRA imports were largely channelled to the industrial millers and did not reach the local markets. Much of the locally produced grain was probably sold early in the season due to farmers’ cash needs. So with restricted supply and increased demand (to take to hammermills), prices rose dramatically in the later months.

8
And fifth, the prices used in the calculations for maize, sorghum, wheat and sunflower
after 1994 relate to trades conducted via the Agricultural Commodity Exchange (ACE). Where
possible, these are prices from actual sales, but in some months only bid or only offer price data
are available. Here too there is the problem of annual average prices having to be calculated
without weighting by sales volumes. For these crops, any apparent improvement in NRAs is
partly due to the change from a low minimum price reference point to actual market prices
received by farmers. ACE prices are Lusaka wholesale prices, which are the highest a farmer can
get. All prices outside of Lusaka and the main Copperbelt towns will be lower.
The patterns of distortions, 1955 to 2005
The annual NRA estimates for import-competing products and exportables are illustrated in
Figure 1, while five-year averages for individual products are shown in Table 1. Year-by-year
data are given in Appendix Table 7. On a five-year average basis, the overall NRA results are
very close to (within 2 to 4 percentage points of) those calculated by Jansen (1991), the Zambia
case study in the earlier Krueger, Schiff and Valdes (1991) project.7
Positive assistance for a decade or so after the Second World War was followed by a
sustained half-century period of negative assistance to farmers. Policies encouraging import
substitution of rice and wheat did result in positive NRAs for these crops for short periods (1979-
84 and 1995-96 for rice, 1981-83, 1994-96 and 2000-04 for wheat and a few other separate years
for both commodities). Otherwise, occasional positive rates for maize, sorghum, soybeans,
cotton and tobacco are due to coincidental upward movements in domestic prices, currency
devaluation and/or reductions in the reference border prices (and vice-versa for negative spikes).
These coincidental factors are absorbed in the five-year averages presented in Table 1, where the
only positive rates are for rice (1980-84 and 1995-99) and wheat (1980-84, 1995-1999 and 2000-
04).
7 Jansen’s full set of Nominal Rates of Protection estimates for 1966-84 are given in Table 7-7 in Jansen (1991) and are extended for maize, cotton and tobacco to 1990 in Table 7 of Jansen and Rukovo (1992).

9
The patterns of assistance to or taxation of agriculture are the result of the interplay of a
number of different influences. The direct influences arise from the agricultural sector policies,
which are discussed in detail in the next two sections. In explaining the changes in NRAs, it is
not just the articulated policies that matter, but also the way they are implemented as reflected in
the institutional structures, price regulations, and financial flows to the agricultural sector
(subsidies, public sector investments, etc.). Particularly in the period since liberalization, the
impact of these policies is tempered by the nature and structure of agricultural markets. These
structural issues are important in explaining the pattern of assistance to Zambian farmers.
Another key part of the explanation for the NRA pattern lies in the indirect effects of the
macroeconomic and trade policies pursued. Detailed aspects of these are discussed below, but it
is relevant at the outset to stress that the main macroeconomic influence is via exchange rate
overvaluation. Using the crude measure of the parallel market premium, the Zambian Kwacha
appears overvalued from the early 1960s to the end of the 1990s (Appendix Figure 7). In years
where the parallel rate is way out of line with the official rate (such as 1977 or 1988), the world
parity price in Kwacha (which appears in the denominator of the NRA formula) is much higher
than the value calculated with the official exchange rate. The NRA values for years such as 1977
and 1988 is thus suddenly much more negative. This results in a mirror image downward swing
in the NRA curves, reflecting the upward swing in the exchange rate premium. Except for
import-competing products in the 1980-84 period, the growing exchange rate overvaluation over
the 1970s and 1980s amplifies what would be (at the official exchange rate) far more modest
levels of negative assistance. The progressive reduction in overvaluation since the 1980s brings
the calculated NRAs increasingly closer to what they would be had official exchange rates been
used in the calculation.
Over the whole period of the present study, the overall patterns which emerge are of
increasingly negative assistance to agriculture during the periods of dirigiste control over the
economy, which were also years of significant overvaluation of the exchange rate. Economic
liberalization is the hallmark of the Third Republic, which started in 1992. During the 1990s,
macro-economic stability was progressively restored and many of the former controls over the
economy, including those pertaining to agriculture, were unwound. As is clear from Figure 1,
these measures are less negative than in the 1980s, but they did not lead to positive NRAs for

10
agriculture, in part because government in fact adopted a half-hearted approach to liberalizing
agricultural markets.
Fertilizer and maize markets provide two key examples where the government did not
completely move out, and where full liberalization is yet to occur. However, consumers did
benefit from increased competition in the more liberalized market environment, this resulting in
lower processing and marketing margins. Ministry of Agriculture data show that real maize meal
prices had a downward trend, while real grain prices remained virtually stable between 1990 and
2005.
NRAs by commodity
Maize constitutes an average of two thirds of the total value of the commodities being studied
and hence the maize NRA to a large degree determines the overall average NRA for agriculture
as a whole. The NRA for maize suggests producer prices have been between one-fifth and two-
thirds below what they would be in an open-economy environment, peaking at -68 percent in
1985-89. The other traded cereal crops (sorghum, wheat and rice) generally have very large
negative five-year average NRAs, but in some periods they reverse to low negative or even
positive values. In the most recent ten years, the government has had a 15 percent import duty on
wheat, to compensate those farmers who have invested in wheat production but face high costs
of fuel and electricity compared with competitor wheat producers.
Amongst the traded oilseeds, the NRA for groundnuts is severely and consistently
negative, with soybeans also always negative but less severely so in the last decade. The NRAs
for the export cash crops, cotton and tobacco, tend also to be large and negative up to 1990, the
worst period being 1985-1989. Even in the most recent period, 2000-2004, tobacco NRAs are
still very negative (Burley -58 percent, Virginia -29 percent), as is the NRA for cotton (-51
percent).
Assistance patterns for tradable products and for agriculture as a whole
The patterns for import-competing products and exportables both follow the overall pattern of
exchange rate misalignment. Thus the largest negative NRA values for both were in 1985-1989,

11
followed by 1975-1979, with a continuous improvement for import-competing products since
1990. For any particular commodity, a change from import-competing to exportable would tend
to make its NRA less negative because the cif import price is almost always higher than the fob
export price. Ceterus paribus, the average NRA for import-competing products might be
expected to be more negative than the average NRA for exportables, but this is not the case for
Zambia. The reason is that in the weighted average across all import-competing products there is
a preponderance of import-competing foodstuffs which (via relatively higher producer prices)
are less taxed than exportable cash crops. By 2000-2004, the NRA for import-competing
products improves to -10 percent while the exportables’ NRA becomes even more negative than
in the 1995-99 period (-53 percent as compared with -46 percent).
The third-to-last row of Table 1 gives the weighted average rates of assistance for all of
the commodities covered in this study. This is the same as the first row in Table 2. When the
guesstimated NRAs for non-covered products (which account for between one-sixth and one-
quarter of the gross value of farm production) and for non-product-specific agricultural subsidies
are included, the sector’s negative NRA is considerably reduced. The tradables part of
agriculture is more discriminated that the nontradables part though. By contrast, the tradables
part of non-agriculture has a positive weighted average NRA, with trade taxes and distortions to
the exchange rate assisting import-competing producers more than they are hurting exporters
(mainly the mining sector). Thus the relative rate of assistance (RRA) is more negative than the
NRA for agricultural tradables (Figure 2 and Table 2).8
The growth in agriculture’s contribution to GDP and exports took off with a lag
following the changing levels of disincentives to agriculture, that is, not until the early 1990s
(Appendix Figure 2). The most significant development was the growth of floriculture and
horticulture, whose exports contributed significantly to the impressive rise in overall agricultural
exports, from under US$ 20 million in the late 1980s to over US$ 150 million per annum in the
new millennium. That represents an annual growth rate of more than 30 percent. But note that
8 Given the many assumptions behind the RRA calculations, weight needs to be given to the direction of change from the NRA numbers rather than the absolute magnitudes. In particular, the data on subsidies are not complete or consistent over the whole period. After 1990, subsidies throughout the economy were sharply reduced but in agriculture there was a continuation of some subsidies, particularly in 1992 and 1993, to counter the effects of the extreme drought. There was also significant support to the agricultural sector via the large Agriculture Sector Investment Project (ASIP) over the period 1994 to 2001. In the new millennium, subsidies to agriculture have been increased again, notably on fertilizers and other inputs.

12
floriculture and horticulture – whose NRAs have not been estimated – enjoyed special assistance
in terms of duty drawback arrangements on imported equipment and a zero rating VAT status
(claiming VAT on inputs without being charged VAT on output sold in the domestic market).
This rapid export growth occurred alongside negative NRAs for the export crops covered in this
study. Had these new industries been included, the estimated NRA for agriculture as a whole
would have been somewhat less negative.
Had the exchange rate not been distorted, the agricultural NRAs and RRA would have
been only slightly less negative (bottom rows of Table 2), suggesting that that is not the major
reason for the anti-agricultural and anti-trade bias.
Consumer tax equivalent patterns
In this study, the NRAs and CTEs are calculated at the wholesale level. Consequently, it is only
when farmers or consumers receive direct product price subsidies that the calculated primary
producer NRA will differ from the CTE. In the case of Zambia, there are no such subsidies (only
farm input subsidies) and thus the primary product CTE is always numerically identical to the
corresponding NRA. The negative assistance to the primary producer is mirrored by an implicit
subsidy of the same magnitude for the consumer. In a country where the power base of the ruling
party is drawn from the urban areas, it is not surprising that agricultural pricing policies should
have produced this result.
The only processed product for which the data exists to do a separate CTE calculation at
the retail level is maize meal. Roller meal has been chosen as the benchmark product and the
results are presented in Figure 3. The basic data used for the CTE maize calculation are the
wholesale producer price and the cif import price of maize. For the roller meal CTE calculation,
the numerator is the maize price plus processing and wholesale margins, while the denominator
is the cif price of maize meal. The subsidy is calculated as the theoretical price of roller meal
(the wholesale price of maize adjusted for the extraction rate, processing, wholesale and retail
margins) as compared with the actual retail price as given by Central Statistics Office data for
roller meal. The wholesale and retail margins are assumed fixed at 12 percent and 8 percent,
respectively, while the processing margin is assumed to be 24 percent before liberalization and
13
to adjust from 1993 so that the retail price reflects the fact that consumer subsidies were no
longer provided by government.
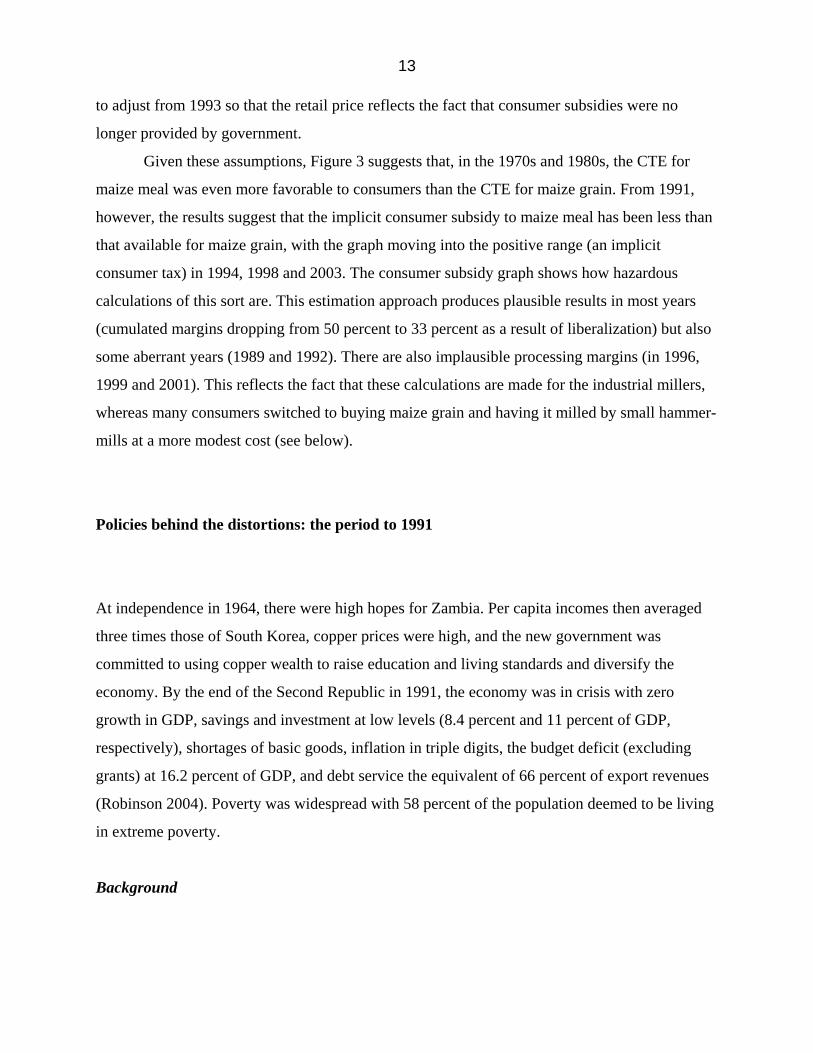
Given these assumptions, Figure 3 suggests that, in the 1970s and 1980s, the CTE for
maize meal was even more favorable to consumers than the CTE for maize grain. From 1991,
however, the results suggest that the implicit consumer subsidy to maize meal has been less than
that available for maize grain, with the graph moving into the positive range (an implicit
consumer tax) in 1994, 1998 and 2003. The consumer subsidy graph shows how hazardous
calculations of this sort are. This estimation approach produces plausible results in most years
(cumulated margins dropping from 50 percent to 33 percent as a result of liberalization) but also
some aberrant years (1989 and 1992). There are also implausible processing margins (in 1996,
1999 and 2001). This reflects the fact that these calculations are made for the industrial millers,
whereas many consumers switched to buying maize grain and having it milled by small hammer-
mills at a more modest cost (see below).
Policies behind the distortions: the period to 1991
At independence in 1964, there were high hopes for Zambia. Per capita incomes then averaged
three times those of South Korea, copper prices were high, and the new government was
committed to using copper wealth to raise education and living standards and diversify the
economy. By the end of the Second Republic in 1991, the economy was in crisis with zero
growth in GDP, savings and investment at low levels (8.4 percent and 11 percent of GDP,
respectively), shortages of basic goods, inflation in triple digits, the budget deficit (excluding
grants) at 16.2 percent of GDP, and debt service the equivalent of 66 percent of export revenues
(Robinson 2004). Poverty was widespread with 58 percent of the population deemed to be living
in extreme poverty.
Background

14
After independence in 1964, it was expected that policies would be put in place to significantly
enhance the position of black farmers. President Kaunda responded to calls to boost small-scale
agriculture by announcing a “fair price” policy for agriculture. But as McPherson (2004, p. 306)
put it, “Though originally intended to raise the prices received by African producers, the
initiative quickly became a ‘low price’ policy designed to reduce the cost of staple food for
urban workers.” This pro-urban bias, reflecting the base of political support for the ruling party,
set the tone for pricing in the Kaunda era which lasted until the end of 1991. However, to keep
farmers from becoming politically agitated, low producer prices were offset somewhat by the
provision by government of subsidized farm inputs.
In the first year of independence, the world price of copper rose by 50 percent and copper
prices remained high throughout the so-called First Republic (1964-1973). Despite the problems
associated with the imposition of international sanctions on the post-1965 illegal regime in
Rhodesia, economic conditions in independent Zambia were buoyant initially. Output of
agricultural commodities increased, though rather modestly. The five- year moving average of
total cereal production increased from 740,000 tonnes in 1964 to 850,000 tonnes in 1969 and
over 1,000,000 tonnes by 1974 (FAO data). This is equivalent to only 3.1 percent pa growth,
while the average population growth rate over the decade was 3.4 percent pa.
One of the main strategies adopted by the government to pursue its agenda of
diversifying away from copper and creating greater social equity was to have greater direct
control over the economy. After 1968, a vigorous program of nationalization was launched
through which the government acquired a majority stake in many large private enterprises and
also created a number of new parastatals. This shifted the locus of economic decision-making
decisively to the public sector, while at the same time the government became progressively
more interventionist in its approach to economic policy-making. In the agricultural sector, the
setting of producer and consumer prices for agricultural commodities became the norm, while
trade policy came to be characterized by import licensing, foreign exchange allocation and
quantitative import controls.
The start of the Second Republic in 1973 was marked by the formal introduction of a
one-party state. In the aftermath of the 1973 global oil crisis, there was a collapse of commodity
markets. The copper price fell sharply (by 40 percent in 1975), while at the same time the price
of fuel and other key imports rose sharply. Copper prices in real terms have never returned to the

15
high levels of the first decade of Zambia’s independence (although they are coming close in the
present boom period). In the mid-1970s the government assumed that low copper prices would
be a temporary phenomenon and did not therefore seek to fundamentally change the patterns of
consumption and production in the economy. In the short-term, however, levels of imports had to
be sharply reduced, GDP growth turned negative, government revenues fell sharply, inflation
and domestic debt rose. More significantly, Zambia began to accumulate significant levels of
external debt which henceforth became a major restraining factor in macro-economic policy-
making.
The introduction of the one-party state in 1973 heralded an intensification of the dirigiste
tendencies in economic management which had been evident in the early years of independence.
As macro-economic and balance of payments problems grew, the government increasingly
turned to donors for assistance. The government’s orientation ran counter to donor policy
prescriptions, particularly those of the World Bank and the IMF. This resulted in a succession of
half-hearted reform attempts in the 1980s, interspersed by populist measures intended to head off
growing political discontent.
The clearest example of such populism is provided by the heavy commitment to
consumer subsidies of maize meal. The budgetary requirements for these subsidies grew to
proportions which by the mid-1980s destabilized the national budget. When the price of
breakfast meal was doubled in December 1986, there were riots on the Copperbelt and the
increases were hastily withdrawn. In May 1987, President Kaunda announced a break with the
Bretton Woods Institutions and the introduction of a home-grown recovery program, but this did
not last. By 1989, the country had negotiated a Policy Framework Paper with the World Bank
and the IMF. Devaluation, removal of price controls and institutional reform followed.
In the food sector, this involved a tripling of the maize price, offset by the introduction of
a coupon system to provide a targeted subsidy, and the scrapping of the parastatal marketing
organization (NAMBOARD). This led in June 1990, to fresh maize meal riots, in which 19
people died, and a coup attempt. An opposition party emerged soon after, and it was legalized in
time to contest the October 1991 elections. The maize meal subsidy was increased again before
the election, but this did not prevent the defeat of President Kaunda’s party.
Agricultural and food policies

16
At independence in 1964, the new government’s agriculture and food policies were shaped by
concerns about equity and food self-sufficiency. Equity required increasing the involvement of
small-scale farmers in the market economy, while the food concerns revolved around feeding the
rapidly growing urban population. These objectives had immediate in-built tensions for food
prices, which were always biased towards the urban workers who constituted the bedrock of the
ruling party’s power base. The agricultural measures the government adopted to offset low
producer prices were to broaden the range of agricultural services (credit, fertilizer, tractor
ploughing, marketing provided at subsidized rates) and to extend these throughout the country,
most visibly through expanding the network of the Agricultural Rural Marketing Board (ARMB)
depots. This did have some positive equity impacts, increasing the participation of households in
remote areas in producing for the market.
Uniform pan-territorial pricing, introduced in the 1974-75 crop season, gave further
assistance to farmers in surplus-producing provinces not near the rail line who had hitherto had
to meet the high cost of transport to urban markets. It penalized, however, farmers in deficit
areas who received lower prices than they would have done. Under the old system, they sold
their crops locally at prices above the national average, but they now had to sell at the pan-
territorial price. Uniform pricing was billed as being synonymous with equity, but analysis of the
consequences indicates that the opposite had been the case. “Uniform pricing depressed the price
received by the poorest segment of the population, i.e., farmers in the distant (non-border) deficit
areas and has inflated the price received by better-off (and more politically vocal) farmers in
surplus regions, particularly the Eastern province” (Jansen and Rukovo 1992). Pan-territorial and
pan-seasonal pricing encouraged the production of maize in areas not suited to the crop and also
greatly increased the transport costs that had to be covered by subsidies to NAMBOARD, which
had taken over the ARMB marketing depot network.9 Combined with consumer subsidies on
maize meal, fertilizer subsidies and smaller subsidies for other crops, the fiscal requirements of
agricultural subsidies grew to be a significant drain on national resources, reaching a peak of 6.7
percent of GDP in 1980 (McPherson 2004).
9 Jansen (1991) cites a linear programming transport model exercise as demonstrating that transport costs increased 20 percent as a result of pan-territorial pricing.

17
In addition to maize, minimum producer prices were set for the other major crops, and it
is these prices which have been used for the NRA calculations. Jansen (1991) notes that these
prices were set on the basis of costs of production and were always well below border equivalent
levels, with partially compensating direct assistance being given to farmers in the form of
subsidies on inputs and transport. The producer prices were adjusted to influence crop choice
vis-à-vis maize, the prices of other crops being depressed when greater encouragement to maize
production was felt necessary and vice versa. Parastatal procurement agencies had a mix of legal
and de facto monopsonistic control over primary agricultural markets and were either inefficient
(in the case of groundnuts, for example) or enjoyed high rents from the low farm-gate prices (in
the case of cotton)10. Tobacco was marketed via an auction, but the government provided a floor
price to encourage farmers to produce tobacco without the risk of prices being below costs of
production in poor years.
Macro and exchange rate policy
While the above agriculture and food policies were becoming entrenched, poor macroeconomic
policies following the crisis induced by the dramatic fall in the world copper price in 1975
plunged the country into persistent internal and external imbalance. Appendix Figure 7 showing
the parallel market premium over the official exchange rate provides one visual illustration of
this.
Following the rise in imported petroleum prices in 1973 and the subsequent copper price
crash in 1975, Zambia’s macro-economic problems were induced by failure to adjust the
exchange rate in the face of high inflation, this leading to falling export receipts. Increasing
reliance was then placed on quantitative restrictions and tariffs to restrain imports, and
increasingly levels of foreign borrowing were undertaken in order to sustain import levels. When
borrowings from international private banks dried up, the government was forced to approach
the Bretton Woods institutions for assistance.
Over the next decade, the economic reform promises that were made were never fully
supported by the political elite, and the result was a series of failed reform programs and surges
10 For details, see Jansen (1988).

18
and withdrawals of foreign aid. The first of these was an Extended Fund Facility granted by the
IMF in 1981 and discontinued in 1982. The Memorandum of Development Objectives and
Policies agreed with the World Bank in early 1983 included increased prices of maize meal and
fertilizer and flexibility in setting other prices (subject to ex-post review) as well as significant
macro-economic and trade policy reforms, but the Bank suspended disbursements in October
1983 when the government fell into arrears after unilaterally suspending debt payments.
After the 1983 elections, President Kaunda promulgated an intensified version of the
economic reforms, but the policy improvements had to contend with a further slide in copper
prices, drought, and a dip in aid. Popular dissatisfaction with economic conditions led to student
riots in February 1984 and industrial unrest in the first half of 1985. In response, financial
policies were relaxed, thereby aggravating Zambia’s fiscal and external debt problems, leading
to a fresh appraisal of the government’s policy stance.
In October 1985, a comprehensive structural adjustment program was launched. This
included a foreign currency auction which resulted in rapid depreciation of the Kwacha. Food
prices rose dramatically as a result of the depreciation and reduction in subsidies, leading to the
food riots referred to earlier in December 1986. This incident led to policy reversals, including
the suspension of the foreign exchange auction in early 1987 and full-scale repudiation of the
structural adjustment program on May Day 1987, at which a home-grown program was
announced. However, by October 1987, the government had re-opened discussions with the
World Bank and there was a gradual return to structural adjustment measures over the period
1988-1990. Exchange rate policy remained central: the Kwacha was devalued and a new foreign
exchange auction system was introduced (more to allocate foreign currency than to set the rate).
Exporter retention schemes and (from 1989) a formal multiple exchange rate system became
operational.11
In 1989, all consumer prices except maize were decontrolled and NAMBOARD was
abolished. The fiscal burden of maize subsidies was reduced through tripling of the maize price
and introduction of a coupon system to allow for targeting of the remaining maize subsidy. The
country was still cut off from assistance from the multilateral institutions, but the positive
11 For most of the time this was in operation, the surrender requirement on exporters was 50 percent of their export proceeds with the other 50 percent being sold at parallel market rates. These are the values used in the spreadsheet. The multiple exchange rate system was unwound in 1992 with full unification of the exchange rate by early 1993.

19
measures taken in respect of exchange rates and subsidy reductions paved the way for a Policy
Framework Paper to be agreed in 1989 and relations to be restored in early 1990. In the run-up to
the elections, adjustment was, however, abandoned one last time by the Kaunda government.
Expansionary fiscal measures included increases in wages and in maize and other subsidies.
President Kaunda’s United Independence Party (UNIP) was nonetheless defeated in the October
1991 elections, ushering in a fresh epoch under a new party, the Movement for Multiparty
Democracy (MMD).
Policies behind the distortions: the period since 1992
The new government of President Chiluba committed itself to the program that its predecessor
had negotiated and then abandoned. Donors pledged extensive support, including substantial
food aid to counter the effects of the 1991-92 drought, which was of a once-in-a-century
severity. The government acted swiftly on several economic policy fronts, particularly the
exchange rate and trade liberalization. The foreign exchange auction was broadened, bureaux de
change were introduced in September 1992 and this led to the unification of the exchange rate by
December 1992. Export bans (except for ivory, oil, maize and fertilizers) were removed and all
imports, bar a small negative list, were liberalized by September 1992. Import tariff rates were
reduced to 6 levels in the 1991 budget, with the new minimum and maximum rates being set at
15 percent and 50 percent respectively and the number of duty exempt goods was reduced. These
changes resulted in a dramatic opening up of the economy to imports, not least from neighboring
countries, which enjoyed 70 percent preferences (rising to 100 percent in later years) under
COMESA and bilateral agreements.
The outcome was positive in terms of greatly improved availability of basic goods but
not without large-scale closures of businesses and loss of jobs, particularly in the manufacturing
sector. The social impact of the loss of employment could have been mitigated by a more gradual
approach being adopted. The pace and sequencing of trade and other economic reforms have also

20
been criticized (for example by Botchwey et al. 1998) as being a major cause of the persistent
instability of the macro-economy throughout the 1990s. The period was characterized by high
inflation, a volatile and generally overvalued exchange rate, high real interest rates and a
banking system oriented to financing the government deficit rather than servicing the credit
needs of productive enterprises. The long delay in the privatization of the copper mines was
extremely costly both within the copper sector itself and in undermining the pro-growth
orientation the Chiluba government supposedly stood for.
Overall, the economic environment in the 1990s was not conducive to fulfilling one of
the basic intentions of the new government, namely that private investment would spearhead
economic growth. The fact that non-traditional exports, including agricultural exports, grew
significantly over the period, is claimed as contrary evidence. A more pertinent question arises
from the counterfactual – by how much more would the non-traditional exports have grown if
there had been an environment truly conducive to private sector growth?12
The pattern of growth of agricultural exports provides interesting perspectives on this
question. The removal of exchange controls, improvement in input supplies, opening of markets
and improvement in transport services did encourage an expansion of agricultural exports, but
the persistence of negative NRAs for the main agricultural commodities, particularly
exportables, can be interpreted as primae facia evidence that agricultural exports could have
grown even faster than they did in the 1990s. The agricultural sub-sectors exhibiting the most
dramatic growth – floriculture and horticulture –involved very few farmers who, having gained
access to European markets, exploited them by insulating their operations from domestic policy
changes through establishing offshore arrangements for inputs and spare parts (McPherson
2004). In particular, they benefited from duty drawback arrangements and VAT zero rating and
can be said to have grown to a significant extent because of the policy environment.13
Growth in exports of traditional agricultural products, on the other hand, together with
growth in processed food exports (notably maize meal exports to the DRC), were rather more “in
spite of” than “because of” the policy environment.14 Much the same can be said of other
12 These issues are discussed in more detail in Robinson (2004). 13 More recently, floriculture and horticulture have experienced declines. Sugar, cotton and tobacco have exhibited more sustained growth 14 Between 1987 and 2003, the bulk of non-traditional exports were primary agricultural products (33 percent), floriculture and horticulture (23 percent), processed food (20 percent) and textiles (20 percent).

21
changes in the agricultural sector. At first gloss, a good deal was achieved very soon after the
new government came to power in fulfilling its stated commitment to government withdrawing
from direct intervention in the agriculture sector. In the midst of the drought and large imports of
food that this required, maize meal and fertilizer subsidies were removed. Various agricultural
reform programs were launched in 1992-1993, notably those targeted at liberalization of maize,
agricultural input markets and agricultural credit schemes. In 1995, the milling industry was
privatized and the World Bank-led Agricultural Sector Investment Program (ASIP) was initiated.
However, these reform programs were not carried through with the vigor that was needed
to produce the required results. The government commissioned a Maize Marketing Study that
recommended that the government should fully withdraw from maize and fertilizer marketing
and retain only a small role in establishing an agency to hold modest stocks for food security
purposes. The Food Reserve Agency (FRA) was duly established in 1996, but soon was required
to take on additional roles. The justification given for extending its mandate is that the private
sector response to the government’s withdrawal from input supply and marketing had been
inadequate. This is ironic, because the supposedly poor response is clearly a result of continued
intervention by the public sector and the associated unpredictability and risks that this involves
for private entities.15
The resources associated with agricultural credit schemes initiated by the new
government were used inefficiently and/or misappropriated, so that the objectives of the schemes
were thwarted. The fate of the marketing and fertilizer credits made available to lending
institutions in 1992/93 and 1993/94 were subject to a special investigation commissioned by the
Minister of Finance (Brown 1995). The Agricultural Credit Management Program launched in
1994 suffered a similar fate of being poorly implemented, giving rise to high administrative
costs, low credit recovery and corruption. McPherson (2004) concludes that the principal
function of agricultural credit in Zambia has been to redistribute wealth to relatively well-off
farmers, rather than to expand agricultural output.
The Agriculture Sector Investment Program (ASIP), which was supposed to be a
landmark example of a coordinated multi-donor sector-wide approach, unifying 180 separate
15 Specific examples of the government’s stop-go approach and the resulting increasing intrusion of the public sector have been documented in, for example, Jayne et al (1999), Govereh et al. (2002), IMCS (2003), Mwanaumo et al. (2005), Siegel and Alwang (2005).

22
donor-funded projects, has also largely been deemed to be a failure. The World Bank itself,
through its Operations Evaluation Department, rates the outcome as unsatisfactory, sustainability
unlikely and institutional development modest (World Bank 2003). These ratings are with
respect to the original objectives - improve household food security, make better use of natural
resources, generate employment, raise incomes and increase exports – ‘which were not
achieved’. The project was later restructured, but even the scaled down project failed at the time
to achieve most of its revised targets.
In the light of the recent developments of the sector, however, it would appear that ASIP
has been more successful than had earlier been appeared to be the case. Firstly, the agriculture
sector experience impressive growth of exports and sector has shown reasonably good average
growth rates throughout 2000s despite drought in 2001/02 season, suggesting perhaps some
positive lag effects. On sustainability, the ASIP created the Agricultural Consultative Forum
(ACF) which is still active and one of the leading think-tanks which facilitates policy dialogue
between the Ministry of Agriculture and sectoral stake holders. Thirdly, the Rural Investment
Fund (RIF), which was the largest component of the ASIP, is still active and continues to
facilitate investments into rural infrastructure. Recent field visits by World Bank staff have
reportedly shown that many infrastructure facilities which were initially built under RIF and
were dormant during early 2000s are coming back to productive use (small dams and
sheds/storage facilities) and some are developed even further by local communities (i.e.
development of small-scale irrigation schemes). Finally, ASIP managed to scale down the
Ministry of Agriculture and focus it on core functions, although the latter has been hampered
more recently by fertilizer subsidy programs and FRA maize market interventions, which have
crowded out agriculture budget for core functions.16
In the new millennium, there was another change in government. After serving two
terms, President Chiluba was not eligible to stand in the elections in 2001. Following some
controversy over the conduct and results of the elections, President Mwanawasa came to power,
representing the same party as President Chiluba. There have not therefore been any dramatic
shifts in policy in recent years. The macro-economy has continued to improve and GDP growth
has picked up significantly to 5-6 percent per year.
16 This is discussed further below in the concluding ‘Prospects for Future Reform’

23
In respect of agricultural policies, the Mwanawasa government has made a few positive
steps in response to criticisms of the weaknesses and inconsistencies of the agricultural
liberalization to date, but has also taken some backward steps. On the positive side, it has
acceded to the arguments against the formation of a Crop Marketing Authority (e.g., Nijhoff et
al. 2003) and has accepted that intervention should be limited to the more restricted roles
established for the Food Reserve Agency. On the negative side, the government has used a tariff
review in 2005 to raise border tariffs on agricultural goods17 and continues to depress private
sector involvement in maize marketing by continuing (through the FRA) pan-territorial pricing
and procurement and by injecting uncertainty about export bans, tariff waivers, public sector
import levels and subsidies when there is a maize shortfall.18
The main specific policy change has been to increase the level of maize and fertilizer
subsidies. Producers have also benefited from a more certain policy environment, as there has
been increased consistency in policy. Despite the inherent policy inadequacies, the so-called
‘new deal’ government has not made different pronouncements during its tenure. Participants in
the agricultural sector have thus learnt how to deal with the inadequacies in a relatively stable
environment free of the uncertainties associated with policy shifts.
Despite the agricultural policy environment since 1992 not being as open and growth-
oriented as had initially been expected, there have been some notable positive changes which
have benefited small-scale farmers and poor consumers. Two sectors illustrate this point. First,
removal of subsidies and other aspects of maize liberalization undermined the monopolistic
position of the large milling companies, making it profitable for small hammermills to produce
maize meal, often on a service milling basis (charging a fee to producers or to maize-deficit
households able to buy grain or obtain it through food aid sources). Not only is the cost of the
maize meal from hammermills significantly cheaper than the commercial product (Jayne et al.
17 Using the GTAP product classifications, between 2003 and 2005 the applied Zambian import tariffs have gone up as follows: paddy rice from 4.6 percent to 15 percent, wheat from 5 percent to 10 percent, cereal grains from 4.8 percent to 12.4 percent and oilseeds from 4.5 percent to 5.6 percent (WITS database). 18 Mwanaumo et al. (2005) document the significant direct costs involved in public sector prevarication in response to the 2005 maize shortfall (such as fourth quarter imports costing $256 and $320 per tonne, as compared with $210 and lower transport costs if the maize had been purchased in June). The authors also allude to the long-term costs of subverting the potential role of the private sector in expanding and reducing the costs of marketing food and other crops.

24
(1999) estimate 20-30 percent cheaper), it is also (in its straight run or mugaiwa form) more
nutritious (Mwiinga et al. 2002). A 1997 study estimates that there were at least 5,000
hammermills in the country, by that time providing a significantly cheaper source of mealie meal
while also employing 10,000 people. In addition, “the presence of the hammermill has been
reported to have stimulated increased crop production” (Temba 1997).
Second, in the case of cotton, the dissolution of LINTCO and its replacement by a variety
of purchasers of seed cotton has been associated with a dramatic rise in the production of seed
cotton (from 48,000 MT in 1993 to 144,000 in 2004, according to the Central Statistics Office).
Unlike other export crops which grew rapidly in the 1990s (fresh flowers and sugar), cotton is
primarily a smallholder crop. “Its potential role in poverty alleviation and food security is thus
very large” (Tschirley Zulu and Shaffer 2004).
Neither of these positive developments is reflected in the above NRA calculations. In the
case of maize and maize meal, the data used is for commercial operations, while in the case of
cotton the calculated NRAs are simply not consistent with developments in the sector. This may
well be due to the monopsonistic structure of the industry.19 After liberalization, LINTCO gave
way to several cotton companies but they operate in restricted areas, in effect having local
monopsonies. However, unlike similar companies in other countries, the Zambian cotton
companies sell inputs to farmers at cost, preferring to make their margin on the product side. The
approach of the companies was to create order and predictability and this has paid off in terms of
increased production. Cotton and tobacco production expanded also because they were profitable
relative to other crops. Maize production was adversely affected by the dissolution of
NAMBOARD and many small-scale producers reduced their maize areas and started growing
cotton and tobacco (Tschirley, Zulu and Shaffer 2004).
The unexpectedly negative post-1991 NRA results for most of the commodities studied
(especially exportables) may also in part be that the monopsonistic buying that is evident in the
cotton sector is also present in the purchase of cereal and oilseed crops. Despite the fact that
there are many buyers of those crops and not just a small number of big companies, the buyers
nonetheless operate in specific localities, where competition is limited.
19 This would not be unique to Zambia. See “Why liberalization did not lead to price competition in Zimbabwe” in Goreux (2003, Section 2.6).

25
Furthermore, the buyers would be aware of the cash needs of farmers and would
therefore offer the lowest prices just after the harvest, accepting that somewhat higher prices
would have to be paid later in the season, but with the average for the year being very low
relative to border prices.
Analogous market stickiness must also exist in trades involving large-scale producers,
even those using the Agricultural Commodities Exchange. This is because in theory producer
prices should rise to match border prices, and in so doing there would be strong incentives for
increased production of the affected crops and hence rapid growth of the agricultural sector. This
has not happened. To the extent that this can be attributed to market imperfections, the difference
could be labeled as a “market imperfection margin”. Assuming the most recent five-year period
(2001-2005) to be the most liberal, for Zambia the results suggest that this margin may have
averaged across all crops as much as 30 percent gross or 25 percent net of input subsidies, even
including a positive NRA for a major import-competing product (wheat). The market
imperfection margin for just exportables is estimated to be 39 percent.20
Prospects for further reform
In the last five-year period covered, with the sole exception of wheat, all the NRA estimates for
our covered products remain stubbornly negative (Table 1). If the levels of distortion are to be
reduced in the future, attention will have to be given to both microeconomic and macroeconomic
factors. The changes in government positions that are needed are to shift expenditure priorities in
agriculture from short-term recurrent subsidies to long-term investments, to promote the
development of competitive private-sector involvement in input supply and marketing, and to
ensure a competitive exchange rate to enhance the profitability of traded agricultural
commodities.
20 The conundrum of negative NRAs after liberalization is even more difficult to explain to the extent that the Kwacha arguably remained overvalued after the liberalization of the foreign exchange market, yet our NRA estimates assume it has been in equilibrium since 1992. The possibility of the Kwacha being overvalued when it is ‘market determined’ is denied by the IMF and the Bank of Zambia. However, when monetary and international
26
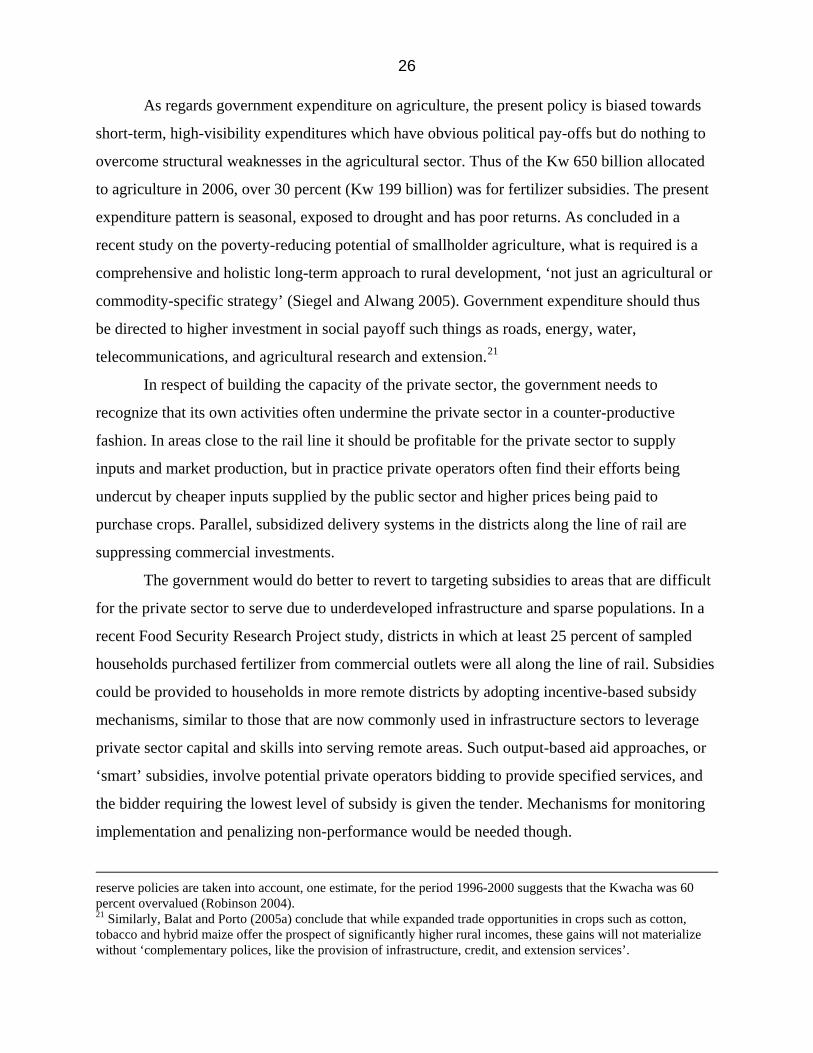
As regards government expenditure on agriculture, the present policy is biased towards
short-term, high-visibility expenditures which have obvious political pay-offs but do nothing to
overcome structural weaknesses in the agricultural sector. Thus of the Kw 650 billion allocated
to agriculture in 2006, over 30 percent (Kw 199 billion) was for fertilizer subsidies. The present
expenditure pattern is seasonal, exposed to drought and has poor returns. As concluded in a
recent study on the poverty-reducing potential of smallholder agriculture, what is required is a
comprehensive and holistic long-term approach to rural development, ‘not just an agricultural or
commodity-specific strategy’ (Siegel and Alwang 2005). Government expenditure should thus
be directed to higher investment in social payoff such things as roads, energy, water,
telecommunications, and agricultural research and extension.21
In respect of building the capacity of the private sector, the government needs to
recognize that its own activities often undermine the private sector in a counter-productive
fashion. In areas close to the rail line it should be profitable for the private sector to supply
inputs and market production, but in practice private operators often find their efforts being
undercut by cheaper inputs supplied by the public sector and higher prices being paid to
purchase crops. Parallel, subsidized delivery systems in the districts along the line of rail are
suppressing commercial investments.
The government would do better to revert to targeting subsidies to areas that are difficult
for the private sector to serve due to underdeveloped infrastructure and sparse populations. In a
recent Food Security Research Project study, districts in which at least 25 percent of sampled
households purchased fertilizer from commercial outlets were all along the line of rail. Subsidies
could be provided to households in more remote districts by adopting incentive-based subsidy
mechanisms, similar to those that are now commonly used in infrastructure sectors to leverage
private sector capital and skills into serving remote areas. Such output-based aid approaches, or
‘smart’ subsidies, involve potential private operators bidding to provide specified services, and
the bidder requiring the lowest level of subsidy is given the tender. Mechanisms for monitoring
implementation and penalizing non-performance would be needed though.
reserve policies are taken into account, one estimate, for the period 1996-2000 suggests that the Kwacha was 60 percent overvalued (Robinson 2004). 21 Similarly, Balat and Porto (2005a) conclude that while expanded trade opportunities in crops such as cotton, tobacco and hybrid maize offer the prospect of significantly higher rural incomes, these gains will not materialize without ‘complementary polices, like the provision of infrastructure, credit, and extension services’.

27
Finally, as regards the macro economy, it has to be recognized that despite the
liberalizations of the past 15 years and the consequent diversification that has occurred, copper
still remains the lead sector in Zambia’s economy, particularly in terms of foreign currency
generation. The key macroeconomic issues at present are the level and variability of the
exchange rate. With the reduction of Zambia’s external debt, resumption in confidence, as
exemplified by foreign purchases of government securities, and the copper price rising steeply
(from $1,560/MT in 2002 to over $8,000/MT in 2006), the nominal exchange rate has
appreciated 60 percent between June 2005 and June 2006, with the real appreciation being even
larger than this. The exchange rate keeps moving, however, for example from Kw 2,900 in mid-
June to Kw 4,000 to the US$ in mid-August. Appreciation of the Kwacha and variability of the
exchange rate pose significant threats to the sustainability of the recent achievements in
increasing agricultural and other non-traditional exports.
As highlighted above, the government with the support of the IMF is treating the
appreciated exchange rate as a valid measure of the opportunity cost of foreign currency. In
contrast, other major copper exporters, such as Chile, are attempting to limit the Dutch disease
effects by building up offshore reserves, thereby sterilizing the impact in the local economy.22
Sterilizing resource rents in boom periods to maintain a competitive exchange rate and promote
alternative exports is one of the main recommendations that emerges from the literature on why
so few resource rich countries have performed better than resource scarce ones.23 As long as
Zambia continues with a policy whereby the real exchange rate is effectively made hostage to
the vagaries of the copper market, there will be continuous under-achievement in the goal of
economic diversification.24
Part of the problem at present is that, after the firm Anglo American withdrew, the
operators who took over the copper mines were given extraordinarily generous terms. At this
juncture, there are virtually no taxes payable and no mining royalties to the government. The
main benefits to the economy are via employment and multiplier effects, both of which are
22 ‘Coping with the Copper Boom’, The Economist, May 25, 2006. 23 See, for example, Reinhardt (2000), Auty (2001, 2004) and Esanov et al. (2004). 24 Kayizzi-Mugerwa (1991) uses a multisector general equilibrium model to show the complexity of the interlinkages in an economy subject to Dutch disease shocks because of the dominance of copper. He also argues for a more competitive exchange rate but observes that ‘in practical terms, the size of the devaluation of the nominal exchange rate necessary to realize a favorable change in the real exchange rate might be politically unacceptable. Success thus depends…on the political work put into selling the adjustment package’ (p. 862).

28
limited in the mining sector. Without abrogating agreements, it is important for the government
to investigate ways of increasing its share in copper revenues.25 Any additional resources which
can be gleaned should be used to build up infrastructure, human capital and productive capacity
in diverse sectors. The key sector which should be made to grow is agriculture, where there is so
much untapped potential and where the equity and poverty reduction benefits would be
substantial.
References
African Development Bank (1993), Economic Integration in Southern Africa, Volume 2, Cote
D’Ivoire, Abidjan: African Development Bank.
Anderson, K., M. Kurzweil, W. Martin, D. Sandri and E. Valenzuela (2008), “Methodology for
Measuring Distortions to Agricultural Incentives,” Agricultural Distortions Working Paper
02, World Bank, Washington DC, revised January.
Auty, R.M. (2001), ‘The Political State and the Management of Mineral Rents in Capital-surplus
Economies: Botswana and Saudi Arabia’, Resources Policy 27: 77-86.
Auty, R.M. (2004), ”Economic and Political Reform in Distorted Oil-Exporting Economies”,
paper prepared for workshop on Escaping the Resource Curse: Managing Natural
Resource Revenues in Low-income Countries, Columbia University, New York,
February.
Balat, J.F. and G.G. Porto (2005a), “Globalization and Complementary Policies: Poverty Impacts
in Rural Zambia”, World Bank Policy Research Working Paper XXXX, Washington DC,
July.
Botchwey, K. et al. (1998), Report of the Group of Independent Persons Appointed to Conduct
an Evaluation of Certain Aspects of the Enhanced Structural Adjustment Facility, Part 2
Country Profiles, Washington DC: International Monetary Fund.
Coulter, J., J. Sondhi, P. Kotecha and R. Boxall (1996), “The Economics of Warehousing in
Zambia and its Role in Agricultural Development”, Research Report R2323 (S)
25 Certain tax concession periods for KCM and Kanshansi have now expired.

29
completed under the ODA Crop Post-Harvest Research Program - Proj No Z0610,
Natural Resources Institute, December.
Economist, The (2006) Coping with the Copper Boom, London, 25 May.
Esanov, A., M. Raiser and W. Buiter, (2004), “Nature’s Blessing or Nature’s Curse: The
Political Economy of Transition in Resource-Based Economies”, ZEF Discussion Papers
on Development Policy, No 81, Bonn, January.
FAO (1992), Zambia: Export Diversification Project Preparation Mission, Report No 37/92 CP-
ZAM 31, Investment Centre FAO/World Bank Cooperative Program, 7 April.
Goreux, L. (2003), “Reforming the Cotton Sector in Sub-Saharan Africa”, Africa Region
Working Paper Series No. 62, World Bank, Washington DC, November.
Govereh, J. T.S. Jayne, J.J. Nijhoff, J.J. Shawa, H. Haantuba, A. Belemu, E. Ngulube, B. Zulu,
and A.K. Banda (2002), Developments in Fertilizer Marketing in Zambia: Commercial
Trading, Government Programs and the Smallholder Farmer, FSRP No 3, Food Security
Research Project, Ministry of Agriculture and Cooperatives, Agricultural Consultative
Forum. Michigan State University, May.
Hill, C.B. and M.F. McPherson (eds.) (2004), Promoting and Sustaining Economic Reform in
Zambia, Harvard: Harvard University Press.
IMCS (2003), Maize Market Assessment and Baseline Study for Zambia, prepared for Regional
Agricultural Trade Expansion Support Centre, Nairobi, May.
Jansen, D. (1988), Trade, Exchange Rate, and Agricultural Pricing Policies in Zambia, World
Bank Comparative Studies on The Political Economy of Agricultural Pricing Policy
project, Washington DC.
Jansen, D. (1991), ”Zambia”, Ch. 10 in A.O. Krueger, M. Schiff and A. Valdes (eds.), The
Political Economy of Agricultural Pricing Policy, Volume 3: Africa and the
Mediterranean, Baltimore: Johns Hopkins University Press for the World Bank.
Jansen, D.J. and A. Rukovo (1992), 'Agriculture and the Policy Environment: Zambia and
Zimbabwe', OECD Development Centre, Working Paper No 74, July.
Jayne, T.S., M. Mukumbu, M. Chisvo, D. Tschirley, M.T. Weber, B. Zulu, R. Johansson, P.
Santos and D. Soroko (1999), Successes and Challenges of Food Market Reform:
Experiences from Kenya, Mozambique, Zambia and Zimbabwe, MSU International

30
Development Working Paper No 72, Department of Agricultural Economics, Michigan
State University.
Kayizzi-Mugerwa, S. (1991), “External Shocks and Adjustment in a Mineral Dependent
Economy: A Short-Run Model for Zambia”, World Development 19(7): 851-865.
Krueger, A.O., M. Schiff and A. Valdes (1991), The Political Economy of Agricultural Pricing
Policy, Volume 3: Africa and the Mediterranean, Baltimore: Johns Hopkins University
Press for the World Bank.
McCulloch, N., B. Baulch and M. Cherel-Robson (2001), Poverty, Inequality and Growth in
Zambia during the 1990s, WIDER Discussion Paper, No 2001/123, United Nations
University, Helsinki, November.
McKenzie, J., D. Mawebe, F. Chikomba and B. Mwiinga (1994), The Potential for Growth in
Zambia's Agricultural Sector: A Quantitative Assessment, Policy and Planning Division,
Ministry of Agriculture, Food and Fisheries, November.
McPherson, M.F. (2004), “The Role of Agriculture and Mining in Sustaining Growth and
Development in Zambia”, Ch. 10 in Hill C.B. and M.F. McPherson (eds.), Promoting and
Sustaining Economic Reform in Zambia, Harvard: Harvard University Press.
Ministry of Agriculture (1995), A Review of Maize Marketing Liberalisation during 1994: The
Transition Program 1995/96, prepared and produced in collaboration with FAO's
Marketing Management Assistance Project, Zambian Ministry of Agriculture, Food and
Fisheries, Food Security Division, Lusaka, March.
Mistry, P. (1993), “Zambia: Are Stabilisation and Adjustment Measures Working? A Prognosis
for the Short and Intermediate Term”, Oxford International Associates, November.
Mukuka, F (1997), Agriculture Policy and Practices in Zambia, unpublished Master of Policy
Studies dissertation, Universities of Dar-es-Salaam, Fort Hare and Zimbabwe, June.
Mundia, D.D. (1999), “Market research Study aimed to Lead to the Design of Agricultural
Marketing Intervention Strategies for Muswishi Small Scale Farming Community”,
Project ZAM 99-02, December.
Mwanauma, A., T.S. Jayne, B. Zulu, J. Shawa, G. Mbozi, S. Haggblade and M. Nyembe (2005),
Zambia's 2005 Maize Import and Marketing Experiences: Lessons and Implications,
FSRP No 11, Food Security Research Project, Ministry of Agriculture and Cooperatives,
Agricultural Consultative Forum, Michigan State University, December.

31
Mwanaumo, A., W.A. Masters and P.V. Preckel (1997), “A Spatial Analysis of Maize Marketing
Policy Reforms in Zambia”, American Journal of Agricultural Economics 79(2): 514-23.
Mwiinga, B., J.J. Nijhoff, T.S. Jayne, G. Tembo, J. Shaffer (2002), The Role of Mugaiwa in
Promoting Household Food Security: Why it Matters Who Gets Access to Government
Maize Imports, FSRP No 5, Food Security Research Project, Ministry of Agriculture and
Cooperatives, Agricultural Consultative Forum, Michigan State University, October.
Ndulo, M., M. Sakala and W. Siwale (1990), The Impact and Efficiency of Currency
Devaluations in Zambia, University of Zambia, Lusaka.
Nijhoff, J.J., G. Tembo, J.D. Shaffer, T.S. Jayne, and J. Shawa (2003), How Will the Proposed
Crop Marketing Authority affect Food Market Performance in Zambia? An ex ante
Assessment to inform Government Deliberation, FSRP Working Paper No 8, Food
Security Research Project, Ministry of Agriculture and Cooperatives, Agricultural
Consultative Forum, Michigan State University, June.
Nokkala, M. (2001), “Sector Investments as Part of National Fiscal Policy: Experience from
ASIP in Zambia”, WIDER Discussion Paper, No 2001/117, United Nations University,
October.
Page, S. (2002), “Streamlining Zambia's Trade Agreements to Support Export Diversification”,
ODI Report prepared for the World Bank, Washington DC, October.
Rakner, L., N. van der Walle and D. Mulaisho (2001), in S. Devarajan, D. Dollar and T.
Holmgren (eds.), Aid and Reform in Africa - Lessons from Ten Case Studies, The World
Bank, Washington DC, December.
Reinhardt, N. (2000), “Back to Basics in Malaysia and Thailand: The Role of Resource-Based
Exports in their Export-Led Growth”, World Development 28(1): 57-77.
Republic of Zambia (1995), Report on Financial Consultancy to investigate the Utilisation of
GRZ Marketing and Fertilizer Credit 1992/3 and 1993/4 by the Lending Institutions and
SPCMU, prepared by Veronica Brown in collaboration with FAO's Marketing
Management Assistance Project for Ministry of Agriculture Food and Fisheries, Food
Security Division (FIN-017 BRO), Lusaka.
Republic of Zambia, Ministry of Agriculture and Co-operatives, National Agricultural Policy
2004-2015, Lusaka.

32
Republic of Zambia, Ministry of Agriculture Food and Fisheries, Food Security Division, Recent
Developments and Future Potential of Zambia's International Maize Trade: A brief
Analysis of the Potential Role for Zambia on the International Grain Market, Market
Liberalization Impact Studies No 11, prepared and produced in collaboration with FAO's
Marketing Management Assistance Project, December.
Republic of Zambia, Ministry of Agriculture, Food and Fisheries (1996), Zambia: From
Transition to Consolidation, A Critical Policy Review of the Liberalization of Maize and
Agricultural Input Markets, 1993-96, Market Liberalization Impact Studies No 18,
prepared and produced in collaboration with FAO's Marketing Management Assistance
Project (EDU-013 MAR), December.
Republic of Zambia, Ministry of Agriculture, Food and Fisheries, Food Security Division
(1995), The Development of Maize Grain Wholesale Prices during the 1994/95
Marketing Season: An Abnormal or Recurrent Phenomenon?, Market Liberalization
Impact Studies No 5, prepared and produced in collaboration with FAO's Marketing
Management Assistance Project, April.
Republic of Zambia, Ministry of Commerce, Trade and Industry (1993), An Evaluation of
Pricing Policies employed by selected Parastatal Management Groups in Zambia's
Maize Milling Industry, A Summary of Cost Data used in conducting the Analysis,
March.
Robinson, P.B. (2004), “Evaluation of World Bank Trade Assistance to Zambia (1987-2002)”,
Operations Evaluation Department, World Bank, Washington DC.
Rodrik, D. (1998), “Why is Trade Reform so Difficult in Africa”, Journal of African Economies
7(Supplement 1): 10-36.
Sanjeev, K.S.N. (2004), Zambia, Overseas Development Institute, London, February.
Siegel, P.B. and J. Alwang (2005), “Poverty Reducing Potential of Smallholder Agriculture in
Zambia: Opportunities and Constraints”, Africa Region Working Paper Series No. 85,
World Bank, Washington DC.
Temba, J. (1997), The Hammermill Industry in Zambia, The Study Fund, Social Recovery
Project, GRZ/World Bank NCDP, Serial No 36, February.
Tschirley, D. and B Zulu (2003), Zambian Cotton in a Regional Context: Performance under
Liberalization and Future Challenges, FSRP No 7, Food Security Research Project,

33
Ministry of Agriculture and Cooperatives, Agricultural Consultative Forum Michigan
State University, May.
Tschirley, D., B. Zulu and J. Shaffer (2004), Cotton in Zambia: An Assessment of its
Organisation, Performance, Current Policy Initiatives, and Challenges for the Future,
FSRP Working Paper No 10, Food Security Research Project, Ministry of Agriculture
and Cooperatives, Agricultural Consultative Forum Michigan State University, February.
UNCTAD (2004), Least Developed Country Report 2004: Linking International Trade with
Poverty Reduction, Geneva: UNCTAD, May.
University of Zambia, Institute of Economic and Social Research (1999), Agricultural Sector
Performance Analysis 1997-1998, Vol 1, Main Summary Report, prepared for Ministry
of Agriculture, Food and Fisheries, December.
World Bank (1984), Zambia: Policy Options and Strategies for Agricultural Growth, Eastern
Africa Projects Department, Southern Agriculture Division, Report No 4764-ZA, World
Bank, Washington DC.
World Bank (1995), Republic of Zambia Public Expenditure Review, Macro, Industry and
Finance Division, Southern Africa Department, Africa Region, Report No 13854-ZA
(FIN-017 PUB), World Bank, Washington DC.
World Bank (2000); Global Economic Prospects 2001, Washington DC: World Bank,
December.
World Bank (2003), Agricultural Sector Investment Program, PPAR, World Bank, Washington
DC, 23 June.
World Bank (2003), Project Performance Assessment Report, Zambia: Agricultural sector
Investment Program (Credit 2698-ZA), Sector and Thematic Evaluation Group,
Operations Evaluation Department, Report 26086, World Bank, Washington DC, June.
WTO (1996 and 2002), Trade Policy Review – Zambia, Geneva: World Trade Organization.
Yagci, F. (2003), “Zambia Trade Policies and Performance”, mimeo, October.
Yagci, F. and R. Kirk (2005), Zambia: Diagnostic Trade Integration Study, Trade Component of
Private Sector Development Program for Zambia, Diagnostic Trade Integration Study,
June.
Zimconsult (2004), “Firm Strategies under Trade Liberalisation – Zambia”, COMESA Country
Report, Harare.

34
Zulu, B., J.J. Nijhoff, T.S. Jayne and A. Negassa (2000), “Is the Glass Half Empty or Half Full?
An Analysis of Agricultural Production trends in Zambia”, FSRP No 2, Food Security
Research Project, Ministry of Agriculture and Cooperatives, Agricultural Consultative
Forum, Michigan State University, January.
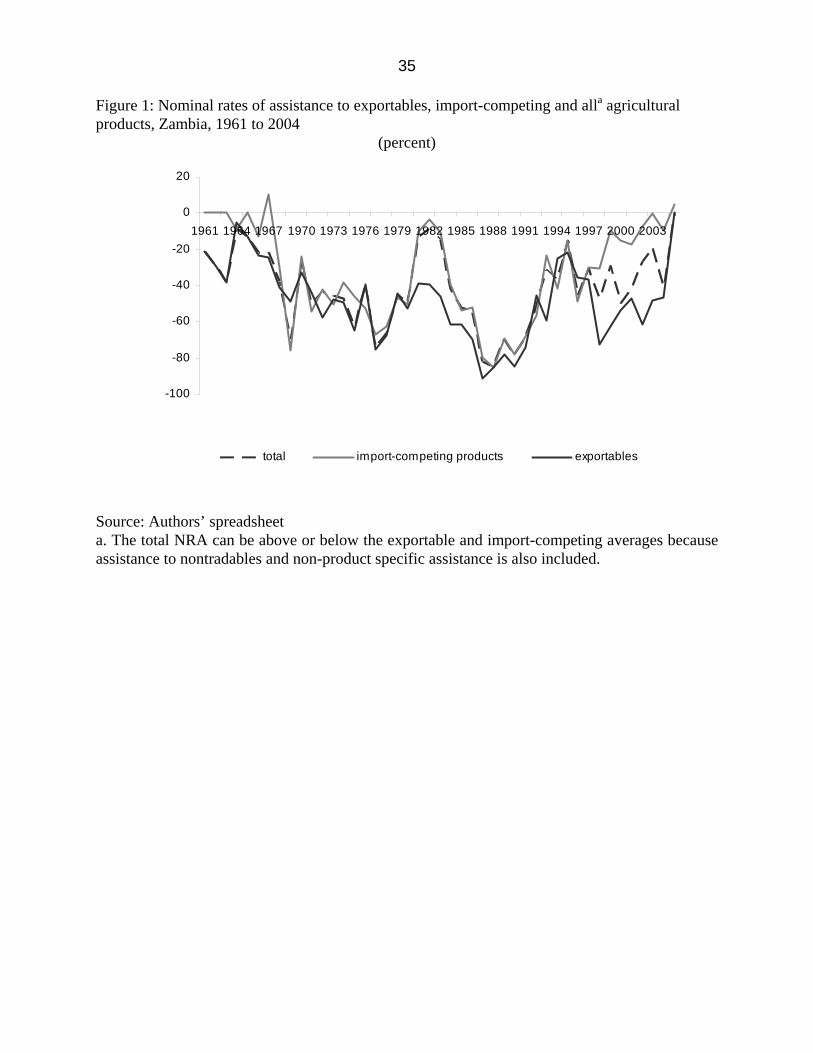
35
Figure 1: Nominal rates of assistance to exportables, import-competing and alla agricultural products, Zambia, 1961 to 2004
(percent)
-100
-80
-60
-40
-20
0
20
1961 1964 1967 1970 1973 1976 1979 1982 1985 1988 1991 1994 1997 2000 2003
total import-competing products exportables
Source: Authors’ spreadsheet a. The total NRA can be above or below the exportable and import-competing averages because assistance to nontradables and non-product specific assistance is also included.

36
Figure 2: Nominal rates of assistance to all nonagricultural tradables, all agricultural tradable industries, and relative rates of assistancea, Zambia, 1961 to 2004
(percent)
-100
-80
-60
-40
-20
0
20
40
60
1961 1964 1967 1970 1973 1976 1979 1982 1985 1988 1991 1994 1997 2000 2003
RRA agricultural tradables nonagricultural tradables
Source: Authors’ spreadsheet
a. The RRA is defined as 100*[(100+NRAagt)/(100+NRAnonagt)-1], where NRAagt and NRAnonagt are the percentage NRAs for the tradables parts of the agricultural and nonagricultural sectors, respectively.

37
Figure 3: Maize and roller meal CTEs and consumer subsidy payment, Zambia, 1955 to 2004
Source: Authors' spreadsheet
-1.2
-1
-0.8
-0.6
-0.4
-0.2
0
0.2
0.4
0.6
0.8
1955 1960 1965 1970 1975 1980 1985 1990 1995 2000 2005 2010 Subsidy %rm priceCTE CTE roller meal

38
Table 1: Nominal rates of assistance to covered farm products, Zambia, 1961 to 2004 (percent)
1961-64 1965-69 1970-74 1975-79 1980-84 1985-89 1990-94 1995-99 2000-04 Exportablesa, b -23.4 -30.3 -46.4 -58.2 -47.7 -77.0 -57.7 -45.9 -52.6 Groundnut na -41.5 -59.4 -68.7 -66.4 -78.2 -77.2 -66.7 -69.2 Cotton na -31.6 -36.6 -38.9 -37.7 -76.6 -34.9 -27.5 -51.4 Tobacco (V) -9.1 -18.4 -30.6 -57.2 -26.9 -77.1 -30.9 -5.2 -29.3 Tobacco (B) -12.0 -47.7 -37.1 -50.1 -37.6 -80.0 -23.4 -23.9 -58.1 Import-competing productsa, b -9.4 -21.6 -41.8 -55.0 -23.0 -67.8 -53.7 -27.0 -10.1 Rice na -14.6 -52.9 -13.9 29.8 -50.5 -27.2 9.5 -23.8 Wheat na -76.7 -60.0 -28.2 12.4 -69.3 -60.2 11.8 23.2 Nontradables Millet 0.0 0.0 0.0 0.0 0.0 0.0 0.0 0.0 0.0 Sunflower 0.0 0.0 0.0 0.0 0.0 0.0 0.0 0.0 0.0 Mixed trade statusb Maize -27.0 -33.7 -41.6 -57.1 -23.1 -67.6 -52.4 -28.3 -29.8 Sorghum na -15.4 -34.4 -64.1 -57.1 -73.7 -53.8 -50.9 -25.0 Soybean na -77.6 -71.3 -39.8 -33.4 -60.7 -54.7 -31.0 -15.7 Total of covered productsa -24.3 -32.8 -42.2 -57.3 -25.5 -68.2 -53.4 -33.6 -34.2 Dispersion of covered productsc 21.8 32.6 26.8 36.2 35.1 33.8 39.4 35.7 33.2 % coverage (at undistorted prices) 78 77 76 75 74 72 71 69 67
Source: Authors’ spreadsheet a. Weighted averages, with weights based on the unassisted value of production. b. Mixed trade status products included in exportable or import-competing groups depending upon their trade status in the particular year. c. Dispersion is a simple 5-year average of the annual standard deviation around the weighted mean of NRAs of covered products.

39
Table 2: Nominal rates of assistance to agricultural relative to nonagricultural industries, Zambia, 1961 to 2004 (percent)
1961-64 1965-69 1970-74 1975-79 1980-84 1985-89 1990-94 1995-99 2000-04 Covered products -24.3 -32.8 -42.2 -57.3 -25.5 -68.2 -53.4 -33.6 -34.2 Non-covered products -4.0 -15.2 -23.9 -34.7 -16.5 -51.6 -36.3 -26.5 -23.0 All agricultural products -19.7 -28.0 -36.8 -49.5 -22.6 -60.8 -46.5 -31.3 -31.3 Non-product specific (NPS) assistance na 5.8 22.4 13.7 20.9 2.7 18.1 2.7 2.8 Total agricultural NRA (incl. NPS)b -19.7 -22.6 -15.8 -37.3 -2.7 -58.9 -30.8 -28.6 -28.5 Trade bias indexb -0.21 0.10 -0.06 -0.08 -0.30 -0.28 -0.08 0.00 -0.41 Assistance to just tradables: All agricultural tradables -22.6 -33.1 -44.3 -57.9 -27.7 -70.0 -55.3 -36.7 -36.5 All non-agricultural tradables 16.1 20.0 27.6 34.5 24.1 24.2 21.2 13.5 6.4 Relative rate of assistance, RRAc -33.4 -43.6 -56.2 -68.5 -41.5 -75.4 -62.7 -44.2 -40.3 MEMO, ignoring exchange rate distortions:
NRA, all agric. products -19.1 -18.3 -11.3 -17.9 -9.2 -63.1 -31.4 -25.3 -24.8 Trade bias indexb -0.16 0.45 0.63 1.17 0.10 1.63 0.64 0.12 -0.41 RRA (relative rate of assistance)c -30.8 -36.3 -48.4 -49.0 -41.8 -74.2 -61.6 -38.9 -36.1
Source: Authors’ spreadsheet a. NRAs including product-specific input subsidies and non-product-specific (NPS) assistance. Total of assistance to primary factors and intermediate inputs divided to total value of primary agriculture production at undistorted prices (percent). b. Trade bias index is TBI = (1+NRAagx/100)/(1+NRAagm/100) – 1, where NRAagm and NRAagx are the average percentage NRAs for the import-competing and exportable parts of the agricultural sector. c. The RRA is defined as 100*[(100+NRAagt)/(100+NRAnonagt)-1], where NRAagt and NRAnonagt are the percentage NRAs for the tradables parts of the agricultural and non-agricultural sectors, respectively.

Appendix: Key quantity and price data, assumptions and sources
For a landlocked country, it would generally be expected that fob import prices for crops imported from world markets would be significantly higher than cif export prices. The figures for Zambia indicate a small gap between import and export prices. For a crop such as maize, there are even years in which the import price is less than the export price. This is because much of the trade in agricultural commodities takes place within the region, rather than internationally, and because trade prices are averages for each calendar year. The main summer agricultural season runs from November to May/June of the following year, with wheat being grown under irrigation in the winter months (April/May to September). A calendar year thus covers part of two summer seasons, plus the winter crops. Imports and exports are undertaken according to circumstance and opportunity in each season, making the relationship between average annual import and export prices unpredictable.
The import and export parity prices are converted to local currency terms at an equilibrium exchange rate that is estimated from the official rate and the proportion of export receipts traded on the parallel market (sanctioned secondary market, such as variants of export retention schemes) and/or the black market (illegal secondary market for foreign currency). The export proportion traded on the parallel market covers all exports: in the case of Zambia, institutional arrangements for the trade of agricultural commodities have been such that up to the early 1990s almost all import and export transactions involving the main crops have taken place at the official exchange rate. From an economic viewpoint, importation of food at the official rate was a very wasteful policy, with the government giving away all of the rent associated with the overvalued currency. The willingness of the government to do this is a reflection of the political importance assigned to keeping down the price of foodstuffs for the urban electorate. Crop coverage, data requirements and sources The crops covered in the study include exportable, import-competing and non-tradable products. The trading status of three crops (maize, sorghum and soybeans) is allowed to vary on a year-to-year basis. Wheat and rice are import-competing products, millet and sunflowers are nontradables, and groundnuts, cotton and tobacco (Burley and Virginia) are exportables. In the case of rice, groundnuts and cotton, we estimate NRAs for the lightly processed products (milled rice, shelled groundnuts and cotton lint plus seed and its products, namely cotton seedcake and oil). The only crop that is analyzed both as in primary and lightly processed form is maize (maize grain and roller meal).
The data requirements of the methodology as laid out in Anderson et al. (2008) far exceed the range, quality and consistency of data available for Zambia. The longest series of trade data is from FAOSTAT, but in several years data are missing or, alternatively, dividing value by price often produces aberrant unit values that clearly would not have applied in practice (e.g., when dividing two small numbers with few significant digits available). The gaps have been filled and the aberrant unit values ‘smoothed’ by using either national trade data (where available) or the international commodity reference price approach, noting also that much of Zambia’s agricultural trade is within the southern African region rather than to/from international ports. As a result, the reference prices for the Zambia case study are an amalgam of the two approaches outlined in the methodology.

41
The only crops for which producer price data over the entire time period (1955-2004) are available are maize and tobacco, and then only from different sources which are not directly compatible with one another. For most of the commodities analyzed in detail in this study, basic producer price and production data are only available from 1966 to the mid-1990s. For the crops that have been traded through the Agricultural Commodity Exchange, which was established in 1994, the price series extend up to the present but with estimates made from other data to fill gaps in 2001 and 2002.
Given the five-decade time period for the study, the primary sources of data were affected by the political, administrative and policy changes which took place. Thus the initial data sources were publications of the Federal Statistics Office, with a separate Central Statistics Office (CSO) for Zambia only being established after independence in 1964. The regular publications at that time, such as the Monthly and Quarterly Digests of Statistics, gradually changed their emphasis and coverage, eventually ceasing to be published. A similar fate befell the invaluable annual Agricultural Statistics Bulletin. These changes reflect in part the changing orientation of donor agencies, with the flagship CSO publications in recent years having a poverty and livelihood orientation, a result of which is a relative neglect of basic macro-economic and sectoral data. Complete series of the most relevant publications no longer exist in the libraries of the CSO or the Ministry of Agriculture. Where national data are not available, or are inconsistent, recourse has been made to FAOSTAT data which (for production and trade) are available from 1961.
Prior to liberalization, the marketing boards were the main source of data. The key data relevant for the study were on marketed production and the minimum or floor prices paid to producers or the maximum or ceiling prices paid by purchasers. Total production data are estimated from the marketed tonnage figures, together with crop forecast surveys (CFS) and post-harvest surveys (PHS).
Following liberalization of agriculture in the mid-1990s, the collection and publication of agricultural data changed dramatically. For production, the Ministry of Agriculture and Coops (MACO) collects and publishes CFS data for large-medium-and small-scale farmers. CSO collects PHS data on small (0-5 ha), medium-scale (5-20 ha) and large-scale farmers, but until recently has published data only for small and medium-scale farmers. Published data for the smaller crops – such as wheat, cotton and tobacco – have suffered from the fact that production of these crops, unlike maize is concentrated in few locations, and are not adequately covered by nation-wide studies. Hence the survey estimates tend to have wide confidence intervals. Wherever possible, this study has used industry estimates of production (e.g., tobacco data from the Tobacco Association of Zambia) which are generally considered more accurate than government figures.
Similar problems bedevil the producer and consumer price data. Prices are time and location specific, and averaging to a single price for each product each calendar year is problematic. After liberalization, the Ministry of Agriculture established an Agricultural Market Information Centre (AMIC) which in principle collects price data from all the main provincial market centers on a monthly basis. Data exist but much of it has not been put in a data base and managed. Most of the data is on consumer prices; wholesale prices were collected only for a brief period (1994-98). AMIC also no longer goes to millers and stock feed companies to collect factory gate prices. Prices are also collected in the production surveys: the PHS gives prices for smallholder farmer sales, while CHS is more likely to report prices in sales by commercial traders and farmers.

42
Data has also been used from the Agricultural Commodities Exchange (ACE), which was established in 1994 to allow large farmers and brokers to trade in the main cereal crops. There are gaps in the data at a time of change of ownership (around 2002), but since 2003 CHC Commodities Ltd has published ACE prices on a weekly basis together with a report on market developments. It has also more recently begun to published futures prices from the South Africa Exchange SAFEX. These are ex-Randfontein prices, with estimates of transport and other costs being supplied so as to report landed import parity Lusaka prices (see example in Appendix Table 5). Transport and marketing margins Data on margins are not collected on a regular and systematic basis in Zambia. Not all of the margin data found during the course of this study has been directly used in making the NRA and CTE calculations. For example, bringing international commodity prices to cif or fob Lusaka equivalents was found to be particularly difficult in circumstances where agricultural trade was actually within the region, but regional price reference series were not available. Adding transport margins - which are multiples of the commodity price at the port in the international price series - often produces results which do not accord with recorded trade unit values for Zambia. As already mentioned, it was thus decided that wherever possible actual cif or fob prices would be used in the denominator of the NRA and CTE ratios, and where there were gaps or implausible values in the data series these would be filled by adding margins to the international reference prices which were close to margins in years immediately preceding or following the year in question. In practice, this implied very different margins and even different signs for various years in different time periods.
As mentioned above, CHC Commodities Limited publishes weekly estimates of future import parity prices of various commodities based on SAFEX futures prices. An example, showing the detailed assumptions, is given in Appendix Table 5. In principle, after liberalization, the NRAs (excluding any non-policy price wedges) should gravitate towards the import duties (0 percent on maize and 15 percent on soy, sunflower and wheat). In fact, other than for wheat the NRAs calculated in this study remain stubbornly negative more than a decade after liberalization.
Various studies give sporadic information on internal transport costs. The Export Diversification Project (FAO 1992), for example, notes that intra year seasonal variations in transport costs are significant. In 1992, rates negotiated between the government and the Truckers Association of Zambia, plus Contract Haulage Limited (which together controlled 70 percent of the road fleet) were Kw 11.6 per tonne-km for short distances (less than 50 km) to about Kw 7.8 per tonne-km for distances over 200 km. By December 1996, road transport over 200 kms was reported to be Kw 117 per tonne-km (Coulter et al. 1996, Table 6). Rail transport rates in 1992 are reported in Appendix Table 6.
Marketing margins have been intensively studied by the Food Security Research Project and related studies (Jayne et al. 1999, Mwanaumo 1997). The margin between the maize price and the retail price of maize meal during the pre-reform period was found to be between 30 percent and 50 percent. This was significantly reduced after the reforms, not least because of the advent of hammer mills. Quantity data for agricultural products and lightly processed food

43
Production volume data are primarily from CSO and MACO publications, in early years the CSO Quarterly Digest of Statistics and MACO’s annual Agricultural Statistics Bulletin. The main source of data was the marketing boards and the crop forecast and post-harvest surveys. In recent years, data has been collected by MACO’s Agricultural Market Information Centre and supplied mainly in electronic form. Where possible, production figures were cross-checked with FAOSTAT data. Quantity data for cotton and tobacco have also been obtained from industry sources (main cotton companies and the Tobacco Association of Zambia, respectively).
Export and import volume data are from FAOSTAT, with some cross-checking and values for the most recent years being obtained from CSO data supplied electronically.
Apparent consumption data are derived with some reference to the ‘marketed production’ data supplied by CSO and MACO for most of the crops studied. In the case of tobacco, an estimate of per capita consumption for burley and virginia tobaccos were combined with CSO population figures. Wholesale product prices The main sources again are CSO, MACO and AMIC publications and electronic data. Prior to 1994, the prices are the minimum guaranteed prices, with actual prices received by farmers in principle being higher (in practice net realizations may have been lower where farmers had to meet transport costs). From 1994, some primary product prices have also been available from the Agricultural Commodity Exchange ACE. These are actual realized prices on the commodity exchange and are published on a weekly basis by CHC Commodities Ltd. Prices In other markets are generally lower. Border prices Where possible, fob and cif prices are calculated from the value of the country’s exports or imports divided by the volume of that trade, with those data extracted from FAOSTAT (1996) from 1961 to 2004. As noted in the text, some clearly aberrant values are ‘smoothed’ using national trade data (supplied electronically by CSO) or international trade commodity price data (extracted from the World Bank’s Global Economic Monitor Database). No quality difference adjustments are made. Exchange rates Official exchange rates are from the IMF (2006 and earlier years)
Parallel exchange rates are assumed to be the black market rates, as reported in International Currency Analysis (1993 and earlier years) and reproduced as premia in Easterly (2006). The proportion of export revenues realized on the parallel market is assumed to be 10 percent in most years but 5 percent from 1955-1970, 25 percent in 1984 and 1992 and 50 percent from 1985 to 1991. From the mid-1980s to 1993, multiple exchange rates operated, the main impact being that food imports were generally at the official rate (keeping the domestic currency cost of food down) while agricultural exports were at a blend rate. At the margin, however, even food imports were at the higher parallel market rate.

44
Conversion factors and other parameters The background paper for the KSV study (Jansen 1988) was an invaluable source of information, not least for conversion factors, margins and other parameters. Missing data Categories where insufficient data were found to construct time series of any significant duration for Zambia were: farm-gate product prices, transport, handling and processing margins, intermediate input prices and input-output value coefficients, production, consumption, input and trade taxes. Subsidy data were compiled from disparate sources, including Jansen (1988) and various World Bank publications on Zambia. The NRAs for non-agricultural tradable goods assumes there are no distortions for exportables and that the only ones for import-competing non-farm goods producers are tariffs, taken from COMTRADE (2006). Principal data sources Bank of Zambia, Quarterly Financial & Statistical Review, Lusaka, various editions Central Statistics Office, Government of Zambia, Quarterly Digest of Statistics, Lusaka, various
editions. COMTRADE (2006), The United Nation Statistical Division Commodity Trade Data Base, data
compiled through the World Integrated Trade Solution (WITS). World Bank, and the United Nations Conference on Trade and Development (UNCTAD). Available at wits.worldbank.org, accessed September.
Easterly, W. (2006), Global Development Network Growth Database, accessed 23 June http://www.nyu.edu/fas/institute/dri/global%20development%20network%20growth%20database.htm
FAO (2006), Zambia Country Profile, Rome: Food and Agriculture Organization. FAOSTAT (2006), Food and Agriculture Organization Statistics Databases. Available at:
//faostat.fao.org. Accessed various dates during May and July 2006. IMF (2005 and earlier years) Zambia - Selected Issues and Statistical Appendix, Washington
DC: International Monetary Fund. IMF (2005 and earlier years), Exchange Arrangements and Exchange Restrictions: Annual
Report, Washington DC: International Monetary Fund (available back to 1950). IMF (2006 and earlier years), International Financial Statistics, Washington DC: International
Monetary Fund (annual). International Currency Analysis (1993 and earlier years), World Currency Yearbook (formerly
Pick’s Currency Yearbook), Brooklyn NY: International Currency Analysis, Inc. Jansen, D. (1988), Trade, Exchange Rate, and Agricultural Pricing Policies in Zambia, World
Bank Comparative Studies, The Political Economy of Agricultural Pricing Policy, Washington DC.
Ministry of Agriculture, Government of Zambia (published annually up to end of 1990s), Agricultural Statistics Bulletin, Lusaka, various editions.
Ministry of Finance & Economic Development, Government of Zambia, Macroeconomic Indicators, various editions.
World Bank (2006a), Global Economic Monitor Database, Washington DC, World Bank

45
World Bank (2006b), World Development Indicators, Washington DC: World Bank (online time series data).
Acronyms ACE Agricultural Commodities Exchange AMIC Agricultural Market Information Centre (part of MACO) CSO Central Statistics Office (established at independence in 1964) FAOSTAT Food and Agricultural Organization Statistical Database MACO Ministry of Agriculture and Cooperatives (in early years just Ministry of
Agriculture, Food and Fisheries)

46
Appendix Figure 1: International copper price and Zambian development phases, 1955 to 2004
Source: Appendix Table 3 and World Bank (2006a).
0
1000
2000
3000
4000
5000
6000
7000
1955 1960 1965 1970 1975 1980 1985 1990 1995 2000 2005
Real Cu pr Hist marker
Federation----¦-First Republic--¦--Second Republic----------------¦--Third Republic------
Maize meal riots 1986 & 1990
Za subsid producer Modest ag growth Heavy cons subsidies Macro instability Economic liberalisation

47
Appendix Figure 2: Agricultural GDP, Zambia, 1970 to 2004
Source: FAOSTAT (2006) and World Bank (2006b).
)
0
100
200
300
400
500
600
700
1970 1972 1974 1976 1978 1980 1982 1984 1986 1988 1990 1992 1994 1996 1998 2000 2002 2004
1995 $ 5 yr averages

48
Appendix Figure 3: Maize production, Zambia, 1970 to 2005
Source: FAOSTAT (2006).
)
0
500
1000
1500
2000
2500
1970 1972 1974 1976 1978 1980 1982 1984 1986 1988 1990 1992 1994 1996 1998 2000 2002 2004
Maize th MT5 yr averages
1992 Drought

49
Appendix Figure 4: Product shares of food production value, Zambia, 1961 to 2005 (percent)
Source: Authors' spreadsheet
0
10
20
30
40
50
60
70
80
90
100%
1961 1965 1975 1985 1995 2005
Tobacco (X)
Cotton (X)
Soya (X/M)
G'nuts (X)
Sunfl (NT)
Millet (NT)
Rice (M)
Wheat (M)
Sorghum
Maize (X/M)

50
Appendix Figure 5: Product shares of food consumption expenditure, Zambia, 1961 to 2005 (percent)
Source: Authors' spreadsheet
0
10
20
30
40
50
60
70
80
90
100
1961 1965 1975 1985 1995 2005
G'nuts (shelled)
Sunflower
Millet
Rice (milled)
Wheat
Sorghu
Maize

51
Appendix Figure 6: Seasonal Price Variability (nominal and real), Zambia, 1998-99
0
100
200
300
400
500
600
700
Jan-98 Apr-98 Jul-98 Nov-98 Feb-99 May-99
Kw/kg1994 Kw/kg
Source: Maize producer prices at public markets in Kabwe 1998/99 - Mundia (1999)

52
Appendix Figure 7: Exchange rate parallel market premium, Zambia, 1965 to 2005 (proportion by which parallel rate exceeds official rate)
Source: Authors' spreadsheet using methodology from Anderson et al (2006).
-1
0
1
2
3
4
5
6
7
1950 1960 1970 1980 1990 2000 2010

53
Appendix Table 1: Prices for primary products, Zambia, 1955 to 2005 (a) Maize, sorghum and wheat MAIZE SORGHUM WHEAT
Domestic price per
MT
Border price per
MT
DP-BP BP
Domestic price per
MT
Border price per
MT
DP-BP BP
Domestic price per
MT
Border price per
MT
DP-BP BP
1955 40 45 -0.11 1956 42 36 0.19 1957 41 29 0.41 1958 42 38 0.11 1959 39 38 0.03 1960 40 39 0.01 1961 40 51 -0.22 1962 35 51 -0.32 1963 31 56 -0.44 1964 41 45 -0.09 1965 41 42 -0.02 1966 37 46 -0.20 39 44 -0.12 57 210 -0.731967 34 47 -0.27 52 46 0.13 56 232 -0.761968 32 55 -0.42 52 74 -0.30 59 250 -0.761969 36 156 -0.77 52 77 -0.32 59 321 -0.821970 39 51 -0.24 52 67 -0.22 61 165 -0.631971 44 99 -0.55 52 66 -0.21 68 239 -0.711972 48 83 -0.42 52 93 -0.44 68 211 -0.681973 48 80 -0.40 52 104 -0.50 83 179 -0.541974 48 89 -0.46 56 86 -0.36 133 238 -0.441975 56 153 -0.64 67 127 -0.48 178 269 -0.341976 70 104 -0.32 67 173 -0.62 178 253 -0.301977 70 288 -0.76 67 245 -0.73 178 354 -0.501978 76 233 -0.68 67 241 -0.72 222 301 -0.261979 100 187 -0.47 67 196 -0.66 222 225 -0.011980 130 263 -0.51 67 234 -0.72 222 236 -0.061981 150 166 -0.10 100 223 -0.55 289 236 0.221982 178 185 -0.04 100 210 -0.52 356 256 0.391983 203 230 -0.12 178 310 -0.43 397 308 0.291984 272 452 -0.40 207 576 -0.64 472 608 -0.221985 315 676 -0.53 299 822 -0.64 502 1,248 -0.601986 611 1,273 -0.52 475 1,183 -0.60 960 1,655 -0.421987 867 4,202 -0.79 822 4,106 -0.80 1,233 9,441 -0.871988 889 5,845 -0.85 844 7,478 -0.89 2,111 16,243 -0.871989 1,200 3,803 -0.68 1,148 4,842 -0.76 2,509 8,622 -0.711990 3,158 13,829 -0.77 3,000 17,140 -0.82 5,411 30,702 -0.821991 5,556 16,134 -0.66 5,278 18,418 -0.71 7,600 48,155 -0.841992 13,333 28,256 -0.53 11,269 29,614 -0.62 14,419 54,415 -0.741993 55,556 69,134 -0.20 55,556 84,022 -0.34 28,889 132,513 -0.781994 89,444 168,274 -0.47 105,556 130,711 -0.19 168,222 143,525 0.171995 165,926 198,989 -0.17 166,667 180,687 -0.08 227,654 228,073 0.001996 197,118 412,836 -0.52 177,778 451,395 -0.61 422,222 264,572 0.60

54
1997 204,167 298,002 -0.31 162,963 354,990 -0.54 369,192 397,413 -0.071998 360,185 530,802 -0.32 166,667 627,586 -0.73 424,074 383,411 0.111999 636,944 699,171 -0.09 250,000 604,569 -0.59 514,794 536,087 -0.042000 351,111 740,823 -0.53 298,876 821,294 -0.64 699,857 637,802 0.102001 396,144 627,895 -0.37 375,647 1,136,776 -0.67 2002 885,188 971,185 -0.09 558,036 636,493 -0.12 2003 765,440 796,417 -0.04 580,580 550,627 0.05 1,354,085 1,129,909 0.202004 700,779 1,317,055 -0.47 769,011 685,134 0.12 1,519,340 904,233 0.682005 952,558 881,669 0.08 1,387,262 1,723,263 -0.19 1,475,334 1,347,891 0.09
(b) Millet, sunflower and soyabean
MILLET SUNFLOWER SOYABEANS Domestic
price per MT
Non-tradable
DP-BP BP
Domestic price per
MT
Non-tradable
DP-BP BP
Domestic price per
MT
Border price per
MT
DP-BP BP
1966 39 0 1967 35 0 49 0 41 157 -0.741968 56 0 49 0 36 173 -0.791969 52 0 49 0 36 174 -0.801970 52 0 49 0 36 179 -0.801971 52 0 168 0 93 235 -0.601972 52 0 120 0 93 299 -0.691973 56 0 133 0 93 518 -0.821974 67 0 179 0 147 424 -0.651975 67 0 168 0 147 458 -0.681976 67 0 200 0 189 169 0.121977 67 0 200 0 189 681 -0.721978 67 0 270 0 239 703 -0.661979 67 0 274 0 278 291 -0.041980 67 0 328 0 356 590 -0.401981 67 0 352 0 403 556 -0.281982 67 0 415 0 469 519 -0.101983 322 0 430 0 503 743 -0.321984 328 0 430 0 583 1,379 -0.581985 423 0 558 0 677 1,237 -0.451986 625 0 839 0 1,246 1,239 0.011987 1,022 0 1,400 0 1,644 19,719 -0.921988 1,778 0 1,800 0 2,417 23,259 -0.901989 2,199 0 3,240 0 3,111 13,779 -0.771990 4,833 0 6,428 0 6,413 44,613 -0.861991 7,778 0 10,072 0 8,905 25,693 -0.651992 16,925 0 18,823 0 25,794 47,192 -0.451993 175,556 0 80,000 0 88,889 282,916 -0.691994 177,778 0 137,000 0 222,222 243,276 -0.091995 180,000 0 210,000 0 280,556 458,242 -0.391996 200,000 0 240,000 0 331,204 434,027 -0.241997 222,204 0 227,500 0 380,556 457,453 -0.171998 276,389 0 341,111 0 403,611 547,779 -0.261999 337,037 0 440,000 0 413,148 814,636 -0.49

55
2000 376,579 0 512,000 0 683,436 556,708 0.232001 396,970 0 549,964 0 500,000 891,861 -0.442002 586,364 0 641,952 0 638,889 899,806 -0.292003 586,296 0 803,611 0 1,466,188 1,144,935 0.282004 1,687,729 3,864,351 -0.562005 962,769 0 1,278,829 1,229,937 0.04
(c) Tobacco TOBACCO - burley TOBACCO - virginia
Domestic price per
MT
Border price per MT
DP-BP
BP
Domestic price per
MT
Border price per MT
DP-BP BP
1955 489 516 -0.05 625 630 -0.011956 408 465 -0.12 570 567 0.011957 680 567 0.20 700 692 0.011958 414 544 -0.24 643 665 -0.031959 403 563 -0.28 611 687 -0.111960 606 556 0.09 617 679 -0.091961 441 672 -0.34 608 677 -0.101962 589 600 -0.02 644 750 -0.141963 505 656 -0.23 758 820 -0.071964 392 433 -0.09 514 539 -0.051965 320 472 -0.32 602 586 0.031966 313 573 -0.45 650 721 -0.101967 276 791 -0.65 940 1,004 -0.061968 441 856 -0.48 650 1,086 -0.401969 507 959 -0.47 750 1,218 -0.381970 560 732 -0.24 810 926 -0.131971 560 853 -0.34 810 1,077 -0.251972 570 949 -0.40 880 1,198 -0.271973 620 1,252 -0.50 880 1,579 -0.441974 860 1,373 -0.37 960 1,732 -0.451975 970 1,435 -0.32 840 1,809 -0.541976 1,010 1,751 -0.42 970 2,218 -0.561977 1,060 3,040 -0.65 1,100 3,862 -0.721978 1,100 3,474 -0.68 1,450 4,394 -0.671979 1,110 1,919 -0.42 1,510 2,421 -0.381980 1,250 1,272 -0.02 1,570 1,592 -0.011981 1,260 2,510 -0.50 1,650 3,083 -0.461982 1,560 2,577 -0.39 2,400 3,111 -0.231983 1,650 2,519 -0.34 2,700 3,050 -0.111984 1,800 4,784 -0.62 2,800 5,873 -0.521985 2,300 7,081 -0.68 3,450 8,676 -0.601986 3,500 23,264 -0.85 5,120 28,660 -0.821987 5,100 45,511 -0.89 6,250 56,217 -0.891988 9,000 59,484 -0.85 14,000 72,216 -0.811989 12,000 45,624 -0.74 14,400 54,698 -0.741990 48,000 190,115 -0.75 60,000 224,979 -0.731991 86,000 118,848 -0.28 87,450 135,623 -0.361992 145,000 548,390 -0.74 166,320 617,251 -0.73

56
1993 867,100 576,546 0.50 747,040 666,696 0.121994 857,660 790,348 0.09 1,089,650 945,312 0.151995 1,321,170 1,565,429 -0.16 1,789,670 1,869,930 -0.041996 2,284,480 1,948,940 0.17 3,556,520 2,235,678 0.591997 1,932,560 2,839,198 -0.32 3,069,360 3,220,093 -0.051998 2,102,100 4,610,420 -0.54 2,809,170 5,181,111 -0.461999 3,156,000 4,842,829 -0.35 3,813,500 5,460,128 -0.302000 2,341,560 4,333,125 -0.46 4,600,960 5,007,876 -0.082001 2,344,550 4,627,204 -0.49 4,328,400 5,375,601 -0.192002 3,222,600 8,805,226 -0.63 6,523,800 9,984,418 -0.352003 4,614,390 16,153,770 -0.71 8,016,920 18,024,663 -0.562004 4,419,000 11,188,493 -0.61 8,935,000 12,494,657 -0.28
Source: Authors’ spreadsheet

57
Appendix Table 2: Prices for lightly processed foods, Zambia, 1961 to 2005 (a) Maize meal and milled rice MAIZE MEAL RICE milled
Domestic price per
MT
Border price per MT
DP-BP
BP
Domestic price per
MT
Border price per
MT
DP-BP
BP 1961 62 146 -0.58 1962 54 146 -0.63 1963 49 159 -0.70 1964 64 175 -0.64 1965 64 249 -0.74 1966 58 205 -0.72 164 163 0.01 1967 54 207 -0.74 190 222 -0.15 1968 50 133 -0.62 190 250 -0.24 1969 55 196 -0.72 190 238 -0.20 1970 61 236 -0.74 190 451 -0.58 1971 69 176 -0.61 190 521 -0.64 1972 75 299 -0.75 232 571 -0.59 1973 75 236 -0.68 232 505 -0.54 1974 75 241 -0.69 316 449 -0.30 1975 87 378 -0.77 316 355 -0.11 1976 109 478 -0.77 379 500 -0.24 1977 109 632 -0.83 379 484 -0.22 1978 118 577 -0.80 379 473 -0.20 1979 156 501 -0.69 421 394 0.07 1980 203 546 -0.63 474 425 0.12 1981 234 552 -0.58 474 460 0.03 1982 277 507 -0.45 738 482 0.53 1983 317 784 -0.60 1,054 718 0.47 1984 425 1,577 -0.73 1,054 782 0.35 1985 491 2,144 -0.77 1,054 1,129 -0.07 1986 954 3,412 -0.72 1,464 2,176 -0.33 1987 1,352 11,530 -0.88 2,186 9,806 -0.78 1988 1,387 18,720 -0.93 2,924 15,138 -0.81 1989 1,873 11,274 -0.83 4,441 9,829 -0.55 1990 4,928 40,674 -0.88 9,732 32,106 -0.70 1991 8,669 18,066 -0.52 15,422 41,116 -0.62 1992 20,806 30,046 -0.31 34,293 98,758 -0.65 1993 94,875 82,988 0.14 210,714 127,014 0.66 1994 159,673 131,050 0.22 289,732 302,460 -0.04 1995 255,166 215,804 0.18 948,214 550,712 0.72 1996 341,590 500,407 -0.32 1,106,250 805,543 0.37 1997 333,283 372,697 -0.11 532,639 696,203 -0.23 1998 552,861 416,950 0.33 653,214 750,606 -0.13 1999 582,159 543,528 0.07 659,458 886,289 -0.26 2000 549,154 734,990 -0.25 555,874 1,078,677 -0.48 2001 714,969 1,147,463 -0.38 961,937 1,180,854 -0.19 2002 1,225,286 1,060,044 0.16 927,671 1,348,020 -0.31 2003 1,140,939 958,637 0.19 1,227,042 1,192,970 0.03 2004 916,667 3,321,087 -0.72

58
2005 1,140,741 2,732,863 -0.58 (b) Shelled groundnuts and cotton lint
GROUNDNUTS shelled COTTON lint, seed & cake Domestic
price per MT
Border price per
MT
DP-BP BP
Domestic price per
MT
Border price per MT
DP-BP
BP
1965 120 244 -0.51 329 451 -0.27 1966 128 216 -0.41 329 537 -0.39 1967 124 159 -0.22 352 443 -0.20 1968 128 205 -0.38 352 572 -0.38 1969 128 286 -0.55 352 527 -0.33 1970 128 221 -0.42 399 496 -0.20 1971 128 287 -0.56 399 487 -0.18 1972 128 390 -0.67 399 728 -0.45 1973 158 437 -0.64 399 1,058 -0.62 1974 213 665 -0.68 587 947 -0.38 1975 213 879 -0.76 704 1,057 -0.33 1976 313 701 -0.55 939 1,715 -0.45 1977 313 1,320 -0.76 939 2,062 -0.54 1978 358 1,364 -0.74 1,080 1,801 -0.40 1979 400 1,054 -0.62 1,080 1,369 -0.21 1980 438 2,119 -0.79 1,080 1,793 -0.40 1981 576 1,299 -0.56 1,080 1,209 -0.11 1982 600 1,433 -0.58 1,103 1,663 -0.34 1983 688 2,071 -0.67 1,221 2,162 -0.44 1984 894 3,175 -0.72 1,361 3,475 -0.61 1985 1,146 3,702 -0.69 1,573 4,064 -0.61 1986 1,644 5,289 -0.69 1,972 6,006 -0.67 1987 2,025 23,433 -0.91 3,756 39,721 -0.91 1988 3,625 19,012 -0.81 7,042 55,231 -0.87 1989 4,210 21,590 -0.81 8,450 35,937 -0.76 1990 8,530 108,443 -0.92 22,768 98,473 -0.77 1991 13,836 130,375 -0.89 36,452 119,619 -0.70 1992 35,025 137,237 -0.74 201,861 179,015 0.13 1993 125,000 508,054 -0.75 281,667 652,937 -0.57 1994 342,500 753,537 -0.55 938,889 808,082 0.16 1995 375,000 982,682 -0.62 1,135,837 1,153,450 -0.02 1996 387,500 1,563,773 -0.75 1,332,549 1,407,396 -0.05 1997 562,963 1,491,376 -0.62 1,295,875 1,594,206 -0.19 1998 496,296 4,144,116 -0.88 1,267,500 2,264,180 -0.44 1999 883,133 2,726,146 -0.68 1,008,938 3,138,793 -0.68 2000 642,111 2,974,104 -0.78 1,533,387 3,237,261 -0.53 2001 754,728 3,674,285 -0.79 1,971,667 4,044,801 -0.51 2002 914,727 3,168,849 -0.71 2,018,611 5,597,281 -0.64 2003 1,299,104 2,489,537 -0.48 2,863,611 4,601,282 -0.38
Source: Authors’ spreadsheet

59
Appendix Table 3: Foreign exchange rates, Zambia, 1955 to 2005 (Kwacha per US$)
Official rate
Commodity specific
rate (n/a)
Secondary or parallel
market rate
Reten-tion
rate (a)
Discount to
secondary market
rate
Estimated equilibrium
exchange rate using
this study's methodolog
y (b) 1955 0.71 0.71 0.00 0.71 1956 0.71 0.71 0.00 0.71 1957 0.71 0.71 0.00 0.71 1958 0.71 0.71 0.00 0.71 1959 0.71 0.71 0.00 0.71 1960 0.71 0.74 0.05 0.73 1961 0.71 0.74 0.05 0.73 1962 0.71 0.74 0.05 0.73 1963 0.71 0.87 0.05 0.80 1964 0.71 0.78 0.05 0.75 1965 0.71 0.78 0.05 0.75 1966 0.71 0.75 0.05 0.74 1967 0.71 0.82 0.05 0.77 1968 0.71 1.05 0.05 0.89 1969 0.71 1.11 0.05 0.92 1970 0.71 0.94 0.05 0.83 1971 0.71 1.27 0.10 1.02 1972 0.71 1.54 0.10 1.17 1973 0.65 1.24 0.10 0.98 1974 0.64 0.99 0.10 0.84 1975 0.64 1.54 0.10 1.14 1976 0.70 1.73 0.10 1.27 1977 0.79 2.37 0.10 1.66 1978 0.80 1.95 0.10 1.43 1979 0.79 1.32 0.10 1.08 1980 0.79 1.33 0.10 1.09 1981 0.87 1.21 0.10 1.05 1982 0.93 1.35 0.10 1.16 1983 1.26 1.59 0.10 1.44 1984 1.81 3.55 0.25 2.90 1985 3.14 5.32 0.50 4.78 1986 7.79 10.39 0.50 9.74 1987 9.52 47.60 0.50 38.08 1988 8.27 57.86 0.50 45.46 1989 13.81 31.90 0.50 27.38 1990 30.29 121.61 0.50 98.78 1991 64.64 134.23 0.50 116.83 1992 172.21 204.10 0.25 192.14 1993 452.76 553.29 0.10 508.05 1994 669.37 822.40 0.10 753.54

60
1995 864.12 935.60 0.10 903.43 1996 1,208 1,286.30 0.10 1,251.02 1997 1,315 1,564.92 0.10 1,452.23 1998 1,8628 2,327.59 0.10 2,118.10 1999 2,388 2,388.02 0.10 2,388.02 2000 3,111 3,110.84 0.10 3,110.84 2001 3,611 3,610.94 0.10 3,610.94 2002 4,399 4,398.60 0.10 4,398.60 2003 4,733 4,733.27 0.10 4,733.27 2004 4,797 4,797.13 0.10 4,797.13 2005 4,616 4,616.07 0.10 4,616.07
a The proportion of foreign currency actually sold by all exporters at the parallel market rate. b See Anderson et al. (2008) on the exchange rate methodology used in this study. Source: Authors’ spreadsheet

Appendix Table 4: Chronology of policy milestones, Zambia Political Macro-economic Trade Policy Agricultural Policy Food policy
1955 Federal Government based in Southern
Rhodesia
1963 End of Federation 1964 Independence (24 Oct),
start of First Republic
1965 Rhod sanctions- Zambia's road & rail
links affected
1969 Nationalisation of copper mines
1971 From 1971-88, substantial maize meal
subsidies 1973 Second Republic (Aug)
- one party state
1974 Copper prices start to fall from mid-1974
1977 Dissidents in UNIP oppose economic
management
Presidential speech on economic crisis (Oct)
1978 Austerity budget 1980 Failed coup attempt
(Oct)
1981 Detention of labour leaders - strikes
Real interest rates negative 1981-1993 (peak of -137% in
1992)
1984 Economic restructuring announced (Aug)
1985 Forex auction and import liberalisation
1986 Economic team changed (April)
Liberalisation of inter-district grain trade
Maize meal riots on Copperbelt (Dec);
subsidies removed & reintroduced

62
Political Macro-economic Trade Policy Agricultural Policy Food policy 1987 Labour unrest (Jan);
Mayday speech announcing break with
BWI
BWI programmes suspended; New Economic Recovery
Programme (May)
1989 WB/IMF agreement on PFP
Devaluation and removal of price
controls
NAMBOARD abolished, maize marketing function transferred to
Cooperative Federation
Tripling of maize price, coupon system for targeting subsidy
(operational until 1992); other consumer
prices decontrolled
1990 Maize meal riots & coup attempt (June); formation of MMD
(Aug)
Dual exchange rate system
Maize meal subsidy removed; food riots
1991 Election 25 Oct; start of Third Republic
BWI programmes suspended
Removal of most export controls & ban on maize
exports
Substantial reduction in fertiliser subsidy (Dec)
Subsidy re-introduced before the election
1992 Chiluba govt. Privatisation Law
(July); key ministers resign (Aug); first phase of PS redundancy (Sept)
Devaluation (30%) (Jan); PFP agreed
(Feb); debt rescheduling (Aug);
interest rates liberalised; forex
bureaus (Oct); exchange rates unified
(Dec)
Non trade exporters allowed 100% retention & import
preferences except for PTA revoked (Jan); OGIL
expanded (Oct); increased COMESA preference
Major drought - substantial maize imports needed. Fertiliser market opened to full competition & pan-
territorial pricing eliminated - pricing to reflect differential transport costs
(June).
Roller meal subsidy removed (June); deregulation of
informal, small-scale milling.
1993 Zero Option Plan to overthrow Chiluba
discovered (Feb); state of emergency for a
period; reform ministers sacked (April)
Cash budget, tax reduction & weekly
tender (Jan)
General reduction in tariffs and excises & shift to HS
(Jan); elimination of import & export licences (June)
Markets for maize & fertiliser opened to full competition (July)
Official producer and selling prices
abolished.
1994 Chiluba speech criticising economic and
agric policies (July)
Exchange controls removed (Jan)
In-bond & duty drawback schemes (Jan)
Agricultural Credit Management Programme

63
Political Macro-economic Trade Policy Agricultural Policy Food policy 1995 Bank crisis; Land Act
(July) VAT (July) Removal of 20% uplift factor
applied to import values Privatisation of the milling industry. Launch of World Bank Agricultural
Sector Investment Programme
No floor price for maize. Hammermills help reduce the price
of food 1996 MMD win elections boycotted
by UNIP Customs duty exemptions eliminated,
tariffs reduced by 15% on most goods (Jan)
Food Reserve Agency
operational
1997 Failed coup (Oct); Kaunda detained & soe declared
Donors withdraw balance of payments support
1998 Finance Minister fired 2000 ZCCM sale to Anglo American 2001 Election November 2002 Mwanawasa govt Anglo American
withdrawal Poverty Reduction Strategy
Paper presented to donors GM food aid refused; FRA
as subsidised buyer from small-scale sector
2003 Maize & fertliser subsidies increased
2005 HIPC Completion Point attained (April)
Sources: Based on Jansen (1991), Rakner et al. (1999) and McCulloch et al. (2001), with cross-checking and additions from many
other sources listed in this paper.

Appendix Table 5: Sample agricultural market exchange price schedule
Source: CHC Commodities, Lusaka
U.S.$1.00 = ZK3,420.00 @ 23/12/05 . . SAFEX Futures Prices for October in U.S.$ (ex Randfontein, RSA) as at 23/12/05 UNIT BIDS OFFERS MTM IMPORT PARITY (EST) DDP OR DDU, LUSAKA, Soya bean US$/MT $252.23 $263.26 $255.38 $469.66 (DDP) Sunflower US$/MT $342.08 $349.96 $349.96 $581.17 (DDP) Wheat US$/MT $220.70 $221.17 $220.70 $428.77 (DDP) White Maize US$/MT $178.92 $180.50 $179.71 $335.83 (DDU) Yellow Maize US$/MT $143.30 $145.03 $143.45 $298.66 (DDU) Exchange rate from Xe.com U.S.$1.00 : SAR6.34 @ 23/12/05 Import parity Prices Include: Duty @ 15% on Soya, Sunflower & Wheat & 0% duty on White & Yellow Maize. Bagging & Handling ex silo @ U.S.$13.00 per metric tonne Wheat price excludes VAT @ 17.5% Insurance @ 1% Clearing costs @ 1.5% Freight rate estimated @ U.S.$130.00/mt Randfontein to Lusaka DDP: Incoterm”Delivered Duty Paid” DDU: Incoterm “Delivered Duty Unpaid” .

2
Appendix Table 6: Rail Transport Rates, Zambia, 1992 Commodity From To Freight/ton Maize
Lusaka
Livingstone
Kw 2286
Cotton Lusaka Livingstone Kw 2340 Tobacco* Lusaka Livingstone Kw 2240 Maize Lusaka Victoria Falls US$ 53 Cotton Lusaka Victoria Falls US$ 54 Tobacco* Lusaka Victoria Falls US$ 54 Maize Lusaka New Kapiri US$ 22 Cotton Lusaka New Kapiri US$ 33.80 Tobacco*
Lusaka New Kapiri US$ 33.80

3
Appendix Table 7: Annual distortion estimates, Zambia, 1961 to 2004 (a) Nominal rates of assistance to covered products
(percent)
Cotton Groundnut Maize Millet Rice Sorghum Soybean SunflowerTobacco V Tobacco B WheatAll
covered
1961 na na -22 na na na na na -10 -34 na -211962 na na -32 na na na na na -14 -2 na -291963 na na -44 na na na na na -7 -23 na -381964 na na -9 na na na na na -5 -9 na -91965 -27 -51 -2 na na na na na 3 -32 na -111966 -39 -41 -20 0 na -12 na na -10 -45 -73 -221967 -20 -22 -27 0 na 13 na 0 -6 -65 -76 -221968 -38 -38 -42 0 -24 -30 na 0 -40 -48 -76 -381969 -33 -55 -77 0 -20 -32 na 0 -38 -47 -82 -691970 -20 -42 -24 0 -58 -22 na 0 -13 -24 -63 -251971 -18 -56 -55 0 -64 -21 na 0 -25 -34 -71 -501972 -45 -67 -42 0 -59 -44 na 0 -27 -40 -68 -431973 -62 -64 -40 0 -54 -50 -82 0 -44 -50 -54 -451974 -38 -68 -46 0 -30 -36 -65 0 -45 -37 -44 -471975 -33 -76 -64 0 -11 -48 -68 0 -54 -32 -34 -631976 -45 -55 -32 0 -24 -62 12 0 -56 -42 -30 -391977 -54 -76 -76 0 -22 -73 -72 0 -72 -65 -50 -741978 -40 -74 -68 0 -20 -72 -66 0 -67 -68 -26 -661979 -21 -62 -47 0 7 -66 -4 0 -38 -42 -1 -451980 -40 -79 -51 0 12 -72 -40 0 -1 -2 -6 -491981 -11 -56 -10 0 3 -55 -28 0 -46 -50 22 -131982 -34 -58 -4 0 53 -52 -10 0 -23 -39 39 -81983 -44 -67 -12 0 47 -43 -32 0 -11 -34 29 -151984 -61 -72 -40 0 35 -64 -58 0 -52 -62 -22 -421985 -61 -69 -53 0 -7 -64 -45 0 -60 -68 -60 -521986 -67 -69 -52 0 -33 -60 1 0 -82 -85 -42 -541987 -91 -91 -79 0 -78 -80 -92 0 -89 -89 -87 -821988 -87 -81 -85 0 -81 -89 -90 0 -81 -85 -87 -851989 -76 -81 -68 0 -55 -76 -77 0 -74 -74 -71 -691990 -77 -92 -77 0 -70 -82 -86 0 -73 -75 -82 -791991 -70 -89 -66 0 -62 -71 -65 0 -36 -28 -84 -691992 13 -74 -53 0 -65 -62 -45 0 -73 -74 -74 -511993 -57 -75 -20 0 66 -34 -69 0 12 50 -78 -311994 16 -55 -47 0 -4 -19 -9 0 15 9 17 -371995 -2 -40 -17 0 72 -8 -39 0 -4 -16 0 -151996 -5 -75 -52 0 37 -61 -24 0 59 17 60 -461997 -19 -62 -31 0 -23 -54 -17 0 -5 -32 -7 -311998 -44 -88 -32 0 -13 -73 -26 0 -46 -54 11 -471999 -68 -68 -9 0 -26 -59 -49 0 -30 -35 -4 -292000 -53 -78 -53 0 -48 -64 23 0 -8 -46 10 -502001 -51 -79 -37 0 -19 -67 -44 0 -19 -49 12 -412002 -64 -71 -9 0 -31 -12 -29 0 -35 -63 7 -272003 -38 -48 -4 0 3 5 28 0 -56 -71 20 -192004 na na -47 0 na 12 -56 na -28 -61 68 -41

4
Appendix Table 7 (continued): Annual distortion estimates, Zambia, 1961 to 2004 (b) Nominal and relative rates of assistance to alla agricultural products, to exportableb and import-competing b agricultural industries, and relativec to non-agricultural industries (percent)
Total ag NRA Ag tradables NRA
Covered products
Inputs Outputs
Non-covered products
All products
(incl NPS) Export-
ables Import-
competing All
Non-ag tradables
NRA RRA 1961 0 -21 -3 na -21 0 -20 15 -30 1962 0 -29 -4 na -29 0 -27 15 -36 1963 0 -38 -6 na -38 0 -35 19 -46 1964 0 -9 -4 na -5 -9 -9 16 -22 1965 0 -11 -2 -7 -11 0 -12 16 -25 1966 0 -22 -7 -17 -24 -13 -22 15 -33 1967 0 -22 0 -9 -25 11 -21 18 -32 1968 0 -38 -17 -26 -41 -30 -39 25 -51 1969 0 -69 -51 -54 -49 -76 -71 26 -77 1970 0 -25 -13 17 -33 -24 -27 22 -40 1971 0 -50 -30 -29 -44 -54 -52 28 -63 1972 0 -43 -26 -20 -58 -42 -47 33 -60 1973 0 -45 -28 -25 -48 -51 -48 30 -60 1974 0 -47 -22 -22 -50 -38 -48 25 -58 1975 0 -63 -30 -39 -65 -46 -62 35 -72 1976 0 -39 -29 -25 -39 -53 -42 36 -57 1977 0 -74 -48 -59 -75 -67 -73 39 -81 1978 0 -66 -42 -47 -67 -63 -66 35 -75 1979 0 -45 -25 -17 -44 -46 -46 27 -57 1980 0 -49 -29 -18 -53 -50 -51 27 -61 1981 0 -13 -9 13 -39 -11 -15 22 -31 1982 0 -8 -7 18 -40 -4 -10 24 -27 1983 0 -15 -11 4 -46 -11 -18 20 -31 1984 0 -42 -26 -31 -61 -39 -45 27 -57 1985 0 -52 -33 -44 -61 -53 -55 21 -63 1986 0 -54 -36 -47 -70 -52 -56 18 -62 1987 0 -82 -69 -73 -91 -80 -83 29 -87 1988 0 -85 -70 -74 -85 -85 -85 30 -89 1989 0 -69 -50 -56 -78 -69 -71 24 -76 1990 0 -79 -62 -66 -85 -78 -80 28 -84 1991 0 -69 -48 -50 -74 -68 -70 23 -76 1992 0 -51 -32 -2 -46 -57 -54 18 -61 1993 0 -31 -19 -14 -59 -24 -34 19 -44 1994 0 -37 -20 -22 -25 -42 -39 19 -49 1995 0 -15 -10 -6 -22 -15 -17 17 -29 1996 0 -46 -27 -37 -36 -49 -46 17 -54 1997 0 -31 -20 -27 -37 -30 -32 12 -40 1998 0 -47 -44 -45 -73 -31 -54 13 -59 1999 0 -29 -31 -29 -63 -10 -34 8 -39 2000 0 -50 -25 -41 -54 -15 -48 8 -52 2001 0 -41 -22 -31 -47 -18 -41 8 -45 2002 0 -27 -30 -25 -62 -8 -32 8 -37 2003 0 -19 -19 -17 -48 -1 -22 5 -26 2004 0 -41 -20 -29 -46 -10 -39 5 -42
a. NRAs including assistance to nontradables and non-product specific assistance. b. NRAs including products specific input subsidies. c. The Relative Rate of Assistance (RRA) is defined as 100*[(100+NRAagt)/ (100+NRAnonagt)-1], where NRAagt and NRAnonagt are the percentage NRAs for the tradables parts of the agricultural and non-agricultural sectors, respectively.

5
Appendix Table 7 (continued): Annual distortion estimates, Zambia, 1970 to 2004 (c) Value shares of primary production of covereda and non-covered products, (percent)
Cotton Groundnut Maize Millet Rice Sorghum Soybean SunflowerTobacco V Tobacco B WheatNon-
covered
1961 na na 68 na na na na na 9 1 na 221962 na na 66 na na na na na 11 1 na 221963 na na 64 na na na na na 12 1 na 231964 na na 64 na na na na na 12 2 na 231965 1 15 55 na na na na na 10 1 na 191966 2 12 48 4 na 3 na na 7 0 0 241967 0 10 52 4 na 3 na 0 7 0 0 231968 1 11 44 5 0 4 na 0 8 0 0 261969 1 6 49 2 0 2 na 0 3 0 0 381970 2 16 40 5 0 4 na 0 6 0 0 261971 1 9 50 2 0 2 na 0 3 0 0 311972 1 13 46 5 0 2 na 0 3 0 0 301973 1 18 38 3 0 2 0 0 5 0 0 311974 0 10 50 2 0 1 0 1 5 0 0 291975 0 9 52 1 0 2 0 0 3 0 0 321976 1 16 44 1 0 1 0 1 4 0 0 321977 1 7 49 1 0 1 0 0 2 0 0 391978 1 5 51 0 0 1 0 0 3 0 0 371979 3 5 53 1 0 1 0 1 4 0 0 311980 3 4 56 0 0 1 0 2 1 0 0 331981 3 3 57 0 0 1 1 3 3 1 1 281982 4 3 51 0 0 1 1 6 2 1 1 281983 4 4 50 1 1 1 1 6 2 0 1 291984 8 3 46 1 0 1 2 3 2 0 1 331985 3 2 50 1 0 1 1 2 1 0 1 361986 3 2 49 0 0 2 1 1 4 0 1 371987 2 5 31 0 0 1 2 0 1 0 2 551988 4 1 33 0 0 1 1 0 1 0 2 561989 5 4 41 0 0 1 2 0 1 0 2 441990 3 6 31 0 0 1 2 0 1 1 3 511991 5 6 34 0 1 1 1 0 1 1 6 441992 5 6 35 2 1 1 1 1 2 1 8 371993 5 7 41 2 0 1 3 1 1 1 3 341994 3 6 46 3 1 1 2 1 1 0 2 341995 4 6 47 3 1 2 3 1 1 1 3 271996 3 4 52 1 0 1 2 1 0 0 1 331997 7 8 40 2 1 2 2 1 2 1 4 311998 5 17 27 1 0 1 1 2 2 2 2 391999 11 8 35 1 0 1 1 0 2 1 3 352000 5 8 43 1 0 1 1 1 2 1 3 342001 7 11 33 1 0 2 2 1 2 2 5 342002 7 9 35 1 0 0 1 0 2 3 4 372003 4 6 34 1 0 0 2 0 6 7 5 342004 na na 44 1 na 0 6 na 5 6 3 35
Source: Authors’ spreadsheet a. At farmgate undistorted prices