lehigh valley health network - namcp kile lawrence.pdf · lehigh valley health network journey to...
TRANSCRIPT

11/17/2014
1
Lehigh Valley Health NetworkJourney to Value Based Care and Payment Innovation:
A Case Study
Greg Kile, SVP, Insurance & Payer StrategiesSue Lawrence, SVP, Care Continuum
Fast Facts• In Allentown/Bethlehem area, north of
Philadelphia• Recognized by U.S. News & World
Report, Fortune, Modern Healthcare, Leapfrog, others
• 5 hospital campuses, 11 Health Centers• 1161 acute care beds• 1,200 physicians
(700 network-employed)• 13,000 employees• Ancillary Services• Physician Hospital Organization• Revenues over $2 Billion• Populytics – Population Health
Management & Advanced Analytics Firm 2
Lehigh Valley Health Network
2

11/17/2014
2
• Engage payers in value-based contracting conversations with a population health focus.
• Describe the importance of predictive analytics in managing populations.
• Identify methods for prioritizing and managing high-risk populations
Objectives
3
4
Present
Quality Incentives
Fee-For-Service
Near Term
Shared Savings
Fee-For-Service
Future
Global Risk Contracting
Fee-For-Service
“Fee-for-Service” “Fee-for-Value”• “Piece Work”
- Taking care of individualswhen there’s a problem and getting paid for doing things to them
• “Lives Under Management”- Taking care of populationsproactively and getting paid for keeping them healthy and navigating them through illness
Our Journey to Value

11/17/2014
3
PATIENT PROTECTION & AFFORDABLE CARE ACT
DRIVES HEALTH SYSTEM CHANGE TO OPTIMIZE PERFORMANCE
Value vs. Volume
Payment Innovation
New Care Models
LVHN’s Transition to Population Health Management
5
TARGETING THE “TRIPLE AIM”• Improved patient experience — quality & satisfaction• Reduced cost of health care• Improved health of the population
LVHN1.2%
Evolving Payment Structure: Tradition to Innovation
ProviderUnit
Cost + Admin
Fee
Traditional Payer Employer
6
11/17/2014
4
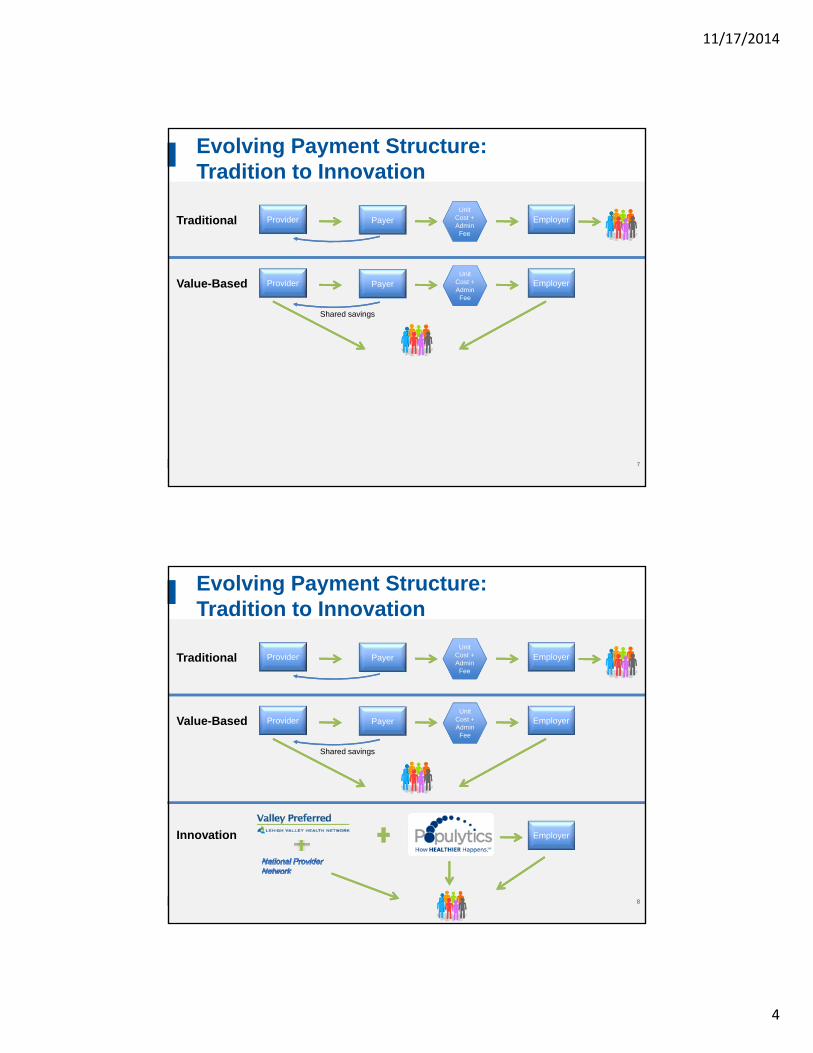
Evolving Payment Structure: Tradition to Innovation
ProviderUnit
Cost + Admin
Fee
Traditional Payer Employer
Provider
Shared savings
Value-Based Payer EmployerUnit
Cost + Admin
Fee
7
Evolving Payment Structure: Tradition to Innovation
ProviderUnit
Cost + Admin
Fee
Traditional Payer Employer
Provider
Shared savings
Value-Based Payer EmployerUnit
Cost + Admin
Fee
Innovation Employer
8

11/17/2014
5
9
Investment in Population Health Management Tools – Populytics- Predictive Modeling- Benchmarking- Risk Stratification- Medical Expense Budget Development
Care Continuum and Integrated Care Delivery- Community Care Teams- Ambulatory Care Management- Patient Centered Medical Homes- Engaging Providers (ACE)
LVHN Integrated Care Continuum
Payment Innovation
Powered byOptum
Powered byOptum
LVHN – Positioning for the Future
9
10
• Provider incentives aligned with quality measures
• Corporate wellness programs
• Care management• Patient centered
medical home• Community care
teams
• Powerful tools combine claims and clinical data
• Predictive modeling
• Medical expense budget
Infrastructure and Competencies to Manage Populations
• Health plan management
• Plan design consulting

11/17/2014
6
11
Goals of Medical Expense Budget:• Conduct detailed historic review to understand cost
drivers• Create prospective care cost targets based on
actuarial risk modeling• Identify & track clinical initiatives with opportunities
for savings & increased quality• Establish monitoring process (multi-disciplinary
team approach)
Advanced Analytics to Support Population Health Management
Set prospective trends
Pinpoint and prioritize goals
Monitor trends & targets through
dashboards
Target clinical interventions
• The Actuarial prospective risk model allows for forecasting beyond the next twelve month time period
• Uses similar principles as those used to build premium rates for health insurers
• Provides a credible base for forecasting cost
Medical Expense Budget Process
Set prospective trends
Pinpoint and prioritize goals
Monitor trends & targets through
dashboards
Target clinical interventions
12

11/17/2014
7
LVHN Established Goals for FY ‘15• Admission Management: $1.2M targeted savings• Prescription Drug Brand Usage: $1.1M targeted savings• Advanced Imaging: $240K targeted savings• Avoidable Emergency Department Visits: $210K targeted savings• Therapy Visits: $200K targeted savings• Chronic Renal Failure: $130K targeted savings
$0 $1 $2 $3
Savings
Millions
Inpatient
Rx
Imaging
ED Visits
Therapy
Renal Failure
Set prospective trends
Pinpoint and prioritize goals
Monitor trends & targets through
dashboards
Target clinical interventions
Medical Expense Budget Process
13
Set prospective trends
Pinpoint and prioritize goals
Monitor trends & targets through
dashboards
Target clinical interventions
Medical Expense Budget Process
14

11/17/2014
8
Set prospective trends
Pinpoint and prioritize goals
Monitor trends & targets through
dashboards
Target clinical interventions
• Clinical initiatives have been identified through data analysis
• Multi-disciplinary teams of clinicians, analysts & plan administrators working together
• Initiatives include– Avoidable ED
– Impactable admits
– Generic RX utilization
– High-tech radiology
• Measure results
Medical Expense Budget Process
15
•Health plan management Claims adjudication
Enrollment and eligibility management
Benefits administration
COBRA & HIPAA administration
•Plan design consultation•Access to national provider network
Plan Administration Services
16
11/17/2014
9
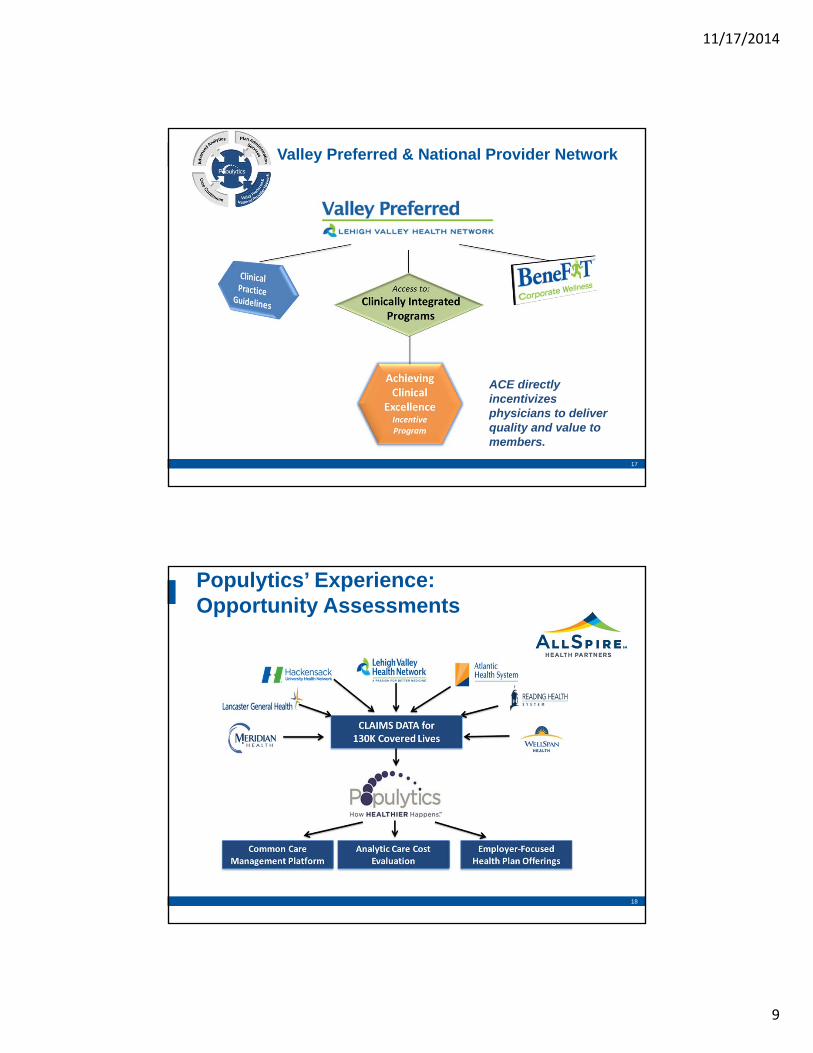
Valley Preferred & National Provider Network
ACE directly incentivizes physicians to deliver quality and value to members.
17
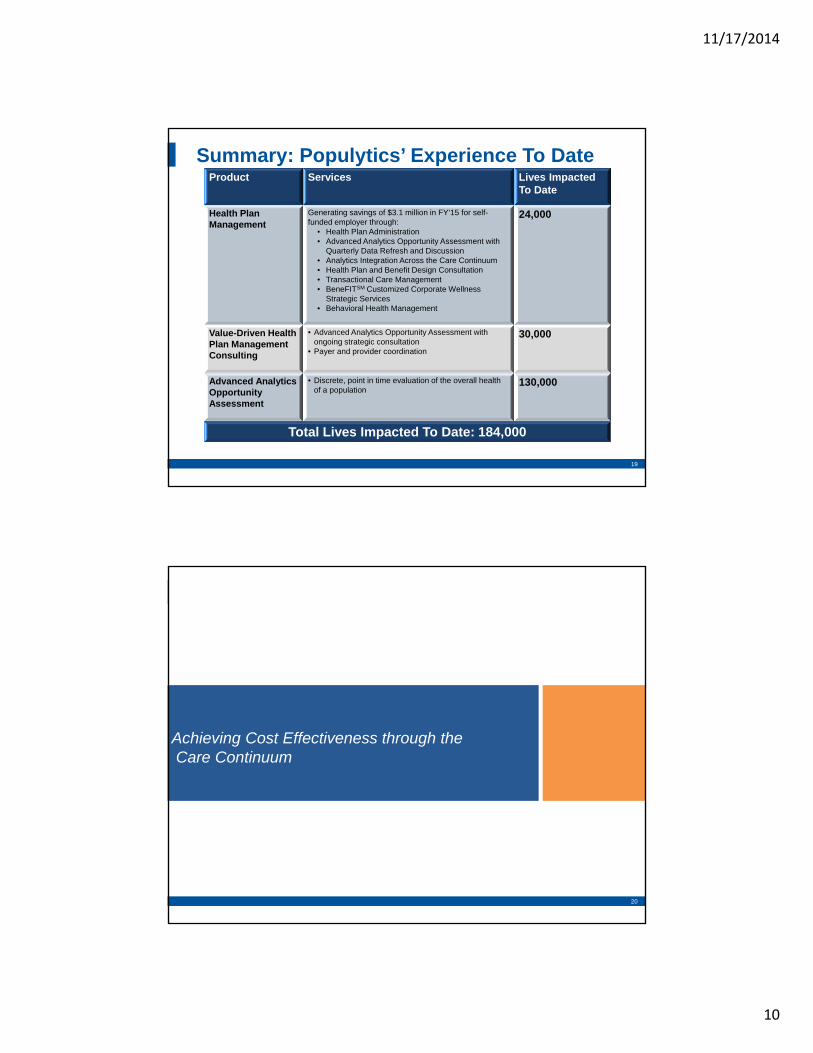
Populytics’ Experience:Opportunity Assessments
18
11/17/2014
10
Product Services Lives Impacted To Date
Health Plan Management
Generating savings of $3.1 million in FY’15 for self-funded employer through:
• Health Plan Administration• Advanced Analytics Opportunity Assessment with
Quarterly Data Refresh and Discussion• Analytics Integration Across the Care Continuum• Health Plan and Benefit Design Consultation• Transactional Care Management• BeneFITSM Customized Corporate Wellness
Strategic Services• Behavioral Health Management
24,000
Value-Driven Health Plan Management Consulting
• Advanced Analytics Opportunity Assessment with ongoing strategic consultation
• Payer and provider coordination
30,000
Advanced Analytics Opportunity Assessment
• Discrete, point in time evaluation of the overall health of a population
130,000
Total Lives Impacted To Date: 184,000
Summary: Populytics’ Experience To Date
19
20
Achieving Cost Effectiveness through theCare Continuum
20

11/17/2014
11
21
The LVHN Care Continuum
21
Information Flow to Care Continuum
22

11/17/2014
12
Analysis has revealed opportunities for savings that can directly benefit the system and improve employee health & productivity
Low High
Coverage Types $1,750,000 $3,500,000
Ambulatory Care Sensitive Conditions $285,000 $570,000
Avoidable ER & Frequent Fliers $125,300 $250,600
Chronic Care Management $800,000 $1,400,000
High Cost Claims $765,600 $1,531,200
High Future Risk Members $1,050,000 $2,100,000
Probability of Hospitalization $120,000 $180,000
Leakage $585,000 $1,170,000
Rx Generic Substitution $320,000 $ 480,000
Total $5,800,900 $11,181,800
$-
$2,000,000
$4,000,000
$6,000,000
$8,000,000
$10,000,000
$12,000,000
Opportunity Low High
Estimated Opportunity
$5.8M $11.1M
Percent of Total Spend
4.57% 8.74%
23
$127M
Total Spend
Identify Opportunities for Improvement
24
47% of Pop
Avg Age: 21
Expected PMY: $1,069
< 2% Chronic
Low Severity
5% Admits
WELL
Low utilization, healthy, mostly acute conditions
STABLE
24% of Pop
Avg Age: 35
Expected PMY: $2,771
10% Chronic
Low Severity
5% Admits
Regular utilization, healthy, mostly acute
and preventative conditions
MODERATE
18% of Pop
Avg Age: 44
Expected PMY: $5,646
35% Chronic
5% High Sev
10% Admits
Moderate utilization, mostly acute, few chronic unlikely to
require inpatient or ER services
HIGH
10% of Pop
Avg Age: 48
Expected PMY: $12,168
55% Chronic
12% High Sev
20% Admits
High utilization, higher severity acute and
chronic w/increased likelihood of inpatient or
ER services
VERY HIGH
1% of Pop
Avg Age: 50
Expected PMY: $42,561
70% Chronic
40% High Sev
70% Admits
ComorbidityHeavy utilization, higher severity, multiple chronic w/strong
likelihood of inpatient or ER services
Typical Risk Profile
24
11/17/2014
13
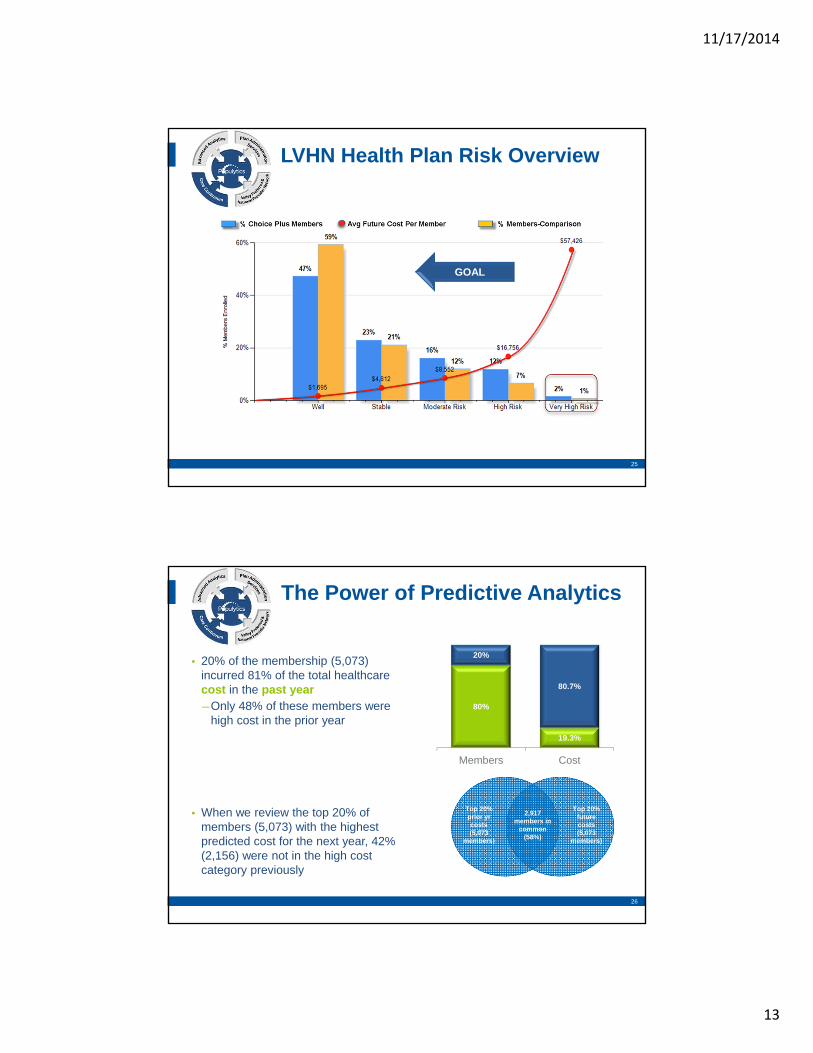
25
GOAL
LVHN Health Plan Risk Overview
25
• 20% of the membership (5,073) incurred 81% of the total healthcare cost in the past year―Only 48% of these members were
high cost in the prior year
2,917 members in
common (58%)
Top 20% prior yr costs (5,073
members)
Top 20% future costs (5,073
members)
• When we review the top 20% of members (5,073) with the highest predicted cost for the next year, 42% (2,156) were not in the high cost category previously
80%
19.3%
20%
80.7%
Members Cost
26
The Power of Predictive Analytics

11/17/2014
14
Choice Plus Care Management
Number of Hospitalizations:6 months Pre and Post Care Management
27
Diabetic Care Gap Pilot Office 1
Gaps HBA1C LDLPre-Intervention 140 7.4 113Post Intervention 37 7.2 112
0
20
40
60
80
100
120
140
160
Care Gap Pilot
28

11/17/2014
15
• PCMH Journey• Learning Collaborative
– Network owned practices– Aligned community
• Community Care Teams• Population Health
Personal Coordinated Comprehensive Accessible
Evidence-Based Pillars of Primary Care
Primary Care Strategy –Patient Centered Medical Home
29
• Target high risk and rising risk members
• Manage patients throughout the continuum: wellness through catastrophic loss
• Health care navigation
• Disease management
Integrated Care Management Model
Care Continuum
Segmenting the Population
30

11/17/2014
16
CommunityCare Team 1
Community Care Team 2
RN Care Manager
RN Care Manager
Soc. WorkerSoc. Worker
Behavioral Health
Behavioral Health
Practice
Practice
Practice
CC
CC
CC
Practice
Practice
Practice
CC
CC
CC
Clin Pharm
Practice Coach
IT Support
CC = Care Coordinator
31
NETWORK SERVICES
CORE TEAM
Community Care Teams (CCT)
31
5 + Chronic Conditions 7+ Medications 3+ Clinical Indicators
- HgA1C, Echo
Multiple Readmissions/Admissions/ED utilization
High Risk Criteria
32

11/17/2014
17
Community Care Teams: High Risk Patients
33
0
500
1000
1500
2000
2500
3000
3500
Discharge F/U (n=1634) Managed (n=895)
Pre
Post
37%14%
Community Care Team - ResultsNumber of Hospitalizations:6 Months Pre and Post CCTJune 2012 – December 2013
34
11/17/2014
18
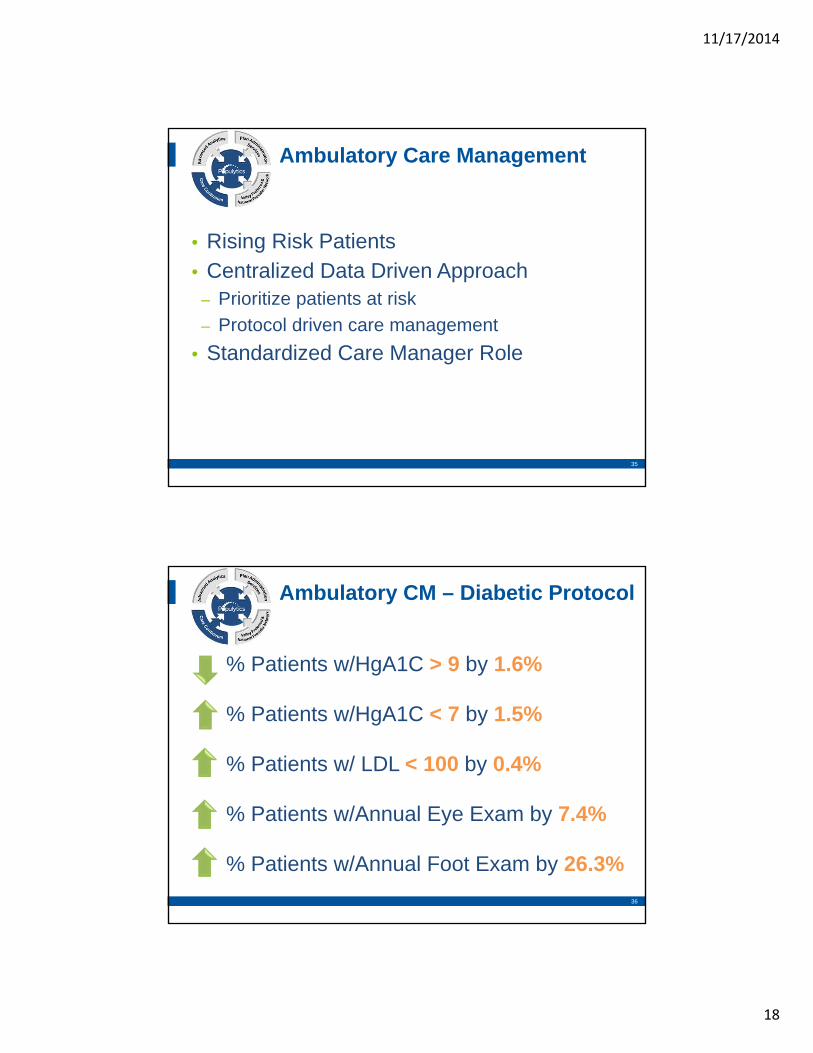
• Rising Risk Patients• Centralized Data Driven Approach
– Prioritize patients at risk
– Protocol driven care management
• Standardized Care Manager Role
Ambulatory Care Management
35
% Patients w/HgA1C > 9 by 1.6%
% Patients w/HgA1C < 7 by 1.5%
% Patients w/ LDL < 100 by 0.4%
% Patients w/Annual Eye Exam by 7.4%
% Patients w/Annual Foot Exam by 26.3%
Ambulatory CM – Diabetic Protocol
36

11/17/2014
19
• Established in 2006– Network strategic initiative to support those with
advanced complex illness– Inpatient and Home-Based service—access to
palliative care along the continuum– Home-Based = Partner with patient’s PCP
• Community Exchange
LVHN Palliative Medicine: OACISOptimizing Advanced Complex Illness Support
37
0
50
100
150
200
250
6 Months Preceding OACIS 6 Months Following OACIS
46%n=115
Number of Hospitalizations:6 Months Pre and Post OACIS Enrollment
Palliative Care: OACIS
38

11/17/2014
20
Critical Success Factors
• Value of predictive analytics
• Translation of data to inform the care model
• Engagement is key (patients, providers, payers, consumers)
39
39
“It is not the strongest of the species that survives. Nor the most intelligent that survives,It is the one most adaptable to change.”
-Charles Darwin
40
40
