lecture 9: tunable diode laser absorption (tdlas) · lecture 9: tunable diode laser absorption...
TRANSCRIPT

Lecture 9: Tunable Diode Laser Absorption (TDLAS)
1. History and vision – for aeropropulsion2. Absorption fundamentals3. Absorption sensor strategies4. Wavelength access – lasers/detectors5. Example applications – combustion6. Example applications - aerospace7. Future trends for aerospace
Direct-connect scramjet combustor at UVa flow facility

2
1. The History of TDL Absorption for Aeropropulsion:35 Years: From the Laboratory to Flight
1977 – TDL absorption in shock tube flows and flames 1989 – Mass flux sensor using O2 absorption1993 – Multiplexed measurements of H2O, T and momentum flux1998 – Combustion control (lab flames, incinerator)2001 – Multi-species in flames: CO, CO2, NH3, H2O1996-present – Applications to flow facility characterization: arcjets, hypersonic flow
tunnels, gas turbine engine sector rigs…1998-present – Applications for engine tests: scramjet combustors, commercial aircraft
engines, ic-engines, pulse detonation engines, gas turbines, augmentors…
Rieker, Proc Comb Inst (2009)
SCRAMJET @ WPAFBT/species in Shocktube
Hanson, Appl Opt (1977)
Facility @ CALSPAN

3
1. The History of TDL Absorption for Aeropropulsion:35 Years: From the Laboratory to Flight
1977 – TDL absorption in shock tube flows and flames 1989 – Mass flux sensor using O2 absorption1993 – Multiplexed measurements of H2O, T and momentum flux1998 – Combustion control (lab flames, incinerator)2001 – Multi-species in flames: CO, CO2, NH3, H2O1996-present – Applications to flow facility characterization: arcjets, hypersonic flow
tunnels, gas turbine engine sector rigs…1998-present – Applications for engine tests: scramjet combustors, commercial aircraft
engines, ic-engines, pulse detonation engines, gas turbines, augmentors…2012 – TDL absorption in scramjet flight tests
Rieker, Proc Comb Inst (2009)
SCRAMJET @ WPAFBT/species in Shocktube
Hanson, Appl Opt (1977)
HiFire-2 Scramjet Flight Test
AFRL WPAFB: scheduled 2012
8 TDL LOS at combustor exit

1. Vision for TDLAS Sensors for Aeropropulsion– Diode laser absorption sensors offer prospects for time-resolved, multi-
parameter, multi-location sensing for performance testing, model validation, feedback control
Exhaust(T, species, UHC, velocity, thrust)
Inlet and Isolator(velocity, mass flux, species,
shocktrain location)
Combustor(T, species, stability)
l1 l2 l3 l4 l5
Diode Lasers
Fiber Optics
Acquisition and Feedback to Actuators
l6
Sensors developed for T, V, H2O, CO2, O2, & other species Prototypes tested and validated at Stanford Several successful demonstrations in ground test facilities Opportunities emerging for use in flight
Now for some absorption fundamentals

2. Absorption Fundamentals: The Basics
• Scanned-wavelength line-of-sight direct absorption• Beer-Lambert relation
• Spectral absorption coefficient
LnLkII
io
t exp)exp(
PPTTSk ii ),,()(absorbance
5
Absorption of monochromatic light
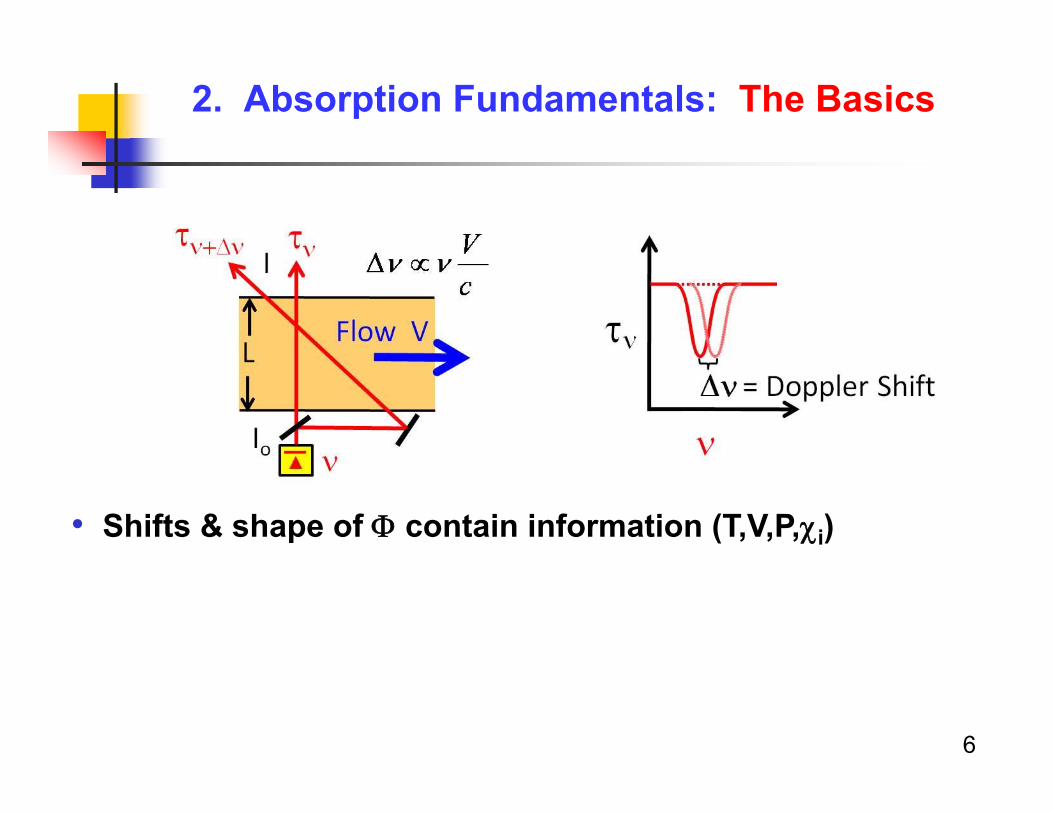
2. Absorption Fundamentals: The Basics
• Shifts & shape of contain information (T,V,P,i)
6
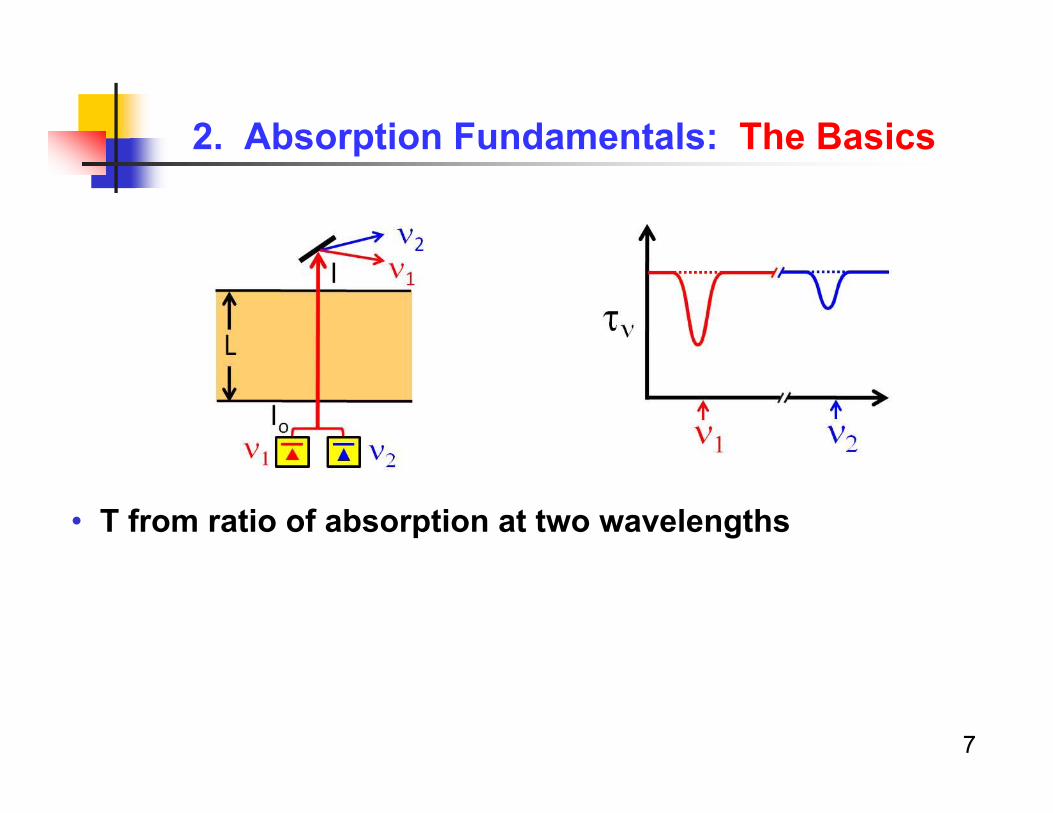
• T from ratio of absorption at two wavelengths
2. Absorption Fundamentals: The Basics
7
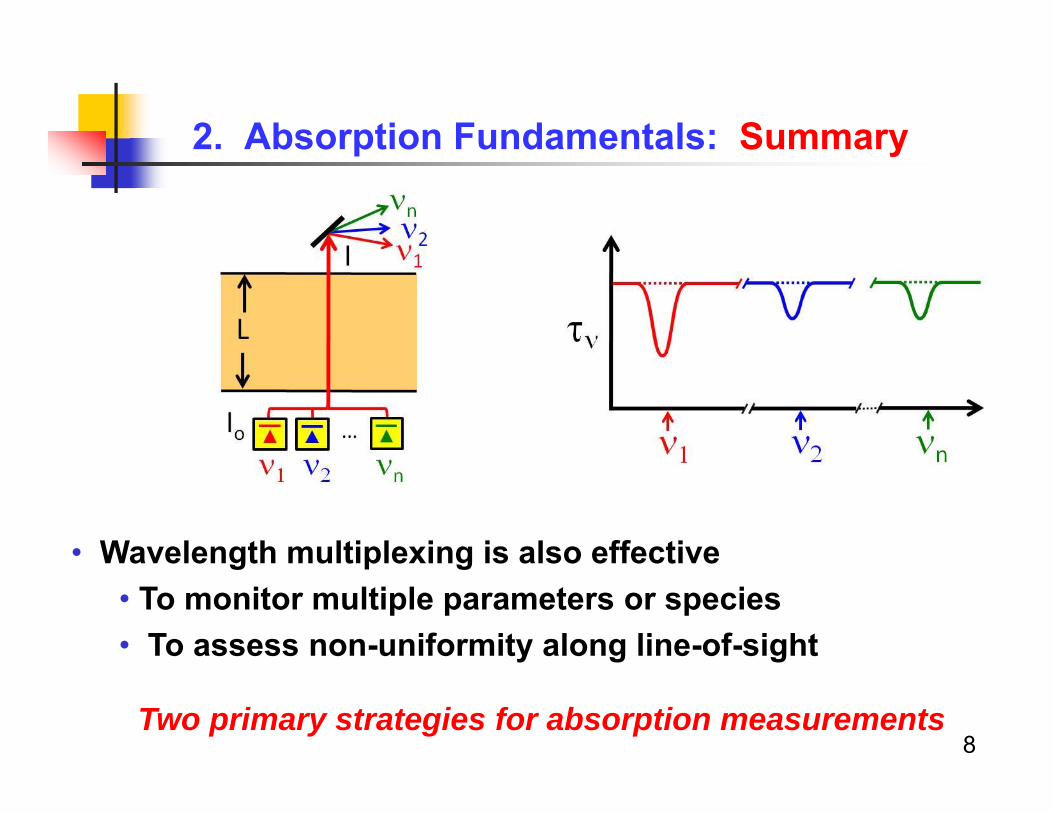
• Wavelength multiplexing is also effective• To monitor multiple parameters or species• To assess non-uniformity along line-of-sight
2. Absorption Fundamentals: Summary
8Two primary strategies for absorption measurements

3. Absorption Sensor Strategies:Direct Absorption (DA)
WMS
Direct Absorption
Gas sample
Io It
Direct absorption: Simple, if absorption is strong enough WMS: More sensitive especially for small signals (near zero baseline)
WMS with TDLs improves noise rejection Normalized WMS, e.g. 2f/1f cancels scattering losses!
Injection current tuning
+ Injection current modulation @f
i’
i 0.4 0.5 0.6 0.7
0.00
0.25
0.50
0.75
Abso
rban
ce
W avelength (re lative cm -1)
D irect absorption lineshape
0.4 0.5 0.6 0.7 0.8 0.9 1.00.0
0.1
0.2
0.3 Direct Absorption Scan
Lase
r Int
ensi
ty S
igna
l
T ime(ms)
Baselinefit
for Io
Lockin@1f, 2f
-0.02
0.00
0.02
0.04
WMS-2f lineshapeNor
mal
ized
2f s
igna
l
Wavelength (relative cm-1)0.4 0.5 0.6 0.7
0
2
4
6
8
WMS Scan
WM
S Si
gnal
Time (ms)0.4 0.5 0.6 0.7 0.8 0.9 1.0
& Wavelength Modulation Spectroscopy (WMS)
9

Demonstrate normalized WMS-2f/1f in laboratory air 2f/1f unchanged when beam attenuated (e.g., scattering losses) 2f/1f unchanged when optical alignment is spoiled by vibration
WMS-2f/1f signals free of window fouling or particulate scattering
3. Absorption Sensor Strategies:WMS-2f/1f Accounts for Non-Absorption Losses
0.00 0.05 0.10 0.15 0.20 0.25 0.30 0.350.00
0.03
0.06
0.09
0.12
2f/1
f Mag
nitu
de
Time (s)
0.0
0.2
0.4
0.6
1f M
agni
tude
0.00
0.02
0.04
0.06
2f/1f
1f Magnitude
2f M
agni
tude
2f Magnitude
0.0 0.1 0.2 0.3 0.4 0.5 0.6 0.70.00
0.03
0.06
0.09
0.12
2f/1
f Mag
nitu
de
Time (s)
0.0
0.2
0.4
0.6
1f M
agni
tude
0.00
0.02
0.04
0.06
2f/1f
1f Magnitude
2f M
agni
tude
2f Magnitude
1392 nm, Partially Blocking Beam 1392 nm, Vibrating Pitch Lens
Modulated TDL near 1392nm
Pitch LensDetector
Fixed WMS-2f/1fAmbient H2O (T=296 K, 60% RH) L=29.5 cm, ~6% absorbance)
What species/wavelengths can we access?

4. Wavelength Access: A Wide Range of Combustion Species/Applications using Wavelengths in the IR
Small species such as NO, CO, CO2, and H2O have discrete rotational transitions in the vibrational bands
Larger molecules, e.g., hydrocarbon fuels, have blended features
Different strategies used to monitor discrete lines or blended absorption features
11

Allows access to many atoms and molecules Visible and telecom TDLs can be fiber-coupled TDLs at wavelengths > telecom are emerging rapidly
4. Wavelength Access:Laser Access Visible to Mid-IR
O,
Now lets consider hardware: lasers and detectors
(QC Lasers)(DFG and IC Lasers)

Sources – Semiconductor lasers Available from the near UV (375 nm) to the far-IR (~ 11 μm)
Power: ~ 1 to 500 mW Low power restricts their application to absorption experiments
Near-IR lasers are compact, rugged, and fiber-coupled DFB lasers can be rapidly tuned over several wavenumbers by changing the
injection current or laser temperature External cavity diode lasers can be tuned more than 100 cm-1
13
4. Wavelength Access - Lasers
Diode lasers, near- to extended-near-IR($1000 - $6000)
Fiber-coupled up to 2.3μmQC lasers, mid-IR (~$40,000 )

Detectors – Photodiode/Photovoltaic detectors A photodiode is a semiconductor that generates voltage or current
when light is incident on it
Like photoconductors, they have a minimum photon energy associated with the bandgap energy of the semiconductor
Source of noise: Johnson noise (not shot-noise limited)
A variation is avalanche photodiode, signal (volts) = constant x intensity
14
Detector material λ [μm]
Si 0.2 – 1.1
Ge 0.4 – 1.8
InAs 1.0 – 3.8
InSb 1.0 – 7.0
InSb (77K) 1.0 – 5.6
HgCdTe (77K) 1.0 – 25.0
4. Wavelength Access - Detectors

Detectors – Select a detector Criteria: wavelength, time response, noise, simplicity, cost …
Frequency bandwidth is important for time-resolved measurements Bandwidth depends on the detector area, material, temperature, and pre-
amplifier gain15
Wavelength Bandwidth
4. Wavelength Access - Detectors
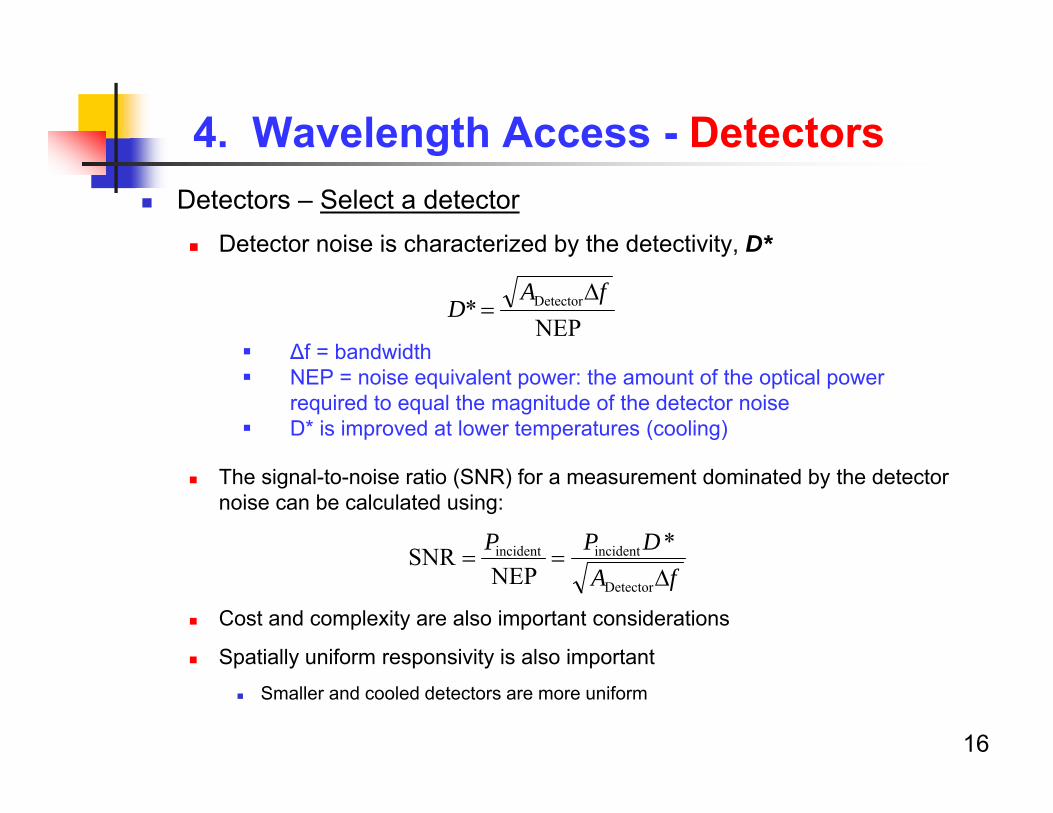
Detectors – Select a detector Detector noise is characterized by the detectivity, D*
The signal-to-noise ratio (SNR) for a measurement dominated by the detector noise can be calculated using:
Cost and complexity are also important considerations
Spatially uniform responsivity is also important Smaller and cooled detectors are more uniform
16
Δf = bandwidth NEP = noise equivalent power: the amount of the optical power
required to equal the magnitude of the detector noise D* is improved at lower temperatures (cooling)
NEP* Detector fA
D
fADPP
Detector
incidentincident *NEP
SNR
4. Wavelength Access - Detectors

5. Example TDL Applications – Combustion
1. Extended NIR provides stronger CO2 absorption2. Exploit strong CO2 absorption near 2.7m for precision T3. Exploit 1f-normalized WMS-2f for T with aerosol present
17

Access to CO2 enabled by new DFB lasers for >2.5 m
The band strength near 2.7 m is orders of magnitude stronger than NIR
5.1 CO2, T Sensor Using Extended-NIR Extended NIR Enables Large Increase in Sensitivity
Many candidate transitions for optimum line pair (depending on T)
Next: Line selection in 22+3 band

5.1 Extended-NIR Sensor for CO2, T
A near optimum line pair R(28) and P(70) selected Strong, isolated from H2O, wide separation in E”
Validate in shock tube to demonstrate achievable precision
m
Strategy: Sense T by ratio of absorption by two CO2 transitions
1%CO2, L=10cmLi
nest
reng
th

5.2 Shock-Tube Validation of Extended NIR CO2, T SensorPrecision Time-Resolved T from WMS-2f/1f of CO2
Validate fast, sensitive strategy for CO2, T using a shock tube
Shock wave Test mixture
InSb Detector
DFB laser
Ratio of WMS-2f signals sensitive to temperatureNext: Measured accuracy and precision
Ratio of WMS-2f/1f signals for R(28) and P(70) CO2 transitions
900 1000 1100 1200 1300 1400 1500 1600
1.5
2.0
2.5
3.0
3.5
4.0 P = 1.0 atm P = 2.0 atm
2f s
igna
l rat
io
Temperature [K]
1~2743nm2~2752nm

5.2 Shock-Tube Validation of Extended NIR CO2, T SensorTemperature vs Time in Shock-Heated Ar/CO2 Mixtures
Temperature data agree with T5 determined from ideal shock relations Temperature precision of 3 K demonstrated! Unique capability for real-time monitoring of T in reactive flows
Next: High potential for multi-phase flows, e.g., droplet evaporation
0 3 6 9 12-30
-20
-10
0
10
20
30
5 K
Diff
eren
ce o
f Mea
sure
d T
& T 5 [K
]
Time [ms]
0 K
Reflected shock arrival
0 3 6 9 120
300
600
900
1200
0.0
0.6
1.2
1.8
2.4
Time [ms]Pr
essu
re [a
tm]
Tem
pera
ture
[K]
Reflected shock arrival
Incident shock arrival
1.2 atm, 2%CO2 in Ar
T5 from shock speed
Accuracy Precision

5.3 1f-Normalized WMS-2f for CO2 with ScatteringValidate in Aerosol-Laden Gases
Aerosol shock tube experiment: 2% CO2 /Ar in n-dodecane aerosol L=10 cm, P2=0.5 atm; P5=1.5 atm
2f/1f TDL sensor successfully measures T in presence of aerosol!Next example: Detection of gasoline in IC-engines
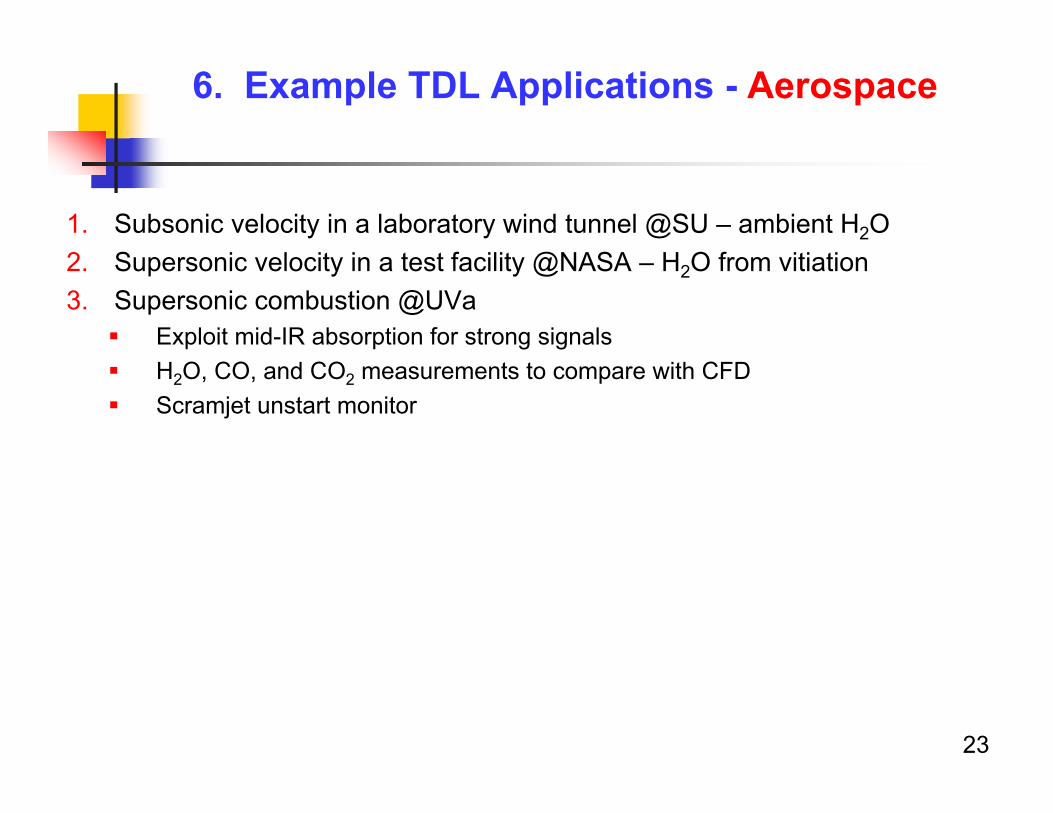
6. Example TDL Applications - Aerospace
1. Subsonic velocity in a laboratory wind tunnel @SU – ambient H2O2. Supersonic velocity in a test facility @NASA – H2O from vitiation3. Supersonic combustion @UVa Exploit mid-IR absorption for strong signals H2O, CO, and CO2 measurements to compare with CFD Scramjet unstart monitor
23

2424
6.1 Subsonic Velocity @ SU: TDLAS Sensors in Wind Tunnel
TDL sensor of mass flux based on H2O absorption
Velocity from Doppler shift of absorption wavelength
Validate sensor in subsonic wind tunnel w/ ambient H2O @ Stanford
0.5 m/s precision for V in uniform subsonic flowNext: Test in supersonic-flow facilities at NASA Langley
2
Beam 1 Beam 2Inlet flow
1 2
24

252525
6.2 Supersonic Velocity@NASA Langley via TDLAS: Direct-Connect Supersonic Combustion Test Facility
DCSCTF: Simulates atmospheric supersonic and hypersonic flight conditions
M=2.65 nozzle with Tstatic~ 990K and Pstatic~ 0.7 atm; simulates M=5 flight Add optical access to isolator Measure V, T, mass flux
Diverging nozzleCombustor
Fuel injection
Isolator
Nozzle
Vitiated inlet air
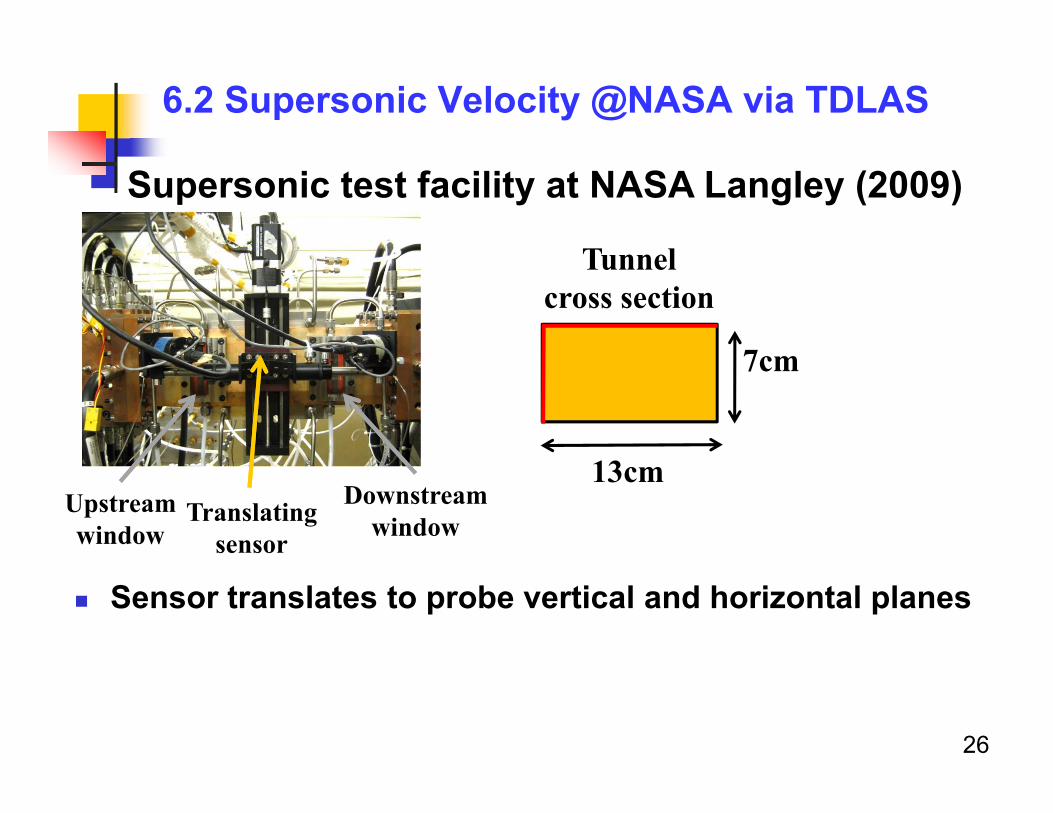
6.2 Supersonic Velocity @NASA via TDLAS
Sensor translates to probe vertical and horizontal planes
Supersonic test facility at NASA Langley (2009)
Downstream window
Upstream window
Translating sensor
7cm
13cm
Tunnel cross section
26

6.2 Supersonic Velocity @NASA via TDLAS
Sensor translates to probe vertical and horizontal planes
Downstream window
Upstream window
Translating sensor
27Chang et al., AIAA, 2011
Vertical Scan
Supersonic test facility at NASA Langley (2009)

6.2 Supersonic Velocity @NASA via TDLAS
Sensor translates to probe vertical and horizontal planes Fast sensor captures start-up transients in V and T
Supersonic test facility at NASA Langley (2009)
Downstream window
Upstream window
Translating sensor
28Chang et al., AIAA, 2011
Next: A supersonic combusting flow @ UVa

29
UVa Supersonic Combustion FacilityCharlottesville, VA
6.3 Mid-IR absorption sensing in scramjet flows
Mach 5 flight conditionMach 2 in combustor
C2H4/Air, ≈ 0.15
Goal: Spatially-resolved CO, CO2 and H2O in supersonic combustion

30
Optical Setup: Translating LOS
Translating LOS
Fuel Injection
Recirculation Cavity
Reaction Zone
TwoMeasurement
Planes
Air Flow
Y
X
Four lasers Two for H2O and T
One for CO and one for CO2
SIDE VIEWSupersonic flow path
First use of fiber-coupled Mid-IR for aero-applications
6.3 Mid-IR absorption sensing in scramjet flows

31
Time-resolved CO and T Measurements
TDL sensor captures flow fluctuations
UVa CombustorC2H4 + Air: ϕ ≈ 0.15
Two-line CO T measurement @ 6 kHz
6.3 Mid-IR absorption sensing in scramjet flows
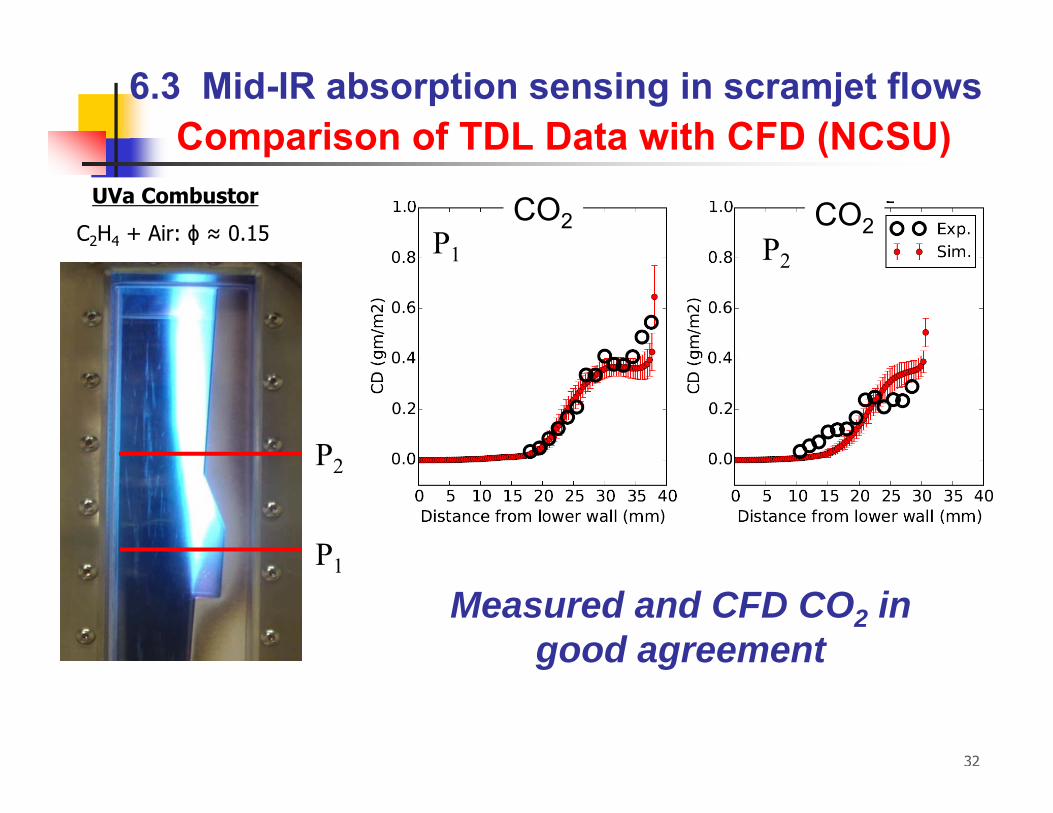
32
Comparison of TDL Data with CFD (NCSU)
P1
UVa CombustorC2H4 + Air: ϕ ≈ 0.15
P2
P1 P2
CO2 CO2
Measured and CFD CO2 in good agreement
6.3 Mid-IR absorption sensing in scramjet flows

33
Comparison of TDL Data with CFD (NCSU)
P1
P2
UVa CombustorC2H4 + Air: ϕ ≈ 0.15 CO CO
P1 P2
CFD overpredicts CO in cavity
6.3 Mid-IR absorption sensing in scramjet flows

6.4 Scramjet Unstart MonitorExample: Fluctuations in T Uniformity via TDLAS
Simultaneous measurements on 4 H2O lines Two lines for Tlow and two lines for Thigh
2007
34

6.4 Scramjet Unstart Monitor Sensor Monitors Time-Resolved Tlow vs Thigh
Tlow ≠ Thigh indicates temperature is not uniform Low-frequency fluctuations anticipate inlet unstart Fluctuation sensing : A new paradigm for control!
Rieker et al., Proc Comb Inst, 2008
Running FFT of Tlow & Thigh
Ratio low-frequencies
35

7. Future trends for TDLAS Sensing
36
Portable TDL-based aerospace sensors useful for T, V, species and mass flux over wide range of conditions, facilities
Robust TDL-based sensors for long term monitoring of energy systems
Current and future topics: Characterization/maintenance/control of facilities/emissions Emerging applications in flight systems Extension to UV and mid-IR to access new species, stronger transitions
CO, CO2, HC’s, radicals, NO, NO2
Research in advanced energy and propulsion concepts

Next Lecture
37
TDLAS Applications to Energy Conversion1. Fuel in IC engines – fuel and T2. H2O and T in slagging coal gasifier3. H2O in NCCC coal gasifier4. NO and CO in coal-fired boiler exhaust