lecture 7. sludge management -...
TRANSCRIPT

Lecture 7. Sludge Management
The Islamic University of Gaza- Environmental
Engineering Department
Wastewater Management- EENV 6306
Husam Al-Najar

Qinf P.S A.T S.S Qeff
sludge sludge
Qthick
Qthick
Qdew
1 St Thickener
Sludge
Sludge
digester
Sludge
Dewatering
2nd Thickener

Quantity Source Sludge Type
It is all the solids collected in the grit
removal chamber, because grit can be
easily drained and is relatively stable
in terms of biological activity, it dose
not need treatment and is generally
disposed directly to landfills.
Grit sludge
The quantity of primary sludge is
calculated using the following
equation:
Where: Mp kg/d
ss= suspended solids in the
influent, kg/m3
E = efficiency of primary
sedimentation tank
Qin = influent flow to primary
sedimentation tank, m3/d.
Primary sludge is the sludge taken
from the bottom of the primary settling
tanks. It contains from 3-8% solids
.This sludge is composed of settleable
raw solids. Almost 7% of the primary
sludge is organic.
Primary or raw
sludge
Px = XV ÷ Øc kg/d
Qwaste = Px ÷ Xr m3/d
This sludge consists of
microorganisms and inert materials
that has been wasted from the
secondary treatment processes. Thus
9% of this sludge is organic this
sludge contains from 0.8 to 2% solids .
Secondary Sludge

sludge treatment:-
The main goal of sludge treatment is to convert it to an inert solid
product that can be safely disposed in the environment or reused for
useful purposes.
The main sludge treatment steps are-
a. Sludge thickening.
b. Sludge stabilization.
c. Sludge dewatering.
In the following section, a detailed discussion of these treatment steps is
given.

Sludge thickening:-
The main goal of sludge thickening is to reduce the sludge volume by
removing as much as possible of the water content of sludge, leading to the
increase of the solids content of sludge. Thickening is achieved by the
following three methods:-
a) Gravity thickening:-
Gravity thickening is achieved in circular tanks similar to sedimentation
tanks. Sludge is allowed to settle and compact. The thickened sludge is
withdrawn from the bottom of the thickener. To improve thickening some
chemicals are added, this process is called sludge conditioning. Sludge
conditioning is discussed below.

b) Flotation thickeners:-
For sludges with low weights, gravity thickeners are not efficient. In
this case, the sludge floats on the surface and than removed by scum
removal arms.
c) Mechanical thickening:-
Mechanical thickeners include centrifuges, rotary drams and filter belts.
The centrifuges and rotary drums use the centrifugal force to separate
solids from liquids.
Filter belts are squeezing machines in which the sludge is inserted
between two moving belts resulting in the separation of solids from
liquids.

Sludge conditioning:-
Sludge conditioning is a pretreatment step to increase the efficiency of
sludge thickening and dewatering of sludge. The two most common
methods of sludge conditioning are:-
a) Chemical conditioning:-
Addition of lime Ca (OH)2.
Addition of ferric chloride Fe cl3
Addition of alum AL2 (SO4)3.
Addition of organic polymers.
These chemicals are coagulants as they neutralize and destabilize the
electrically charged particles in the water and allow them to settle
efficiently.

Organic polymers replace Fe cl3 and AL2 (SO4)3 salts in order to
overcome the major problems involved with these inorganic
chemicals.
Advantages of organic polymers over inorganic chemicals are:-
Dosage is around 10 times lower than that of inorganic
chemicals (typical dosage is 5-10 kg/ tonsludge)
Cost saving obtained in capital cost and running cost.
Treated sludge dose not contain inorganic chemical such as
Fe3+
and AL3+
.

b) Heat treatment:-
Heat treatment is a conditioning process that involves heating of sludge
for short periods of time under pressure. By heat treatment, the structure
of sludge flocks is altered to liberate more water from particles. The high
capital cost of equipment limit the use of this method to small treatment
plants only.

sludge stabilization:-
Sludge stabilization is the process in which the biodegradable organic
matter is converted to non-biodegradable (or inert) matter.
The main purpose of this process is to produce a sludge that will not
undergo any further decomposition when disposed to the environment (i.e
stable sludge).
If sludge is disposed without stabilization it will create bad odor and health
hazards.
The most common method used for sludge stabilization is the anaerobic
digestion.
This process is achieved in a closed anaerobic tank called digester.
The digester shown is a cylindrical tank with a conical shaped bottom. It is
an anaerobic completely mixed reactor.

The cover of the digester is a floating cover to give flexibility for gas
accumulation and to prevent explosion.
The sludge in the digester is heated to 35oC to give the best digestion
efficiency.
The digested organic matter is converted into gases such as methane (CH4),
carbondioxide (CO2) and (H2O).
The produced methane is collected and used for energy production

*CO2 + 4 H2 CH4 + 2 H2O
*CH3COOH CH4 + CO2
Sludge transformed to H2
and CH3COOH by
fermentation

Sludge de-watering:-
Dewatering is a physical process used to reduce to water content of sludge
after stabilization. Several methods are used for dewatering as follows:-
A) Natural dewatering:-
Natural dewatering depends on evaporation and percolation. Sludge
drying beds are the most common example of natural dewatering.
Evaporation
Sludge
Fine sand
Gravel
Perforated pipe
Sludge drying beds

B) Mechanical dewatering:-
Mechanical dewatering methods are divided to three main categories:-
a) Vacuum filtration:-
Water is removed under applied vacuum through a porous media that
retains solids and allow water to pass.
• Cylindrical drum covered by mesh
or fabric - rotates into partially
submerged vat containing
conditioned sludge
• Apply vacuum to pull out water
• Achieves 15-30 % solid content
Vacuum Filtration
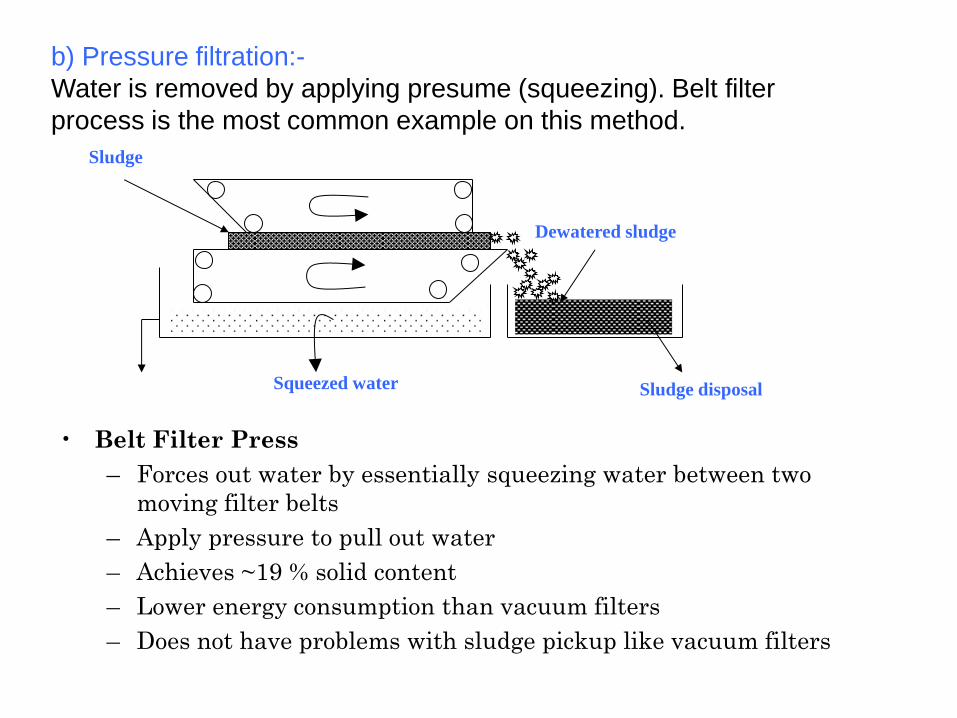
b) Pressure filtration:-
Water is removed by applying presume (squeezing). Belt filter
process is the most common example on this method.
Dewatered sludge
Sludge disposal Squeezed water
Sludge
• Belt Filter Press
– Forces out water by essentially squeezing water between two
moving filter belts
– Apply pressure to pull out water
– Achieves ~19 % solid content
– Lower energy consumption than vacuum filters
– Does not have problems with sludge pickup like vacuum filters

Volume Reduction
• Incineration
– Complete evaporation of water from sludge
– Requires fuel
– Solid material is inert
– Exhaust air must be treated prior to discharge

Sewage Sludge Land Application
Experiment

Nutrient elements N, P, K, Ca …..etc
Micronutrients Fe, Zn, Mn, ……….etc
Heavy metals (toxic elements) Cd, Pb, Tl, Hg
Mineral elements and ecology

Sludge and soil from the bottom of effluent pool
Sludge Soil
Elements
(mg/l) Settled Limits* Under layer soil Limits *
Cd <0.01 39 <0.01 2.0
Co <0.01 - <0.01 -
Hg <0.001 17 <0.001 1.0
Pb 0.15 300 <0.01 150
Zn <0.01 2800 <0.01 130
Cr 0.2 1200 0.4 -
Ni <0.01 420 <0.01 35-50
Potential toxic elements concentration in soil and sludge from
the bottom of the lake from Beitlahia and the EPA limitations
in the sludge and soil.
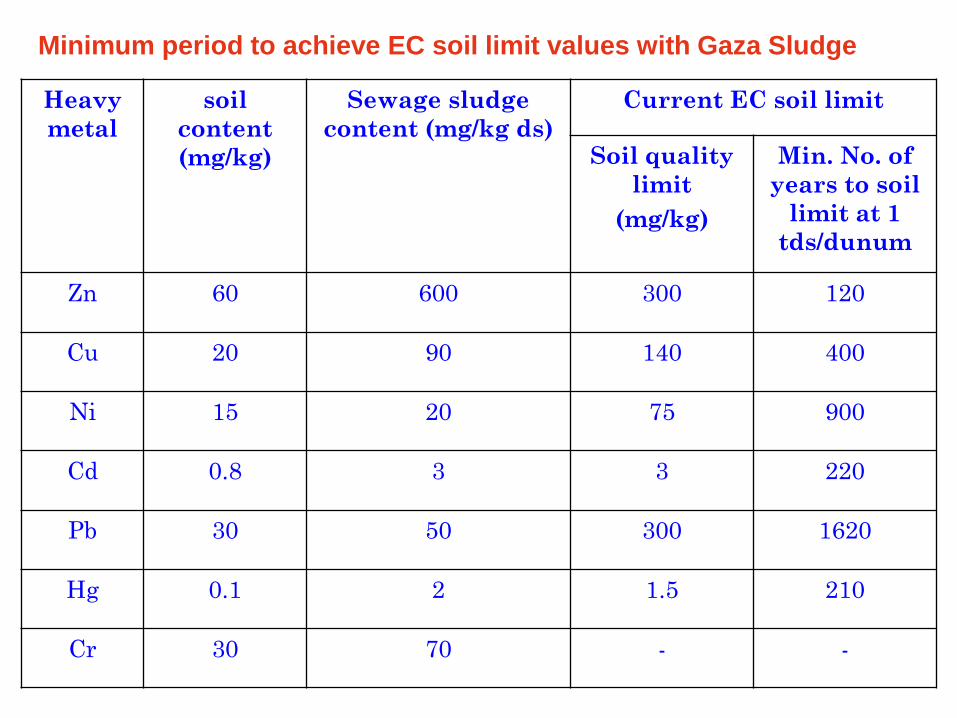
Heavy
metal
soil
content
(mg/kg)
Sewage sludge
content (mg/kg ds)
Current EC soil limit
Soil quality
limit
(mg/kg)
Min. No. of
years to soil
limit at 1
tds/dunum
Zn 60 600 300 120
Cu 20 90 140 400
Ni 15 20 75 900
Cd 0.8 3 3 220
Pb 30 50 300 1620
Hg 0.1 2 1.5 210
Cr 30 70 - -
Minimum period to achieve EC soil limit values with Gaza Sludge

Without Sludge
With Sludge
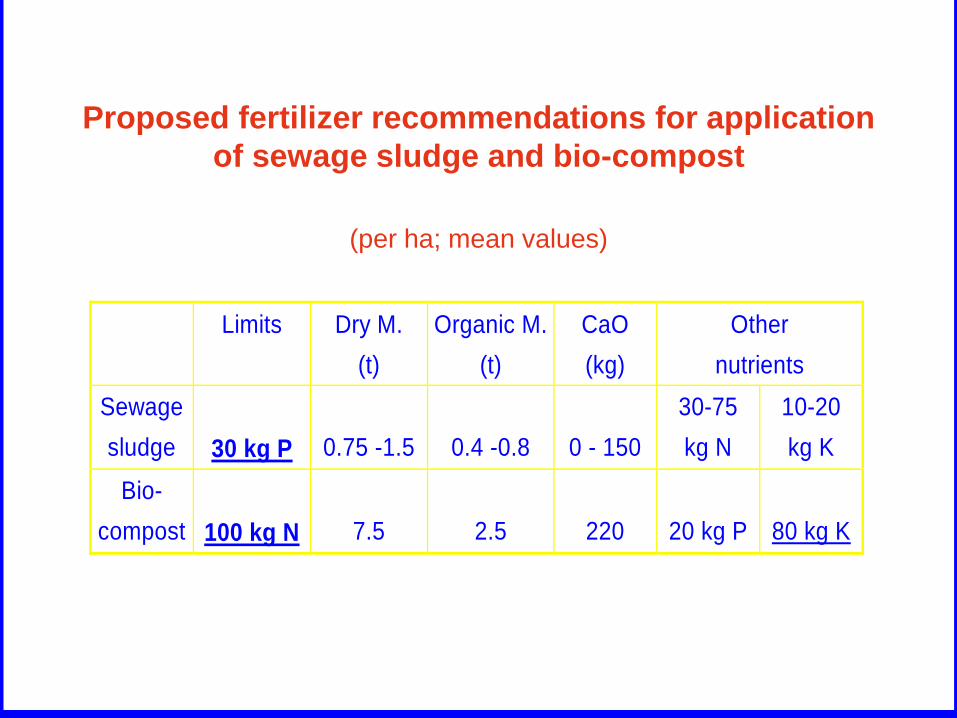
Proposed fertilizer recommendations for application
of sewage sludge and bio-compost
(per ha; mean values)
Limits Dry M.
(t)
Organic M.
(t)
CaO
(kg)
Other
nutrients
Sewage
sludge
30 kg P
0.75 -1.5
0.4 -0.8
0 - 150
30-75
kg N
10-20
kg K
Bio-
compost
100 kg N
7.5
2.5
220
20 kg P
80 kg K

long term application of sewage sludge to a Loess derived
Luvisol in South-West Germany as the following:
I) control without sludge or mineral fertilizer
II) mineral fertilizer application without sludge
application
III) 5 ton DM sludge ha-1 a-1
IV) 5 ton sludge aerobic stabilised
V) 15 ton DM sludge ha-1 a-1
VI) 30 ton DM sludge ha-1 a-1
Each treatment has 4 replicates
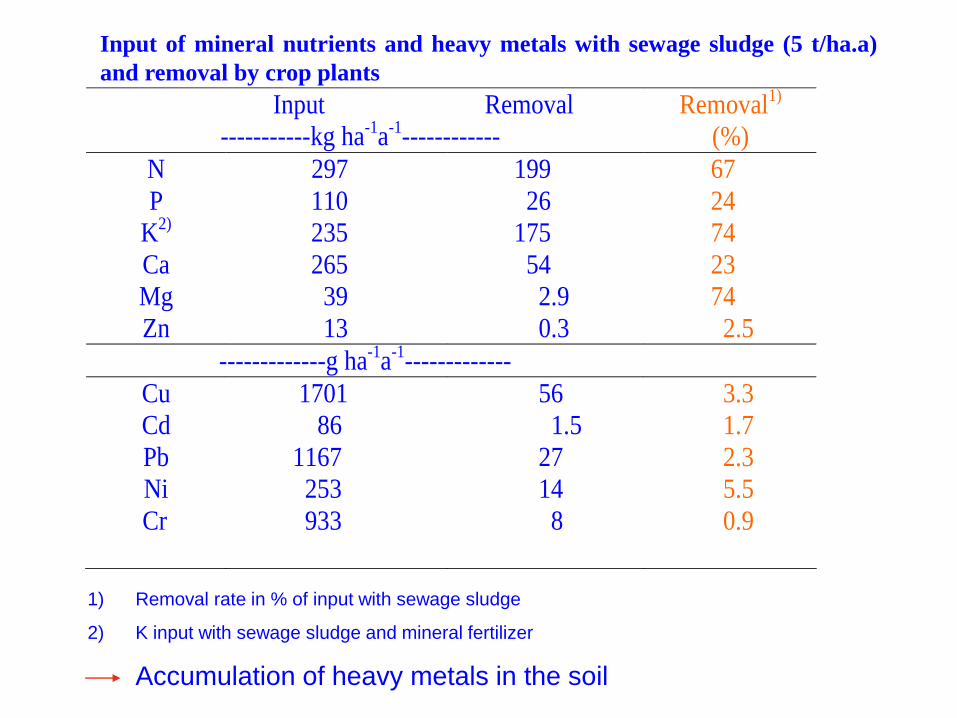
Input of mineral nutrients and heavy metals with sewage sludge (5 t/ha.a)
and removal by crop plants
Input Removal
-----------kg ha-1a-1------------
Removal1)
(%)
N
P
K2)
Ca
Mg
Zn
297
110
235
265
39
13
199
26
175
54
2.9
0.3
67
24
74
23
74
2.5
-------------g ha-1a-1-------------
Cu
Cd
Pb
Ni
Cr
1701
86
1167
253
933
56
1.5
27
14
8
3.3
1.7
2.3
5.5
0.9
1) Removal rate in % of input with sewage sludge
2) K input with sewage sludge and mineral fertilizer
Accumulation of heavy metals in the soil

Heavy metals accumulation in the soil
Mobile (µg kg-1 soil) (NH4NO3) extraction and total (mg kg-1 soil) of heavy metal content in 0 -
30 cm soil layer of sewage sludge field experiment 1995
Treatment
Cd
Zn
Cu
Ni
total
mobile
total
mobile
total
mobile
total
Control
0.16
±0.04
< 1.0
82 ±2.04
< 30
21 ±2.04
23 ±2.4
24 ±1.22
NPK
0.25
±0.04
1.8 ±0.1
95 ±4.08
39 ±0
23 ±1.22
28 ±4.7
23 ±0.82
5 t KS ha-1 a-1
0.35
±0.04
1.3 ±0.4
123 ±2.04
50 ±12
29 ±2.45
26 ±9.4
25 ±2.04
5 t KS ha-1 a-1
anerobic stab.
0.38
±0.10
2.3 ±0.7
122 ±1.63
101
±16
29 ±1.63
33 ±4.7
24 ±0.41
15 t KS ha-1 a-1
0.71
±0.07
4.2 ±1.0
182 ±6.94
282
±15
41 ±0.41
46 ±1.9
26 ±1.22
30 t KS ha-1 a-1
1.36
±0.11
6.0 ±0.1
270 ±0.41
418
±34
59 ±2.86
71 ±4.2
26 ±0.82

After 10 years termination of sewage sludge application
Intensive agriculture with the following crop rotation:
• Summer wheat
• Potato
• Maize

Yield of internsive Agriculture
Yield of summer wheat, potato and maize. Data represent means ± SD of 4 replications
Treatment
Summer wheat yield
Potato
Maize
Grain
(t DM ha-1)
straw
(t DM ha-1)
(t DM ha-1)
(shoot+grains)
(t DM ha-1)
Control
5.61.0
4.91.0
5.90.5
14.31.6
NPK
7.40.4
6.60.6
6.81.1
17.41.3
5 ton
6.50.3
5.70.3
6.70.9
17.70.6
5 ton aerob.
6.01.2
5.61.2
6.70.5
18.11.8
15 ton
6.00.7
5.30.4
7.10.5
17.21.1
30 ton
6.00.6
5.60.6
8.00.6
17.91.1
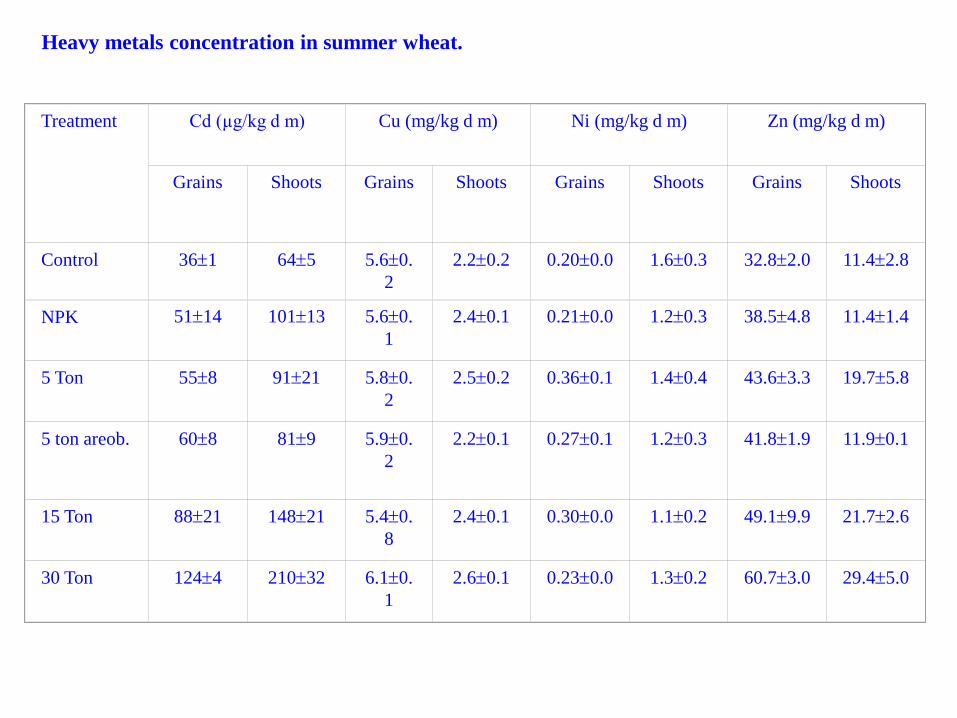
Heavy metals concentration in summer wheat.
Treatment
Cd (µg/kg d m)
Cu (mg/kg d m)
Ni (mg/kg d m)
Zn (mg/kg d m)
Grains
Shoots
Grains
Shoots
Grains
Shoots
Grains
Shoots
Control
361
645
5.60.
2
2.20.2
0.200.0
1.60.3
32.82.0
11.42.8
NPK
5114
10113
5.60.
1
2.40.1
0.210.0
1.20.3
38.54.8
11.41.4
5 Ton
558
9121
5.80.
2
2.50.2
0.360.1
1.40.4
43.63.3
19.75.8
5 ton areob. 608 819 5.90.
2
2.20.1 0.270.1 1.20.3 41.81.9 11.90.1
15 Ton
8821
14821
5.40.
8
2.40.1
0.300.0
1.10.2
49.19.9
21.72.6
30 Ton
1244
21032
6.10.
1
2.60.1
0.230.0
1.30.2
60.73.0
29.45.0

Heavy metals concentration in Maize grains and shoots .
Treatment
Cd (µg/kg d m)
Cu (mg/kg d m)
Ni (mg/kg d m)
Zn (mg/kg d m)
Grains
Shoots
Grains
Shoots
Grains
Shoots
Grains
Shoots
Control
13.32.5
59.94.6
2.30.2
5.30.2
0.60.1
1.00.1
23.93.2
18.62.0
NPK
11.92.2
11224
2.20.0
5.80.0
0.50.0
0.80.1
21.22.9
22.13.4
5 Ton
16.23.2
12625
2.80.2
5.70.4
0.60.1
0.70.1
29.16.2
24.02.5
5 ton areob.
11.62.7
11413
2.50.4
5.90.8
0.50.1
0.90.1
24.82.3
24.11.0
15 Ton
13.74.1
17623
2.71.0
5.40.4
0.60.1
0.70.1
26.42.5
28.13.1
30 Ton
19.03.9
26527
3.00.9
5.80.5
0.60.2
0.70.1
31.55.1
40.31.8

Leaching of heavy metals into the ground water
(preferential flow)
Installation of „monitor boxes“ filled with exchangeable
resin


Cd accumulation in the top (0-30 cm) and subsoil (30-60 cm) after 18
years application of sewage sludge at different annual rates
0
0,2
0,4
0,6
0,8
1
1,2
1,4
1,6
1,8
0 NPK 5t 15t 30t 5t
0-30cm
30-60cm
----------Sewage sludge-------
-----
Similar results for Zn accumulation in the top soil
mg Cd /kg soil
Limit
(legislation)

7.26.56.05.55.0
Yield
Tl conc.
Tl cont.
0.4 1.0 1.1 1.1 1.2
23.3 18.6 16.4 14.7 8.9
9.3 18.6 17.5 15.6 10.2
Yield, Tl concentration and content of 3 kale plant cultivated in 80 g L1
soil at different pH values and harvested after 30 days growth periods
Soil
pH
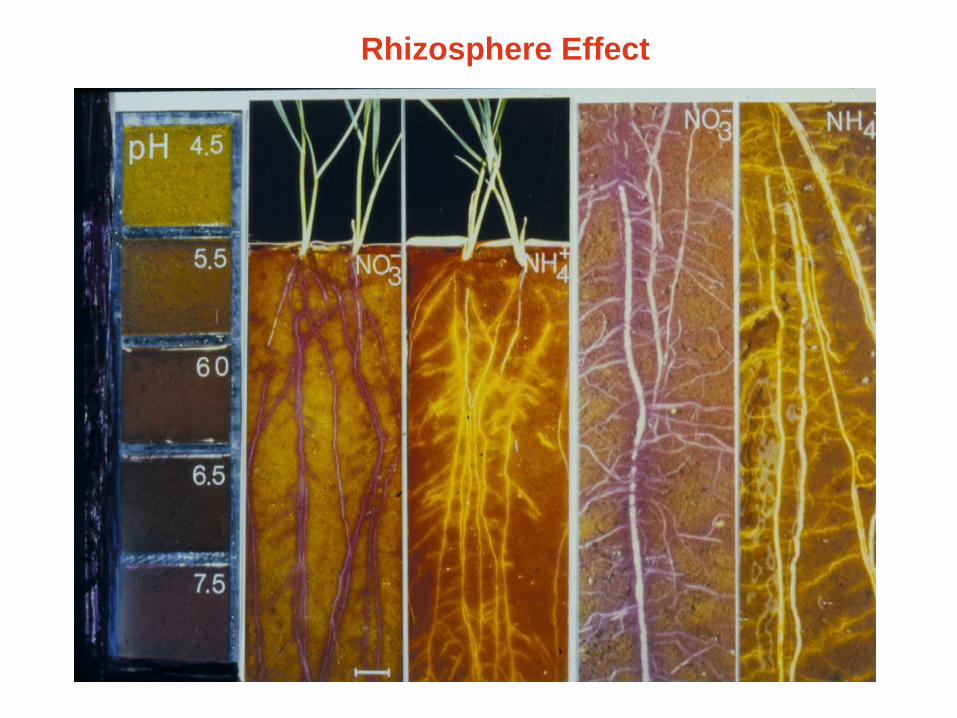
Rhizosphere Effect

Effect of rhizosphere pH on Cd uptake in rye grass
(Qi Tang Wu et al., Cr. Acad.Sci.309, 215-220, 1989)
Cd concentration in shoot
(mg kg-1 DM)
N-Form
Rhizosphere
pH
1.
Cutting
2.
Cutting
3.
Cutting
NO3-
6.8
6.5
5.5
4.2
NH4NO3
6.3
9.2
8.2
7.6
NH4+
5.5
12.4
12.8
12.2

Protection of environment and food chain
Legislative measures
eg. Regulation for application of sewage sludge and
municipal wastes compost to agricultural land
Limits for maximum concentrations of individual heavy
metals in
• Sewage sludge, bio-compost
• Soils for application (depending on soil pH)
Avoidance of a relevant contamination of soils and
food chain

Recent legislation for the use of sewage
sludge in Germany relative to heavy metals
input (for example: Cd total content)
Restrictions:
Application of sewage sludge is forbidden on:
- Soils (> 5% clay content; pH >6): > 1.5 mg Cd kg-1 soil
- Sandy soil (< 5% clay content) with pH 5-6: > 1.0 mg Cd kg-1
soil
- Acid soils (pH < 5)
The agricultural use is forbidden:
- of sewage sludge with a Cd content > 10 mg kg-1 soil or
- on sandy soil (< 5% clay content with pH 5-6) sewage
sludge with a Cd content > 5 mg kg-1 D.M.