learner outcome measures for work based learning and adult ... · july 2019: revised 03 april 2020...
TRANSCRIPT
Statistician: Thomas Lines ~ 0300 025 9895 ~ [email protected]
Enquiries from the press: 0300 025 8099 Public enquiries : 0300 025 5050 Twitter: @StatisticsWales
Learner outcome measures for work based learning and adult learning, August 2018 to
July 2019: Revised
03 April 2020
SFR 08/2020(R)
Previous versions of this release had information on learner outcomes in
Further Education. This has been discontinued as the statistics have been
replaced by the consistent performance measures for post-16 learning.
Chart 1: Success rate of apprenticeship programmes, 2018/19
The figures on outcomes for Work Based Learning (WBL) show that:
the success rate of apprenticeship programmes has fallen by 2.6
percentage points between the academic years of 2013/14 and
2018/19, from 83.6% to 80.9%
the decrease has slowed in recent years – the difference between the
rates in 2015/16 and 2018/19 is 0.5 percentage points
Chart 2: Success rate of adult learning courses, 2018/19
This year’s figures for Adult Learning (AL) show:
the success rate of AL courses has remained similar over the last few
years
the rate decreased slightly in 2018/19 (0.8 percentage points) to 89.5%
over the longer-term, the rate has risen 3.9 percentage points
since 2013/14
50%
60%
70%
80%
90%
100%
2013/14 2014/15 2015/16 2016/17 2017/18 2018/19
50%
60%
70%
80%
90%
100%
2013/14 2014/15 2015/16 2016/17 2017/18 2018/19
About this release
115 completed adult
learning activities
provided directly by
Wrexham were omitted
from the first version of
this report. Revisions
have been marked with
an (r).
This release presents
information on the
success and completion
of apprenticeships,
traineeships and adult
learning courses.
The statistics are broken
down by qualification
type, demographics and
area.
All figures come from the
Lifelong Learning Wales
Record (LLWR).
In this release
Work Based Learning 2
Adult Learning 9
Tables 13
Notes 17
2
Work Based Learning
This data covers two different types of Work Based Learning (WBL) programmes available in Wales –
apprenticeships and traineeships.
Apprenticeships have three tiers:
Foundation Apprenticeships – Level 2 (equivalent to GCSE levels graded A*-C)
Apprenticeships – Level 3 (equivalent to A levels)
Higher Apprenticeships – Level 4 and above
Traineeships have two tiers:
Engagement – Entry Level
Level 1 – Level 1 (equivalent to GCSE levels graded D-G)
Outcomes of apprenticeships
Learners on apprenticeship programmes have to achieve a range of qualifications in order to attain their
apprenticeship. The success rate is the percentage of leavers from apprenticeships who attained the full
apprenticeship framework.
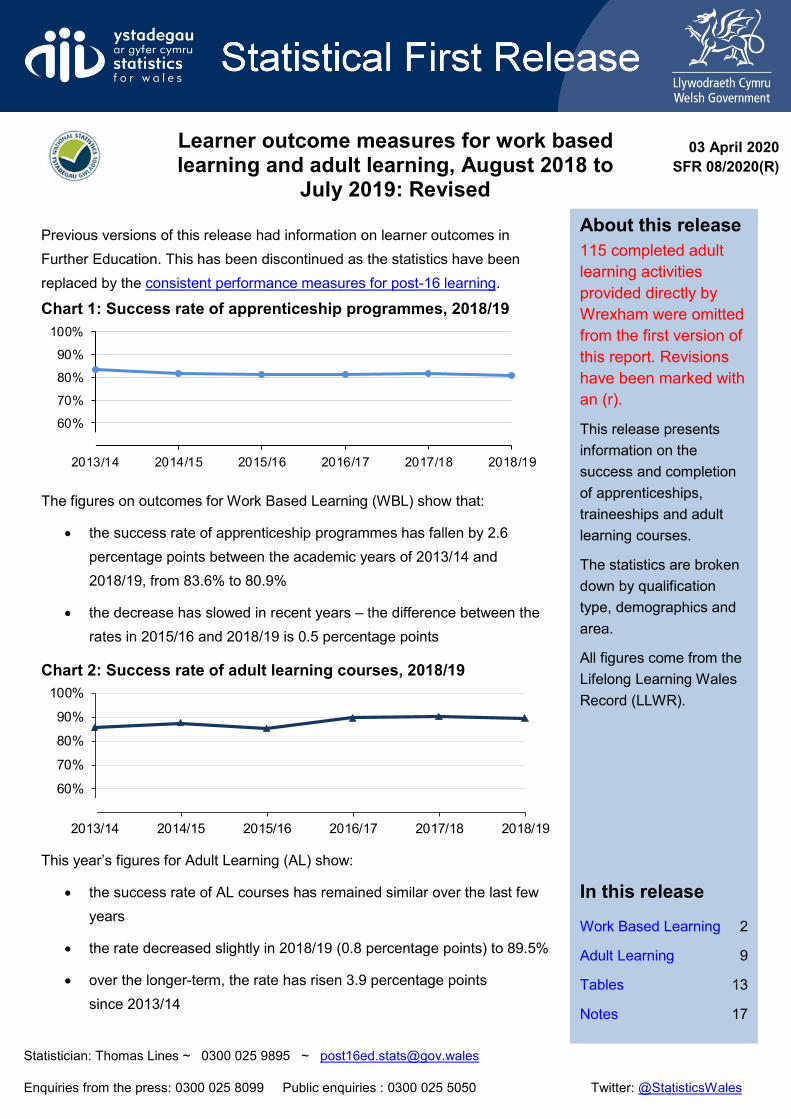
Chart 3: Apprenticeship success rate by level, 2013/14 to 2018/19
Success of apprenticeships by level and year on StatsWales
Overall success rates for apprenticeships have been falling since 2013/14, from 83.6% to 80.9%.
The trend was reflected in foundation apprenticeships and apprenticeships, which, in the same period,
fell by 3.1 and 3.2 percentage points respectively.
Higher apprenticeships have seen a strong upward trend in success rates, which have increased by 11.8
percentage points between 2013/14 and 2018/19. However, this year they have fallen for the first time
since 2015/16, by 1.2 percentage points.
Foundation Apprenticeships
Apprenticeships
Higher Apprenticeships
40%
50%
60%
70%
80%
90%
100%
2013/14 2014/15 2015/16 2016/17 2017/18 2018/19
3
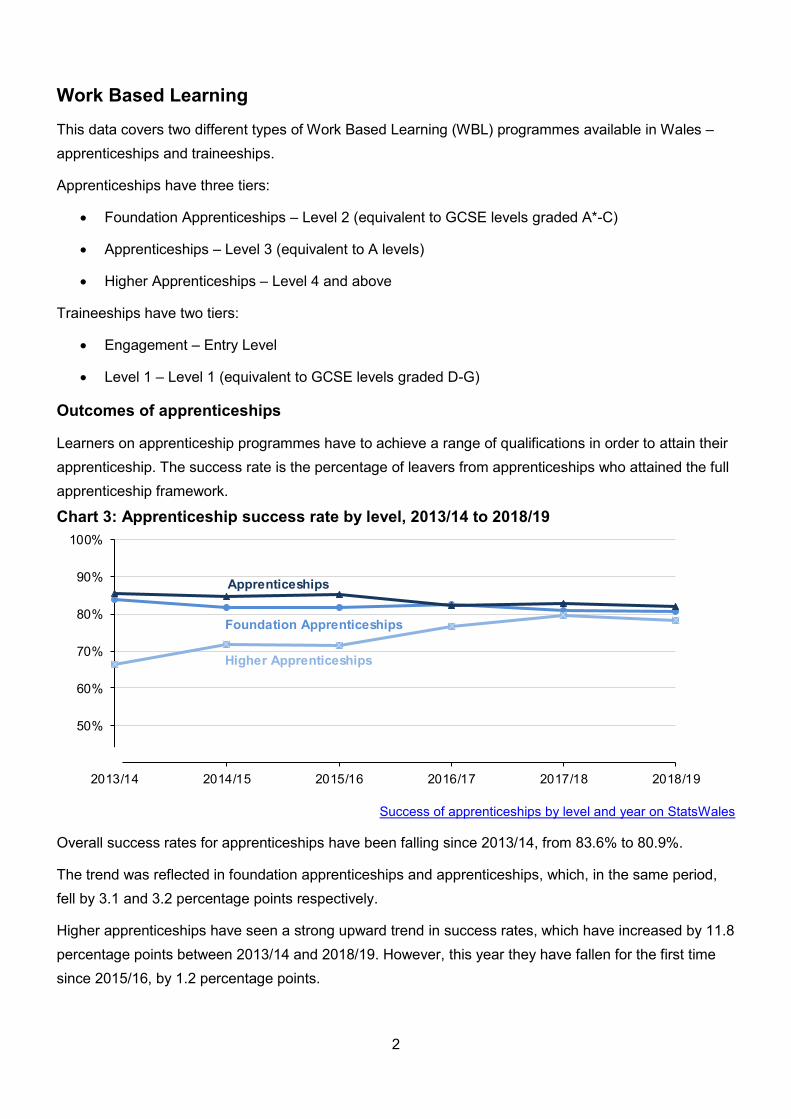
Chart 4: Numbers of learners attaining apprenticeships, 2013/14 to 2018/19
Success of apprenticeships by level and year on StatsWales
The overall number of learners attaining apprenticeships has increased from 17,700 to 20,000 since
2013/14, despite a large drop in 2015/16.
The number of learners attaining apprenticeships has been increasing, despite the falling success rate,
because more learners have been starting apprenticeships.
The number of learners attaining foundation apprenticeships in 2018/19 was 1,550 lower than the
2013/14 figure. However, the equivalent number for apprenticeships and higher apprenticeships
increased by 1,450 and 2,400 respectively over the same period.
In 2017/18 more learners passed apprenticeships than foundation apprenticeships for the first time and
that continued to be the case in 2018/19, although the gap closed from 800 to 150.
Foundation Apprenticeships
Apprenticeships
Higher Apprenticeships
All Apprenticeships
0
5,000
10,000
15,000
20,000
25,000
2013/14 2014/15 2015/16 2016/17 2017/18 2018/19
Num
ber
of
learn
ers
4
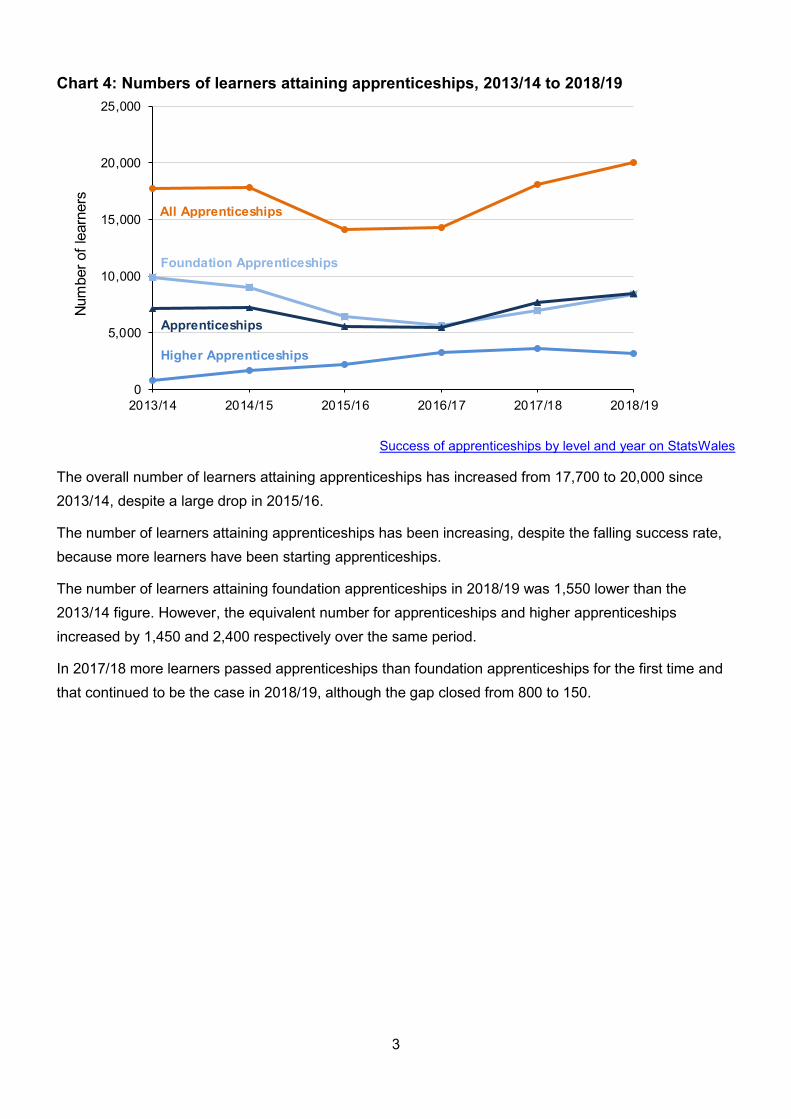
Chart 5: Apprenticeship success rate by age, 2018/19
Success of apprenticeships by age and year on StatsWales
16 and 17 year olds were among the least successful learners in apprenticeship programmes, with
success rates of 78% and 79%, respectively.
The most successful learners in apprenticeship programmes were 18 year olds, who had a success rate
of 83%.
Success rates decreased with age after 18, with 50-64 year olds having a success rate of 78%.
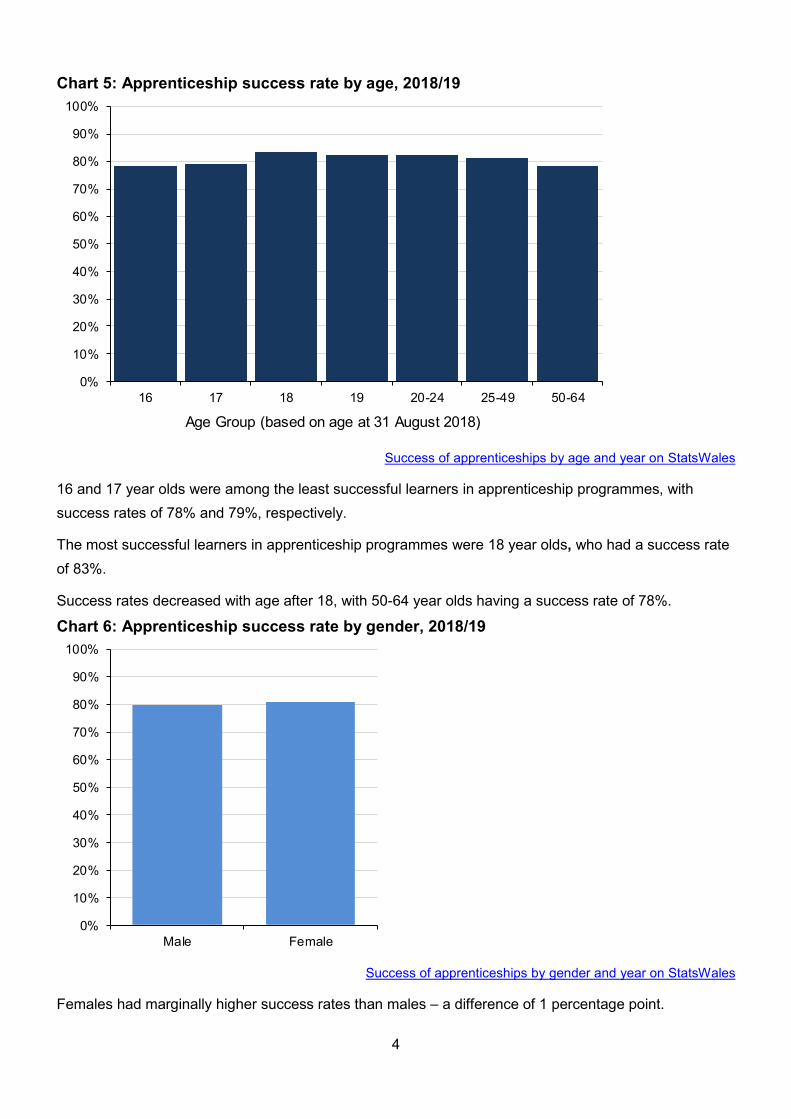
Chart 6: Apprenticeship success rate by gender, 2018/19
Success of apprenticeships by gender and year on StatsWales
Females had marginally higher success rates than males – a difference of 1 percentage point.
0%
10%
20%
30%
40%
50%
60%
70%
80%
90%
100%
16 17 18 19 20-24 25-49 50-64
Age Group (based on age at 31 August 2018)
0%
10%
20%
30%
40%
50%
60%
70%
80%
90%
100%
Male Female

5
Chart 7: Apprenticeship success rate by deprivation of home neighbourhood (a), 2018/19
(a) Based on main deprivation ranks from Welsh Index of Multiple Deprivation 2019.
Table 4
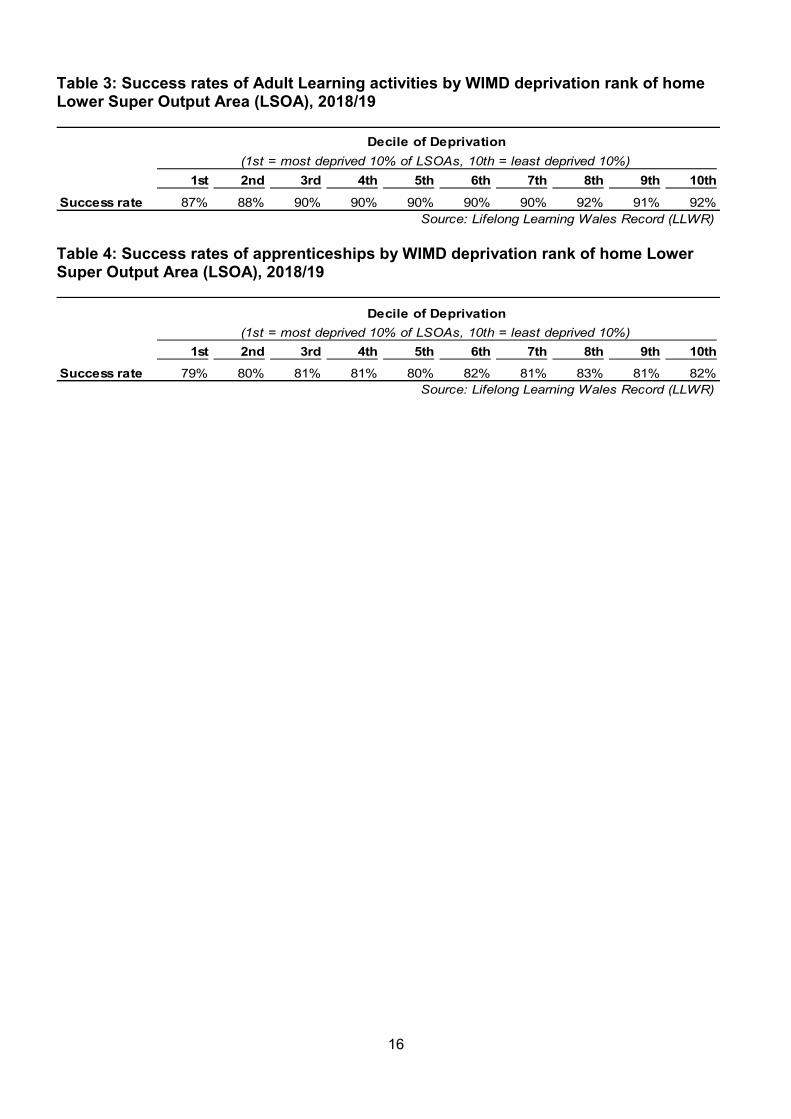
Learners from the most deprived areas were 2.8 percentage points less likely to be successful in
apprenticeships than those from the least deprived areas.
Learners from the most deprived areas had a 79.1% success rate, while the success rate for those in the
least deprived areas was 81.9%.
0%
10%
20%
30%
40%
50%
60%
70%
80%
90%
100%
1st 2nd 3rd 4th 5th 6th 7th 8th 9th 10th
Decile of Deprivation(1st = most deprived 10% of small areas - 10th = least deprived 10% of small areas)

6
Outcomes of traineeships
Traineeships are learning programmes for 16 to 18 year olds with the aim of giving them the skills they
need to progress into an apprenticeship, further education or employment. For the purposes of
measuring the outcomes of traineeships we look at the destinations of learners on these programmes –
what they are doing four weeks after the end of their programme.
There are two levels of traineeships covered in this release:
Engagement traineeships
Level 1 traineeships
Engagement traineeships are designed for young people who are not sure what they want to do as a
career. They provide support for going into employment or further education.
Level 1 traineeships are for young people who know what career they want to do and are able to start
learning at Level 1. People on Level 1 traineeships receive more work-focused support.
Overall 75% of traineeship leavers made some kind of positive progression this year. This included
leavers going into employment (including part-time and voluntary work) or a higher level of learning. This
was up 1% on last year’s figure.
Chart 8: Destinations of learners four weeks after the end of their traineeships, 2018/19
Table 1
Most engagement leavers (52%) were in learning at a higher level four weeks after finishing their
traineeships. Careers Wales can refer young people to engagement traineeships who want to do further
learning but need the support offered by engagement traineeships first.
About half of Level 1 leavers went into employment, of which 85% went into full-time employment.
More engagement leavers were unemployed four weeks after the end of their programme than level 1
leavers, 21% compared to 16%.
Learning at a higher
level
19%
Employed50%
Unemployed16%
Other orUnknown
15%
Level 1
Learning at a higher level
52%
Employed15%
Unemployed21%
Other orUnknown
12%
Engagement

7
Chart 9: Trend in destinations from engagement traineeships, 2015/16 to 2018/19
Table 1
There has been a steady reduction in the proportion of learners on engagement traineeships who were
unemployed 4 weeks after the end of the programme. 25% of learners were unemployed in 2015/16,
compared with 21% in 2018/19.
Two trends explain this. The proportion of learners entering full-time employment after their programme
ended rose from 10% in 2015/16 to 12% in 2018/19. At the same time, the proportion of learners
transferring to another programme before completing their traineeship rose from 3% to 6%.
The proportion of learners going into learning at a higher level has remained similar, with a decrease
from 53% to 52% since 2015/16.
Chart 10: Trend in destinations from Level 1 traineeships, 2015/16 to 2018/19
Table 1
Level 1 traineeships show positive trends as more learners went into full time employment. 43% went
into full-time employment in 2018/19, compared to 36% in 2015/16.
The proportion of learners who were unemployed 4 weeks after the end of their programme fell by 11
percentage points over the same period. The remainder of this drop seems to be mostly explained by an
increase in learners transferring to other programmes (3% to 8%).
Transferred learning programme
Full-time Employment
Learning at a higher level
Unemployed
0%
10%
20%
30%
40%
50%
60%
2015/16 2016/17 2017/18 2018/19
Transferred learning programme
Full-time Employment
Learning at a higher level
Unemployed
0%
10%
20%
30%
40%
50%
60%
2015/16 2016/17 2017/18 2018/19

8
The proportion of learners going into learning at a higher level has remained similar, with an increase
from 18% to 19% since 2015/16.
9
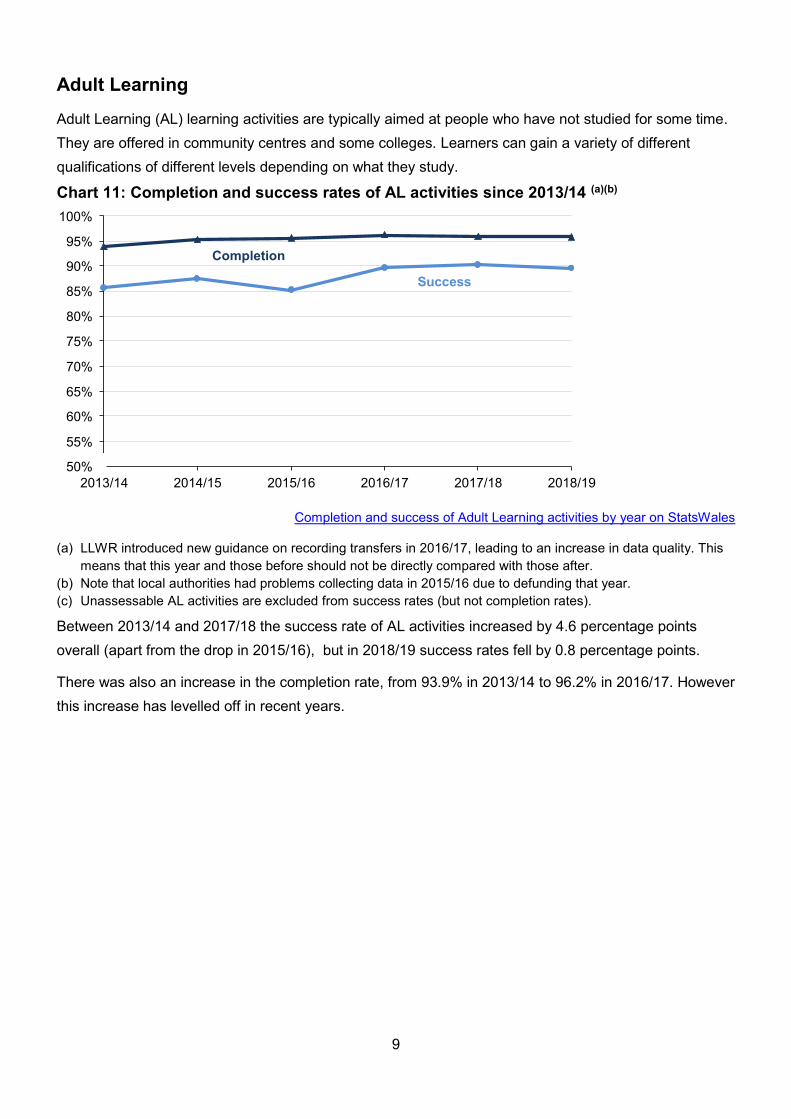
Adult Learning
Adult Learning (AL) learning activities are typically aimed at people who have not studied for some time.
They are offered in community centres and some colleges. Learners can gain a variety of different
qualifications of different levels depending on what they study.
Chart 11: Completion and success rates of AL activities since 2013/14 (a)(b)
Completion and success of Adult Learning activities by year on StatsWales
(a) LLWR introduced new guidance on recording transfers in 2016/17, leading to an increase in data quality. This
means that this year and those before should not be directly compared with those after.
(b) Note that local authorities had problems collecting data in 2015/16 due to defunding that year.
(c) Unassessable AL activities are excluded from success rates (but not completion rates).
Between 2013/14 and 2017/18 the success rate of AL activities increased by 4.6 percentage points
overall (apart from the drop in 2015/16), but in 2018/19 success rates fell by 0.8 percentage points.
There was also an increase in the completion rate, from 93.9% in 2013/14 to 96.2% in 2016/17. However
this increase has levelled off in recent years.
Completion
Success
50%
55%
60%
65%
70%
75%
80%
85%
90%
95%
100%
2013/14 2014/15 2015/16 2016/17 2017/18 2018/19

10
Chart 12: Numbers of ended, completed and attained activities (a)(b), 2013/14 to 2018/19
0
10,000
20,000
30,000
40,000
50,000
60,000
70,000
80,000
90,000
100,000
2013/14 2014/15 2015/16 2016/17 2017/18 2018/19
Nu
mbe
r of
Activitie
s
Ended
Completed
Attained
(a) These numbers do not include non-assessable activities.
(b) There are a small number of exclusions from ended activities, outlined in the Notes section.
Completion and success of Adult Learning activities by year on StatsWales
The number of assessable AL activities undertaken decreased from 85,350 to 38,100 (r) between
2013/14 and 2018/19. However, the numbers of attained and completed activities decreased more
slowly, resulting in increasing success and completion rates.
The long-term decreasing trend in AL is probably caused by a number of issues. Providers have been
encouraged to focus on basic skills learning for adults. Public funding for adult learning has been
reduced, and more leisure and recreational are delivered at full cost.
Chart 13: Success rate of AL activities by age, 2018/19
0%
10%
20%
30%
40%
50%
60%
70%
80%
90%
100%
16 17 18 19 20-24 25-49 50-64 65+
Age Group (based on age at 31 August 2018)
(r)
(r) Revised 03 April 2020 Success of Adult Learning activities by age and year on StatsWales
Chart 13 shows that older people tended to perform better in AL activities. Age groups above 24 had the
highest success rate, at 90%, while 16 year olds had the lowest success rate, at 80%.
Age groups under 19 had moderately lower success rates than older age groups – the gap between 16
year olds and 19 years olds is 9 percentage points.

11
Chart 14: Success rates of AL activities by gender, 2018/19
0%
10%
20%
30%
40%
50%
60%
70%
80%
90%
100%
Male Female
Success of Adult Learning activities by gender and year on StatsWales
Chart 14 shows that males performed marginally better than females – a 1 percentage point difference.
Chart 15: Success rates of AL activities by deprivation of home neighbourhood (a), 2018/19
0%
10%
20%
30%
40%
50%
60%
70%
80%
90%
100%
1st 2nd 3rd 4th 5th 6th 7th 8th 9th 10th
Decile of Deprivation(1st = most deprived 10% of small areas - 10th = least deprived 10% of small areas)
a) Based on main deprivation ranks from the Welsh Index of Multiple Deprivation 2019.
Table 3
There is a noticeable correlation between level of deprivation and success in AL courses. Learners in the
least deprived 10% of areas had a success rate 5 percentage points higher than learners in the most
deprived 10% of areas.

12
Chart 16: Success rate of AL activities by local authority of learner’s home address, 2018/19
North and Mid Wales
South East and South West Wales
0% 10% 20% 30% 40% 50% 60% 70% 80% 90% 100%
Isle of Anglesey
Vale of Glamorgan
Powys
Gwynedd
Denbighshire
Carmarthenshire
Ceredigion
Pembrokeshire
Flintshire
Cardiff
Wrexham
Conwy
Bridgend
Rhondda Cynon Taf
Blaenau Gwent
Neath Port Talbot
Torfaen
Caerphilly
Swansea
Merthyr Tydfil
Monmouthshire
Newport
Success of Adult Learning activities by region of domicile and year on StatsWales
There was a considerable gap in success rates between local authorities. The most successful area, Isle
of Anglesey, had a 97% success rate. The least successful, Newport, had an 83% success rate.
Success rates in local authorities in North and Mid Wales were higher than those in South Wales. Those
in North and Mid Wales had an overall success rate of 92% while those in South Wales had a rate of
89%.
13
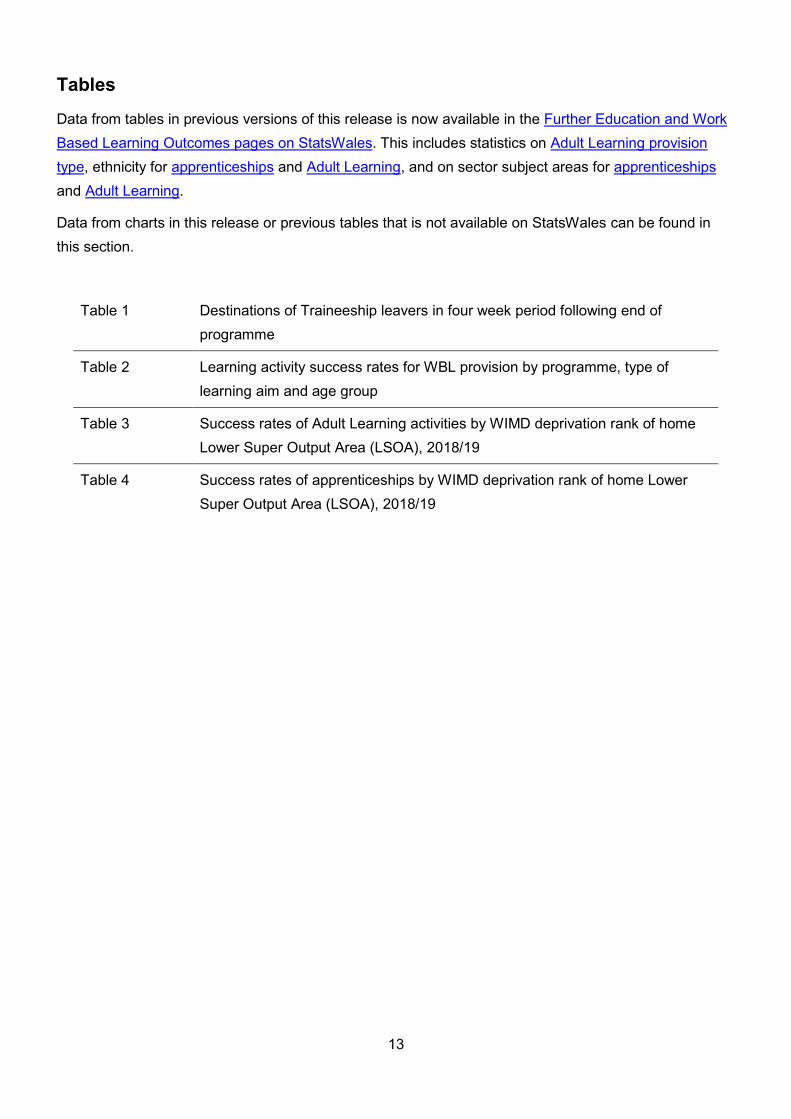
Tables
Data from tables in previous versions of this release is now available in the Further Education and Work
Based Learning Outcomes pages on StatsWales. This includes statistics on Adult Learning provision
type, ethnicity for apprenticeships and Adult Learning, and on sector subject areas for apprenticeships
and Adult Learning.
Data from charts in this release or previous tables that is not available on StatsWales can be found in
this section.
Table 1 Destinations of Traineeship leavers in four week period following end of
programme
Table 2 Learning activity success rates for WBL provision by programme, type of
learning aim and age group
Table 3 Success rates of Adult Learning activities by WIMD deprivation rank of home
Lower Super Output Area (LSOA), 2018/19
Table 4 Success rates of apprenticeships by WIMD deprivation rank of home Lower
Super Output Area (LSOA), 2018/19
14
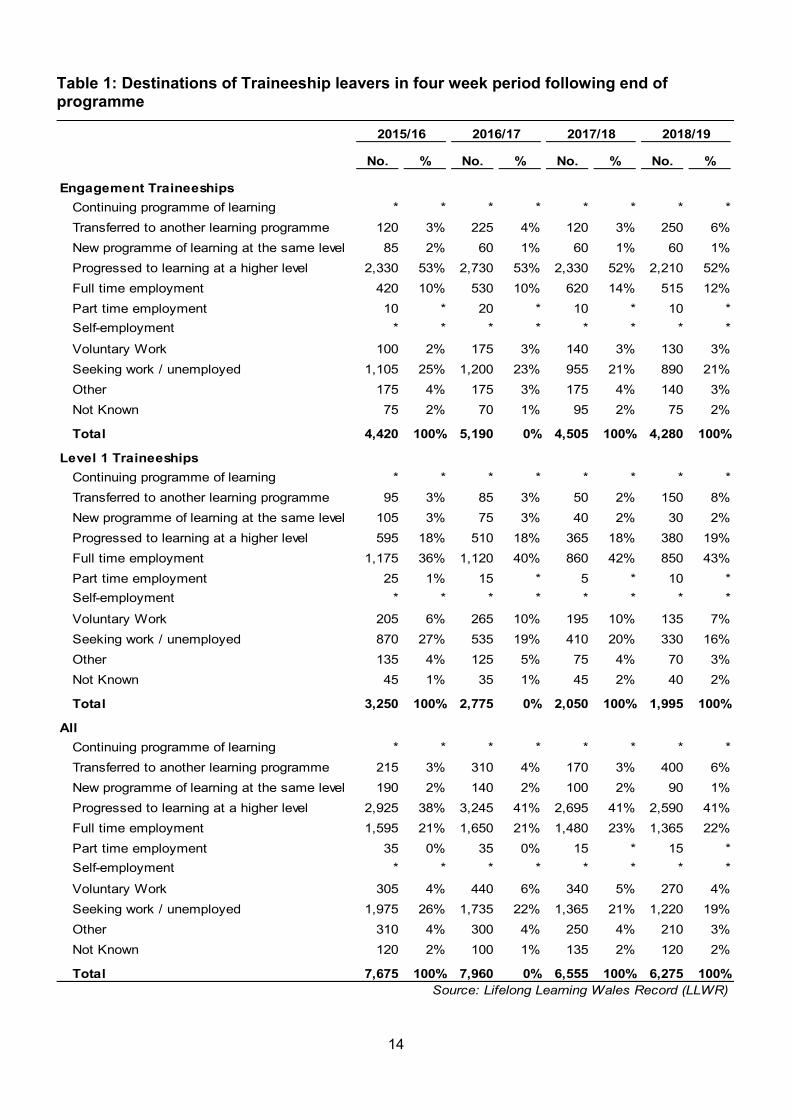
Table 1: Destinations of Traineeship leavers in four week period following end of programme
No. % No. % No. % No. %
Engagement Traineeships
Continuing programme of learning * * * * * * * *
Transferred to another learning programme 120 3% 225 4% 120 3% 250 6%
New programme of learning at the same level 85 2% 60 1% 60 1% 60 1%
Progressed to learning at a higher level 2,330 53% 2,730 53% 2,330 52% 2,210 52%
Full time employment 420 10% 530 10% 620 14% 515 12%
Part time employment 10 * 20 * 10 * 10 *
Self-employment * * * * * * * *
Voluntary Work 100 2% 175 3% 140 3% 130 3%
Seeking work / unemployed 1,105 25% 1,200 23% 955 21% 890 21%
Other 175 4% 175 3% 175 4% 140 3%
Not Known 75 2% 70 1% 95 2% 75 2%
Total 4,420 100% 5,190 0% 4,505 100% 4,280 100%
Level 1 Traineeships
Continuing programme of learning * * * * * * * *
Transferred to another learning programme 95 3% 85 3% 50 2% 150 8%
New programme of learning at the same level 105 3% 75 3% 40 2% 30 2%
Progressed to learning at a higher level 595 18% 510 18% 365 18% 380 19%
Full time employment 1,175 36% 1,120 40% 860 42% 850 43%
Part time employment 25 1% 15 * 5 * 10 *
Self-employment * * * * * * * *
Voluntary Work 205 6% 265 10% 195 10% 135 7%
Seeking work / unemployed 870 27% 535 19% 410 20% 330 16%
Other 135 4% 125 5% 75 4% 70 3%
Not Known 45 1% 35 1% 45 2% 40 2%
Total 3,250 100% 2,775 0% 2,050 100% 1,995 100%
All
Continuing programme of learning * * * * * * * *
Transferred to another learning programme 215 3% 310 4% 170 3% 400 6%
New programme of learning at the same level 190 2% 140 2% 100 2% 90 1%
Progressed to learning at a higher level 2,925 38% 3,245 41% 2,695 41% 2,590 41%
Full time employment 1,595 21% 1,650 21% 1,480 23% 1,365 22%
Part time employment 35 0% 35 0% 15 * 15 *
Self-employment * * * * * * * *
Voluntary Work 305 4% 440 6% 340 5% 270 4%
Seeking work / unemployed 1,975 26% 1,735 22% 1,365 21% 1,220 19%
Other 310 4% 300 4% 250 4% 210 3%
Not Known 120 2% 100 1% 135 2% 120 2%
Total 7,675 100% 7,960 0% 6,555 100% 6,275 100%
Source: Lifelong Learning Wales Record (LLWR)
2016/17 2017/18 2018/192015/16
15
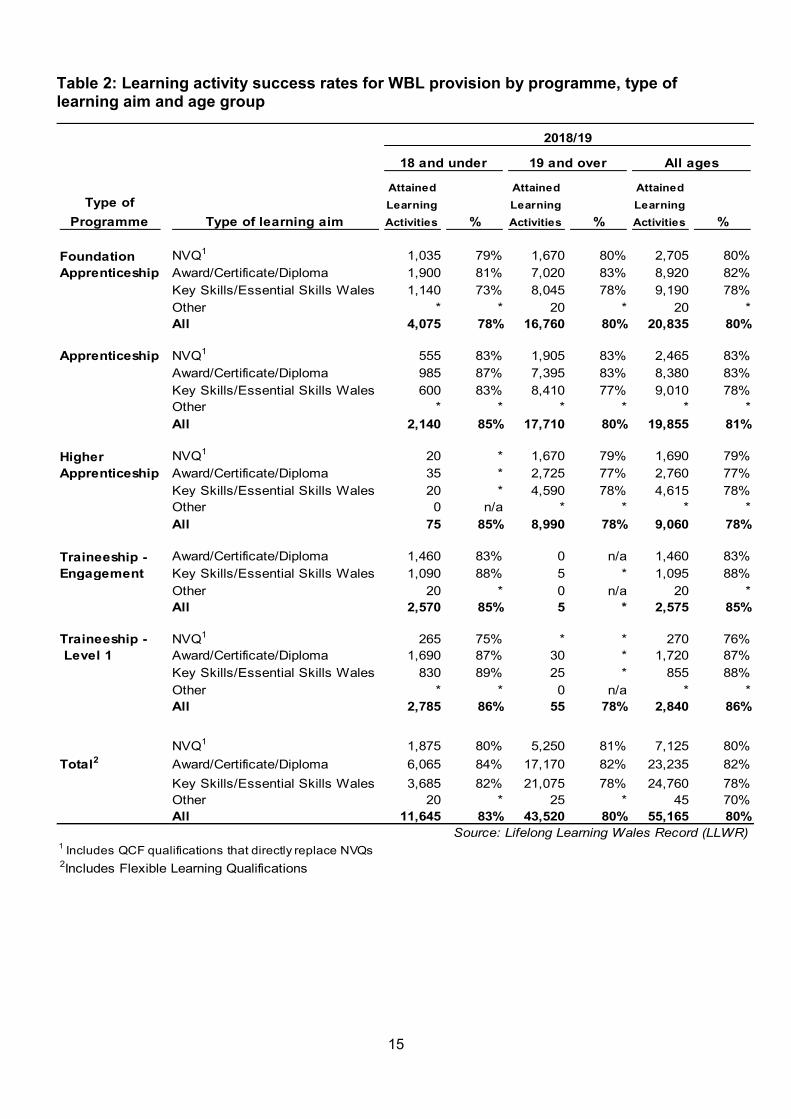
Table 2: Learning activity success rates for WBL provision by programme, type of learning aim and age group
Attained
Learning
Activities %
Attained
Learning
Activities %
Attained
Learning
Activities %
NVQ1 1,035 79% 1,670 80% 2,705 80%
Award/Certificate/Diploma 1,900 81% 7,020 83% 8,920 82%
Key Skills/Essential Skills Wales 1,140 73% 8,045 78% 9,190 78%
Other * * 20 * 20 *
All 4,075 78% 16,760 80% 20,835 80%
NVQ1 555 83% 1,905 83% 2,465 83%
Award/Certificate/Diploma 985 87% 7,395 83% 8,380 83%
Key Skills/Essential Skills Wales 600 83% 8,410 77% 9,010 78%
Other * * * * * *
All 2,140 85% 17,710 80% 19,855 81%
NVQ1 20 * 1,670 79% 1,690 79%
Award/Certificate/Diploma 35 * 2,725 77% 2,760 77%
Key Skills/Essential Skills Wales 20 * 4,590 78% 4,615 78%
Other 0 n/a * * * *
All 75 85% 8,990 78% 9,060 78%
Award/Certificate/Diploma 1,460 83% 0 n/a 1,460 83%
Key Skills/Essential Skills Wales 1,090 88% 5 * 1,095 88%
Other 20 * 0 n/a 20 *
All 2,570 85% 5 * 2,575 85%
NVQ1 265 75% * * 270 76%
Award/Certificate/Diploma 1,690 87% 30 * 1,720 87%
Key Skills/Essential Skills Wales 830 89% 25 * 855 88%
Other * * 0 n/a * *
All 2,785 86% 55 78% 2,840 86%
NVQ1 1,875 80% 5,250 81% 7,125 80%
Total2 Award/Certificate/Diploma 6,065 84% 17,170 82% 23,235 82%
Key Skills/Essential Skills Wales 3,685 82% 21,075 78% 24,760 78%
Other 20 * 25 * 45 70%
All 11,645 83% 43,520 80% 55,165 80%
Source: Lifelong Learning Wales Record (LLWR)1 Includes QCF qualifications that directly replace NVQs
2Includes Flexible Learning Qualifications
2018/19
18 and under 19 and over All ages
Apprenticeship
Type of
Programme Type of learning aim
Foundation
Apprenticeship
Higher
Apprenticeship
Traineeship -
Engagement
Traineeship -
Level 1
16
Table 3: Success rates of Adult Learning activities by WIMD deprivation rank of home Lower Super Output Area (LSOA), 2018/19
Table 4: Success rates of apprenticeships by WIMD deprivation rank of home Lower Super Output Area (LSOA), 2018/19
1st 2nd 3rd 4th 5th 6th 7th 8th 9th 10th
Success rate 87% 88% 90% 90% 90% 90% 90% 92% 91% 92%
Source: Lifelong Learning Wales Record (LLWR)
Decile of Deprivation
(1st = most deprived 10% of LSOAs, 10th = least deprived 10%)
1st 2nd 3rd 4th 5th 6th 7th 8th 9th 10th
Success rate 79% 80% 81% 81% 80% 82% 81% 83% 81% 82%
Source: Lifelong Learning Wales Record (LLWR)
Decile of Deprivation
(1st = most deprived 10% of LSOAs, 10th = least deprived 10%)
17
Notes
1. Data sources
This Statistical First Release (SFR) summarises data on learner outcomes for 2018/19. It covers
Work Based Learning (WBL) and Adult Learning (AL) provision delivered by learning providers funded
by Welsh Government.
Previous versions of this release had information on learner outcomes in Further Education. This has
been discontinued as the statistics have been replaced by the consistent performance measures for
post-16 learning.
Data on learners accessing WBL and AL provision across Wales is submitted electronically to Welsh
Government by learning providers via the Lifelong Learning Wales Record (LLWR). This data is used for
funding, monitoring performance and outcomes and to inform strategy development. Furthermore, the
data provides the official source of statistics on post-16 (non-higher education) learners in Wales.
Further information on LLWR including user support manuals can be found at:
Welsh Government - Lifelong Learning Wales Record
2. Definitions
2.1 Terminology
Data are presented on an ‘academic year’ basis referring to the period 1 August to 31 July.
The terms ‘learning activity’ or ‘learning aim’ refer to a specific qualification pursued by a learner,
for example, an A Level or Essential Skill. The term ‘learning programme’ refers to a group of
related learning activities or aims, such as an apprenticeship.
2.2 Cohorts
The Essential Skills Wales (ESW) suite of qualifications was also introduced in September 2015.
It was excluded from the 2016/17 release due to challenges experienced by providers delivering
these qualifications and data quality issues. It was agreed to include ESW in the 2017/18 base
cohort of learning activities and it continues to be included in 2018/19.
The base cohorts underpinning Adult Learning activity measures, and the apprenticeship activity
measures in Table 2, are all learning activities that were either expected to complete during the
respective academic year or actually ended during the academic year but were expected to
complete prior to it.
The base cohorts underpinning apprenticeship and traineeship success rates comprise all
programmes recorded as ending in the respective academic year.
From 2017/18 activities not funded by Welsh Government were no longer submitted to the
LLWR. It has not had an observable impact on learner outcome measures.

18
2.3 Provision type
This statistical release includes data on AL provision delivered by AL partnerships and WBL provision
delivered by contracted lead providers, their consortium members and sub-contractors.
WBL provision is defined as that submitted to the LLWR by a WBL provider or provision at Further
Education institutions comprising a WBL designated learning programme e.g. an Apprenticeship,
Foundation Apprenticeship, Higher Apprenticeship or Traineeship programme.
AL provision is also known as Adult Community Learning (ACL) and Local Authority Community
Learning. It was defined in the Adult Learning in Wales policy as “Flexible learning opportunities for
adults, delivered in community venues to meet local needs”. There are three distinct types of provision
included in this release:
AL directly delivered by local authorities (LAs);
AL delivered by LAs via a franchise arrangement with a further education (FE) institution
Other AL delivered by FE institutions (this includes all provision delivered by Adult Learning
Wales).
Other AL provision delivered by FE institutions is the largest provision type comprising 61 per cent of all
terminated learning activities included in this release. AL provision delivered by local authorities via a
franchise arrangement with a FE institution and AL provision directly delivered by local authorities
comprised 8 per cent and 31 per cent of all terminated learning activities respectively.
The following types of provision are not included in this release:
Higher Education (HE) provision delivered by FE institutions.
Learn Welsh (Welsh for Adults) provision, for which data is published by the National Centre for
Learning Welsh on the Learn Welsh website.
2.4 Completion, attainment and success for learning activities
The completion rates shown for activities are calculated as the number of learning activities
completed divided by the number of learning activities ended (completed or withdrawn).
The attainment rates for activities are calculated as the number of learning activities attained
divided by the number of learning activities completed.
The success rates for activities are calculated as the number of learning activities attained
divided by the number of learning activities terminated.
Learning activities that are deemed to be non-assessable (i.e. do not lead to an associated award) are
excluded from the denominators of the attainment and success rate calculations.
Learning activities recorded as either transferred or continuing are excluded from all calculations.
19
Generically coded learning activities have been excluded from the calculations. These are activities
delivered by the provider that do not appear on the Qualifications in Wales (QiW) database of approved
qualifications.
2.5 Apprenticeship success
The apprenticeship success rates are calculated as the number of learning programmes where the full
framework has been achieved divided by the number of learning programmes terminated.
Learning programmes recorded as either transferred or continuing at another WBL provider are excluded
from the calculation. Learning programmes that ended within 8 weeks of commencing without
completion are also excluded.
Learning programmes recorded as terminated due to learner death or the learner being made redundant
have been excluded from the calculation.
2.6 Learner age group
A learner’s age group is calculated from their age at 31 August in the academic year they started
learning.
2.7 Sector/subject areas
The sector/subject areas detailed on StatsWales are based on the 15 first-tier areas of learning classified
by the Office of Qualifications and Examination Regulation (OfQual) and reflect the sub-areas used by
Estyn for inspection purposes. The sector/subject areas in table 9 have been grouped to reflect the most
popular AL subject areas.
The total lines include learning activities with unknown sector/subject areas.
2.8 Early drop-out
Learning activities with an expected length of 24 weeks or greater that ended within 8 weeks of their start
date without completing have been classified as early drop-outs, and have been excluded from all
learner outcome measures in all tables.
2.9 Destinations
A change to the data collected on learner destinations via the LLWR was implemented in 2013/14 to
identify learners progressing to full-time or part-time employment. As such, the information detailed in
Table 1 differs slightly from the version in years prior to 2013/14 and care should be taken when making
comparisons across years.
The basis for collecting information on the destinations of traineeship leavers changed during the course
of 2014/15 to reflect destinations within four weeks rather than within three months, as was the case
previously. For this reason data on the destinations of traineeship leavers was not presented in the 2016
statistical release but has since been included on the new basis.

20
3. Rounding and suppression
All figures in this Statistical Release are rounded to the nearest 5 and therefore there may be apparent
slight differences between the sum of the constituent rows/columns and the totals.
A ‘*’ represents numbers less than 5.
In addition, percentage calculations where the denominator is less than 23 have been suppressed and
the percentage replaced with a ‘*‘.
21
4. Key Quality Information
This section provides a summary of information on this output against five dimensions of quality:
Relevance, Accuracy, Timeliness and Punctuality, Accessibility and Clarity, and Comparability.
4.1 Relevance
The measures set out in this publication are primarily used:
by the Welsh Government to monitor providers’ performance and as baseline information to set
targets for improvements as part of the Quality and Effectiveness Framework for post-16
learning;
by Estyn, to inform inspection judgements on Inspection Area 1; and
by providers themselves, as a management tool to measure their own performance and
benchmark themselves against sector averages, as part of their annual self-assessment cycles.
The Welsh Government and Estyn have a commitment to share data in order to minimise bureaucracy
for providers and ensure consistent definitions of performance wherever possible and have worked
together closely to develop these measures and a standard format for presenting data.
The measures are also used both within and outside the Welsh Government to monitor educational
trends and as a baseline for further analysis of the underlying data. Some of the key users are:
Ministers and the Members Research Service in the National Assembly for Wales;
Officials in the Welsh Government;
Other government departments;
Students, researchers, and academics;
Individual citizens, private companies, and the media.
These statistics are used in a variety of ways. Some examples of these are:
general background and research;
inclusion in reports and briefings;
advice to Ministers;
to inform and evaluate the education policy-making process in Wales.
4.2 Accuracy
Statisticians within the Welsh Government undertake a process of data reconciliation ahead of
publishing this release. Monthly reconciliation reports detailing provisional learner outcomes figures are
issued to FE institutions, WBL providers and local authorities. Data quality issues are then followed up
and resolved in liaison with Welsh Government officials.
22
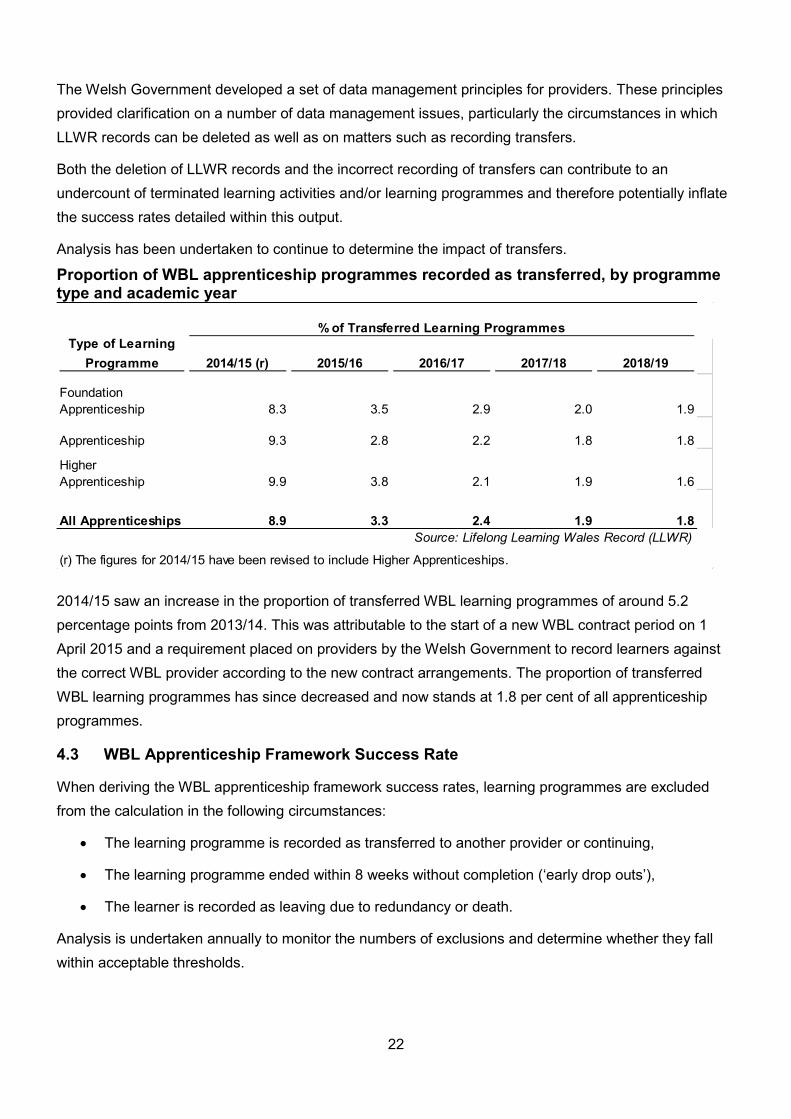
The Welsh Government developed a set of data management principles for providers. These principles
provided clarification on a number of data management issues, particularly the circumstances in which
LLWR records can be deleted as well as on matters such as recording transfers.
Both the deletion of LLWR records and the incorrect recording of transfers can contribute to an
undercount of terminated learning activities and/or learning programmes and therefore potentially inflate
the success rates detailed within this output.
Analysis has been undertaken to continue to determine the impact of transfers.
Proportion of WBL apprenticeship programmes recorded as transferred, by programme type and academic year
2014/15 saw an increase in the proportion of transferred WBL learning programmes of around 5.2
percentage points from 2013/14. This was attributable to the start of a new WBL contract period on 1
April 2015 and a requirement placed on providers by the Welsh Government to record learners against
the correct WBL provider according to the new contract arrangements. The proportion of transferred
WBL learning programmes has since decreased and now stands at 1.8 per cent of all apprenticeship
programmes.
4.3 WBL Apprenticeship Framework Success Rate
When deriving the WBL apprenticeship framework success rates, learning programmes are excluded
from the calculation in the following circumstances:
The learning programme is recorded as transferred to another provider or continuing,
The learning programme ended within 8 weeks without completion (‘early drop outs’),
The learner is recorded as leaving due to redundancy or death.
Analysis is undertaken annually to monitor the numbers of exclusions and determine whether they fall
within acceptable thresholds.
2014/15 (r) 2015/16 2016/17 2017/18 2018/19
Foundation
Apprenticeship 8.3 3.5 2.9 2.0 1.9
Apprenticeship 9.3 2.8 2.2 1.8 1.8
Higher
Apprenticeship 9.9 3.8 2.1 1.9 1.6
All Apprenticeships 8.9 3.3 2.4 1.9 1.8
Source: Lifelong Learning Wales Record (LLWR)
(r) The figures for 2014/15 have been revised to include Higher Apprenticeships.
Type of Learning
Programme
% of Transferred Learning Programmes

23
The following table shows the numbers and proportions of different types of exclusions in 2018/19
compared with previous years.
The proportion of ‘early drop outs’ has decreased by 2.4 percentage points since 2017/18. However this
is the first time it has decreased since 2014/15.
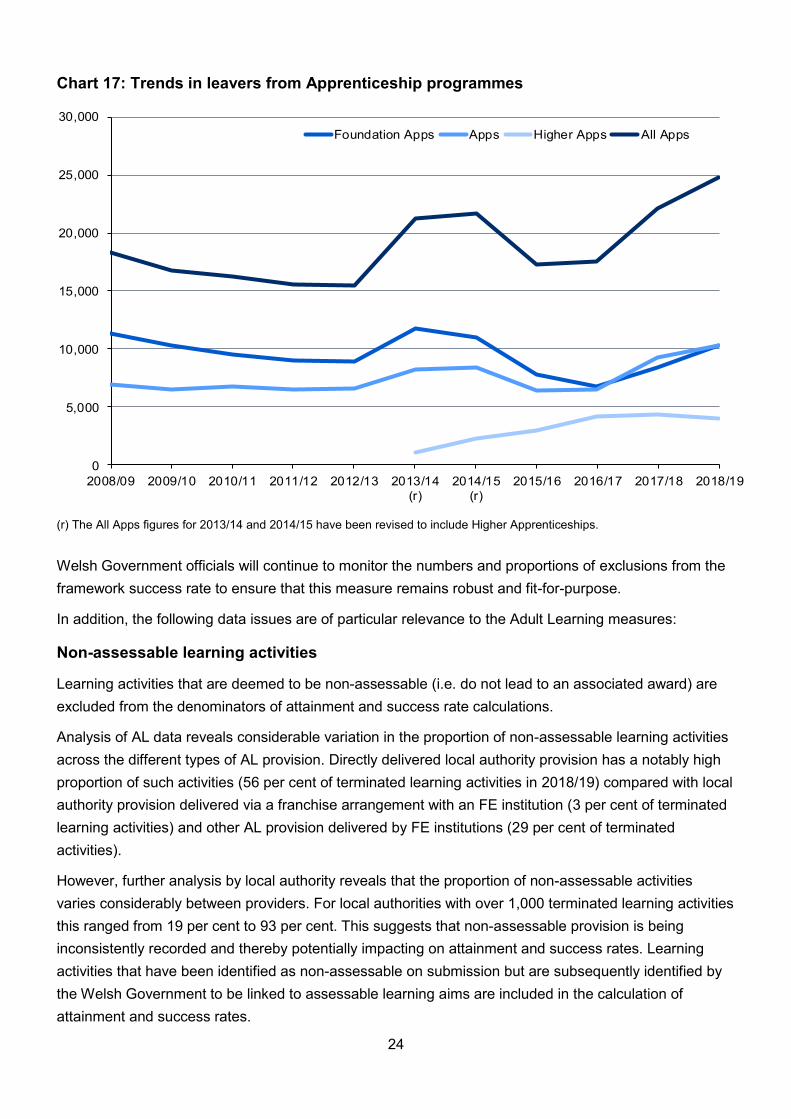
The following chart shows the denominator of the framework success rate (i.e. the number of leavers
minus early drop-outs and other exclusions) over the last 9 years. Following increased investment in
apprenticeships the number of apprenticeship leavers peaked in 2014/15, but has shown an increase in
the three most recent years with the Welsh Government target delivery of 100,000 quality
apprenticeships in the Assembly term.
No. % No. % No. % No. % No. %
Early drop-out 1,430 5.5 1,875 (r) 9.3 (r) 2,435 11.7 3,380 12.8 (r) 2,975 10.4
Continuing learning programme 10 * * * * * * * * *
Transferred learning programme 2,290 8.9 665 3.3 505 2.4 500 1.9 (r) 510 1.8
Learner redundancy 350 1.4 240 1.2 245 1.2 305 1.2 (r) 225 0.8
Learner death 10 * 5 * 10 * 10 * 10 *
Total exclusions 4,095 15.8 2,780 (r) 13.9 (r) 3,200 15.4 4,195 15.9 (r) 3,720 13.1
Total terminated learning
programmes 25,845 20,050 (r) 20,755 26,365 (r) 28,455
Source: Lifelong Learning Wales Record (LLWR)Source: Lifelong Learning Wales Record (LLWR)
2018/192017/182016/172015/16
Reason for exclusion
2014/15 (r)
(r) The figures for 2013/14 and 2014/15 have been revised to include Higher Apprenticeships. The figures for 2015/16 have
been revised due to resubmissions of data. The total figure for 2017/18 was revised due to an error in calculation.
24
Chart 17: Trends in leavers from Apprenticeship programmes
(r) The All Apps figures for 2013/14 and 2014/15 have been revised to include Higher Apprenticeships.
Welsh Government officials will continue to monitor the numbers and proportions of exclusions from the
framework success rate to ensure that this measure remains robust and fit-for-purpose.
In addition, the following data issues are of particular relevance to the Adult Learning measures:
Non-assessable learning activities
Learning activities that are deemed to be non-assessable (i.e. do not lead to an associated award) are
excluded from the denominators of attainment and success rate calculations.
Analysis of AL data reveals considerable variation in the proportion of non-assessable learning activities
across the different types of AL provision. Directly delivered local authority provision has a notably high
proportion of such activities (56 per cent of terminated learning activities in 2018/19) compared with local
authority provision delivered via a franchise arrangement with an FE institution (3 per cent of terminated
learning activities) and other AL provision delivered by FE institutions (29 per cent of terminated
activities).
However, further analysis by local authority reveals that the proportion of non-assessable activities
varies considerably between providers. For local authorities with over 1,000 terminated learning activities
this ranged from 19 per cent to 93 per cent. This suggests that non-assessable provision is being
inconsistently recorded and thereby potentially impacting on attainment and success rates. Learning
activities that have been identified as non-assessable on submission but are subsequently identified by
the Welsh Government to be linked to assessable learning aims are included in the calculation of
attainment and success rates.
0
5,000
10,000
15,000
20,000
25,000
30,000
2008/09 2009/10 2010/11 2011/12 2012/13 2013/14
(r)
2014/15
(r)
2015/16 2016/17 2017/18 2018/19
Foundation Apps Apps Higher Apps All Apps

25
Other AL delivered by FE institutions
For the purposes of this release, this provision has been identified using information recorded in the type
of learning programme field. Information on type of learning programme is based on FE institutions’ own
identification of AL provision.
4.4 Timeliness and punctuality
The annual timescale for the production of final learner outcomes data balances timeliness against the
need for accurate data-quality in order to underpin robust sector benchmarks. Statistics are drawn from a
database based on the LLWR as at December, (having been February until 2015/16 for FE and AL and
2016/17 for WBL). This first release is then produced and published as soon as possible.
4.5 Accessibility and clarity
This statistical release is pre-announced and then published on the Statistics and Research section of
the Welsh Government website.
4.6 Comparability and coherence
Figures in this statistical release are broadly comparable with previous years. Past releases can be
accessed via the following link:
Learner Outcome Measures for Further Education, Work-based Learning and Adult Community Learning
- past releases
Past releases contain information on FE provision. This has now been replaced by the consistent
performance measures for post-16 learning. Please note that these figures are not directly comparable.
Note that 2015/16 saw WBL outcomes published separately to FE and AL outcomes due to differences
in timetables. For 2012/13, 2014/15, 2016/17 and 2017/18, data on FE, WBL and AL provision were
published together in one release. Prior to 2012/13, data on FE and WBL provision were published
separately to AL provision.
Equivalent data on post-16 learner outcomes in England, Scotland and Northern Ireland can be found
via the following links:
Skills Funding Agency / Department for Education - Learner participation, outcomes and level of highest
qualification
Scottish Funding Council - Staff and Student Performance Indicators for FE Colleges
Department for the Economy Northern Ireland - Further Education Performance Statistics
However, due to differences in methodology and data collection, caution should be exercised in making
direct comparisons with the figures contained within this release.
4.7 Revisions
115 completed adult learning activities provided directly by Wrexham were omitted from the first version
of this publication. Figures, charts and StatsWales tables have been corrected and marked with an (r).

26
5. Additional information
5.1 Further dissemination of performance measures
Learner Outcomes Reports (LORs) for WBL providers and AL partnerships will be published by Welsh
Government in February 2019: Learner Outcomes Reports
5.2 Consistent post-16 performance measures
In previous years, arrangements for measuring performance in school sixth forms and in further
education were entirely separate. Performance measures were produced from different data-collection
systems using differing analysis methodologies. This means we were unable to compare outcomes in a
meaningful way across learner settings, and that learners and parents have not have access to
transparent information to inform their choices.
To address this disparity, the Welsh Government has been working to develop a set of consistent
measures for further education institutions and sixth forms to enable the publication of headline and
provider level information on an annual basis. In the first half of 2017 the Welsh Government consulted
on a new set of consistent performance measures for school sixth forms and further education colleges.
Summaries of the responses can be accessed via the ‘Consistent measures for post-16 learning in
Wales’ consultation page.
The Cabinet Secretary issued a Written Statement on 10 July 2017 to adopt the three new measures:
learner achievement, post-16 value added, and destinations.
More information about the measures can be found on the Post-16 Performance Measures Hwb playlist.
In September 2018 Welsh Government published and provided a first set of experimental statisitcs
covering learner achievement, post-16 value added and destinations.
Further information about the development of consistent measures for post-16 learning can be found on
the Welsh Government website.

27
National Statistics status
The United Kingdom Statistics Authority has designated these statistics as National Statistics, in
accordance with the Statistics and Registration Service Act 2007 and signifying compliance with the
Code of Practice for Statistics.
National Statistics status means that official statistics meet the highest standards of trustworthiness,
quality and public value.
All official statistics should comply with all aspects of the Code of Practice for Official Statistics. They are
awarded National Statistics status following an assessment by the UK Statistics Authority’s regulatory
arm. The Authority considers whether the statistics meet the highest standards of Code compliance,
including the value they add to public decisions and debate. The designation of these statistics as
National Statistics was confirmed in May 2011 following a full assessment against the Code of Practice.
It is Welsh Government’s responsibility to maintain compliance with the standards expected of National
Statistics. If we become concerned about whether these statistics are still meeting the appropriate
standards, we will discuss any concerns with the Authority promptly. National Statistics status can be
removed at any point when the highest standards are not maintained, and reinstated when standards are
restored.
Well-being of Future Generations Act (WFG)
The Well-being of Future Generations Act 2015 is about improving the social, economic, environmental
and cultural well-being of Wales. The Act puts in place seven well-being goals for Wales. These are for a
more equal, prosperous, resilient, healthier and globally responsible Wales, with cohesive communities
and a vibrant culture and thriving Welsh language. Under section (10)(1) of the Act, the Welsh Ministers
must (a) publish indicators (“national indicators”) that must be applied for the purpose of measuring
progress towards the achievement of the Well-being goals, and (b) lay a copy of the national indicators
before the National Assembly. The 46 national indicators were laid in March 2016.
Information on the indicators, along with narratives for each of the well-being goals and associated
technical information is available in the Well-being of Wales report.
Further information on the Well-being of Future Generations (Wales) Act 2015.
The statistics included in this release could also provide supporting narrative to the national indicators
and be used by public services boards in relation to their local well-being assessments and local well-
being plans.

28
Further details
This document is available at: https://gov.wales/learner-outcome-measures-work-based-learning-and-
adult-learning-august-2018-july-2019
Next update
February 2021 (provisional) for the academic year 2019/20.
We want your feedback
We welcome any feedback on any aspect of these statistics which can be provided by email to
Open Government Licence
All content is available under the Open Government Licence v3.0