lead-safe virginia program
TRANSCRIPT

Lead-Safe Virginia Program
Childhood Lead Poisoning Prevention Program 2009 Surveillance Summary Report

Table of Contents:
Background…………………………………………….…………………………………...……1 Mission…………………………………………………………………………………………....1 Program Activities…………………………………………………………………………….…2 2009 Data and Statistics………………………………………………………………………....2 Figure 1. Statewide Testing Results for Virginia Children < 72 months, 2001-2009…………....3 Figure 2. Number of children < 72 months of age with reported confirmed elevated blood lead levels ≥ 10 µg/dL, by age category: Virginia, 2009……………………………..……3 Figure 3. Statewide Testing Results for Medicaid Enrolled Children < 36 months of Age, 2001-2009…………………………………………………………………………………………4 Figure 4. Lead hazards identified, children < 72 months of age: Virginia, 2009………...………5 Table 1. Number of children confirmed for lead exposure, by age category, by blood lead level: Virginia, 2001 – 2009………………………………….……..……………………....4 Table 2. Summary of environmental investigations, children < 72 months of age: Virginia, 2009…………………...…...............................................................................................5 Reported number of children tested for elevated blood lead levels (EBLLs), by locality of residence, under 36 months of age: Virginia, 2009…….…………....6 Reported number of children tested for elevated blood lead levels (EBLLs), by locality of residence, under 72 months of age: Virginia, 2009…….……….….11 Guidelines for Childhood Lead Poisoning Testing in Virginia……………………………...16 Virginia High-Risk Zip Codes: Locality…................................................................................18 Virginia High-Risk Zip Codes: Numerical……………………………………..…………..…19

B a c k g r o u n d Lead poisoning is usually an asymptomatic disease; therefore blood lead testing needs to be performed based on risk and not just symptoms. Lead exposure can damage children’s nervous, hematopoietic, and renal systems. It is especially harmful to the developing nervous systems of fetuses. There is no safe level for lead exposure.
Children under the age of three years (36 months) are at risk due to this age group’s frequent hand-to-mouth activity and their developing neurological system. The main source of lead exposure for children in Virginia is house dust contaminated by leaded paint, and soil contaminated by decades of industrial and motor vehicle emissions (leaded gasoline). Although lead paint was banned from residential use in 1978, lead remains a hazard in homes built before the ban, especially pre-1950 housing. Renovation of these older homes can create additional lead hazards for families and workers. The pre-1978 homes of child care providers or daycare centers are also potential areas of exposure. The primary phase-out of leaded gasoline was completed in 1986; however lead from this source still remains as a hazard because lead is not biodegradable. There are also other pathways to lead exposure from sources such as imported jewelry and toys, home health remedies, imported herbs and spices, imported vinyl mini blinds, and other vinyl products. Many of the imported vinyl products use lead as a stabilizer, and as the product deteriorates the lead becomes available.
Many hobbies or occupations can be considered hazardous activities regarding lead exposure; furniture refinishing and making stained glass are examples. Other activities that may be associated with lead exposure include: using indoor firing ranges; performing renovation, remodeling, and painting; working with lead batteries; performing auto paint refinishing; and making pottery. "Take-home" exposures may result when workers wear their work clothes home and/or wash them with the family laundry. Another take-home exposure may occur when scrap or waste material is brought home from work.
Lead dust in the home is usually a chronic exposure and therefore has more potential to cause permanent damage to the child. An occasional or acute exposure to a toy or similar object where the lead is not readily available to the child will most likely not cause any health problems.
The Code of Virginia, sections 32.1-46.1 requires all children determined to be at risk to be tested for elevated blood lead levels at the age of one year (12 months), again at the age of two years (24 months), and between the ages 36 - 72 months if never tested previously or are exposed to a new risk factor. All Medicaid enrolled children must be tested at age one year (12 months) and again at 2 years (24 months) regardless of any risk factors. This periodic testing is both a federal and state requirement. All laboratories are required to report blood lead results electronically within ten days. Lead poisoning is a reportable disease and completion of the Epi-1 form is required. M i s s i o n
The mission of the Lead Safe Virginia Childhood Lead Poisoning Prevention Program is to eliminate lead as a health hazard for children less than six years of age. Lead-Safe Virginia Program, Virginia Department of Health 1

P r o g r a m A c t i v i t i e s
The Lead-Safe Virginia Program is funded by the Centers for Disease Control and Prevention (CDC) and the Environmental Protection Agency (EPA).
The objectives of the Lead-Safe Virginia Program include 1) assure all at-risk children receive lead testing 2) coordinate care and referrals for medical and environmental intervention for all children under six years of age with an elevated blood lead level 3) educate the public and health care providers regarding childhood lead poisoning 4) educate realtors, landlords, renovators, painters, homeowners, and others regarding lead-safe work practices and EPA regulations 5) maintain a statewide childhood blood lead surveillance system 6) implement primary prevention measures to reduce children’s exposure to lead hazards through activities and collaboration 7) coordinate the implementation and evaluation of the statewide lead elimination plan, A Collaborative Strategic Plan to Eliminate Childhood Lead Poisoning in Virginia by 2010. 2 0 0 9 D a t a a n d S t a t i s t i c s
This report summarizes the 2009 data to include both testing and confirmed elevated
blood lead level data, and the identification of sources of exposure for children under 6 years of age. A confirmed EBLL is defined as a single elevated venous test ≥ 10 μg/dL or two elevated capillary tests within 84 days/12 weeks and is only counted once in the year in which it initially occurred.
Testing for lead exposure is a key component of reducing childhood lead poisoning. Early detection of a child’s elevated blood lead level (EBLL) provides the opportunity to identify and reduce lead hazards in order to lower the child’s exposure and also identify and address hazards to prevent future cases. During 2009, 102,532 children under 6 years (72 months) of age were tested for lead exposure. Of these, 417 children were reported as having a confirmed elevated blood lead test. Of the high-risk age category, under 36 months, 53,505 were tested with 242 having a confirmed EBLL. Medicaid enrolled children under 36 months of age accounted for 62% of the children tested in this high-risk age category, and 168 of those were confirmed EBLLs. This accounts for 69% of the confirmed EBLLs in this age category. The CDC has determined that children enrolled in Medicaid are at high-risk for lead exposure for various reasons. The Lead Safe Virginia Program is working with the Department of Medical Assistance Services to educate providers regarding the federal and state requirement to test Medicaid enrolled children at both 12 and 24 months of age. The adoption by the National Committee for Quality Assurance (NCQA) through the Healthcare Effectiveness Data and Information Set (HEDIS) a measure for lead testing is increasing provider compliance in Virginia. During 2009, there was a 58% increase in the testing rate for Virginia children under 36 months of age enrolled in Medicaid. (Figure 3).
Overall there has been a steady increase in the number of children tested for EBLLs between 2001 and 2009. (Figure 1) This increase can be partially attributed to the testing and reporting requirements of 12 VAC 5-120, “Regulations for testing children for elevated blood lead levels”, made effective July 1, 2001. During 2009 these regulations were amended to: 1) include CLIA-waived point of care providers in the definition of a laboratory, 2) allow the use of a CLIA-waived, CDC approved lead testing device, and 3) require providers to provide lead poisoning prevention materials at all well-child physicals on children under 72 months of age.
Lead-Safe Virginia Program, Virginia Department of Health 2

Figure 1. Statewide Testing Results for Virginia Children < 72 months, 2001-2009
39,771
102,532
417377411560470 466 411 430 337
69,647
82,341 86,31091,308
65,867
51,44451,459
0
20,000
40,000
60,000
80,000
100,000
120,000
2001 2002 2003 2004 2005 2006 2007 2008 2009
Confirmed Elevated Total Screened
Note: Results based on one test per child per year. The reporting of elevated blood lead levels is required under the Regulations for Disease Reporting and Control. Effective July 1, 2001, regulations require the reporting of all lead tests performed on children under 72 months of age. The number of children tested each year is influenced by several factors that include the number of children born in Virginia each year, migration of children into and out of the state or to a different locality, and the number of children tested in compliance with the regulations. These statistics are preliminary, as the database will accept historical data as made available and continuous data quality control may depict minor changes.
Figure 2. Number of children < 72 months of age with reported confirmed elevated blood lead levels ≥ 10 µg/dL, by age category: Virginia, 2009
23
67
131
88
66
42
0
20
40
60
80
100
120
140
0 - 11 12 - 23 24 - 35 36 - 47 48 - 59 60 - 71
AGE (Months)
Note: A ‘confirmed’ elevated blood lead level (EBLL) is defined as a single elevated venous test ≥ 10 μg/dL or two elevated capillary tests within 84 days/12 weeks and is only counted once in the year in which it initially occurred. The reporting of elevated blood lead levels is required under the Regulations for Disease Reporting and Control. Effective July 1, 2001, regulations require the reporting of all blood lead tests performed on children under 72 months of age. These statistics are preliminary, as the database will accept historical data as made available and continuous data quality control may depict minor changes.
Lead-Safe Virginia Program, Virginia Department of Health 3
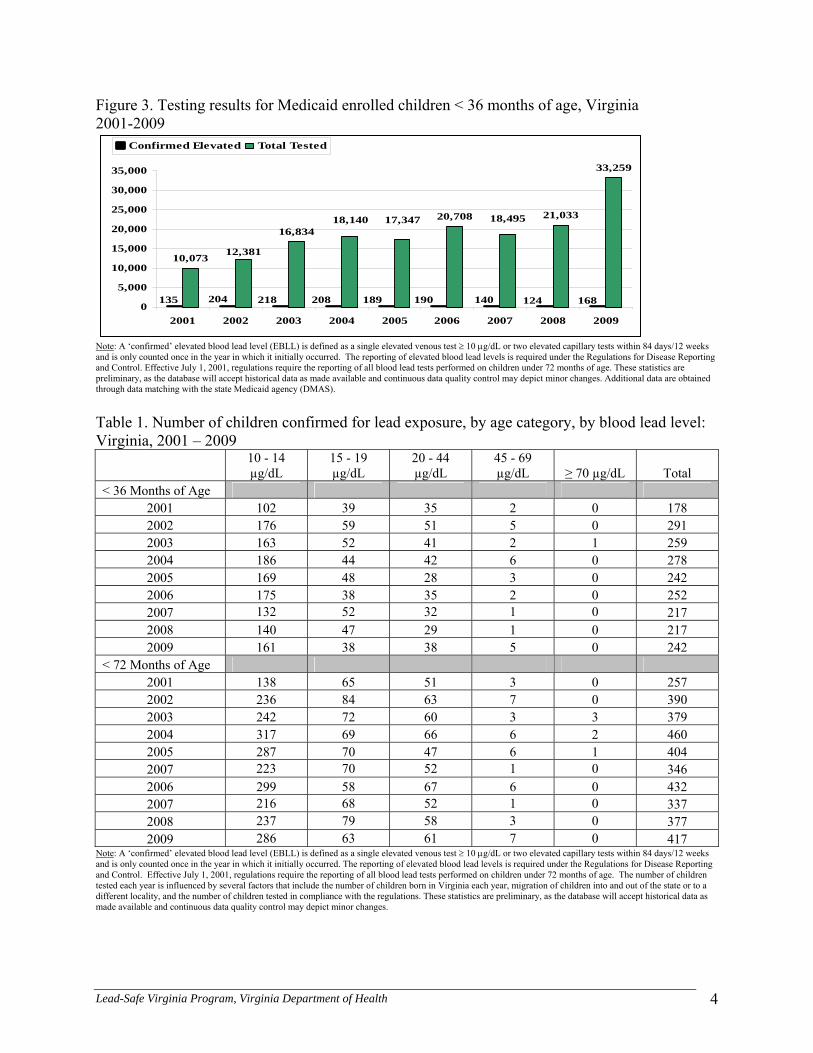
Figure 3. Testing results for Medicaid enrolled children < 36 months of age, Virginia 2001-2009
10,073
16,83420,708 21,033
33,259
168124140190189208218204135
18,49517,34718,140
12,381
0
5,000
10,000
15,000
20,000
25,000
30,000
35,000
2001 2002 2003 2004 2005 2006 2007 2008 2009
Confirmed Elevated Total Tested
Note: A ‘confirmed’ elevated blood lead level (EBLL) is defined as a single elevated venous test ≥ 10 μg/dL or two elevated capillary tests within 84 days/12 weeks and is only counted once in the year in which it initially occurred. The reporting of elevated blood lead levels is required under the Regulations for Disease Reporting and Control. Effective July 1, 2001, regulations require the reporting of all blood lead tests performed on children under 72 months of age. These statistics are preliminary, as the database will accept historical data as made available and continuous data quality control may depict minor changes. Additional data are obtained through data matching with the state Medicaid agency (DMAS).
Table 1. Number of children confirmed for lead exposure, by age category, by blood lead level: Virginia, 2001 – 2009
10 - 14 µg/dL
15 - 19 µg/dL
20 - 44 µg/dL
45 - 69 µg/dL ≥ 70 µg/dL Total
< 36 Months of Age 2001 102 39 35 2 0 178 2002 176 59 51 5 0 291 2003 163 52 41 2 1 259 2004 186 44 42 6 0 278 2005 169 48 28 3 0 242 2006 175 38 35 2 0 252 2007 132 52 32 1 0 217 2008 140 47 29 1 0 217 2009 161 38 38 5 0 242
< 72 Months of Age 2001 138 65 51 3 0 257 2002 236 84 63 7 0 390 2003 242 72 60 3 3 379 2004 317 69 66 6 2 460 2005 287 70 47 6 1 404 2007 223 70 52 1 0 346 2006 299 58 67 6 0 432 2007 216 68 52 1 0 337 2008 237 79 58 3 0 377 2009 286 63 61 7 0 417
Note: A ‘confirmed’ elevated blood lead level (EBLL) is defined as a single elevated venous test ≥ 10 μg/dL or two elevated capillary tests within 84 days/12 weeks and is only counted once in the year in which it initially occurred. The reporting of elevated blood lead levels is required under the Regulations for Disease Reporting and Control. Effective July 1, 2001, regulations require the reporting of all blood lead tests performed on children under 72 months of age. The number of children tested each year is influenced by several factors that include the number of children born in Virginia each year, migration of children into and out of the state or to a different locality, and the number of children tested in compliance with the regulations. These statistics are preliminary, as the database will accept historical data as made available and continuous data quality control may depict minor changes.
Lead-Safe Virginia Program, Virginia Department of Health 4

Table 2. Summary of environmental investigations, children < 72 months of age: Virginia, 2009 Number of EBLLs 20 µg/dl or above identified as new cases 55 Number of EBLLs increasing or persistent 15-19µg/dl 7
Number of environmental intervention blood lead investigations (EIBLI) required 52 Number of environmental investigations performed (Includes secondary addresses) 66 Number of EIBLI not performed (family moved-3, family refused services-1, unable to reach family-1, RHA property-1) 6
Number of “newcomer/refugee” children with EBLL requiring EIBLI 4 Lead dust hazard on floors 19 Lead dust hazard on window sills 33 Lead dust hazard on window wells 4 Lead dust hazard other area (hall wall, computer stand, vent top, HVAC, mini-blind, porch rail-2) 7 Deteriorated lead based paint on interior surfaces 38 Deteriorated lead based paint on exterior surfaces 31 Soil lead hazards identified (children’s play area) 14 Soil lead hazards identified (non play areas) 7 Lead in water above 15 ppb 0 Occupational exposure from parent or caregiver 0 Mini blinds 4 Kohl (eye-liner from Morocco) 2 Home remedies 1 Other (metal skewers, metal chain, spice, pottery imported from Mexico) 4
Note: Environmental intervention blood lead investigations are performed on all confirmed venous elevated blood lead levels ≥ 20 µg/dL or persistent confirmed blood lead levels of 15 to 19 µg/dL on children < 72 months of age. Environmental investigations / risk assessments not conducted or completed were due to varying reasons such as the family moved to a new address or the family refused inspection. Multiple environmental investigations may be required for the same child due to the possibility of lead exposure from more than one location. Each source of exposure (dust etc.) was only counted once per address. Figure 4. Lead hazards identified, children < 72 months of age: Virginia, 2009
Lead Dust Haza rd on Floors1 2%
Lead Dust Hazard on W indow Sills22 %
Deter iorated Lead-based Pain t of Exterior Surfaces
20 %
Soil Lead Ha zards (play area an d nearby)
1 4%
Other Sources7%
Deteriora ted Lead-base d Paint of In terior Surfaces
25%
Lead-Safe Virginia Program, Virginia Department of Health 5

Lead-Safe Virginia Program, Virginia Department of Health 6
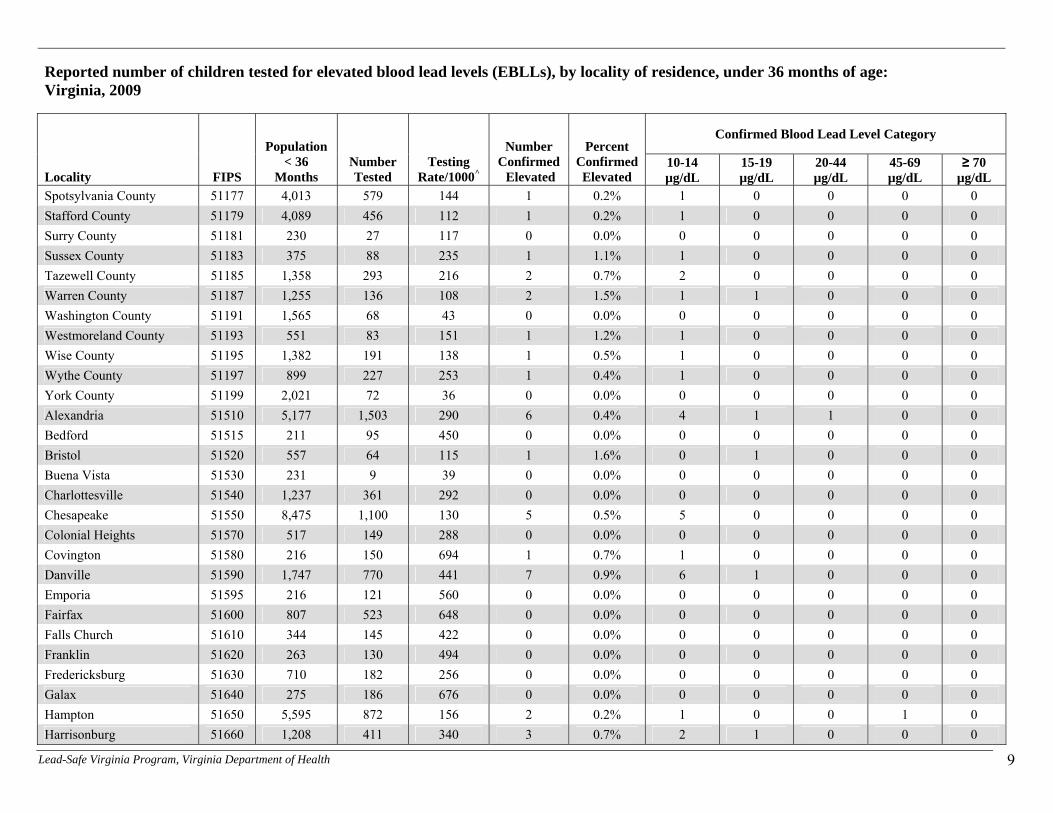
Reported number of children tested for elevated blood lead levels (EBLLs), by locality of residence, under 36 months of age: Virginia, 2009
Confirmed Blood Lead Level Category
Locality FIPS
Population < 36
Months Number Tested
Testing Rate/1000^
Number Confirmed Elevated
Percent Confirmed Elevated
10-14 µg/dL
15-19 µg/dL
20-44 µg/dL
45-69 µg/dL
≥ 70 µg/dL
Accomack County 51001 1,401 724 517 6 0.8% 4 2 0 0 0 Albemarle County 51003 2,965 572 193 3 0.5% 2 0 1 0 0 Alleghany County 51005 428 81 189 1 1.2% 0 0 1 0 0 Amelia County 51007 423 71 168 0 0.0% 0 0 0 0 0 Amherst County 51009 1,055 224 212 0 0.0% 0 0 0 0 0 Appomattox County 51011 500 127 254 0 0.0% 0 0 0 0 0 Arlington County 51013 6,564 2,254 343 7 0.3% 6 1 0 0 0 Augusta County 51015 2,197 435 198 0 0.0% 0 0 0 0 0 Bath County 51017 131 30 229 0 0.0% 0 0 0 0 0 Bedford County 51019 1,996 258 129 0 0.0% 0 0 0 0 0 Bland County 51021 173 34 197 0 0.0% 0 0 0 0 0 Botetourt County 51023 1,055 171 162 0 0.0% 0 0 0 0 0 Brunswick County 51025 546 166 304 1 0.6% 1 0 0 0 0 Buchanan County 51027 738 84 114 0 0.0% 0 0 0 0 0 Buckingham County 51029 419 128 305 0 0.0% 0 0 0 0 0 Campbell County 51031 1,748 263 150 2 0.8% 0 1 1 0 0 Caroline County 51033 858 222 259 0 0.0% 0 0 0 0 0 Carroll County 51035 992 199 201 0 0.0% 0 0 0 0 0 Charles City County 51036 242 30 124 0 0.0% 0 0 0 0 0 Charlotte County 51037 398 116 291 3 2.6% 1 0 0 2 0 Chesterfield County 51041 10,159 2,123 209 1 0.0% 1 0 0 0 0 Clarke County 51043 369 48 130 1 2.1% 0 1 0 0 0 Craig County 51045 163 19 117 0 0.0% 0 0 0 0 0 Culpeper County 51047 1,315 729 554 1 0.1% 1 0 0 0 0 Cumberland County 51049 350 53 151 1 1.9% 1 0 0 0 0 Dickenson County 51051 535 41 77 0 0.0% 0 0 0 0 0 Dinwiddie County 51053 786 87 111 0 0.0% 0 0 0 0 0 Essex County 51057 314 46 146 0 0.0% 0 0 0 0 0

Lead-Safe Virginia Program, Virginia Department of Health 7
Reported number of children tested for elevated blood lead levels (EBLLs), by locality of residence, under 36 months of age: Virginia, 2009
Confirmed Blood Lead Level Category
Locality FIPS
Population < 36
Months Number Tested
Testing Rate/1000^
Number Confirmed Elevated
Percent Confirmed Elevated
10-14 µg/dL
15-19 µg/dL
20-44 µg/dL
45-69 µg/dL
≥ 70 µg/dL
Fairfax County 51059 40,580 6,931 171 21 0.3% 15 2 4 0 0 Fauquier County 51061 2,048 410 200 2 0.5% 1 0 1 0 0 Floyd County 51063 462 23 50 0 0.0% 0 0 0 0 0 Fluvanna County 51065 762 136 178 0 0.0% 0 0 0 0 0 Franklin County 51067 1,520 115 76 1 0.9% 1 0 0 0 0 Frederick County 51069 2,296 306 133 0 0.0% 0 0 0 0 0 Giles County 51071 581 19 33 0 0.0% 0 0 0 0 0 Gloucester County 51073 1,141 82 72 0 0.0% 0 0 0 0 0 Goochland County 51075 492 248 504 0 0.0% 0 0 0 0 0 Grayson County 51077 507 70 138 0 0.0% 0 0 0 0 0 Greene County 51079 668 97 145 0 0.0% 0 0 0 0 0 Greensville County 51081 261 9 34 0 0.0% 0 0 0 0 0 Halifax County 51083 1,323 173 131 0 0.0% 0 0 0 0 0 Hanover County 51085 3,290 550 167 2 0.4% 2 0 0 0 0 Henrico County 51087 10,648 2,552 240 7 0.3% 4 1 2 0 0 Henry County 51089 1,920 156 81 2 1.3% 1 0 1 0 0 Highland County 51091 58 9 155 0 0.0% 0 0 0 0 0 Isle of Wight County 51093 1,047 224 214 0 0.0% 0 0 0 0 0 James City County 51095 1,597 220 138 2 0.9% 0 2 0 0 0 King and Queen County 51097 220 26 118 0 0.0% 0 0 0 0 0 King George County 51099 715 174 243 1 0.6% 1 0 0 0 0 King William County 51101 517 49 95 1 2.0% 1 0 0 0 0 Lancaster County 51103 286 50 175 0 0.0% 0 0 0 0 0 Lee County 51105 808 143 177 0 0.0% 0 0 0 0 0 Loudoun County 51107 9,919 976 98 3 0.3% 3 0 0 0 0 Louisa County 51109 939 180 192 1 0.6% 1 0 0 0 0 Lunenburg County 51111 393 112 285 2 1.8% 1 1 0 0 0 Madison County 51113 391 54 138 1 1.9% 1 0 0 0 0

Lead-Safe Virginia Program, Virginia Department of Health 8
Reported number of children tested for elevated blood lead levels (EBLLs), by locality of residence, under 36 months of age: Virginia, 2009
Confirmed Blood Lead Level Category
Locality FIPS
Population < 36
Months Number Tested
Testing Rate/1000^
Number Confirmed Elevated
Percent Confirmed Elevated
10-14 µg/dL
15-19 µg/dL
20-44 µg/dL
45-69 µg/dL
≥ 70 µg/dL
Mathews County 51115 230 45 196 1 2.2% 1 0 0 0 0 Mecklenburg County 51117 1,033 277 268 1 0.4% 1 0 0 0 0 Middlesex County 51119 211 74 351 0 0.0% 0 0 0 0 0 Montgomery County 51121 2,421 62 26 1 1.6% 0 1 0 0 0 Nelson County 51125 469 136 290 2 1.5% 1 1 0 0 0 New Kent County 51127 420 80 190 0 0.0% 0 0 0 0 0 Northampton County 51131 437 222 508 2 0.9% 1 1 0 0 0 Northumberland County 51133 317 46 145 3 6.5% 0 0 1 2 0 Nottoway County 51135 517 146 282 4 2.7% 2 0 2 0 0 Orange County 51137 918 182 198 0 0.0% 0 0 0 0 0 Page County 51139 756 129 171 0 0.0% 0 0 0 0 0 Patrick County 51141 675 104 154 0 0.0% 0 0 0 0 0 Pittsylvania County 51143 2,100 418 199 0 0.0% 0 0 0 0 0 Powhatan County 51145 786 108 137 0 0.0% 0 0 0 0 0 Prince Edward County 51147 573 269 469 1 0.4% 1 0 0 0 0 Prince George County 51149 1,159 76 66 0 0.0% 0 0 0 0 0 Prince William County 51153 14,421 1,881 130 5 0.3% 4 1 0 0 0 Pulaski County 51155 1,149 182 158 0 0.0% 0 0 0 0 0 Rappahannock County 51157 217 72 332 2 2.8% 2 0 0 0 0 Richmond County 51159 213 35 164 2 5.7% 2 0 0 0 0 Roanoke County 51161 2,627 243 93 0 0.0% 0 0 0 0 0 Rockbridge County 51163 681 47 69 0 0.0% 0 0 0 0 0 Rockingham County 51165 2,512 956 381 3 0.3% 0 2 1 0 0 Russell County 51167 919 86 94 0 0.0% 0 0 0 0 0 Scott County 51169 708 161 227 1 0.6% 1 0 0 0 0 Shenandoah County 51171 1,126 163 145 0 0.0% 0 0 0 0 0 Smyth County 51173 1,064 364 342 0 0.0% 0 0 0 0 0 Southampton County 51175 532 109 205 0 0.0% 0 0 0 0 0
Lead-Safe Virginia Program, Virginia Department of Health 9
Reported number of children tested for elevated blood lead levels (EBLLs), by locality of residence, under 36 months of age: Virginia, 2009
Confirmed Blood Lead Level Category
Locality FIPS
Population < 36
Months Number Tested
Testing Rate/1000^
Number Confirmed Elevated
Percent Confirmed Elevated
10-14 µg/dL
15-19 µg/dL
20-44 µg/dL
45-69 µg/dL
≥ 70 µg/dL
Spotsylvania County 51177 4,013 579 144 1 0.2% 1 0 0 0 0 Stafford County 51179 4,089 456 112 1 0.2% 1 0 0 0 0 Surry County 51181 230 27 117 0 0.0% 0 0 0 0 0 Sussex County 51183 375 88 235 1 1.1% 1 0 0 0 0 Tazewell County 51185 1,358 293 216 2 0.7% 2 0 0 0 0 Warren County 51187 1,255 136 108 2 1.5% 1 1 0 0 0 Washington County 51191 1,565 68 43 0 0.0% 0 0 0 0 0 Westmoreland County 51193 551 83 151 1 1.2% 1 0 0 0 0 Wise County 51195 1,382 191 138 1 0.5% 1 0 0 0 0 Wythe County 51197 899 227 253 1 0.4% 1 0 0 0 0 York County 51199 2,021 72 36 0 0.0% 0 0 0 0 0 Alexandria 51510 5,177 1,503 290 6 0.4% 4 1 1 0 0 Bedford 51515 211 95 450 0 0.0% 0 0 0 0 0 Bristol 51520 557 64 115 1 1.6% 0 1 0 0 0 Buena Vista 51530 231 9 39 0 0.0% 0 0 0 0 0 Charlottesville 51540 1,237 361 292 0 0.0% 0 0 0 0 0 Chesapeake 51550 8,475 1,100 130 5 0.5% 5 0 0 0 0 Colonial Heights 51570 517 149 288 0 0.0% 0 0 0 0 0 Covington 51580 216 150 694 1 0.7% 1 0 0 0 0 Danville 51590 1,747 770 441 7 0.9% 6 1 0 0 0 Emporia 51595 216 121 560 0 0.0% 0 0 0 0 0 Fairfax 51600 807 523 648 0 0.0% 0 0 0 0 0 Falls Church 51610 344 145 422 0 0.0% 0 0 0 0 0 Franklin 51620 263 130 494 0 0.0% 0 0 0 0 0 Fredericksburg 51630 710 182 256 0 0.0% 0 0 0 0 0 Galax 51640 275 186 676 0 0.0% 0 0 0 0 0 Hampton 51650 5,595 872 156 2 0.2% 1 0 0 1 0 Harrisonburg 51660 1,208 411 340 3 0.7% 2 1 0 0 0
Lead-Safe Virginia Program, Virginia Department of Health 10
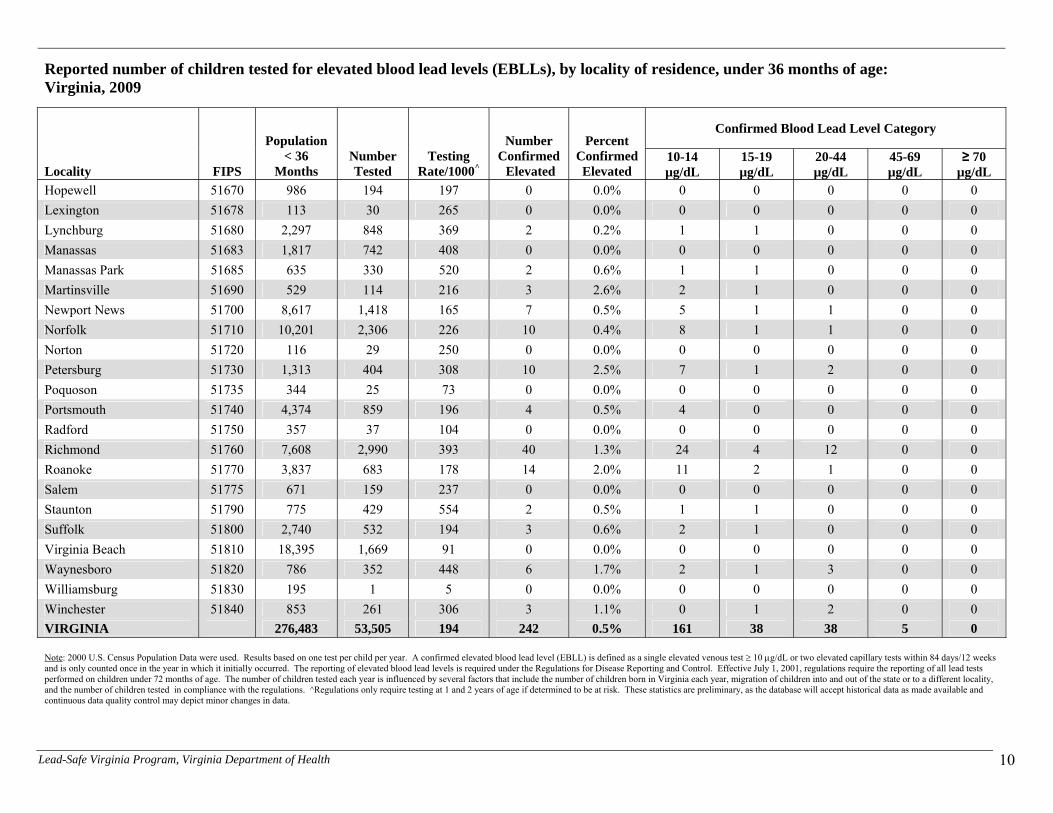
Reported number of children tested for elevated blood lead levels (EBLLs), by locality of residence, under 36 months of age: Virginia, 2009
Confirmed Blood Lead Level Category
Locality FIPS
Population < 36
Months Number Tested
Testing Rate/1000^
Number Confirmed Elevated
Percent Confirmed Elevated
10-14 µg/dL
15-19 µg/dL
20-44 µg/dL
45-69 µg/dL
≥ 70 µg/dL
Hopewell 51670 986 194 197 0 0.0% 0 0 0 0 0 Lexington 51678 113 30 265 0 0.0% 0 0 0 0 0 Lynchburg 51680 2,297 848 369 2 0.2% 1 1 0 0 0 Manassas 51683 1,817 742 408 0 0.0% 0 0 0 0 0 Manassas Park 51685 635 330 520 2 0.6% 1 1 0 0 0 Martinsville 51690 529 114 216 3 2.6% 2 1 0 0 0 Newport News 51700 8,617 1,418 165 7 0.5% 5 1 1 0 0 Norfolk 51710 10,201 2,306 226 10 0.4% 8 1 1 0 0 Norton 51720 116 29 250 0 0.0% 0 0 0 0 0 Petersburg 51730 1,313 404 308 10 2.5% 7 1 2 0 0 Poquoson 51735 344 25 73 0 0.0% 0 0 0 0 0 Portsmouth 51740 4,374 859 196 4 0.5% 4 0 0 0 0 Radford 51750 357 37 104 0 0.0% 0 0 0 0 0 Richmond 51760 7,608 2,990 393 40 1.3% 24 4 12 0 0 Roanoke 51770 3,837 683 178 14 2.0% 11 2 1 0 0 Salem 51775 671 159 237 0 0.0% 0 0 0 0 0 Staunton 51790 775 429 554 2 0.5% 1 1 0 0 0 Suffolk 51800 2,740 532 194 3 0.6% 2 1 0 0 0 Virginia Beach 51810 18,395 1,669 91 0 0.0% 0 0 0 0 0 Waynesboro 51820 786 352 448 6 1.7% 2 1 3 0 0 Williamsburg 51830 195 1 5 0 0.0% 0 0 0 0 0 Winchester 51840 853 261 306 3 1.1% 0 1 2 0 0 VIRGINIA 276,483 53,505 194 242 0.5% 161 38 38 5 0
Note: 2000 U.S. Census Population Data were used. Results based on one test per child per year. A confirmed elevated blood lead level (EBLL) is defined as a single elevated venous test ≥ 10 μg/dL or two elevated capillary tests within 84 days/12 weeks and is only counted once in the year in which it initially occurred. The reporting of elevated blood lead levels is required under the Regulations for Disease Reporting and Control. Effective July 1, 2001, regulations require the reporting of all lead tests performed on children under 72 months of age. The number of children tested each year is influenced by several factors that include the number of children born in Virginia each year, migration of children into and out of the state or to a different locality, and the number of children tested in compliance with the regulations. ^Regulations only require testing at 1 and 2 years of age if determined to be at risk. These statistics are preliminary, as the database will accept historical data as made available and continuous data quality control may depict minor changes in data.
Lead-Safe Virginia Program, Virginia Department of Health 11
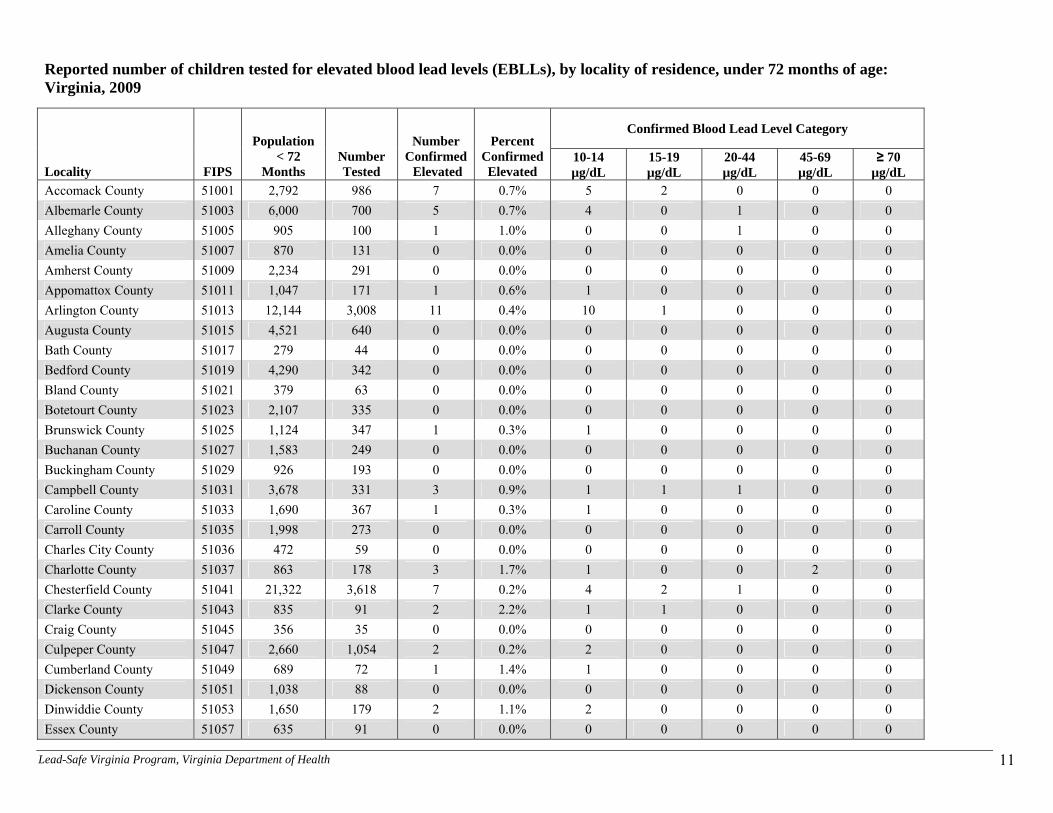
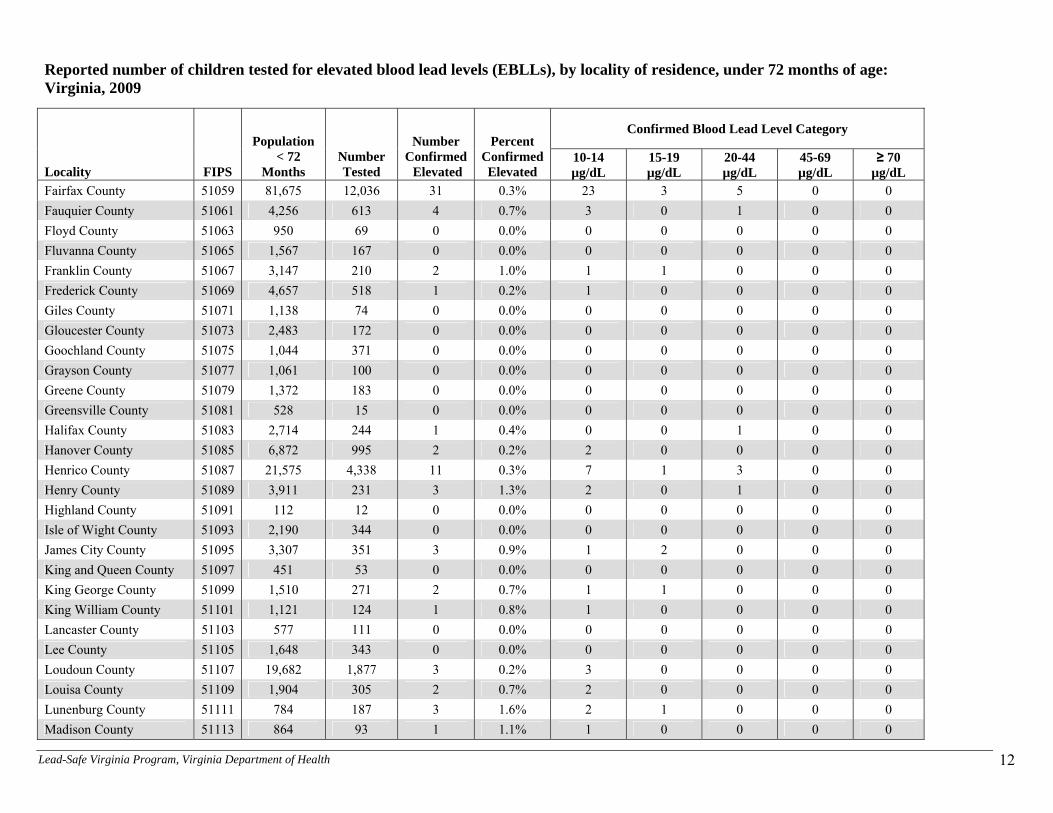
Reported number of children tested for elevated blood lead levels (EBLLs), by locality of residence, under 72 months of age: Virginia, 2009
Confirmed Blood Lead Level Category
Locality FIPS
Population < 72
Months Number Tested
Number Confirmed Elevated
Percent Confirmed Elevated
10-14 µg/dL
15-19 µg/dL
20-44 µg/dL
45-69 µg/dL
≥ 70 µg/dL
Accomack County 51001 2,792 986 7 0.7% 5 2 0 0 0 Albemarle County 51003 6,000 700 5 0.7% 4 0 1 0 0 Alleghany County 51005 905 100 1 1.0% 0 0 1 0 0 Amelia County 51007 870 131 0 0.0% 0 0 0 0 0 Amherst County 51009 2,234 291 0 0.0% 0 0 0 0 0 Appomattox County 51011 1,047 171 1 0.6% 1 0 0 0 0 Arlington County 51013 12,144 3,008 11 0.4% 10 1 0 0 0 Augusta County 51015 4,521 640 0 0.0% 0 0 0 0 0 Bath County 51017 279 44 0 0.0% 0 0 0 0 0 Bedford County 51019 4,290 342 0 0.0% 0 0 0 0 0 Bland County 51021 379 63 0 0.0% 0 0 0 0 0 Botetourt County 51023 2,107 335 0 0.0% 0 0 0 0 0 Brunswick County 51025 1,124 347 1 0.3% 1 0 0 0 0 Buchanan County 51027 1,583 249 0 0.0% 0 0 0 0 0 Buckingham County 51029 926 193 0 0.0% 0 0 0 0 0 Campbell County 51031 3,678 331 3 0.9% 1 1 1 0 0 Caroline County 51033 1,690 367 1 0.3% 1 0 0 0 0 Carroll County 51035 1,998 273 0 0.0% 0 0 0 0 0 Charles City County 51036 472 59 0 0.0% 0 0 0 0 0 Charlotte County 51037 863 178 3 1.7% 1 0 0 2 0 Chesterfield County 51041 21,322 3,618 7 0.2% 4 2 1 0 0 Clarke County 51043 835 91 2 2.2% 1 1 0 0 0 Craig County 51045 356 35 0 0.0% 0 0 0 0 0 Culpeper County 51047 2,660 1,054 2 0.2% 2 0 0 0 0 Cumberland County 51049 689 72 1 1.4% 1 0 0 0 0 Dickenson County 51051 1,038 88 0 0.0% 0 0 0 0 0 Dinwiddie County 51053 1,650 179 2 1.1% 2 0 0 0 0 Essex County 51057 635 91 0 0.0% 0 0 0 0 0
Lead-Safe Virginia Program, Virginia Department of Health 12
Reported number of children tested for elevated blood lead levels (EBLLs), by locality of residence, under 72 months of age: Virginia, 2009
Confirmed Blood Lead Level Category
Locality FIPS
Population < 72
Months Number Tested
Number Confirmed Elevated
Percent Confirmed Elevated
10-14 µg/dL
15-19 µg/dL
20-44 µg/dL
45-69 µg/dL
≥ 70 µg/dL
Fairfax County 51059 81,675 12,036 31 0.3% 23 3 5 0 0 Fauquier County 51061 4,256 613 4 0.7% 3 0 1 0 0 Floyd County 51063 950 69 0 0.0% 0 0 0 0 0 Fluvanna County 51065 1,567 167 0 0.0% 0 0 0 0 0 Franklin County 51067 3,147 210 2 1.0% 1 1 0 0 0 Frederick County 51069 4,657 518 1 0.2% 1 0 0 0 0 Giles County 51071 1,138 74 0 0.0% 0 0 0 0 0 Gloucester County 51073 2,483 172 0 0.0% 0 0 0 0 0 Goochland County 51075 1,044 371 0 0.0% 0 0 0 0 0 Grayson County 51077 1,061 100 0 0.0% 0 0 0 0 0 Greene County 51079 1,372 183 0 0.0% 0 0 0 0 0 Greensville County 51081 528 15 0 0.0% 0 0 0 0 0 Halifax County 51083 2,714 244 1 0.4% 0 0 1 0 0 Hanover County 51085 6,872 995 2 0.2% 2 0 0 0 0 Henrico County 51087 21,575 4,338 11 0.3% 7 1 3 0 0 Henry County 51089 3,911 231 3 1.3% 2 0 1 0 0 Highland County 51091 112 12 0 0.0% 0 0 0 0 0 Isle of Wight County 51093 2,190 344 0 0.0% 0 0 0 0 0 James City County 51095 3,307 351 3 0.9% 1 2 0 0 0 King and Queen County 51097 451 53 0 0.0% 0 0 0 0 0 King George County 51099 1,510 271 2 0.7% 1 1 0 0 0 King William County 51101 1,121 124 1 0.8% 1 0 0 0 0 Lancaster County 51103 577 111 0 0.0% 0 0 0 0 0 Lee County 51105 1,648 343 0 0.0% 0 0 0 0 0 Loudoun County 51107 19,682 1,877 3 0.2% 3 0 0 0 0 Louisa County 51109 1,904 305 2 0.7% 2 0 0 0 0 Lunenburg County 51111 784 187 3 1.6% 2 1 0 0 0 Madison County 51113 864 93 1 1.1% 1 0 0 0 0

Lead-Safe Virginia Program, Virginia Department of Health 13
Reported number of children tested for elevated blood lead levels (EBLLs), by locality of residence, under 72 months of age: Virginia, 2009
Confirmed Blood Lead Level Category
Locality FIPS
Population < 72
Months Number Tested
Number Confirmed Elevated
Percent Confirmed Elevated
10-14 µg/dL
15-19 µg/dL
20-44 µg/dL
45-69 µg/dL
≥ 70 µg/dL
Mathews County 51115 504 70 1 1.4% 1 0 0 0 0 Mecklenburg County 51117 2,093 527 4 0.8% 3 1 0 0 0 Middlesex County 51119 452 121 0 0.0% 0 0 0 0 0 Montgomery County 51121 4,758 181 2 1.1% 0 2 0 0 0 Nelson County 51125 927 198 2 1.0% 1 1 0 0 0 New Kent County 51127 927 152 0 0.0% 0 0 0 0 0 Northampton County 51131 867 277 3 1.1% 2 1 0 0 0 Northumberland County 51133 658 101 5 5.0% 0 0 3 2 0 Nottoway County 51135 1,057 240 9 3.8% 6 0 3 0 0 Orange County 51137 1,856 303 0 0.0% 0 0 0 0 0 Page County 51139 1,599 186 0 0.0% 0 0 0 0 0 Patrick County 51141 1,359 120 1 0.8% 1 0 0 0 0 Pittsylvania County 51143 4,194 738 0 0.0% 0 0 0 0 0 Powhatan County 51145 1,589 198 0 0.0% 0 0 0 0 0 Prince Edward County 51147 1,178 333 1 0.3% 1 0 0 0 0 Prince George County 51149 2,402 152 0 0.0% 0 0 0 0 0 Prince William County 51153 28,789 3,503 7 0.2% 6 1 0 0 0 Pulaski County 51155 2,339 357 1 0.3% 0 0 1 0 0 Rappahannock County 51157 420 105 2 1.9% 2 0 0 0 0 Richmond County 51159 430 67 2 3.0% 2 0 0 0 0 Roanoke County 51161 5,587 413 1 0.2% 0 1 0 0 0 Rockbridge County 51163 1,351 69 0 0.0% 0 0 0 0 0 Rockingham County 51165 5,163 1,185 4 0.3% 1 2 1 0 0 Russell County 51167 1,955 191 1 0.5% 1 0 0 0 0 Scott County 51169 1,487 303 1 0.3% 1 0 0 0 0 Shenandoah County 51171 2,379 259 0 0.0% 0 0 0 0 0 Smyth County 51173 2,158 465 0 0.0% 0 0 0 0 0 Southampton County 51175 1,070 153 0 0.0% 0 0 0 0 0

Lead-Safe Virginia Program, Virginia Department of Health 14
Reported number of children tested for elevated blood lead levels (EBLLs), by locality of residence, under 72 months of age: Virginia, 2009
Confirmed Blood Lead Level Category
Locality FIPS
Population < 72
Months Number Tested
Number Confirmed Elevated
Percent Confirmed Elevated
10-14 µg/dL
15-19 µg/dL
20-44 µg/dL
45-69 µg/dL
≥ 70 µg/dL
Spotsylvania County 51177 8,430 1,263 3 0.2% 2 0 1 0 0 Stafford County 51179 8,810 1,032 4 0.4% 4 0 0 0 0 Surry County 51181 477 47 0 0.0% 0 0 0 0 0 Sussex County 51183 713 185 2 1.1% 2 0 0 0 0 Tazewell County 51185 2,879 657 2 0.3% 2 0 0 0 0 Warren County 51187 2,576 212 2 0.9% 1 1 0 0 0 Washington County 51191 3,147 95 0 0.0% 0 0 0 0 0 Westmoreland County 51193 1,046 171 1 0.6% 1 0 0 0 0 Wise County 51195 2,802 338 1 0.3% 1 0 0 0 0 Wythe County 51197 1,823 420 1 0.2% 1 0 0 0 0 York County 51199 4,439 123 0 0.0% 0 0 0 0 0 Alexandria 51510 9,262 2,266 8 0.4% 6 1 1 0 0 Bedford 51515 424 144 1 0.7% 0 0 0 1 0 Bristol 51520 1,114 125 2 1.6% 0 1 1 0 0 Buena Vista 51530 461 21 0 0.0% 0 0 0 0 0 Charlottesville 51540 2,368 427 0 0.0% 0 0 0 0 0 Chesapeake 51550 17,265 1,761 6 0.3% 5 1 0 0 0 Colonial Heights 51570 1,113 275 0 0.0% 0 0 0 0 0 Covington 51580 471 193 1 0.5% 1 0 0 0 0 Danville 51590 3,502 1,350 16 1.2% 13 2 1 0 0 Emporia 51595 436 300 2 0.7% 2 0 0 0 0 Fairfax 51600 1,538 819 0 0.0% 0 0 0 0 0 Falls Church 51610 690 198 0 0.0% 0 0 0 0 0 Franklin 51620 538 174 0 0.0% 0 0 0 0 0 Fredericksburg 51630 1,332 408 1 0.2% 1 0 0 0 0 Galax 51640 525 259 1 0.4% 1 0 0 0 0 Hampton 51650 11,272 1,581 3 0.2% 2 0 0 1 0 Harrisonburg 51660 2,281 543 4 0.7% 3 1 0 0 0

Lead-Safe Virginia Program, Virginia Department of Health 15
Reported number of children tested for elevated blood lead levels (EBLLs), by locality of residence, under 72 months of age: Virginia, 2009
Confirmed Blood Lead Level Category
Locality FIPS
Population < 72
Months Number Tested
Number Confirmed Elevated
Percent Confirmed Elevated
10-14 µg/dL
15-19 µg/dL
20-44 µg/dL
45-69 µg/dL
≥ 70 µg/dL
Hopewell 51670 2,020 424 0 0.0% 0 0 0 0 0 Lexington 51678 247 49 0 0.0% 0 0 0 0 0 Lynchburg 51680 4,660 1,062 5 0.5% 3 1 0 1 0 Manassas 51683 3,636 1,327 0 0.0% 0 0 0 0 0 Manassas Park 51685 1,235 570 2 0.4% 1 1 0 0 0 Martinsville 51690 1,051 155 3 1.9% 2 1 0 0 0 Newport News 51700 17,107 2,177 13 0.6% 10 1 2 0 0 Norfolk 51710 19,719 3,806 21 0.6% 17 2 2 0 0 Norton 51720 255 54 0 0.0% 0 0 0 0 0 Petersburg 51730 2,610 880 18 2.0% 9 4 5 0 0 Poquoson 51735 738 37 0 0.0% 0 0 0 0 0 Portsmouth 51740 8,555 1,443 8 0.6% 8 0 0 0 0 Radford 51750 661 89 1 1.1% 1 0 0 0 0 Richmond 51760 14,788 5,632 78 1.4% 52 9 17 0 0 Roanoke 51770 7,453 1,440 19 1.3% 14 4 1 0 0 Salem 51775 1,479 358 0 0.0% 0 0 0 0 0 Staunton 51790 1,493 572 3 0.5% 1 1 1 0 0 Suffolk 51800 5,586 950 11 1.2% 6 4 1 0 0 Virginia Beach 51810 37,054 2,685 0 0.0% 0 0 0 0 0 Waynesboro 51820 1,546 544 6 1.1% 2 1 3 0 0 Williamsburg 51830 370 4 0 0.0% 0 0 0 0 0 Winchester 51840 1,722 437 4 0.9% 1 1 2 0 0 Unknown * 13,040 0 0.0% 0 0 0 0 0
VIRGINIA 557,454 102,532 417 0.4% 287 62 61 7 0
Note: 2000 U.S. Census Population Data were used. Results based on one test per child per year. A confirmed elevated blood lead level (EBLL) is defined as a single elevated venous test ≥ 10 μg/dL or two elevated capillary tests within 84 days/12 weeks and is only counted once in the year in which it initially occurred. The reporting of elevated blood lead levels is required under the Regulations for Disease Reporting and Control. Effective July 1, 2001, regulations require the reporting of all lead tests performed on children under 72 months of age. The number of children tested each year is influenced by several factors that include the number of children born in Virginia each year, migration of children into and out of the state or to a different locality, and the number of children tested in compliance with the regulations. ^Regulations only require testing at 1 and 2 years of age if determined to be at risk. These statistics are preliminary, as the database will accept historical data as made available and continuous data quality control may depict minor changes in data. * Unknown addresses are due to providers not submitting a child's address with the laboratory lead test request, or in some cases, the laboratory not forwarding this information as required.

Lead-Safe Virginia Program, Virginia Department of Health 16
Guidelines for Childhood Lead Poisoning Testing
ALL MEDICAID ENROLLED CHILDREN ARE REQUIRED TO BE TESTED AT 1 AND 2 YEARS OF AGE
To determine risk for other children, please use the chart below.
OTHER RISK FACTORS FOR CHILDREN Blood lead levels shall be obtained in children at ages 1 and 2 if they meet ANY one of the criteria noted in the box below. In addition, children ages 3-5 years of age who have not previously been tested, and moved to a new address in a high-risk area, or meet ANY one of the criteria in the box below shall also be tested.
1. Eligible for or receiving WIC benefits? Medicaid eligible and not tested at both 1 and 2 years of age?
2. Living in a ZIP Code determined to be high-risk based on age of housing and other factors? (See attached High –
Risk ZIP Code list)
3. Living in or regularly visiting a house or day care center built before 1950?
4. Living in or regularly visiting a house built before 1978 with peeling or chipping paint or recent (within the last 6
months), ongoing or planned renovation?
5. Living with or regularly visiting a sibling, housemate or playmate with lead poisoning?
6. Living with an adult whose job or hobby involves exposure to lead?
7. Living near an active lead smelter, battery recycling plant, or other industry likely to release lead?
8. Recent refugee, immigrant, or child adopted from outside of the U.S.
• Take careful history regarding possible lead exposure at each routine visit.
• A child must be tested if the parent or guardian requests testing due to possible exposure (12 VAC 5-120).
• Testing may be performed by venipuncture or capillary. Filter paper methods are also acceptable and often more convenient for the family if performed in the provider’s office. The use of a CLIA-waived lead testing device must be approved through the Lead-Safe Virginia Program at 804-864-7694 to assure proper quality assurance and reporting of data.
CONFIRMATION OF TESTING RESULTS
If result of capillary Testing test
(μg/dL) is:
Perform diagnostic test on venous blood within:
10-19^
Repeat blood test within 30 days to
assure lead level is not rising Before 3 months
20-44
7-30 days
(The higher the screen, the sooner the diagnostic test should be performed.)
45-59
48 hours
60-69
24 hours
≥70
Immediately as an emergency lab test
Note: Confirm elevated capillary blood lead levels ≥10 μg/dL. A ‘confirmed’ elevated blood lead level (EBLL) is defined as a single elevated venous test ≥ 10 μg/dL or two elevated capillary tests within 84 days/12 weeks A venous sample is required for environmental investigations. Virginia regulations require reporting of blood lead levels ≥10 μg/dL (using the EPI-1 form) to the Office of Epidemiology. Regulations 12 VAC 5-120 require laboratories and point of care providers using CLIA-waived devices to report all blood lead tests on children under the age of six within ten days of analysis.

Lead-Safe Virginia Program, Virginia Department of Health 17
MANAGEMENT OF CHILDREN WITH CONFIRMED
ELEVATED BLOOD LEAD LEVELS
BLOOD LEAD
LEVEL (μg/dL)
ACTION
(Case manager assures coordinated action and follow-up)
TIME FRAME
(Begin intervention)
10-14
• Provide caregiver lead education: dietary and environmental • Follow-up blood lead testing within 30 days to assure not rising • Refer for WIC and social services, if needed
Within 30 days
15-19
• Above actions, plus: • Proceed according to actions for 20-40 ug/dL if: A follow-up blood lead is 15 or above,
or the blood lead level is increasing
Within 2 weeks 20-44
• Above actions, plus: • Provide coordination of care (case management) • Provide environmental investigation and control lead hazards
Within 1 week
45-69
• Above actions
Within 48 hours 70 and above • Above actions, plus:
• Hospitalize child and begin medical treatment (chelation therapy as appropriate) immediately.
• Contact Emergency Lead Healthcare line below.
Within 24 hours
Current CDC management recommendations adapted from Managing Elevated Blood Lead Levels Among Young Children: Recommendations from the Advisory Committee on Childhood Lead Poisoning Prevention. (CDC, 2002). * Investigations may be required where babies or multiple children in a household have elevated blood lead levels. Follow –up care is described in more detail in the VDH “Care Coordination Manual: Children with Lead Poisoning in Virginia”.
Emergency Lead Healthcare Information Line
TOLL FREE EMERGENCY (866) 767-5323
(866) SOS-LEAD
Note: For questions related to your local area, refer to your local health department. Local health policy and lead ordinances may have additional requirements. Richmond City has a lead ordinance that requires an investigation at 10 ug/dL.
Developed by the Virginia Department of Health Lead Elimination Plan Medical Committee, following CDC Guidelines and Virginia Regulations. Funded by the Centers for Disease Control and Prevention EH06-60204CONT and the Virginia Department of Health. Revised May 2009.

Lead-Safe Virginia Program, Virginia Department of Health 18

22002 22709 22969 23301 23701 23964 24270 2444222046 22713 22971 23302 23702 23968 24272 2444522134 22716 22972 23308 23704 23970 24273 2445022201 22718 22980 23310 23707 23974 24277 2445822203 22719 23009 23315 23803 24011 24282 2445922204 22726 23021 23324 23821 24013 24283 2446022205 22727 23022 23336 23824 24014 24285 2446422206 22729 23023 23350 23827 24015 24289 2446522207 22732 23024 23354 23828 24016 24292 2446722211 22734 23025 23356 23829 24066 24293 2446822301 22736 23027 23357 23830 24072 24301 2447122302 22740 23038 23359 23837 24085 24312 2447222305 22746 23045 23395 23839 24086 24315 2447322307 22747 23047 23399 23840 24089 24316 2447622314 22749 23066 23404 23842 24090 24318 2447922401 22810 23069 23405 23844 24091 24319 2448322427 22811 23079 23407 23846 24093 24322 2448422435 22812 23083 23409 23847 24094 24323 2448522448 22815 23084 23410 23850 24105 24325 2448622454 22820 23108 23413 23851 24112 24326 2448722473 22821 23109 23417 23866 24124 24330 2450122480 22824 23110 23418 23867 24127 24333 2450322488 22832 23125 23420 23868 24128 24340 2450422503 22834 23130 23421 23872 24131 24343 2452622504 22835 23139 23426 23874 24134 24347 2453122509 22841 23149 23432 23881 24138 24350 2453422514 22842 23153 23434 23888 24139 24352 2453922539 22843 23156 23440 23890 24141 24366 2454022560 22844 23176 23442 23894 24147 24368 2454122579 22846 23177 23503 23901 24149 24370 2455322601 22847 23180 23504 23915 24150 24375 2455522611 22849 23181 23505 23920 24185 24378 2457722620 22851 23185 23507 23922 24201 24380 2457822639 22853 23219 23508 23923 24216 24382 2459022642 22901 23220 23509 23924 24219 24401 2459222643 22903 23221 23510 23930 24221 24413 2459422644 22931 23222 23511 23934 24226 24416 2459822645 22935 23223 23517 23936 24230 24422 2460222649 22937 23224 23521 23937 24236 24426 2460522650 22938 23225 23523 23938 24237 24430 2461322654 22939 23226 23604 23942 24245 24432 2462222657 22943 23227 23607 23944 24250 24433 2463922660 22947 23229 23651 23952 24251 24435 2464922663 22959 23230 23661 23958 24258 24437 2465122664 22964 23231 23665 23962 24265 24439
Virginia High-Risk Zip Codes*
* Areas with these ZIP Codes have >27% of housing built before 1950 and/or an increased prevalence of children with elevated blood lead levels per available data. ZIP Codes are from the 2000 U.S. Census. View http://www.vahealth.org/leadsafe for updates and information on childhood lead poisoning in Virginia and access to publications available to medical professionals, parents and others. Toll free phone (877) 668-7987.
Virginia Department of Health, Revised June 2003
Lead-Safe Virginia Program, Virginia Department of Health 19

LEAD-SAFE VIRGINIA PROGRAM Childhood Lead Poisoning Prevention Program
Director: Nancy Van Voorhis, M.P.H.
For more information and statistics, please visit our Web site at www.vahealth.org/leadsafe Comments on this report should be directed to the Lead-Safe Virginia Program Director
Phone (804) 864-7694 Email [email protected] or FAX (804) 864-7723
Supported by funding from Grant No. EH06-602CONT09 from the Centers for Disease Control and Prevention (CDC). Contents are solely
the responsibility of the authors and Lead-Safe Virginia, and do not necessarily represent official views of CDC.