safe coast virginia - chesapeake climate action...
TRANSCRIPT

S A F E COASTVIRGINIA
Climate Change Threats and Practical Solutions
for Coastal Virginia
AUTHORS
ACKNOWLEDGEMENTSThe Chesapeake Climate Action Network gratefully acknowledges Laura Burt, Andrea Useem, and Heidi Thaens for their meticulous copy editing skills and assistance finalizing this report. The authors bear responsibility for any factual errors. The recommendations of this report are those of the Chesapeake Climate Action Network. The views expressed here are those of the authors and do not necessarily reflect the views of our funders or those who provided review.
The Chesapeake Climate Action Network (CCAN) is a 501(c)(3) non-profit organization. CCAN is dedicated exclusively to fighting global warming in Virginia, Maryland, and Washington, D.C. Our mission is to build and mobilize a powerful grassroots movement in this unique region that surrounds our nation’s capital to call for state, national and international policies that will put us on a path to climate stability. For more information about the Chesapeake Climate Action Network and our Virginia Safe Coast campaign, please visit www.chesapeakeclimate.org.
© 2014 Chesapeake Climate Action Network
Photo Credits: Left cover: © Aerophoto America All Rights Reserved; Right cover: Teun van den/Shutterstock.com; Pg. 7: U.S. National Park Service; Pg. 8, 9, 11, 27: Lin Burton; Pg. 12, 20: U.S. Navy; Pg. 13: duckeesue/Shutterstock.com; Pg. 15, 16, 46, 47: U.S. Air Force; Pg. 19, 33, 40, 42, 44: CCAN; Pg. 25: Sandia National Laboratories; Pg. 28: U.S. Department of Defense; Pg. 29: Rens Jacobs/ Rijkswaterstaat; Pg. 30: NASA; Pg. 31: CC Danish Wind Industry Association via flickr; Pg. 32: U.S. Department of Energy; pg. 34: Brookhaven National Laboratory; pg. 36-37: Teun van den/Shutterstock.com; Pg. 38: istockphoto.com; Pg. 39: Leah Kat/Shutterstock.com; Pg. 43: CC baldeaglebluff via flickr; Pg. 48: Darryl Brooks/Shutterstock.com; Pg. 49, 50: Federal Emergency Management Agency; Pg. 51: National Oceanic and Atmospheric Administration
Layout: Susan Yin syinq.prosite.com
James McGarry is the Chief Policy Analyst at the Chesapeake Climate Action Network. He is the co-author of several studies about Maryland’s energy sector, and he has written extensively about climate change and clean energy issues in online and in-print publications.
Bill Kovarik is a professor at Radford University’s School of Communications in Radford, VA. His research interests include media history and environmental history. He has extensive experience with wire services and daily newspapers, and has written several books about the media, including Mass Media and Environmental Conflict (1996), Web Design for Mass Media (2001), and Revolutions in Communication (2011).
Rae Tyson is a journalist/media relations professional with over 30 years of reporting, editing, teaching, and public affairs experience. He worked as the environmental editor and reporter during the formative years of USA Today and, prior to that, was a reporter at the Niagara Gazette. He is the founding vice-president of the Society of Environmental Journalists and was a Pulitzer Prize finalist for his coverage of the Love Canal disaster in Niagara Falls, NY.

TABLE OF CONTENTSEXECUTIVE SUMMARY
Climate Change Threats and Practical Solutions for Coastal Virginia
Saving Virginia’s Coast While Combating Climate Change
Policy Recommendations
STORIES FROM THE FIELD:Climate Change Impacts from the Front Lines of Tidewater Virginia
Hampton Roads as Ground Zero
A Church in Norfolk
A New Home in the Hague
Worried for the Future: Business Owners and Girl Scouts
Tourism and the Rising Tide
Planning in an “Increasingly Dangerous Landscape”
Chesapeake Bay’s Changing Shoreline and Chemistry
High Tide at the Naval Base
PROTECT AND PREVENT:Saving Virginia’s Coasts While Combating Climate Change
Adapting to the New Reality
COMBATING CLIMATE CHANGE AT THE SOURCE:Greenhouse Gas Reduction Strategies
Sources of Greenhouse Gas Emissions in Virginia
Virginia Clean Energy Resource Potential
Energy Efficiency
Offshore Wind
Land-Based Wind
Solar Energy
Jobs in the Renewable Energy Sector
VIRGINIA SAFE COAST POLICY RECOMMENDATIONS:A 10-Point Plan for Protecting Our Coast and Promoting Solutions to Climate Change
Introduction
Mitigation
Adaptation
CONCLUSIONEndnotes
Abbreviations List
. . . . . . . . . . . . . . . . . . . . . . . . . . . . . . . . . . . . . . . . . . . . . 1
. . . . . . . . . . . . . . . . . . . 2
. . . . . . . . . . . . . . . . . . . . . . . . 3
. . . . . . . . . . . . . . . . . . . . . . . . . . . . . . . . . . . . . . . . . . . 4
. . . . . . . . . . . . . . . . . . . . . . . . . . . . . . . . . . . . . . . . . 5
. . . . . . . . . . . . . . . . . . . . . . . . . . . . . . . . . . . . . . . 6
. . . . . . . . . . . . . . . . . . . . . . . . . . . . . . . . . . . . . . . . . . . . . . . 8
. . . . . . . . . . . . . . . . . . . . . . . . . . . . . . . . . . . . . . . . . . . 9
. . . . . . . . . . . . . . . . . . . . . . . . . 9
. . . . . . . . . . . . . . . . . . . . . . . . . . . . . . . . . . . . . . . . . . 11
. . . . . . . . . . . . . . . . . . . . . . . . . . . . 12
. . . . . . . . . . . . . . . . . . . . . . . . . . 13
. . . . . . . . . . . . . . . . . . . . . . . . . . . . . . . . . . . . . . . . . . 15
. . . . . . . . . . . . . . . . . . . . . . . . . . . . . . . . . . . . . . . . . . . 17
. . . . . . . . . . . . . . . . . . . . . . . . . . . . . . . . . . . . . . . . . . 18
. . . . . . . . . . . . . . . . . . . . . . . . . 21
. . . . . . . . . . . . . . . . . . . . . . . . . . . . . 22
. . . . . . . . . . . . . . . . . . . . . . . . . . . . . . . . . . 23
. . . . . . . . . . . . . . . . . . . . . . . . . . . . . . . . . . . . . . . . . . . . . 23
. . . . . . . . . . . . . . . . . . . . . . . . . . . . . . . . . . . . . . . . . . . . . . . 25
. . . . . . . . . . . . . . . . . . . . . . . . . . . . . . . . . . . . . . . . . . . . . 27
. . . . . . . . . . . . . . . . . . . . . . . . . . . . . . . . . . . . . . . . . . . . . . . . 29
. . . . . . . . . . . . . . . . . . . . . . . . . . . . . . . . . . . . . 31
. . . . . . . . . . . . . . . . . . . . 33
. . . . . . . . . . . . . . . . . . . . . . . . . . . . . . . . . . . . . . . . . . . . . . . . . . . 34
. . . . . . . . . . . . . . . . . . . . . . . . . . . . . . . . . . . . . . . . . . . . . . . . . . . . 37
. . . . . . . . . . . . . . . . . . . . . . . . . . . . . . . . . . . . . . . . . . . . . . . . . . . . 43
. . . . . . . . . . . . . . . . . . . . . . . . . . . . . . . . . . . . . . . . . . . . . . . . . . . 51
. . . . . . . . . . . . . . . . . . . . . . . . . . . . . . . . . . . . . . . . . . . . . . . . . . . . . . . . 52
. . . . . . . . . . . . . . . . . . . . . . . . . . . . . . . . . . . . . . . . . . . . . . . . . . . 57

© Aerophoto America All Rights Reserved

EXECUTIVES U M M A RY

EXECUTIVE SUMMARYClimate Change Threats and Practical Solutions for Coastal Virginia“The water is coming.”
That’s the alarm being sounded by Norfolk Mayor Paul Fraim. His community is one of many on Virginia’s coast that is facing the terrifying challenge of sea level rise — a clear and present danger today.
The East Coast of the United States is threatened by an Atlantic Ocean that is rising three to four times faster than the global average, and it is rising particularly fast in coastal Virginia. A perfect storm of melting polar ice, increasing ocean temperatures, and a change in the behavior of the Gulf Stream—all due to global warming—is being exacerbated by the draining of aquifers, the settling of construction fill, and the natural subsiding of the sediment that underlies much of Virginia’s coastal area. By the year 2100, sea level rise in Virginia is projected to be as much as 7 feet or more, substantially higher than global projections. That places much of Tidewater Virginia second only to New Orleans and Louisiana’s Gulf Coast as the largest population center at greatest risk of flooding and largely disappearing.
The most densely populated area of the Commonwealth, home to the world’s largest concentration of military facilities, is now Ground Zero for climate change in Virginia.
It has already begun. Rising tides are hitting Norfolk and other Tidewater municipalities now. Many streets regularly flood during lunar high tides—to say nothing of actual storm and rain events, which have become increasingly intense. This low-lying area, where the highest elevations are a mere 15 feet above sea level, could soon be devastated by a Category One hurricane, with its typical 4 to 6 feet of storm surge on top of the rising sea-level and another few feet of high tide on top of that. It is little wonder that policyholders’ flood insurance premiums are rising as well.
What follows is the first report of its kind for coastal Virginia. Unlike many white papers on climate change and public policy, Safe Coast Virginia is not a mere litany of frightening forecasts and statistics aimed solely at policymakers and experts. Instead, it explores the most current science and tells the stories of real people who are already experiencing rising seas. The report’s authors conducted extensive fieldwork to document how our changing climate and weather are impacting Tidewater life. The authors interviewed a wide range of Virginians: ordinary residents, small-business owners, community activists, city planners, elected officials, academic experts, clean energy leaders, and a former commander of Naval Station Norfolk. The result is a guide that can be useful to average citizens as well as policymakers and experts.
Most importantly, Safe Coast Virginia lays out 10 important solutions that are within the reach of Virginia’s citizens and policymakers right now. These solutions can make Virginia a leader in reducing (“mitigating”) the actual source of climate change and sea level rise: greenhouse gas emissions. With its vast untapped stores of clean energy, coastal Virginia is Ground Zero for the solutions to climate change, and the Commonwealth could easily make itself a global market leader in the growing clean technology sector. Finally, this report also offers realistic and necessary approaches to adapt and protect Virginia’s coastal communities from the threats of rising tides and extreme weather that can no longer be mitigated.
Safe Coast Virginia highlights the frightening range of ways in which rising sea levels threaten the Tidewater/Hampton Roads region. Among the most worrisome are:
• Threats to coastal communities: According the Hampton Roads Planning District Commission: “Climate change will likely result in several significant adverse impacts on Hampton Roads including inundation and flooding of both developed and natural areas due to sea level rise, increased impacts from severe weather
EXECUTIVE SUMMARY 2
Virginia Beach Regional Storm Surge RiskSource: CoreLogic, 2013

events and associated storm surge, and ecological damage to coastal and marine ecosystems due to temperature increase and loss of wetlands habitat. Many of these impacts are already occurring, and they will continue to increase over the next century.”1
• Threats to tourism assets: Tourism and travel to the Virginia Beach area was valued at $1.3 billion and supported 12,000 jobs in 2012, according to a study for the Virginia Tourism Authority.2 Rising seas and stronger coastal storms threaten to inundate historical tourist destinations like Jamestown Island and portions of Yorktown Battlefield and to reduce the size of ocean beaches on Chincoteague Island to 20 or even a mere 5 percent of their current size if steps are not taken to address climate change.3
• Threats to Virginia fisheries: The federal Chesapeake Bay Watershed Blue Ribbon Finance Panel observed that the economic value of the Chesapeake Bay may be over $1 trillion annually.4 Average temperatures of surface waters in the Bay have already increased by 1.4–2.0° F (0.8–1.1° C) in the last 60 years. Virginia scientists warn that climate change is likely to exacerbate the ongoing transformation of the Bay, resulting in “simpler, less diverse ecosystems” that are “less stable and often less valuable, hospitable, and desirable for humans as food and material resources, as well as places to live and for recreation.”5
• Threats to military assets and readiness: Department of Defense (DoD) military facilities are absolutely vital to the Hampton Roads region. Defense-related activities and spending account for 41 percent of the region’s economy, generates approximately $35.2 billion in gross regional product annually, and supports about 393,000 jobs.6 In its 2013 assessment of the impact of climate change on military installations, including Naval Station Norfolk and Langley Air Force base, DoD said: “Climate change will have serious implications for the ability of the Department of Defense to maintain its natural and built infrastructure and to ensure military readiness.”7 To underscore Virginia’s military vulnerability, a 2013 joint federal study by the Strategic Environmental Research and Development Program within DoD warned of “a more significant challenge for [Naval Station Norfolk] than will be experienced at most other installations in the face of climate change.”8
• Rising insurance premiums: Munich Re, one of the world’s largest reinsurance companies, says that weather risks associated with climate change are increasing faster in North America than anywhere else in the world. “When global warming combines with
natural weather cycles such as the El Niño/La Niña phenomena, the risk of severe weather is intensified and these factors will result in even larger lost costs from natural peril events than what we have seen so far.”9 Virginians are already seeing this risk reflected in higher insurance premiums. Some 20,000 Virginia homeowners—including 2,200 homeowners in Norfolk alone—are about to see their flood insurance rates under the National Flood Insurance Program (NFIP) increase by up to 25 percent annually. This increase was authorized by Congress in 2012 to more accurately reflect increased coastal risk, which had previously driven the NFIP into $24 billion of debt.
Saving Virginia’s CoastWhile Combating Climate Change When it comes to developing effective climate change policy, delay is no longer an option. The Intergovernmental Panel on Climate Change tells us that in order to keep global temperatures from rising 3.6° F (2.0° C) relative to pre-industrial levels, global greenhouse gas emissions will have to fall between 40 to 70 percent by 2050.10 According to Maria van der Hoeven, executive director of the International Energy Agency, “the world’s energy system is being pushed to the breaking point. Our addiction to fossil fuels grows stronger each year. Many clean energy technologies are available, but they are not being deployed quickly enough to avert potentially disastrous consequences.”11
Just last September, as a preliminary step toward addressing this challenge and under the authority of the Clean Air Act, the U.S. Environmental Protection Agency (EPA) issued a proposal to regulate CO2 emissions from new power plants, noting the need to “combat climate change and improve public health.” The proposed pollution limits, which are 51 percent lower than the average emissions rate for U.S. coal-fired power, make it very unlikely that new coal-fired power plants will be built unless significant and unlikely investments are made in carbon capture technology .12
Adding momentum, in June 2014 the EPA issued proposed rules for existing power plants to reduce their carbon pollution nationwide by 25 percent below 2005 levels by 2020 and 30 percent below 2005 levels by 2030.13 As states begin to explore how these new rules will impact their energy sector, it is now clear that Virginia—along with every other state in the nation—will have to figure out a way to reduce its greenhouse gas output in a fair, efficient, and cost-effective way.
EXECUTIVE SUMMARY 3

Mitigation1. Regulate greenhouse gases: The Commonwealth of
Virginia should participate in the Regional Greenhouse Gas Initiative (RGGI). This initiative currently caps CO2 from power plants in nine states from Maine to Maryland. Virginia should participate in RGGI or drive the development of a similar regional collaboration among other southeastern states. This would help the Commonwealth to comply with new federal CO2 regulations through a flexible, market-based system that could also generate new and significant funds—as much as $209 million per year—for coastal adaptation measures.
2. Enact a mandatory energy eff iciency resource standard: The Commonwealth should capture Virginia’s untapped energy efficiency potential and reap the associated environmental and jobs benefits by setting ambitious, mandatory energy reduction goals for the Commonwealth.
3. Enact a mandatory clean electricity standard with a cap on old facilities: The Commonwealth should make Virginia’s clean electricity standard more ambitious and legally binding while placing reasonable limits on the eligibility of decades-old energy facilities like those involving hydropower and biomass.
4. Encourage signif icant development of solar power: The Commonwealth should set a mandatory “solar carve-out” goal for Virginia and clear the regulatory hurdles that stymie solar development.
5. Encourage signif icant development of offshore wind: Virginia’s elected leaders should call on Congress to immediately pass the federal investment tax credit and enact a state policy framework to make the Commonwealth a more attractive place in which to invest in offshore wind.
Adaptation6. Provide dedicated state funding for adaptation efforts
in Virginia’s Tidewater region: After participating in the Regional Greenhouse Gas Initiative (RGGI) or forming a similar group with neighboring states, Virginia should dedicate much of the CO2 allowance-auction revenue to climate adaptation efforts in the Tidewater region. This move could raise as much as $209 million per year while diversifying Virginia’s stream of adaptation revenue to include more state-based, non-federal dollars.
7. Form an integrated task force focused on protecting military assets: The Commonwealth should gather experts to coordinate adaptation planning between military leaders and Virginia’s “joint subcommittee on recurrent flooding.”
8. Improve emergency planning in Hampton Roads for climate-related disasters: The efforts between state and local planning officials should be coordinated to improve evacuation and emergency shelter management efforts.
9. Protect communities through “living shoreline” adaptation measures: Localities should work closely with state agencies to develop comprehensive, site-specific living shoreline plans.
10. Develop local accommodation strategies along with state and local partnerships to evaluate “strategic retreat” from vulnerable areas: A set of actions to preserve the continued use of coastal lands should be developed. It is also important to evaluate the necessity and logistics of moving people, ecosystems, and development away from areas forecasted to be permanently affected by climate change in the next century.
EXECUTIVE SUMMARY 4
Virginia Safe Coast Executive Summary: Policy RecommendationsBelow is a set of 10 recommendations for how Virginia can cut greenhouse gas emissions, better protect its vulnerable coastal communities, and position itself as a global market leader in the growing clean-technology sector. The Commonwealth should move quickly to adopt some or all of these recommendations and set strong policies into law to ensure their implementation.
This creates a leadership opportunity for newly-elected Governor Terry McAuliffe. As the federal government begins to require that each state reduce its carbon emissions, he presides over one of the states that is most vulnerable to the damaging consequences of climate
change. In 2008, former Governor Tim Kaine created a commission to issue climate change recommendations for the Commonwealth. Governor McAuliffe has said that his administration will revisit those recommendations.

STORIES FROM THE FIELD Climate Change Impacts from the Front
Lines of Tidewater Virginia
© Aerophoto America All Rights Reserved
Hampton Roads as Ground ZeroHigh tide in Norfolk: Time to move the car.
That’s how Bob Parsons and his wife, Carole, who live in the Willoughby Spit neighborhood of Norfolk, are coping with the first signs of climate change in Virginia’s vulnerable Hampton Roads region.
“When we are expecting high tide conditions, we relocate our cars to the city garage downtown,” said Bob Parsons. Willoughby Spit officials waive parking garage fees for the Parsons and hundreds of other residents so they can get their cars out of the way of the rising water. The Parsons know to take the threat seriously: the couple has already lost one car to flooding 14
“ We now regularly experience flooding during lunar high-tide cycles, which was unheard of just a few years ago. The problem is real, well-documented, and we have to deal with it. ” Other Norfolk neighborhoods are facing similar problems. Ghent resident Peggy Beardsley, an artist, struggles to drive home when rain floods the streets. In the Hague district, an entire church community is wondering when the church will have to relocate, and the church’s education director, Brian Brennan, isn’t sure what to tell them.
As residents of Virginia’s second most populous city fight the rising waters, the city’s planners, engineers, and public officials are starting to raise the alarm about the expected impact of climate change on their coastal homes. Perhaps the most outspoken among them is the popular mayor of Norfolk, Paul Fraim.
“The water,” he often says with a dramatic pause, “is coming.”
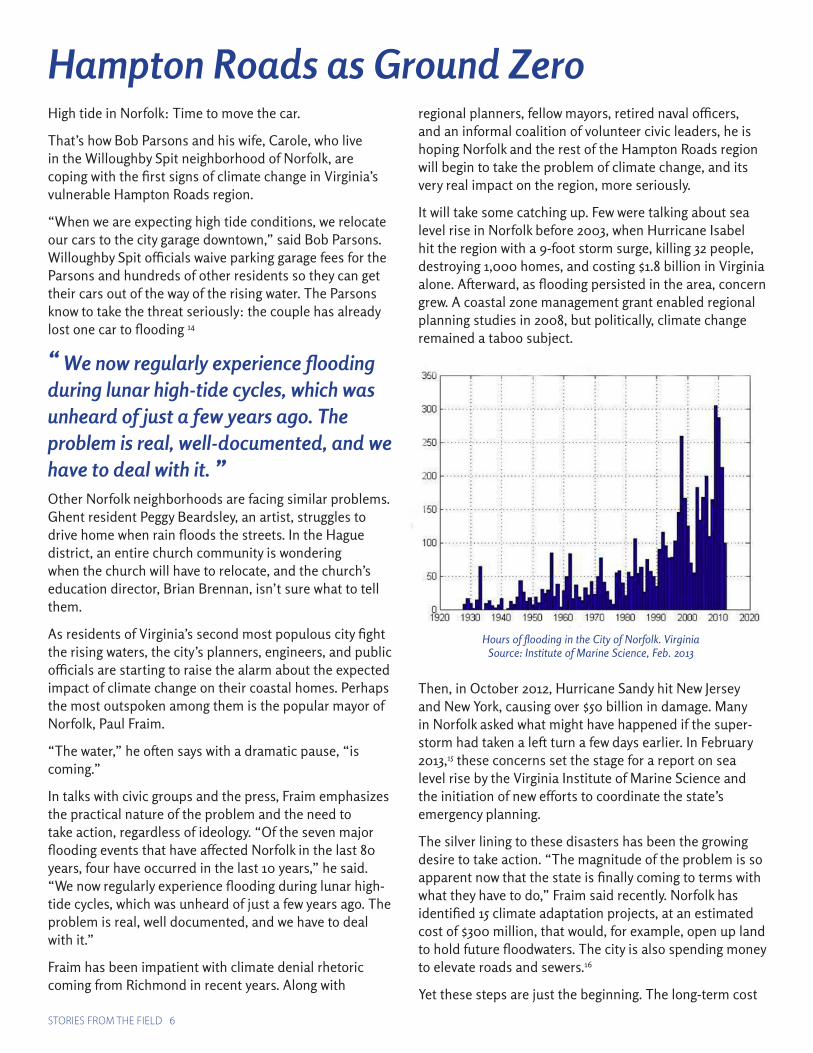
In talks with civic groups and the press, Fraim emphasizes the practical nature of the problem and the need to take action, regardless of ideology. “Of the seven major flooding events that have affected Norfolk in the last 80 years, four have occurred in the last 10 years,” he said. “We now regularly experience flooding during lunar high-tide cycles, which was unheard of just a few years ago. The problem is real, well documented, and we have to deal with it.”
Fraim has been impatient with climate denial rhetoric coming from Richmond in recent years. Along with
regional planners, fellow mayors, retired naval officers, and an informal coalition of volunteer civic leaders, he is hoping Norfolk and the rest of the Hampton Roads region will begin to take the problem of climate change, and its very real impact on the region, more seriously.
It will take some catching up. Few were talking about sea level rise in Norfolk before 2003, when Hurricane Isabel hit the region with a 9-foot storm surge, killing 32 people, destroying 1,000 homes, and costing $1.8 billion in Virginia alone. Afterward, as flooding persisted in the area, concern grew. A coastal zone management grant enabled regional planning studies in 2008, but politically, climate change remained a taboo subject.
Then, in October 2012, Hurricane Sandy hit New Jersey and New York, causing over $50 billion in damage. Many in Norfolk asked what might have happened if the super-storm had taken a left turn a few days earlier. In February 2013,15 these concerns set the stage for a report on sea level rise by the Virginia Institute of Marine Science and the initiation of new efforts to coordinate the state’s emergency planning.
The silver lining to these disasters has been the growing desire to take action. “The magnitude of the problem is so apparent now that the state is finally coming to terms with what they have to do,” Fraim said recently. Norfolk has identified 15 climate adaptation projects, at an estimated cost of $300 million, that would, for example, open up land to hold future floodwaters. The city is also spending money to elevate roads and sewers.16
Yet these steps are just the beginning. The long-term cost
STORIES FROM THE FIELD 6
Hours of flooding in the City of Norfolk. VirginiaSource: Institute of Marine Science, Feb. 2013

of adapting to rising sea levels and more extreme weather is estimated to be a cool billion dollars for Norfolk alone, Fraim and other Norfolk officials have said. And that figure doesn’t include the cost of building the type of tidal barrage systems used today in Britain and the Netherlands or the sort of levees built in Louisiana. It’s not certain that those big engineering systems would work in the Tidewater region or deliver optimal value. If the state did decide to try them, however, the costs of climate adaptation and coastal protection would climb even higher.
What is certain is that the average sea level has already risen by 14-and-a-half inches over the past century, according to the National Oceanic and Atmospheric Administration, which has taken readings since 1927 with instruments housed in a prosaic white shed on Pier 10 at the northern tip of Norfolk Naval Base. Global sea levels, by contrast, have risen by about 8 inches since 1870.17 The sea level will almost certainly keep rising, possibly by as much as 7.5 feet along Virginia’s coasts by 2100, according to the 2013 Virginia Institute of Marine Sciences study, which was commissioned by the Virginia General Assembly.15
Given these facts, there are hard choices ahead. In 2012,
Fraim told a PBS interviewer that Norfolk is “retreating very slowly from the shoreline.”18 His remarks proved controversial, in part because the Commonwealth has no plan or criteria for sorting out whose property might be abandoned in the process.
One group that will not retreat, however, is the Navy. No other harbor is available for the world’s largest naval base, according to Joseph Bouchard, the former commander of the Norfolk base. Yet specific studies about the dangerous impacts of sea level rise on the Navy base have only just begun, according to Kelly Burks-Copes of the Corps of Engineers.
Climate scientists around the world agree that the rapid increase in the rate of sea level rise, which started in the late 20th century, is due primarily to human-induced climate change resulting from fossil fuel combustion and land-use changes. Despite the scientific consensus around these facts, some in Virginia and around the country continue to debate the existence of climate change. Yet many in Tidewater Virginia are starting to recognize that political arguments can’t change the reality of the global phenomena now lapping ominously at their doorsteps.
STORIES FROM THE FIELD 7
Climate Change: A PrimerAccording to the latest figures, global land and ocean temperatures increased about 1.4° F (0.8° C) between1901 and 2010. It is estimated that more than half of that change, 0.9 °F (0.5° C), occurred between 1979 and 2010.1 This global warming is caused by changes in the earth’s atmosphere as more and more heat from sunlight is absorbed by the earth rather than reflected back into space. While the “greenhouse effect” in the atmosphere is essential for life on earth – without trapping some heat, the planet would freeze – increases in greenhouse gas concentrations have increased the effect to potentially dangerous levels, resulting in direct impacts on the climate and human welfare.
Since the industrial revolution, atmospheric concentrations of carbon dioxide (CO2), methane (CH4) and nitrous oxide (N2O) – greenhouse gases emitted during fossil fuel combustion – increased 140 percent, 259 percent, and 120 percent respectively.2 The U.S. National Oceanic and Atmospheric Administration has said the amount of excess heat prevented from escaping into outer space was 32 percent higher in 2012 than it was in 1990, owing primarily to record CO2 concentrations in the atmosphere.3

A Church in NorfolkAs Brian Brennan stood on the front steps of the Unitarian Church in downtown Norfolk to greet visitors, he looked out over a canal that leads to the Elizabeth River. A tall Philadelphia native with a neat beard, broad smile and steady gaze, he said wistfully: “You have to admit, it’s beautiful here.”
Brennan pointed out the nearby landmarks around him. “There’s the Chrysler Museum,” he said, sweeping his arm right toward the imposing arches of Norfolk’s treasure trove of art. “And there’s the Hague,” he said, gesturing to the beautifully wooded neighborhood of stately brick homes just across the old canal. Then he hiked up his khakis and knelt on one knee to look at the grass in front of the church.
“And here is our new shoreline,” he said, pointing to a line that cuts across the church’s front lawn: The grass is green on one side and brown on the other, where the brackish river water has killed the grass down to its roots. “Seashells get washed in regularly,” he added.
Water lapping on the lawn and covering the road in front of the church is a routine sight now, Brennan said, but the tides and storms create even more hazardous conditions for the congregation. Three years ago, right before Christmas, the basement of the church flooded. “We were a month without heat,” he said. The church has a new boiler now, but Brennan said another flood will destroy it, too. “It’s only a matter of time.”
Meanwhile, the church bulletin now includes a tide schedule, so parishioners can know when to expect to wade to church. They even like to joke about it, Brennan
said. “They’ll say, ‘We should have come in a canoe today,’ or ‘We should get a raft to pick everyone up.’” He hesitated a minute, then said, “That’s a nice joke, but realistically speaking, we’re not in a tenable position. We’re not going to be able to stay here. This building, as much as we love it, won’t be usable.”
Nor, he said, will the other buildings in the Hague, when the sea level rises an expected 2 feet in the next few decades. “No one who built a row house 30 or 40 years ago anticipated routine flooding,” Brennan said. “And 30 or 40 years from now, this environment will have changed to the point where roads frequently become impassable.”
STORIES FROM THE FIELD 8
When fossil fuels like gasoline and coal are burned to produce energy, carbon dioxide is released. These emissions are the primary source of the increase in greenhouse gases in the atmosphere. The quantity of energy-related CO2 emissions continues to be high in America. Some U.S. emission reductions in recent years can be attributed to power plant conversions away from coal-fired electricity in favor of renewable energy. The increased use of natural gas derived from the drilling process known as hydraulic fracturing – or “fracking” – has become controversial in the meantime. A growing number of studies show that the leakage of methane gas linked to this process could make fracked gas as bad for the global climate as coal combustion.
Worldwide emissions, however, are still increasing, as countries like China and India become more industrialized. Even with domestic reductions, the U.S. remains a major contributor to the emissions responsible for a warming climate. A recent analysis by the Tyndall Centre’s Global Carbon Project at the University of East Anglia showed that China, the U.S., the European Union and India were responsible for 58 percent of the world’s CO2 emissions in 2012.4
Scientists warn that the next 20 years will be critical to avoid the most severe consequences of global warming. The federal government’s recently-released Third U.S. National Climate Assessment found that absent significant emissions reductions, average temperatures across the U.S. will increase by 2°F to 4°F (1.1°C to 2.2°C) within decades, and up to 10°F (5.6°C) by century’s end. The report concludes that “climate change is affecting the American people now, and that choices we make will affect our future and that of future generations.”5

Across the canal and around the corner, an unusual residential house is under construction. Unlike the others in the neighborhood, whose first floors are only a few feet above high-tide mark, the house at 532 Mowbray Arch is being built 7 ½ feet above the tide line.
“ The reality is that streets I rode my bike on as a kid [now] flood a lot more often.” While this home design may show forward thinking about sea level realities in Norfolk, the owners had to fight “archaic” legal restrictions before beginning construction. For example, the building height for the neighborhood can’t exceed 35 feet. It’s a “one-size-fits-all” restriction, one of the owners said. “We figured 7.5 feet was the best we could do and still have three stories,” he said.
The architects working on the new Mowbry Arch house, Thom White and Mel Price, owners of the Norfolk-based firm Work Program Architects, said they have enjoyed the challenge of raising not only the floors but also the air ducts and electrical lines far above the tide lines. But it hasn’t been as easy as it should be. The city’s planning and building staff were cooperative, said the owners and architects, but it was clear that the city was just beginning to think through the implications of rising sea levels.
Norfolk has proposed a new building regulation, which is up for adoption this November. Rather than requiring 1
foot of clearance above the ground, the regulation would require 3 feet of clearance in flood hazard areas. The regulation would apply to ductwork and any electrical work that isn’t flood-proofed, said Lenny Newcomb, the City of Norfolk’s zoning administrator.
The proposed regulations are just the beginning of what needs to happen next, Norfolk builder Steve Lawson said of the city’s efforts to address climate change. At a public round table discussion in September, 2013, he said “I don’t think this is a discussion about science anymore. The reality is that streets I rode my bike on as a kid [now] flood a lot more often.”
A New Home in the Hague
Bob and Carole Parsons of Norfolk’s Willoughby Spit neighborhood are among many Tidewater residents who have felt the impact of sea level rise in their own home, which has been flooded three times since 2009.
Some of the impacts require shifts in daily routine. Along with often having to move their car at high tide, the Parsons also have to clean out their first floor more regularly owing to water intrusion, and they take care to step around the jellyfish that regularly wash up on their driveway.
Other changes are more threatening. “We have experienced deep water on our property seven times since 1998,” Bob said. The couple also worries about storm-related traffic spilling over from the Norfolk-Hampton
tunnel, which is a few hundred yards from their house. “Evacuation during a serious storm threat is a huge problem,” Bob said. “Congestion through the tunnels in the area is bad enough even when the weather is good.”
Not far away, Norfolk homeowners Scott and Ruth Amundsen live in a Lakewood home that sports a large array of solar photovoltaic panels. “The whole climate change issue started really hitting home to me, and it felt like there was no excuse for not doing everything we could,” explained Ruth, whose school-aged sons feel like they are seeing a science experiment right out the front door.
Like others in the city, the Amundsens have noticed that flooding in Norfolk has become more common. “It’s like
Worried for the Future:Business Owners and Girl Scouts
STORIES FROM THE FIELD 9

Lower Land and Higher Tides: Virginia’s Disproportionate VulnerabilitySea level rise impacts Virginia’s tidal regions disproportionately for two reasons. First, in a process unrelated to climate change, the land along the Virginia coast is subsiding, or gradually sinking in elevation. Second, climate-related changes in the dynamics of ocean circulation in the North Atlantic Ocean basin are bringing higher tides to the East Coast of the U.S. As a result, sea level rise throughout the rest of the North Atlantic Ocean has a disproportionately greater impact on the Virginia coastline.
In 2010, the Hampton Roads Planning District Commission (HRPDC) estimated that land subsidence accounts for one-third to one-half of the sea level rise already observed in the region. Part of this subsidence is due to long-term geological trends. During the last glaciation, the earth’s crust under the ice in the northeast U.S. and Canada was depressed while the crust below Virginia rose. Now, with the ice long gone, the earth’s crust in the northeastern U.S. and Canada is rising and the crust below Virginia is sinking.6 A 2013 study published in the Sea Grant Law and Policy Journal identifies several other reasons for subsidence, including natural rock composition, groundwater withdrawal, and significant use of fill under structures. All these factors mean that the land under Virginia is likely to become compressed and to sink just as the ocean is rising beside it.7
The North Atlantic Ocean’s water distribution is also changing in ways that threaten Virginia coasts. The Gulf Stream current flowing north along the East Coast of the United States keeps sea levels several feet lower than they are along the rest of the coastline. But this effect is slowly being negated by the climate-induced slowing of the Gulf Stream. Normally, Gulf Stream waters flow up from the tropics, collide with colder and less salty waters in the north, and eventually reverse direction to flow back toward the equator. But gradual warming in the north means that warmer waters are not being redirected as quickly, thus reducing the effect of the Gulf Stream that keeps water away from the coast of Virginia.7
Nationally, more attention has been focused on the threats to New Orleans than Virginia. But local and regional experts on the Mid-Atlantic region are sounding the alarm about Virginia’s vulnerability. The HRPDC study concluded that:
Climate change will likely result in several significant adverse impacts on Hampton Roads including inundation and flooding of both developed and natural areas due to sea level rise, increased impacts from severe weather events and associated storm surge, and ecological damage to coastal and marine ecosystems due to temperature increase and loss of wetlands habitat. Many of these impacts are already occurring, and they will continue to increase over the next century.7
the story of the frog that doesn’t jump out of the pot when you slowly turn up the heat. People aren’t taking it as seriously and urgently as they need to” because the changes are happening gradually, Ruth said. “A couple-foot rise in sea level around here is going to wipe out a lot of neighborhoods, but when you get to a 6-foot rise, you’re going to wipe out a lot of Norfolk.”
“ A couple-foot rise in sea level around here is going to wipe out a lot of neighborhoods, but when you get to a 6-foot rise, you’re going to wipe out a lot of Norfolk.”Just across the James River from Norfolk, Hampton residents worry about the same threats. “We’re fighting the elements,” said DeLavey Miner, who moved to Hampton from Florida when her husband retired from the military 8 years ago. “You see certain areas always covered with water, and people are really starting to wonder what is going to happen here in just a few years.”
Miner leads her daughter’s Girl Scout troop, and she noticed the girls’ interest in environment and science topics. “We were doing a new badge called justice, where we pick a topic, connect with social organizations in the community, and then do a Take Action project.” For their topic, the troop chose climate change and the need for alternative energy sources.
Sandee Spicer, one of the owners of a restaurant equipment company in downtown Norfolk, said her building gets flooded out every few years, often because of “nor’easter” storms. “I have a concrete showroom floor, and the water comes up through the cracks in the floor,” she said. “Then I see the manholes across the street start bubbling, and I think, ‘Oh my God, we just don’t have enough pipes to get rid of this water.’”
Home and business owners who have noticed more flooding in recent years aren’t just imagining a problem. According to a study for the Virginia Institute of Marine Science, the number of hours per year that Norfolk’s Hague neighborhood is flooded has tripled in the last 30 years. It’s now typical to have 6-to-12 days of flooding per year, where once there was only 1 or 2.
Ruth Amundsen summed up the feeling of many area residents when she said, “I think there needs to be a lot more education about the kind of impact this is going to have.”
STORIES FROM THE FIELD 10

Just across the street from the Work Program Architects office in downtown Norfolk is the d’ART Center, a city-owned art gallery that brings tourists and residents together around culture. Peggy Beardsley, an artist who recently moved to the Norfolk area, spends a few days a week minding the store and studios.
Hanging in one of the studios is a portrait by Beardsley of a globe on the run. “Mother Earth is running for her life,” said Beardsley of her painting. “There’s glacier melt running down her arm. I wanted to show the forest fires, the polar ice caps melting.
But Beardsley does not have to use her artistic imagination to see how rising sea levels are affecting
her adopted city. “If it rains a lot, every intersection floods, especially where I live in Ghent, and it makes it hard to get home. The storm drains can’t handle it.”
No one knows how future sea level rise and climate change will affect tourism, and the potential impacts are not found in any of the state’s Tourism Authority reports. But according to Laura Wood-Habr, president of the Virginia Beach Restaurant Association, the topic is definitely on the radar of the local tourism industry.
“We absolutely are discussing this issue,” said Wood-Habr. The restaurant association is also supporting the efforts of Norfolk and Virginia Beach to study sea level rise and keep the cities working during storm events.
Another top priority for the tourism industry is the health of the region’s beaches in the face of increasing storm damage. Some localities are “renourishing” their beaches, adding back sediment lost through erosion. Ongoing beach erosion is compounded by sea level rise, according to Larry Atkinson, a professor of ocean, earth, and atmospheric sciences at Old Dominion University (ODU).
“If you look at Virginia Beach, and all the beach renourishment going on, the rising sea level changes the erosion rates,” Atkinson said. “They’re renourishing more because of that.” He noted that while raising the height of beaches may help protect cities from small storms, it won’t protect against larger ones.
How many more adaptation and protection measures will be required and what the potential impact on tourism will be are among a dozen areas of study for the climate science research group at ODU. The university’s campus is located just blocks from the Elizabeth River.
“It was becoming obvious that there was a flooding problem in the neighborhood of our campus, and that the whole region was going to have to adapt,” said Atkinson, who helped organize the group in 2010. John Broderick, ODU’s president, asked Atkinson to consider how the university might help the region confront climate change.
“Obviously we can’t do it all, but there is a role for us,” said Atkinson. For example the ODU group discovered that the university already had over 60 classes that included content on climate change, sea level rise, and related issues. The group also saw how the university could play a role in convening local leaders. “We found a
Tourism and the Rising Tide
STORIES FROM THE FIELD 11
Jamestown and Chincoteague Under SiegeJamestown Island is the site of the first English settlement in North America, and the original James Fort, built in 1607, still stands there today. Lying low and close to the tidal James River, the entire island is at high risk of flooding from sea level rise or extreme weather events. The historic fort has already been impacted by erosion from the river, and in 2003, some 90 percent of the site’s artifacts were flooded and had to be taken to another site for restoration. As floods become more severe and frequent, it may become impossible to maintain the artifacts at the Jamestown Island site.8
Chincoteague is a wildlife refuge that preserves natural habitat and attracts human visitors as well. The park’s brackish and salt marshes, ocean beaches, and tidal flats, however, will be irreversibly changed by rising water levels and stronger storms, and may no longer support the same level of wildlife or human interest.8
A 2010 report led by the Natural Resources Defense Council detailed the potential economic impacts of climate change and rising sea levels on these two well-known tourist attractions and predicted a major loss of tourism in Virginia.8
Tourism and travel to the Virginia Beach area was valued at $1.3 billion in 2012, supporting 12,000 jobs, according to a study for the Virginia Tourism Authority.9 Not counting travel, the overall value of tourism within Virginia Beach was $301 million in 2012 – a record year, according to the Virginia Beach Convention and Visitors Bureau.10
Jim Reddick, an emergency planning coordinator for Norfolk, saw a frightening image at a Hampton Roads “Adaptation Forum” held at ODU in July 2013.
“It was a pop geography quiz,” he explained. The first slide showed the islands around Greece in the eastern Mediterranean, and most people quickly recognized the geography.
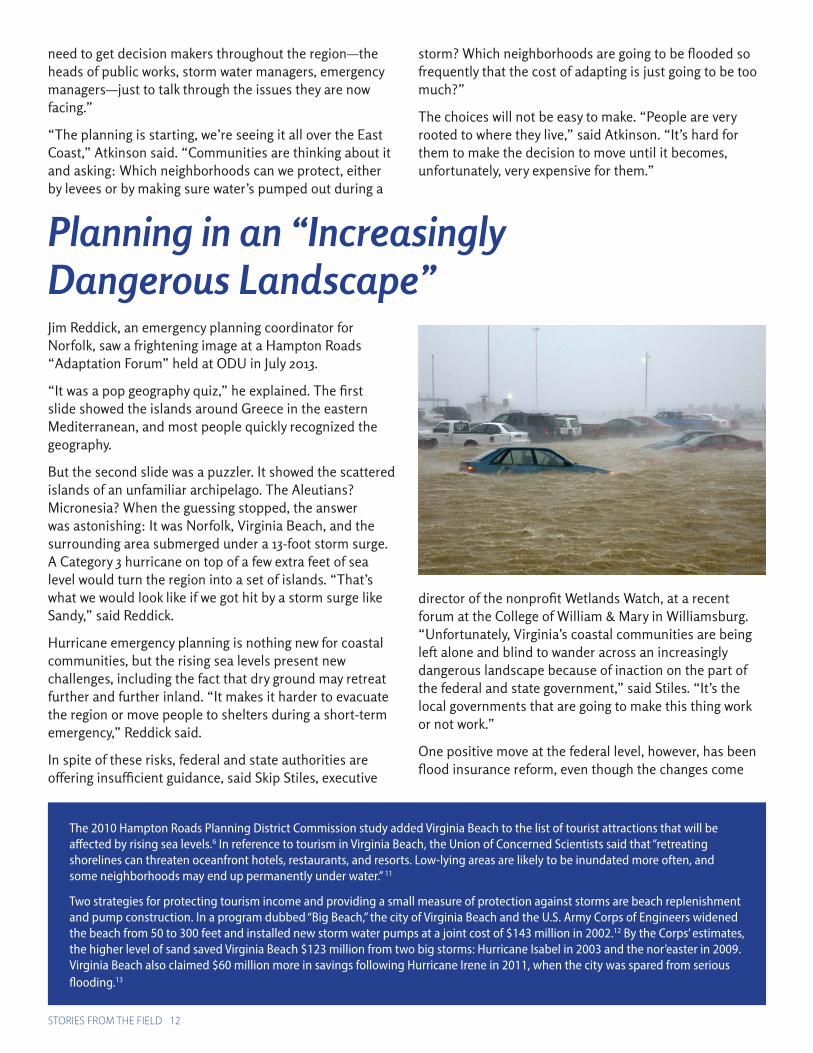
But the second slide was a puzzler. It showed the scattered islands of an unfamiliar archipelago. The Aleutians? Micronesia? When the guessing stopped, the answer was astonishing: It was Norfolk, Virginia Beach, and the surrounding area submerged under a 13-foot storm surge. A Category 3 hurricane on top of a few extra feet of sea level would turn the region into a set of islands. “That’s what we would look like if we got hit by a storm surge like Sandy,” said Reddick.
Hurricane emergency planning is nothing new for coastal communities, but the rising sea levels present new challenges, including the fact that dry ground may retreat further and further inland. “It makes it harder to evacuate the region or move people to shelters during a short-term emergency,” Reddick said.
In spite of these risks, federal and state authorities are offering insufficient guidance, said Skip Stiles, executive
director of the nonprofit Wetlands Watch, at a recent forum at the College of William & Mary in Williamsburg. “Unfortunately, Virginia’s coastal communities are being left alone and blind to wander across an increasingly dangerous landscape because of inaction on the part of the federal and state government,” said Stiles. “It’s the local governments that are going to make this thing work or not work.”
One positive move at the federal level, however, has been flood insurance reform, even though the changes come
Planning in an “Increasingly Dangerous Landscape”
need to get decision makers throughout the region—the heads of public works, storm water managers, emergency managers—just to talk through the issues they are now facing.”
“The planning is starting, we’re seeing it all over the East Coast,” Atkinson said. “Communities are thinking about it and asking: Which neighborhoods can we protect, either by levees or by making sure water’s pumped out during a
storm? Which neighborhoods are going to be flooded so frequently that the cost of adapting is just going to be too much?”
The choices will not be easy to make. “People are very rooted to where they live,” said Atkinson. “It’s hard for them to make the decision to move until it becomes, unfortunately, very expensive for them.”
STORIES FROM THE FIELD 12
The 2010 Hampton Roads Planning District Commission study added Virginia Beach to the list of tourist attractions that will be affected by rising sea levels.6 In reference to tourism in Virginia Beach, the Union of Concerned Scientists said that “retreating shorelines can threaten oceanfront hotels, restaurants, and resorts. Low-lying areas are likely to be inundated more often, and some neighborhoods may end up permanently under water.” 11
Two strategies for protecting tourism income and providing a small measure of protection against storms are beach replenishment and pump construction. In a program dubbed “Big Beach,” the city of Virginia Beach and the U.S. Army Corps of Engineers widened the beach from 50 to 300 feet and installed new storm water pumps at a joint cost of $143 million in 2002.12 By the Corps’ estimates, the higher level of sand saved Virginia Beach $123 million from two big storms: Hurricane Isabel in 2003 and the nor’easter in 2009. Virginia Beach also claimed $60 million more in savings following Hurricane Irene in 2011, when the city was spared from serious flooding.13

One of the best-known and most at-risk islands in the Chesapeake Bay is Tangier Island, whose cultural history stretches back centuries. Studies made by the U.S. Army Corps of Engineers show that Tangier has been shrinking at the rate of 16 feet per year on the western side, where it is more exposed to the Chesapeake Bay, and 3 feet per year on the eastern side. This shrinkage is due to a combination of erosion, sea level rise, and “subsidence”—the gradual sinking of the island toward sea level.
Carl Hershner Jr., a climate change scientist at the Virginia Institute of Marine Science, believes that the future looks grim for Tangier Island. “Sometime in the next 50 to 100 years, the island will basically be under water,” he said. In a sign of things to come, rising tides recently eroded an old cemetery on an uninhabited island just north of Tangier known as Uppards, causing bones and skulls to stick up through the mud.
James “Ooker” Eskridge, Tangier Island’s mayor, and other local leaders have called for funds to extend the jetty and seawall already located around the island’s airport, which serves its 700 residents. That vision may come to life if the federal government delivers on its promise to spend $3.2 million for a seawall, with construction starting in 2016. When the project was announced in 2012, former Virginia Governor Bob McDonnell called the project “critically important” to saving the island and its culture, and the state has pledged to contribute funds to it.
One reason authorities have moved to rescue Tangier is that the island is at the heart of efforts to restart a sustainable oyster business. Before industrial-scale harvesting began in the 1870s, it is estimated that the bay’s oysters—some the size of dinner plates—could filter all the
Chesapeake Bay’s Changing Shoreline and Chemistry
at a cost. The Biggert-Waters Flood Insurance Reform Act of 2012 was intended to adjust flood insurance rates to reflect risk more accurately. As a result, homeowners are now seeing rate increases of 10 to 20 percent per year, while increases for businesses have reached 25 percent. “From an emergency management perspective, the more accurate reflection of risk is probably a good thing,” said Reddick. “But it’s not necessarily good for your wallet.”
Steve Lawson, president of the Tidewater Builders Association, agreed that the reforms are necessary if difficult. “When flood insurance rates are normalized and people are paying a true actuarial rate, that will define their motivation to stay or go,” he said. “I don’t think we should do that in a way that throws large groups of homeowners under the bus, but we are going to have to address it long term.”
Local governments can help communities manage these steep hikes in insurance rates through FEMA’s community rating system, which allows individuals and local governments to take steps to minimize risk and therefore insurance rates. Individuals, for example, can choose to
build homes further away from the shore and at higher elevations. Communities can take action in 18 different ways organized under four categories: public information, mapping and regulations, flood-damage reduction, and flood preparedness.19 In Norfolk, for example, a city council action taken in the fall of 2013 requires higher elevation for new buildings.
Another thorny problem for local planners is the question of how to deal with income inequality. Will low-income families be able to rebuild when their homes are inundated? “The folks most in need are not able to take advantage of the hazard mitigation grants for elevations because the owners cannot pay for the utility connections,” said Gayle Hicks, a senior civil engineer for Hampton city government. “Some even have trouble getting a flood elevation certificate, which costs $300. There is nothing that accounts for those needs.”
Other questions—such as zoning, disclosure of flooding potential, insurance rates, levees and barriers, and emergency services—present enormous policy challenges that planners must tackle in the near future.
STORIES FROM THE FIELD 13
water in the bay within a week. Today, according to marine scientists, with a greatly reduced oyster population, it would take almost a year to do the same job. The more the oysters were harvested, the less the water was cleaned, creating what experts call a “trophic cascade,” in which oxygen deficiency and nutrient saturation kill off animal life.
Because oysters can help clean up water pollution and restore wetlands, state and federal agencies over the past 15 years have worked to restart oystering in the bay, with over a dozen reefs created around Tangier Island and the Rappahannock River holding hundreds of millions of oyster seedlings. In Virginia Beach, building oyster “castles”—artificial reef-like structures built of concrete and crushed oyster shells, on which oysters can grow—have become part of the process of cleaning up Lynnhaven River.
Oystering is now starting to recover as a viable industry. “It’s not as good as the 1980s, but we’ve been doing well this past 3 or 4 years,” said Estrich. But these gains may be undone by coming changes, according to Karen Forget, director of the citizen’s action group Lynnhaven River NOW. “One of the unfortunate side effects of climate change and rising ocean levels could be problems with oysters,” Forget said. “Like all effects, so much is unknown.”
Oyster populations face a sort of double jeopardy in the bay. Pollution and over-harvesting have already taken a toll. Efforts to restore the bay now face new threats, including the effects of warming and acidification from climate change. These new threats are now visible in the proliferation of jellyfish and toxic algae, also known as “red tides,” caused by lack of oxygen.
Just as jellyfish populations have sharply increased globally, so the jellyfish population in the Chesapeake Bay has grown, especially during dry years, when the bay is saltier and polyps, or juvenile jellyfish, grow more easily. The Bay is home to two kinds of jellyfish: comb jellies, which eat oyster larvae, and sea nettles, which are notorious for stinging swimmers. Scientists studying these jellyfish in the York River have found that when populations “bloom,” they deprive other animal life of food sources, while encouraging the growth of bacteria and therefore supporting the trophic cascade.20
Acid levels have increased by 30 percent worldwide over the past two centuries because of increased carbon dioxide levels, and the rate is accelerating as carbon dioxide builds up in the atmosphere. One possible but limited way to counter rising acid levels in the Bay is to grind up old oyster shells and disperse this alkaline mixture through the waters, said Roger Mann of Virginia
Institute of Marine Science (VIMS).
“Oyster shells are like slow-dissolving TUMS in the belly of Chesapeake Bay,” explained Mann. “As ocean water becomes more acidic, the oyster shells begin to dissolve into the water, slowly releasing their calcium carbonate, an alkaline salt that buffers against acidity.”
The hope is that the high pH of the ground-up shells would take the acidic pressure off the living oysters. But among the many unanswered questions about the fate of oyster populations in a warming world is whether the Bay’s modern oyster reefs can keep pace with the increasing acidity of Bay waters.21
STORIES FROM THE FIELD 14
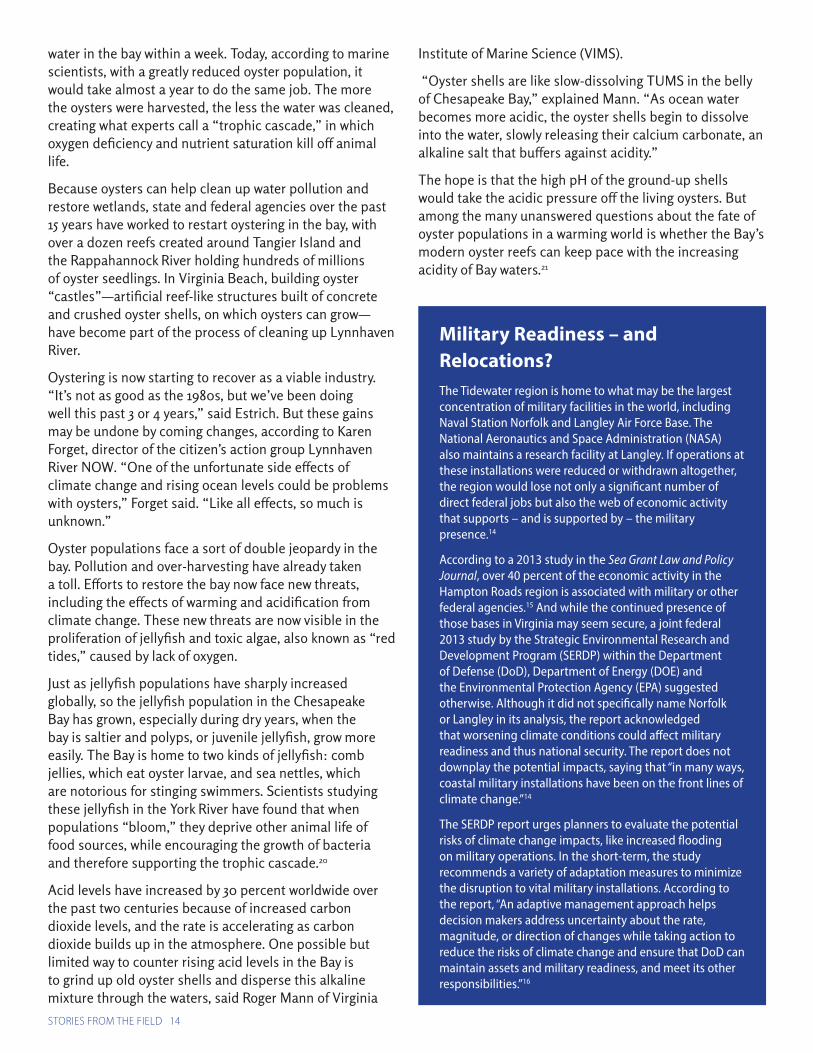
Military Readiness – and Relocations?The Tidewater region is home to what may be the largest concentration of military facilities in the world, including Naval Station Norfolk and Langley Air Force Base. The National Aeronautics and Space Administration (NASA) also maintains a research facility at Langley. If operations at these installations were reduced or withdrawn altogether, the region would lose not only a significant number of direct federal jobs but also the web of economic activity that supports – and is supported by – the military presence.14
According to a 2013 study in the Sea Grant Law and Policy Journal, over 40 percent of the economic activity in the Hampton Roads region is associated with military or other federal agencies.15 And while the continued presence of those bases in Virginia may seem secure, a joint federal 2013 study by the Strategic Environmental Research and Development Program (SERDP) within the Department of Defense (DoD), Department of Energy (DOE) and the Environmental Protection Agency (EPA) suggested otherwise. Although it did not specifically name Norfolk or Langley in its analysis, the report acknowledged that worsening climate conditions could affect military readiness and thus national security. The report does not downplay the potential impacts, saying that “in many ways, coastal military installations have been on the front lines of climate change.”14
The SERDP report urges planners to evaluate the potential risks of climate change impacts, like increased flooding on military operations. In the short-term, the study recommends a variety of adaptation measures to minimize the disruption to vital military installations. According to the report, “An adaptive management approach helps decision makers address uncertainty about the rate, magnitude, or direction of changes while taking action to reduce the risks of climate change and ensure that DoD can maintain assets and military readiness, and meet its other responsibilities.”16

Until recently, officers speaking out on the problem of sea level rise at Naval Station Norfolk felt like voices in the wilderness. One of the most persistent voices belongs to retired Captain Joseph Bouchard, who was the commanding officer at Naval Station Norfolk from 2000 to 2003. He has since served a term in the Virginia legislature and helped lead the city of Norfolk in coming to grips with climate change.
“ The Navy’s approach to climate change is beginning to change...But even new adaptation measures may not be suff icient to protect naval bases from future weather, according to a 2012 study from the U.S. Army Corps of Engineers.”
Speaking at regional seminars and panels, Bouchard manages to combine a sense of intelligence and humanitarian concern along with the clipped and commanding tone of a Navy briefing. He is quick to remind audiences that the Navy depends on the Norfolk region just as much as Norfolk depends on the Navy. “No military base is self-sufficient,” said Bouchard. “All the critical infrastructure comes from the local community.” This interdependence is why planning with federal, state and local governments—together with the military and scientific groups—is increasingly important, and why politics has to take a back seat to a practical focus on climate change.
“In fact, the state is an obstacle to progress,” Bouchard said. He pointed to the Virginia state legislature’s refusal to fund a 2013 study on “recurrent flooding” if it included the term “climate change.” The scientists and planners who worked on the report eventually refused to let political issues get in their way, Bouchard noted, and the final report does indeed refer to climate change.
The Navy’s “too little, too late” approach to climate change has set a pattern the rest of the region has followed. Bouchard recalled how the Navy built two new 21-foot piers while he was base commander for destroyers and aircraft carriers.
High Tide at the Naval Base
STORIES FROM THE FIELD 15
Similar warnings have come straight from the Pentagon. In its 2013 assessment of the impact of climate change on military installations, including Naval Station Norfolk and Langley Air Force Base, the DoD said, “Climate change will have serious implications for the ability of the Department of Defense to maintain its natural and built infrastructure and to ensure military readiness.”16
In 2012, the U.S. Army Corps of Engineers conducted a study using computer simulations for three hypothetical storm scenarios based in part on data from Hurricane Isabel. The results predicted that Naval Station Norfolk could be flooded under extreme weather conditions, with water levels high enough to flood 60 to 80 percent of the naval station and significant parts of the surrounding area. The maximum surge level induced by the 100-year storm model reached 3.6 meters maximum sea level rise under the existing condition and as much as a 5.4-meter meter rise under extreme storm conditions, the Corps report said.19
In reference to Langley Air Force Base, a DoD study in 2013 reported that “given its coastal geography and a mean elevation of only 3 feet, the greater risk of flooding for Langley AFB likely rests not with precipitation events themselves but with a projected rise in mean sea level and its interaction with both continental and maritime storms.”16

“We were spending millions of dollars to adapt to the 1 foot of sea level rise that had already happened since World War I, when the base was first built,” Bouchard said. “That included new piers and changes to storm water systems,” he noted.
“The problem was that we didn’t get it right,” Bouchard said. “Although those were wise investments at the time, they were not sufficient. Climate change studies and future forecasts of sea level rise were taking place, but we were not aware of them,” he said. “All we knew was that we had to adapt to the one-foot rise that happened. We didn’t know why it happened.”
In a recent presentation, Bouchard expanded on how climate change is already impacting Naval Station Norfolk. “As sea level has risen over the last century, utilities suspended beneath old single-deck piers have become increasingly vulnerable to damage from sea water immersion and are less accessible for maintenance. Utility outages have a serious impact on the readiness of ships at the piers.”22
But the Navy’s approach to climate change is beginning to change. The Department of Defense has tasked its Strategic Environmental Research and Development Program to study sea level rise around the world. “The Navy has a climate change road map now, so at the higher levels the Navy is paying attention to it,” said Bouchard.
But even new adaptation measures may not be sufficient to protect naval bases from future weather, according to a 2012 study from the U.S. Army Corps of Engineers (USACE).23 Kelly Burks-Copes, a spokesperson for USACE, pointed out that piers are constructed today to withstand 2 meters of flooding. “But by the time you stack 2 meters of sea level rise on top of a 100-year storm, what you’re seeing is approximately 9 meters of flooding,” she said, pausing to add for emphasis: “That’s 27 feet. That’s three
stories.”
The specific ways in which defense missions like Naval Station Norfolk would be damaged are classified, Burks-Copes said, and will probably remain so. But it is clear that, at the very least, moving sailors and supplies to and from the ships will be increasingly difficult as water levels rise higher.
The Corps’ study was also notable for using a new model for hurricane trajectories and damage forecasts, she said. Hurricanes slow down with friction from all kinds of obstacles, natural and man-made. But when sea levels rise, submerging wetlands and other barriers, storms encounter less friction and gather more power. Old hurricane models are less accurate under these new conditions, so the Corps’ study did not use historical data.
The new models paint a disturbing picture of future storm impacts—and can be difficult to believe until they come true. In 2011, for example, the Corps’ sea-level team shared preliminary scenarios with Norfolk engineers, which showed moderate storms in these new conditions taking a sharp westward turn from the Atlantic and causing huge amounts of damage.
“I was told this was a ridiculous scenario because it had never happened before. [A storm] coming up and taking a left, that was just unreasonable,” said Burks-Copes. “But then Sandy happened the very next year.” Superstorm Sandy did, in fact, slow down and “take a left” as it approached the New Jersey coast, resulting in tremendous flooding and damage from which the state is still recovering.
“So that’s the point: If you use historical storms to do these kinds of analyses, you’re not taking into account the new possibilities,” she said. “We’re going to see things we’ve never seen before.”
STORIES FROM THE FIELD 16

PROTECT AND PREVENTSaving Virginia’s Coasts While
Combating Climate Change
© Aerophoto America All Rights Reserved
PROTECT AND PREVENT 18
Adapting to the New RealityAs the U.S. and other countries grapple with how to reduce the severity of future climate change—namely through strategies that reduce greenhouse gas—local governments in Virginia and around the world are taking action to protect communities from the impacts already occurring.
“ In the long run, Virginia and the rest of the world must do more than simply adapt to a changing climate. While coastal communities begin to plan for the effects of climate change, state and national governments are struggling to make signif icant progress to mitigate the causes.”
Experts increasingly urge localities to avoid delay in planning for the significant and expensive consequences of warming temperatures and rising seas. The Georgetown Climate Center, for example, warned of serious fiscal and legal consequences for governments that fail to plan for the possibility that “valuable government tax base and significant private investment will literally fall into the sea.”24
Judging from its 2010 study, the Hampton Roads Planning District Commission (HRPDC) is taking these concerns seriously. The study urges planners to consider the challenge of adapting to climate change as an opportunity for improving regional infrastructure so it is “better suited to a more volatile climate and…more resilient to the
weather patterns the region already deals with.”1
The HRPDC report divides responses to climate change into three categories: protection, accommodation, and retreat. Vulnerable coastal structures or environments can be protected from encroaching seas, accommodated to tolerate flooding, or relocated further from the coast.
Physical protection measures such as seawalls and storm surge barriers are designed to prevent rising waters from reaching the protected area. Essentially, these hardening or armoring measures attempt to preserve the current shoreline. While physical barriers can provide some short-term relief from flooding, they may cause more harm than good in the long run, as they often simply shift the sites of erosion.25
Virginia’s 2008 report from the governor’s commission on climate change recommended that the state avoid excessive “shoreline hardening” measures and instead adopt policies that allow the migration of the “living shoreline.” Living shoreline projects stabilize existing shores with plants, sand, and some rock; these steps protect the surrounding riparian and intertidal environment, improve water quality via filtration of upland run-off, and create habitats for aquatic and terrestrial species.26 In the long term, coastal resiliency means adapting to the new shoreline rather than attempting to preserve the old.27
Virginia is not the only state coming to these conclusions. A recent report to the Florida legislature advised the state to “reduce and discourage future reliance on bulkheading/hardening to stabilize estuarine and beach shorelines” and consider it an option “only after a full and
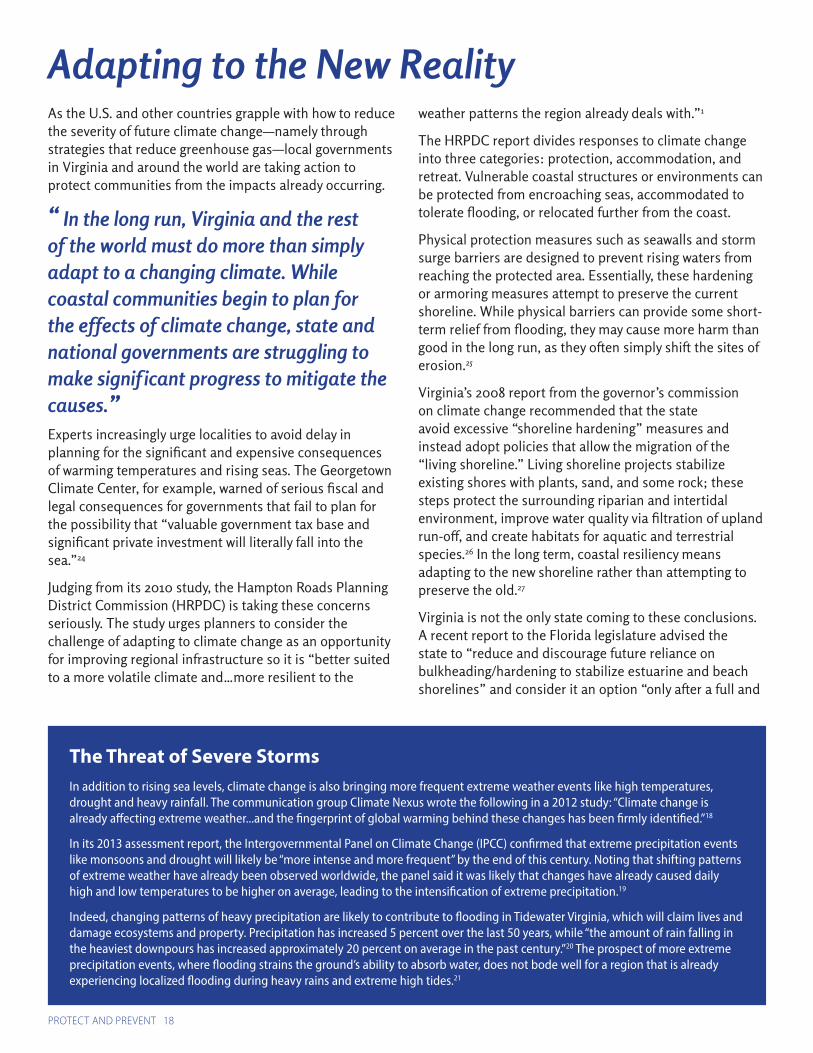
The Threat of Severe StormsIn addition to rising sea levels, climate change is also bringing more frequent extreme weather events like high temperatures, drought and heavy rainfall. The communication group Climate Nexus wrote the following in a 2012 study: “Climate change is already affecting extreme weather...and the fingerprint of global warming behind these changes has been firmly identified.”18
In its 2013 assessment report, the Intergovernmental Panel on Climate Change (IPCC) confirmed that extreme precipitation events like monsoons and drought will likely be “more intense and more frequent” by the end of this century. Noting that shifting patterns of extreme weather have already been observed worldwide, the panel said it was likely that changes have already caused daily high and low temperatures to be higher on average, leading to the intensification of extreme precipitation.19
Indeed, changing patterns of heavy precipitation are likely to contribute to flooding in Tidewater Virginia, which will claim lives and damage ecosystems and property. Precipitation has increased 5 percent over the last 50 years, while “the amount of rain falling in the heaviest downpours has increased approximately 20 percent on average in the past century.”20 The prospect of more extreme precipitation events, where flooding strains the ground’s ability to absorb water, does not bode well for a region that is already experiencing localized flooding during heavy rains and extreme high tides.21

PROTECT AND PREVENT 19
cumulative assessment of short- and long-term impacts to coastal resources and coastal ecosystems.”24 The Georgetown Climate Center went further, suggesting that state and local governments should not only be wary of implementing physical barrier solutions but also consider regulating their use by private landowners.24
Accommodation strategies avoid some of the problems of armoring. These strategies include elevating buildings, renourishing beaches, and enhancing wetlands. Some of these options, including the elevation of coastal homes by property owners, are already being implemented in some Virginia localities. Measures that allow water to flow under or through existing structures without causing damage may provide short-term benefits similar those offered by physical barrier but with fewer long-term consequences like more rapid shoreline erosion.
While accommodation and protection measures remain vital, retreat will be the best policy in many cases. A broad range of policies can be implemented to allow or encourage people and ecosystems to move away from vulnerable areas, including setbacks, rolling easements, and development restrictions. The Hampton Roads Planning Commission recommended “a focus on reducing growth in areas forecasted to be” affected over the next century.1
Measures intended to reduce growth by preventing new development are generally easier and most cost effective to implement than those affecting current development, according to the Georgetown Climate Center. Taxpayers who have financial or emotional investment in vulnerable properties expect the government to support them in protecting those investments. Governments will have to balance the claims of private property owners against the public costs of emergency response, flooded infrastructure rebuilding, and the potential long-term consequences
of delaying the progress of the living shoreline. The Georgetown Climate Center recommends that local governments, which may be wary of requiring current property owners to relocate, consider restrictions on rebuilding after flooding.
No matter how adaptation plans are structured, the burden will fall most heavily on localities. A 2013 study in the Sea Grant Law and Policy Journal predicted that while national and international organizations will play a large role in long-term solutions to climate change, most short-term coastal adaptation will be implemented by local governments and property owners.28
How much will these adaptations cost? One recent study, commissioned by the city of Norfolk and conducted by the Dutch engineering firm Fugro, found that the cost of preventative measures like building seawalls and elevating homes in the city would exceed $1 billion.29
As high as that price tag may seem, the costs of inaction are even higher. A 2011 report from the information analysis firm CoreLogic found that a Category 5 hurricane would inflict $45 billion in residential damages on Virginia
The latest IPCC report predicts that extremely intense hurricanes will occur more frequently in several locations, including the North Atlantic, owing to climate change. The Union of Concerned Scientists evaluated the available science and concluded that global warming “is the overarching factor; initial findings suggest that over the period 1970 to 2004 warmer sea surface temperature is the major factor in the increase in Category 4 to 5 hurricanes globally.”22
The 2012 study by Climate Nexus reached similar conclusions. “Global warming is already affecting hurricanes, loading them with additional moisture, making for more intense rainfall. Hurricanes Katrina and Ivan, for example, carried significant increases in rainfall due to climate warming. Out of the 11 most intense North Atlantic hurricanes ever recorded, five have occurred in the last eight years.”18
Whether or not these trends in frequency and intensity continue, scientists are increasingly convinced that rising sea levels will increase the likelihood of damage. Said the Climate Nexus study: “Hurricane storm surges now ride higher upon coastal seas that have risen over the last century due to global warming, amplifying losses where the surge strikes.” A 2013 report by the Environment America Research & Policy Center agreed that “sea level rise and other changes brought about by global warming are diminishing the ability of natural and man-made systems to withstand extreme weather events, increasing the amount of damage they can cause.”23

PROTECT AND PREVENT 20
Beach and would affect almost 289,000 properties in the area. Even a Category 1 storm would “cause area residents total property damage of close to $10B, impacting over 59,000 homes.”30
With such dire eventualities on the horizon, it seems as though any action would make a difference. Yet it turns out that not every such investment will deliver lasting value. In Virginia Beach, the city spent $1.2 million in 2013 on an “interim project” to install temporary measures to protect 5 homes, 15 garages and 570 feet of roadway in the Cape Story neighborhood. The implementation of more effective measures, like installing large subterranean drainage pipes, in that neighborhood alone could cost as much as $70 million.31 Meanwhile, the interim project will not provide protection against larger storms. “While cheaper and faster, the interim project would only be effective during less-serious flooding,” city engineer John Fowler told the The Virginian-Pilot. “That means the efforts wouldn’t have helped during Sandy or the punishing November 2009 nor’easter.”31
As shown by the Hampton Roads Planning Commission study, local policy makers are seriously considering the impacts of climate change in long-range planning. Short-term action, however, is still lacking. According to the 2013 study in the Sea Grant Law and Policy Journal, “Local governments in Tidewater Virginia have generally acknowledged sea level rise in planning documents, such as long-range comprehensive plans, floodplain management plans, and hazard mitigation plans, but tangible adaptation actions are uncommon, ad hoc, and at a small scale.”28
In the long run, Virginia and the rest of the world must do more than simply adapt to a changing climate. While coastal communities begin to plan for the effects of climate change, state and national governments are struggling to make significant progress to mitigate the causes.
Evacuation ChallengesIf a catastrophic hurricane were to strike Virginia tomorrow, a litany of preparedness challenges would hamper the ability of state and local governments to safely evacuate people from affected areas. A 2013 study from Virginia’s Office of Veterans Affairs and Homeland Security (OVAHS), acknowledged that while “a considerable amount of evacuation-related planning has been completed,” including a “lane reversal” plan for I-64, “more planning at both the State and local levels” was needed, and that local-level evacuation planning strategies must be integrated with state evacuation plans. The OVAHS study concluded that new polices and strategies are needed across the emergency management spectrum in order to develop statewide and local capabilities to respond to catastrophic emergency events like hurricanes.24
One large preparedness gap is shelter. Of the 500,000 people who could be expected to be evacuated from the region ahead of a catastrophic hurricane, OVAHS estimated that roughly 10 percent of those evacuees (50,000 people) would need public shelter. But all of Virginia’s state-managed shelters, when fully staffed and equipped, have the capability to handle less than 20,000 people. And while the OVAHS team found that the Commonwealth may be able to open 18 shelter facilities, “the majority of those would have challenges identifying staff trained to fill all required positions.”24
Another daunting challenge identified by the project team was the logistical task of transporting up to a million people in an emergency. The I-64 Lane Reversal Plan and the proposed Bower’s Hill Lane Reversal Plan will allow a greater number of cars to move westbound, but integrated transportation planning between localities and the Commonwealth is still necessary to avoid confusion and gridlock of motorists who are trying access the interstate. “Local jurisdictions should make this a high-level planning priority and, where appropriate, the Commonwealth should contribute technical assistance.” There also remains a need to “coordinate bridge openings to accommodate the potential evacuation of maritime vessels from the Port of Hampton Roads.” 24

COMBATING CLIMATE CHANGE AT THE SOURCE
Greenhouse Gas Reduction Strategies
© Aerophoto America All Rights Reserved

COMBATING CLIMATE CHANGE AT THE SOURCE 22
Sources of Greenhouse Gas Emissions in VirginiaIn 2012, two-thirds of all greenhouse gas emissions generated in Virginia from stationary sources came from the operations of just 10 companies (see Figure 1.) Of those companies, Dominion Resources, Virginia’s largest electric utility, was by far the largest greenhouse gas emitter. In fact, 34 percent of all the greenhouse gas emitted from stationary sources in Virginia came from Dominion Resources in 2012. These emissions were produced by the company’s 20 power plants, which are mostly fueled by coal and natural gas.32
Power plant emissions are declining in Virginia as they are throughout much of the country, largely due to a decrease in coal-fired electricity output and an increase in natural gas-fired electricity output.33 Virginia’s power plant emissions, for example, dropped from 38.3 million tons in
2010 to 29.0 million tons in 2012. These reductions may seem like progress, but while natural gas emits less CO2 than coal at the point of combustion, serious concerns remain about the impacts of the natural gas extraction and transportation, especially with the rise in use of hydraulic fracturing, or fracking.34
“ In short, energy companies like Dominion that continue to rely on fossil fuels – including natural gas – are likely to continue to be the state’s primary stationary emitters of greenhouse gases.”
When it comes to mitigating climate change, the main problem with natural gas is that methane—a powerful greenhouse gas—leaks into the atmosphere during drilling, processing, and transportation. In lieu of strong regulations to significantly reduce methane leakage, natural gas cannot be relied on as either a near- or long-term greenhouse gas reduction strategy for Virginia.
Even if methane leakage were to drop to zero, Dominion’s current long-term integrated resource plan—according to a 2013 study released jointly by the Institute for Energy Economics and Financial Analysis, Optimal Energy, and Sommer Energy—would still increase the company’s carbon dioxide emissions by nearly 50 percent over the next 25 years.35 In short, energy companies like Dominion that continue to rely on fossil fuels, including natural gas, are likely to continue to be the state’s primary stationary emitters of greenhouse gases.
Figure 1: Top Greenhouse Gas Emitters in Virginia, 2012.Source: U.S. Environmental Protection Agency’s Greenhouse
Gas (GHG) Customized Search.
High Risks, Expensive InsuranceInsurers are taking note of the trend toward extreme weather events. A 2012 study by the insurance group Munich RE outlined the new reality: “The intensities of certain weather events in North America are among the highest in the world, and the risks associated with them are changing faster than anywhere else.”
The company’s report also pointed out that climate-related weather, when it interacts with normal weather events, will further increase property damage: “When global warming combines with natural weather cycles such as the El Niño/La Niña phenomena, the risk of severe weather is intensified and these factors will result in even larger lost costs from natural peril events than what we have seen so far,” said the Munich RE study.25
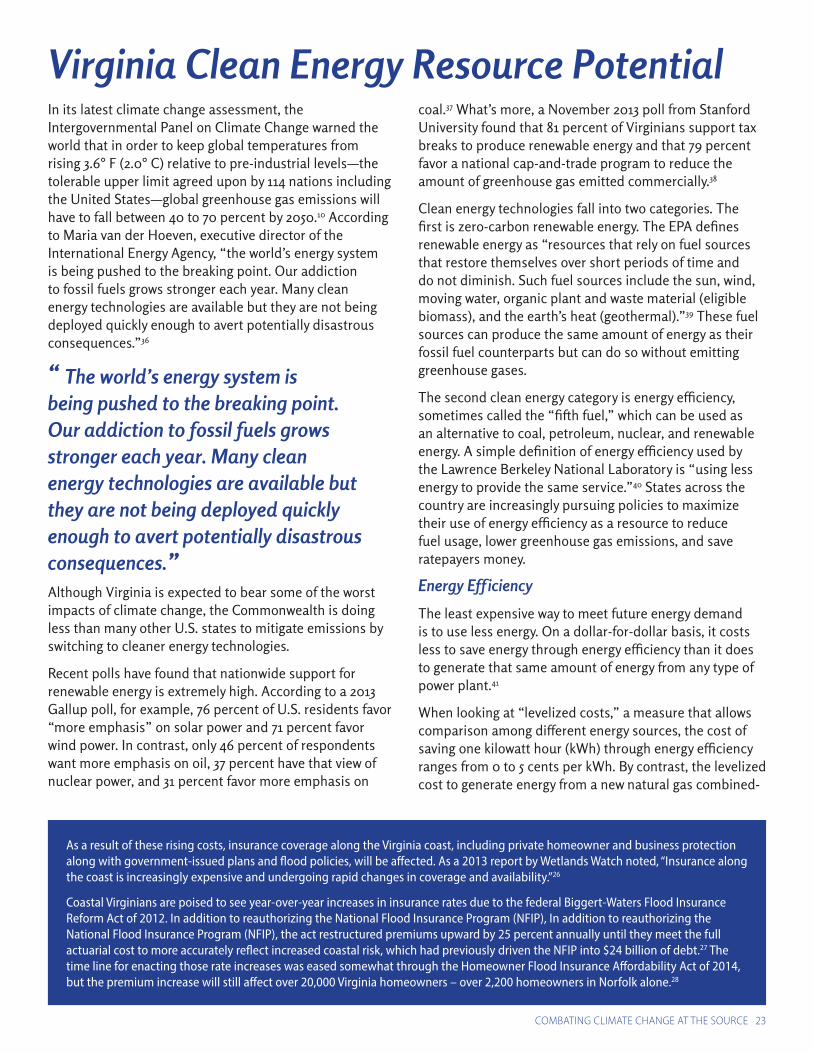
COMBATING CLIMATE CHANGE AT THE SOURCE 23
Virginia Clean Energy Resource PotentialIn its latest climate change assessment, the Intergovernmental Panel on Climate Change warned the world that in order to keep global temperatures from rising 3.6° F (2.0° C) relative to pre-industrial levels—the tolerable upper limit agreed upon by 114 nations including the United States—global greenhouse gas emissions will have to fall between 40 to 70 percent by 2050.10 According to Maria van der Hoeven, executive director of the International Energy Agency, “the world’s energy system is being pushed to the breaking point. Our addiction to fossil fuels grows stronger each year. Many clean energy technologies are available but they are not being deployed quickly enough to avert potentially disastrous consequences.”36
“ The world’s energy system is being pushed to the breaking point. Our addiction to fossil fuels grows stronger each year. Many clean energy technologies are available but they are not being deployed quickly enough to avert potentially disastrous consequences.”
Although Virginia is expected to bear some of the worst impacts of climate change, the Commonwealth is doing less than many other U.S. states to mitigate emissions by switching to cleaner energy technologies.
Recent polls have found that nationwide support for renewable energy is extremely high. According to a 2013 Gallup poll, for example, 76 percent of U.S. residents favor “more emphasis” on solar power and 71 percent favor wind power. In contrast, only 46 percent of respondents want more emphasis on oil, 37 percent have that view of nuclear power, and 31 percent favor more emphasis on
coal.37 What’s more, a November 2013 poll from Stanford University found that 81 percent of Virginians support tax breaks to produce renewable energy and that 79 percent favor a national cap-and-trade program to reduce the amount of greenhouse gas emitted commercially.38
Clean energy technologies fall into two categories. The first is zero-carbon renewable energy. The EPA defines renewable energy as “resources that rely on fuel sources that restore themselves over short periods of time and do not diminish. Such fuel sources include the sun, wind, moving water, organic plant and waste material (eligible biomass), and the earth’s heat (geothermal).”39 These fuel sources can produce the same amount of energy as their fossil fuel counterparts but can do so without emitting greenhouse gases.
The second clean energy category is energy efficiency, sometimes called the “fifth fuel,” which can be used as an alternative to coal, petroleum, nuclear, and renewable energy. A simple definition of energy efficiency used by the Lawrence Berkeley National Laboratory is “using less energy to provide the same service.”40 States across the country are increasingly pursuing policies to maximize their use of energy efficiency as a resource to reduce fuel usage, lower greenhouse gas emissions, and save ratepayers money.
Energy Eff iciency
The least expensive way to meet future energy demand is to use less energy. On a dollar-for-dollar basis, it costs less to save energy through energy efficiency than it does to generate that same amount of energy from any type of power plant.41
When looking at “levelized costs,” a measure that allows comparison among different energy sources, the cost of saving one kilowatt hour (kWh) through energy efficiency ranges from 0 to 5 cents per kWh. By contrast, the levelized cost to generate energy from a new natural gas combined-
As a result of these rising costs, insurance coverage along the Virginia coast, including private homeowner and business protection along with government-issued plans and flood policies, will be affected. As a 2013 report by Wetlands Watch noted, “Insurance along the coast is increasingly expensive and undergoing rapid changes in coverage and availability.”26
Coastal Virginians are poised to see year-over-year increases in insurance rates due to the federal Biggert-Waters Flood Insurance Reform Act of 2012. In addition to reauthorizing the National Flood Insurance Program (NFIP), In addition to reauthorizing the National Flood Insurance Program (NFIP), the act restructured premiums upward by 25 percent annually until they meet the full actuarial cost to more accurately reflect increased coastal risk, which had previously driven the NFIP into $24 billion of debt.27 The time line for enacting those rate increases was eased somewhat through the Homeowner Flood Insurance Affordability Act of 2014, but the premium increase will still affect over 20,000 Virginia homeowners – over 2,200 homeowners in Norfolk alone.28

COMBATING CLIMATE CHANGE AT THE SOURCE 24
cycle power plant ranges from 6.1 to 8.7 cents per kWh, while coal’s levelized costs range from 6.5 to 14.5 cents per kWh.41 In other words, it is more cost-effective to save energy than it is to generate energy.
Two-thirds of Virginia’s electricity is supplied by Dominion Virginia Power.42 In its 2013 Integrated Resource Plan (IRP), which shows how the company plans to meet growing customer demand for electricity over the next 15 years, the company projected that its customers will continue to increase electricity consumption by 1.7 percent per year.43 This projection is significantly higher than the 0.9 percent per year growth rate the U.S. Energy Information Administration predicts for national electricity demand.44
“ Virginia has signif icant potential for cost-effective energy eff iciency.” Dominion could conservatively “reach and sustain energy eff iciency savings of 1.3 percent of energy sales per year. ” The difference between these predictions can be attributed to the fact that Virginia is one of a shrinking number of states with no binding energy savings targets. In the absence of such policy incentives, significant potential for low-cost energy efficiency and conservation across the state goes untapped. The 2013 joint study from the Institute for Energy Economics and Financial Analysis, Optimal Energy, and Sommer Energy found that Dominion’s plan to “save a total of 3.4 percent of its sales forecast through efficiency after 10 years of efficiency program implementation… is far below what is achievable, on the order of several million megawatt-hours and hundreds of megawatts.” The study went onto say that “Virginia has significant potential for cost-effective energy efficiency” and that Dominion could conservatively “reach and sustain energy efficiency savings of 1.3 percent of energy sales per year” for less than the cost of constructing new power plants.35
Despite its energy efficiency potential, Virginia continues to lag behind other states in its deployment of this cheap and abundant energy resource. In its 2013 State Energy Efficiency Scorecard, the American Council for an Energy-Efficient Economy (ACEEE) recently ranked Virginia as number 36 in the nation for energy efficiency.45 In explaining the ranking, ACEEE wrote that while there has been some legislative action in the past to promote energy efficiency, “the implementation process has been difficult and as a result the state still falls well below the national average on energy efficiency program spending and energy savings.” Although the Virginia legislature passed a 2007 bill that targeted 10 percent energy savings by 2022 (using
Changes in the Chesapeake: Strange Weather and Ocean AcidificationNumerous studies have documented the present and future impacts of climate change on marine life in the Atlantic Ocean and the Chesapeake Bay, the aquatic lifeblood of the Tidewater region. The conclusion? Virtually every aspect of the Bay’s biology will be affected by climate change.
A 2009 U.S. report on climate change predicts changes in the volume and circulation of water in the Bay as well as its chemical composition including its salinity and acidity. These changes will have direct impacts on the ability of the Bay to sustain aquatic ecosystems. The increased acidity, for example, makes it difficult for oysters and other shell-forming animals to develop their shells.30 Oxygen levels in the Chesapeake Bay are also expected to decrease owing to rising temperatures and increasing storm runoff, which will have a negative impact on species like striped bass, blue crabs, and oysters.
In 2008, the Governor’s Commission on Climate Change, created by then-Governor Tim Kaine in 2007, also warned in its final report of the serious risks posed to “foundation species” by changing conditions in the Bay combined with widely fluctuating weather patterns.30
Even when one species may benefit from changes, the disruption of the ecosystem may negatively impact another species. In a 2013 article, the Washington Post described potential impacts of climate change on the delicate balance between two of Virginia’s most prized aquatic animals: blue crabs and oysters. According to the story, crabs can absorb extra carbon in the ocean to grow bigger and healthier, while higher carbon levels decrease the ability of oysters to absorb carbon, which then slows their growth. Since crabs prey on oysters, these changes could lead to even lower populations of oysters in the future.31
Experts say the problem extends beyond crabs, oysters, and the Chesapeake Bay. Lobsters and shrimp also are bulking up on carbon dioxide along the Atlantic coast. Like oysters, coral that helps protect small organisms from big predators is being adversely affected by higher acidity. Indeed, concern about ocean acidification is global. In January 2009, a group of 155 concerned marine scientists from 26 countries, including the U.S., signed the Monaco Declaration calling for “immediate action by policymakers to reduce carbon dioxide emissions so as to avoid widespread and severe damage to marine ecosystems from ocean acidification.”32

COMBATING CLIMATE CHANGE AT THE SOURCE 25
2006 as a baseline), the goal was not a mandate. Virginia’s State Corporation Commission—the body responsible for utility regulation—has still not set any regulatory requirements for energy efficiency.46
Energy efficiency policies have had positive effects in other states. Neighboring Maryland recently projected that electricity demand will grow at a much lower rate of 0.76 percent per year, considerably less than the projected 1.2 percent demand increase that the state would have faced without its energy efficiency and conservation investments.47 In New England, where many states have been making concerted efforts for over a decade to reduce electricity consumption through energy efficiency and conservation, energy demand is expected to stay flat for the next 10 years. In fact, states like Rhode Island and Vermont are even expecting energy consumption to decrease in the coming years.48
Offshore Wind
Offshore wind is a particularly promising renewable energy resource because, relative to land-based wind, offshore wind blows more strongly and consistently.49 Furthermore, this abundant resource is located next to densely-populated coastal urban centers where electricity demand is growing, energy prices are highest, and space for land-based wind development is limited. This proximity offers favorable market opportunities and could significantly reduce transmission issues associated with delivering power to coastal regions from interior land-based sources.
The National Renewable Energy Laboratory estimates that roughly 4 million megawatts (MW) of offshore wind is available near U.S. coasts, or “roughly four times the generating capacity currently carried on the U.S. electric grid.”50 The resource availability in Virginia is proportionally similar. There are approximately 94,500 MW of offshore wind power available within 50 nautical miles of Virginia’s coast, which is almost four times the electricity generation capacity of the entire Commonwealth.51,52 Virginia’s 2010 Energy Plan reported that the state could potentially develop 28,100 MW of that potential.53
The Bureau of Ocean Energy Management (BOEM) has designated an 112,799 acre “wind energy area” approximately 23.5 nautical miles from the Virginia Beach coastline, which could support roughly 2,000 MW of offshore wind – enough electricity to power 700,000 homes.54 In September 2013, BOEM auctioned that wind energy area for commercial wind energy leasing. Dominion won the auction, but Dominion’s IRP shows that the company only plans to build 12 MW of the estimated 2,000 MW potential in 2018 through the construction of just two 6 MW test turbines.55
Virginia Not Doing EnoughVirginia has a relatively unambitious and voluntary clean energy goal of just 15 percent renewable power by 2025. At present almost all of Virginia’s electricity comes from just three sources: coal, natural gas, and nuclear. In 2012, renewable power accounted for only 1.1 percent of the energy sold by Dominion Virginia Power, and most of that was from hydroelectric dams built before 1940. Through its Integrated Resource Plan, Dominion projects more of the same in the future.
“Of course, the cheapest and cleanest kilowatt is the one that the power company never has to generate in the first place,” said Cale Jaffe, an attorney with the Southern Environmental Law Center, highlighting the need for better efficiency throughout Virginia.

COMBATING CLIMATE CHANGE AT THE SOURCE 26
In Europe, where the offshore wind industry has matured over two decades, progress has been much faster. A total of 2,080 offshore wind turbines were installed by the end of 2013 at 69 different wind farms, offering a cumulative capacity of over 6,500 MW. Thirteen new wind farms with a generating capacity of 1,567 MW were installed in 2013 alone. At the start of 2014, work was ongoing at 12 separate projects, which, upon completion, will increase Europe’s offshore wind capacity by a further 3,000 MW, bringing cumulative capacity in Europe to 9,400 MW.56
“ There are approximately 94,500 MW of offshore wind power available within 50 nautical miles of Virginia’s coast, which is almost four times the electricity generation capacity of the entire Commonwealth.” Owing in part to long-term energy policies supporting offshore wind development, the European offshore wind industry forecasts robust growth into the future. The European Commission reported that “offshore wind can and must make a substantial contribution to meeting the EU’s energy policy objectives through a very significant increase—in the order of 30-40 times by 2020 and 100 times by 2030—in installed capacity compared to today.”57
In contrast to Europe’s offshore wind boom, U.S. offshore wind development has yet to begin. There are currently
no commercial offshore wind farms operating in U.S. waters. Happily, that situation may soon change. A new report from the Department of Energy (DOE) shows that there are 11 advanced-state offshore wind projects in the works across the country, representing over 3,800 MW of capacity.58 The projects, with estimated completion dates between 2015 and 2020, are in Texas, Massachusetts, New Jersey, Rhode Island, Delaware, Ohio, and Virginia (Dominion’s 12 MW proposal).
Neighboring Maryland is also looking to develop its offshore wind resources. In December 2013 BOEM announced its third U.S. offshore wind competitive lease auction off Maryland’s coastline.59 Maryland’s wind energy area spans roughly 80,000 acres between 10 and 30 miles due east from Ocean City and represents between 850 and 1,450 MW of potential wind power capacity, enough electricity to power approximately 300,000 homes.60
Experience overseas has shown that financial incentives are an important driver of offshore wind development. Maryland recently passed the Offshore Wind Energy Act of 2013, which created a mechanism to develop up to 500 MW of offshore wind capacity, at least 10 nautical miles off of Maryland’s coast.61 The bill, modeled after a similar program in New Jersey, allows developers to compete for offshore wind renewable energy credits (ORECs), worth up to $190 per megawatt-hour (MWh), every year for 20 years.62 Much like Germany’s feed-in tariff policy, ORECs provide a guaranteed revenue stream. This economic certainty encourages potential project developers to invest
Jim Lanard: Dominion Should Develop Offshore Wind Now, Not LaterIn October 2013, Dominion Virginia Power won an offshore lease from the U.S. Department of the Interior for over 113,000 acres set aside for wind development about 27 miles off Virginia’s coast. “It is one of 20 or 30 potential leases on the East Coast,” said Jim Lanard, former president of the Offshore Wind Development Coalition, which brings together businesses to influence federal policy.
Dominion estimates that it will take 10 years to develop the lease, and it currently has plans to build only two offshore wind test turbines in 2018. Those turbines would be capable of generating 12 megawatts of power, which is just 0.006 percent of the energy potential in Dominion’s leased wind area. Lanard said that “test turbines” are unnecessary, given the fact that, at the end of 2013, more than 2,000 offshore wind turbines had already been installed in Europe and were successfully generating up to 6,560 megawatts, or enough to power six million homes. We’ve had 20 years of experience from experts in Europe, which reduces the risk for all U.S. wind developers,” he said. “We won’t be starting from scratch.”
Virginia’s commitment to offshore wind power will face several litmus tests, Lanard said. First, there is the question of whether the state legislature will make Virginia’s clean electricity goal (15 percent by 2025) a mandatory standard as 29 other states have done, or whether it will remain purely voluntary for utilities like Dominion? Second, will Dominion actively develop an offshore wind farm in the near future?
“Other than Cape Wind,” the offshore wind farm in Massachusetts, “Dominion is currently the only potential utility scale offshore wind developer with a lease, likely guaranteed revenue stream, and customers for the power,” said Lanard. “Virginia’s citizens would greatly benefit from the job creation, economic development opportunities, and carbon reduction that an offshore wind farm off the coast of the state would deliver.”
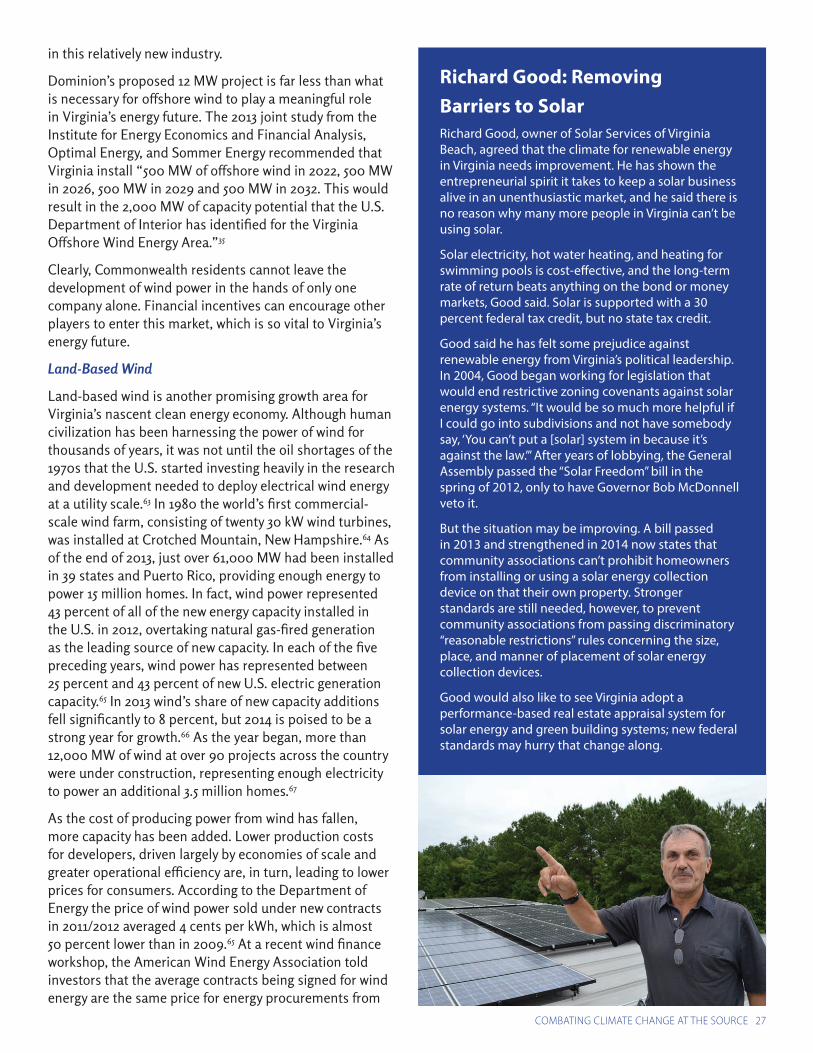
COMBATING CLIMATE CHANGE AT THE SOURCE 27
in this relatively new industry.
Dominion’s proposed 12 MW project is far less than what is necessary for offshore wind to play a meaningful role in Virginia’s energy future. The 2013 joint study from the Institute for Energy Economics and Financial Analysis, Optimal Energy, and Sommer Energy recommended that Virginia install “500 MW of offshore wind in 2022, 500 MW in 2026, 500 MW in 2029 and 500 MW in 2032. This would result in the 2,000 MW of capacity potential that the U.S. Department of Interior has identified for the Virginia Offshore Wind Energy Area.”35
Clearly, Commonwealth residents cannot leave the development of wind power in the hands of only one company alone. Financial incentives can encourage other players to enter this market, which is so vital to Virginia’s energy future.
Land-Based Wind
Land-based wind is another promising growth area for Virginia’s nascent clean energy economy. Although human civilization has been harnessing the power of wind for thousands of years, it was not until the oil shortages of the 1970s that the U.S. started investing heavily in the research and development needed to deploy electrical wind energy at a utility scale.63 In 1980 the world’s first commercial-scale wind farm, consisting of twenty 30 kW wind turbines, was installed at Crotched Mountain, New Hampshire.64 As of the end of 2013, just over 61,000 MW had been installed in 39 states and Puerto Rico, providing enough energy to power 15 million homes. In fact, wind power represented 43 percent of all of the new energy capacity installed in the U.S. in 2012, overtaking natural gas-fired generation as the leading source of new capacity. In each of the five preceding years, wind power has represented between 25 percent and 43 percent of new U.S. electric generation capacity.65 In 2013 wind’s share of new capacity additions fell significantly to 8 percent, but 2014 is poised to be a strong year for growth.66 As the year began, more than 12,000 MW of wind at over 90 projects across the country were under construction, representing enough electricity to power an additional 3.5 million homes.67
As the cost of producing power from wind has fallen, more capacity has been added. Lower production costs for developers, driven largely by economies of scale and greater operational efficiency are, in turn, leading to lower prices for consumers. According to the Department of Energy the price of wind power sold under new contracts in 2011/2012 averaged 4 cents per kWh, which is almost 50 percent lower than in 2009.65 At a recent wind finance workshop, the American Wind Energy Association told investors that the average contracts being signed for wind energy are the same price for energy procurements from
Richard Good: RemovingBarriers to SolarRichard Good, owner of Solar Services of Virginia Beach, agreed that the climate for renewable energy in Virginia needs improvement. He has shown the entrepreneurial spirit it takes to keep a solar business alive in an unenthusiastic market, and he said there is no reason why many more people in Virginia can’t be using solar.
Solar electricity, hot water heating, and heating for swimming pools is cost-effective, and the long-term rate of return beats anything on the bond or money markets, Good said. Solar is supported with a 30 percent federal tax credit, but no state tax credit.
Good said he has felt some prejudice against renewable energy from Virginia’s political leadership. In 2004, Good began working for legislation that would end restrictive zoning covenants against solar energy systems. “It would be so much more helpful if I could go into subdivisions and not have somebody say, ‘You can’t put a [solar] system in because it’s against the law.’” After years of lobbying, the General Assembly passed the “Solar Freedom” bill in the spring of 2012, only to have Governor Bob McDonnell veto it.
But the situation may be improving. A bill passed in 2013 and strengthened in 2014 now states that community associations can’t prohibit homeowners from installing or using a solar energy collection device on that their own property. Stronger standards are still needed, however, to prevent community associations from passing discriminatory “reasonable restrictions” rules concerning the size, place, and manner of placement of solar energy collection devices.
Good would also like to see Virginia adopt a performance-based real estate appraisal system for solar energy and green building systems; new federal standards may hurry that change along.

COMBATING CLIMATE CHANGE AT THE SOURCE 28
a combined-cycle natural gas plant and that wind is actually about 2 cents cheaper than coal-fired electricity.68
Virginia, despite having ample wind potential, is one of only 11 states with no commercial-scale wind development.69 The National Renewable Energy Laboratory (NREL) found that Virginia’s land-based wind potential, based on current technology and excluding areas unlikely to be developed such as wilderness areas, parks, and urban areas, is 3,466 MW, which represents roughly nine percent of Virginia’s current annual electricity demand.70 Notably, the exclusion criteria in NREL’s wind potential model removes 73 percent of Virginia’s eligible windy land area from development. If just half of that excluded land were available for wind development, Virginia’s land-based wind potential would jump to 8,100 MW, roughly 21 percent of Virginia’s current annual electricity demand. Clearly land-based wind can play a strategic role in providing emissions-free energy at lower prices than other energy sources.
Meanwhile, Virginia’s neighbors are not standing still. Bolstered by falling regional wind prices and increasing clean energy requirements, West Virginia, Maryland, and Pennsylvania have developed 786 MW, 150 MW, and 1,286 MW, respectively, of wind energy over the last few years. These states also have 150 MW, 90 MW, and 270 MW, respectively, currently under construction. Additionally, 279 MW in Maryland and 1,103 MW in Pennsylvania are queued up for development pending further study.71
By contrast, Dominion’s IRP forecasts the addition of only 247 MW of land-based wind power spinning in 2024. That same scenario forecasts the development of 1,509 MW of combined cycle natural gas power and a new 1,514 MW nuclear reactor.55 In their 2013 joint study, the Institute for Energy Economics and Financial Analysis, Optimal Energy, and Sommer Energy recommended that Dominion take advantage of wind’s value as a hedge against future fossil fuel price increases and CO2 emissions costs by installing 120 MW of land-based wind in 2019, 80 MW in 2021, and 80 MW in 2022, for a total of 360 MW.35 The study authors noted that these are conservative recommendations based on estimated future trends.
In order to tap into their wind potential, a majority of states have passed Renewable Portfolio Standard (RPS) laws. An RPS is “a regulatory mandate to increase production of energy from renewable sources such as wind, solar, biomass and other alternatives to fossil and nuclear electric generation.”72 Today, 29 states and the District of Columbia have enforceable RPS laws with varying structures, enforcement mechanisms, sizes, and applications. From 1999 through 2012, 69 percent of the wind power capacity built in the United States was located in states with RPS policies; in 2012, this proportion climbed to 83 percent.73 Historically, wind energy has been the dominant contributor to fulfilling RPS mandates, with 86 percent of state RPS requirements being met with wind through 2011.74
Today Virginia has a voluntary RPS, passed in 2007, which has a non-binding goal of attaining 15 percent of Virginia’s electricity from renewable sources by 2025.75 This relatively unambitious RPS could explain the slow growth of the wind power industry in Virginia compared with other states. Astonishingly, in Dominion Virginia Power’s 2013 IRP, the company only estimates that it will increase the growth of renewable energy production by only some 0 and 1 percent over the next 15 years.
Natural BarriersAnother protective approach involves what’s called “soft engineering,” building or shoring up natural structures like sand dunes and protective marshes. On a large scale, these systems can buffer the force of a storm or provide areas for storm surges to go. These approaches have fewer drawbacks than “hard” human structures such as dams and seawalls, which can disrupt the natural mechanisms that have allowed coastal marshes to survive rising seas since at least the end of the last Ice Age.33
“Tidal marsh plants are amazing ecosystem engineers that can raise themselves upward if they remain healthy, and especially if there is sediment in the water ,” said Patrick Megonigal, a senior scientist at the Smithsonian Environmental Research Center. “We know there are limits to this, and worry those limits are changing as people change the environment.” 33

COMBATING CLIMATE CHANGE AT THE SOURCE 29
Solar Energy
Solar power is the fastest growing energy source in the U.S. In the five years between 2008 and 2013, solar capacity in the U.S. grew a phenomenal 1,565 percent, from 781 MW installed to a cumulative capacity over 13,000 MW. 76,77 In 2013 alone, solar deployment increased 41 percent over installation levels in 2012, with 4,751 MW installed around the country.77
Increasingly, that growth is concentrated within a relatively small number of states. Last year, 10 states—California, Arizona, New Jersey, Nevada, North Carolina, Massachusetts, Hawaii, Maryland, Texas, and New York—installed over 2,900 MW, or 74 percent of 2012’s total installed capacity.78 With policies encouraging solar development, these states have helped cut the costs of solar nearly in half over the last 5 years and 33 percent since 2011.78
“ In the f ive years between 2008 and 2013, solar capacity in the U.S. grew a phenomenal 1,565 percent, from 781 MW installed to a cumulative capacity of 13,000 MW.” The growth potential for solar is not bound by technical capacity. According to NREL, using technology that exists today on land suitable for solar development (excluding steeply sloping land, federally protected lands, roadless areas, areas of critical environmental concern, and urban parking lots, roads, and impervious areas), the U.S. could generate more than 75 times its annual electricity demand through solar power alone. Virginia, using the same criteria, could generate almost 17 times its annual electricity demand through solar power.79
Despite this vast potential, Virginia currently ranks near the bottom in terms of solar development across the country. According to statistics compiled by the Interstate Renewable Energy Council, out of 50 states and the District of Columbia, Virginia was 30th at the end of 2012 in terms of the amount of solar installed.77 By contrast, the U.S. Solar Energy Industry Association ranks neighboring North Carolina and Maryland fifth and eighth, respectively.80
What separates states like North Carolina and Maryland from Virginia—and other states with relatively little solar development—is policy. All of the top 10 states for solar growth have mandatory RPS laws, and 7 of those states have dedicated solar set-asides within their laws. According to “States Advancing Solar,” an initiative of Clean Energy Group, these types of solar set-asides may be necessary to reap the benefits of RPS laws. Report
Engineered SystemsAnother possible adaptation approach for coastal Virginia involves building large flood barriers. A number of these structures, among the largest engineered structures on earth, are found in Europe. The most sizeable such system is in the Netherlands, including the historic Zuiderzee Barrier north of Amsterdam and the Delta Works systems to the south, which together create 10,250 miles of dikes and an additional 300 structures.34
The Thames River barrier, just east of London, was completed in 1982 at a cost of almost a billion dollars. The flood gates have been closed over a hundred times, with increasing frequency in recent years, to protect London from North Sea flood surges. Venice, Italy, is also building a large flood barrier; the first $7 billion stage was completed in October 2013. This barrier system, known as the Experimental Electromechanical Module, has air-driven metal barriers that hold back storm surges in the three channels between Venice and the Adriatic Sea.35
While these flood barrier projects are impressive and have shown results in the short term, they will do little to protect against long-term sea level rise. These barriers are meant to hold back storm surges that create short-lived flooding events over a period of days or weeks in coastal cities. But the anticipated 1-to-2 meter sea level rise by 2100 means that these systems will have to be rebuilt and that future systems will need to be designed with sea level rise in mind.
Possible designs for similar flood protection structures for New York Harbor are being studied by a number of engineering groups. One, the Arcadis group, estimated in 2009 that a full tidal barrage system near the Verrazano Narrows Bridge would cost as much as $7 billion.36 That cost may seem huge, but it is small compared with the $42 billion in losses for New York state following hurricane Sandy in 2012.34

COMBATING CLIMATE CHANGE AT THE SOURCE 30
authors wrote that states with an RPS “should consider requiring a specific solar share percentage in recognition of the special benefits of solar installations (e.g. local job creation, ease of siting, used primarily at the point of generation, no adverse environmental impacts).”81
The Department of Energy’s State Database of State Incentives for Renewables & Efficiency recommends the following best practices for promoting solar through RPS policies:82
• Establishing an RPS with an explicit solar carve-out that ramps up over time
• Developing a mechanism for tracking, verifying and trading solar renewable energy certificates (SRECs)
• Imposing and enforcing a monetary penalty or alternative compliance payment provision for electricity suppliers that do not meet solar requirements
• Requiring long-term power-purchases or contracts for SRECs, or establishing other mechanisms that improve price certainty in order to ensure project developers can access financing
• Encouraging systems of all sizes, including smaller, distributed systems and customer-sited systems
Lifecycle Methane Leakage: The Dirty Secret of America’s Shale BoomThere are many concerns about the environmental impacts of hydraulic fracturing, or “fracking,” from the composition of fracking solutions to the impact on local water quality. In terms of climate change, however, the main worry is the fact that natural gas is 80 percent to 98 percent methane – which is approximately 85 times as potent a greenhouse gas as carbon dioxide – and that this methane escapes into the atmosphere.
Current estimates vary regarding the quantities of methane that leak out during the natural gas lifecycle, but estimates range from 1.4 percent to over 10 percent of the total amount of gas produced. A study published in the journal Science by researchers from Stanford, Harvard, MIT, the National Oceanic and Atmospheric Administration, the National Renewable Energy Laboratory and others in February 2014 concluded that the EPA is underestimating gas sector methane emissions by 50 percent.38 The National Oceanic and Atmospheric Administration and the University of Colorado at Boulder recently measured leakage rates between 6 percent and 12 percent at hydraulic fracturing gas fields in Utah.39
Another recent study, published in the Proceedings of the National Academies of Science, directly measured methane emission from fracked wells in southwestern Pennsylvania and found that several well pads leak methane at levels two to three orders of magnitude (100 to 1,000 times) greater than EPA estimates.40 These leakage rates are well above the 2.7 percent leakage threshold necessary to ensure that natural gas has an immediate climate benefit when “fuel-switching” from coal to natural gas for power generation, and above the 0.8 percent leakage threshold needed for an immediate climate benefit when engines in heavy-duty vehicles are switched from diesel to compressed natural gas.41

COMBATING CLIMATE CHANGE AT THE SOURCE 31
Jobs in the Renewable Energy SectorThe U.S. Bureau of Labor Statistics defines green jobs as jobs in businesses that produce goods or provide services that benefit the environment or conserve natural resources, or in which workers’ duties involve making their establishment’s production processes more environmentally friendly.83 According to this definition, in 2011 there were 3,401,279 green jobs in the U.S., employing 2.6 percent of all employed people. Nearly three-quarters of these jobs (2,515,200) were in the private sector, with the balance in the public sector.
The clean energy sector is driving much of this job growth. According to a 2011 Brookings Institute study, approximately one million green jobs in 2010 were in the clean energy sector, which includes renewables and energy efficiency.84 According to the study, between 2003 and 2010, four out of five of the fastest-growing segments of the green economy were in renewable energy, “adding jobs at an elevated rate in each year-over-year period.” In 2013 alone, more than 78,600 clean energy and clean transportation jobs were announced at 260 projects in the U.S. The top five states creating those jobs were those with robust clean energy programs: California, Texas, Hawaii,
Maryland, and Massachusetts. Each of those states saw the creation of between 4,500 and 15,400 new jobs.85 Each of these states also has aggressive RPS policies, and three out of five of those RPS policies have solar/distributed generation provisions.86,87
The 2011 Brookings study also found that by the end of 2012, the clean energy economy would employ some 2.7 million American workers, making it a bigger employer than the fossil fuel industry, which supports approximately 2.4 million American jobs.84
“ According to the Center for American Progress, per dollar spent, a ‘clean-energy investment agenda generates approximately 3.2 times the number of jobs within the United States as does spending the same amount of money within the fossil fuel sectors.’”
According to the Center for American Progress, per dollar spent, a “clean-energy investment agenda generates approximately 3.2 times the number of jobs within the United States as does spending the same amount of money within the fossil fuel sectors.” This differential is explained by the fact that the clean energy industry is labor-intensive and inherently U.S.-based, and it utilizes a diverse range of employees across different salary scales.88 The Union of Concerned Scientists corroborated that “compared with fossil fuel technologies, which are typically mechanized and capital intensive, the renewable energy industry is more labor-intensive. This means that, on average, more jobs are created for each unit of
Who Pays?Currently, most of the funding for local adaptation efforts comes from cost-sharing arrangements with the U.S. Army Corps of Engineers (USACE).42 For smaller adaptation efforts (less than $11 million), localities can send letters of request to the Corps of Engineers through their Continuing Authorities Program to initiate a project. If such adaptations are accepted by the USACE headquarters, the Corps will share about half of the cost of the project with their partners at the state or local level.43
Larger projects are also funded in large measure by USACE, but they require separate authorization from Congress. A lengthy 21-step process is required to initiate these projects, which can take many years and involve multiple funding appropriations from Congress and layers of review from other federal agencies. Projects constructed through this process—such as the Gathright Dam in Alleghany County, the Norfolk Floodwall, and the Virginia Beach Hurricane Storm Damage Reduction Project—can cost hundreds of millions of dollars and are funded through a mix of federal and non-federal funds.43
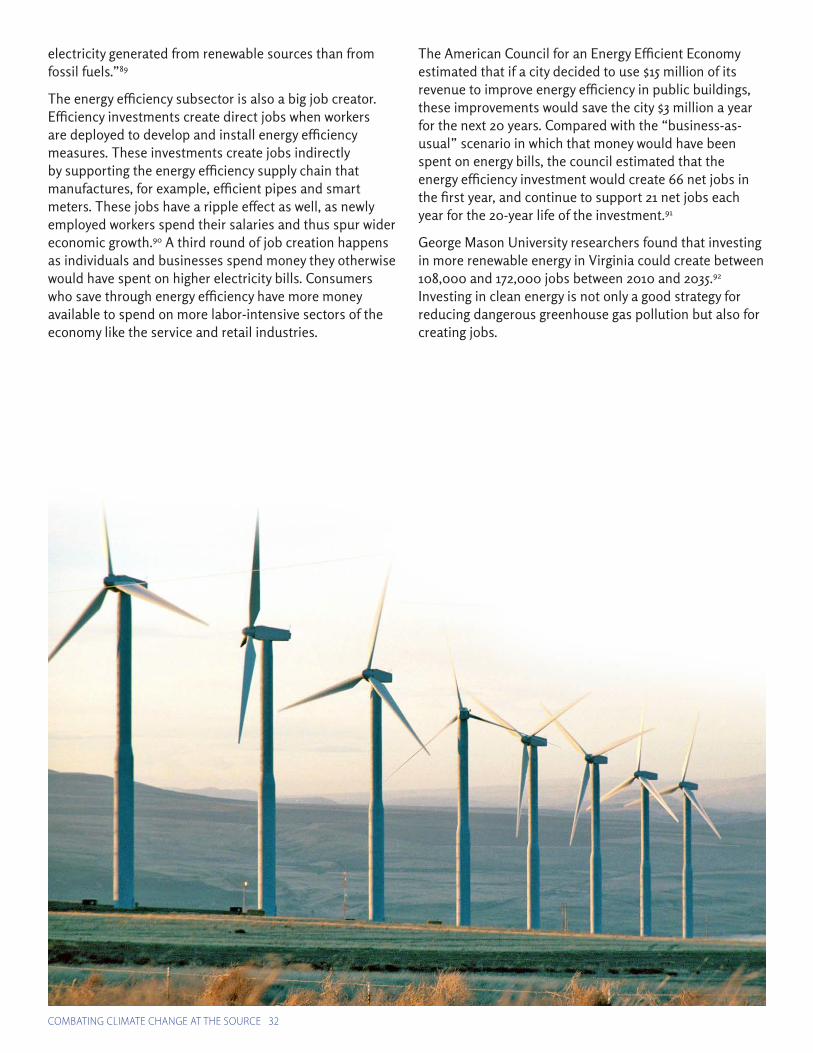
COMBATING CLIMATE CHANGE AT THE SOURCE 32
electricity generated from renewable sources than from fossil fuels.”89
The energy efficiency subsector is also a big job creator. Efficiency investments create direct jobs when workers are deployed to develop and install energy efficiency measures. These investments create jobs indirectly by supporting the energy efficiency supply chain that manufactures, for example, efficient pipes and smart meters. These jobs have a ripple effect as well, as newly employed workers spend their salaries and thus spur wider economic growth.90 A third round of job creation happens as individuals and businesses spend money they otherwise would have spent on higher electricity bills. Consumers who save through energy efficiency have more money available to spend on more labor-intensive sectors of the economy like the service and retail industries.
The American Council for an Energy Efficient Economy estimated that if a city decided to use $15 million of its revenue to improve energy efficiency in public buildings, these improvements would save the city $3 million a year for the next 20 years. Compared with the “business-as-usual” scenario in which that money would have been spent on energy bills, the council estimated that the energy efficiency investment would create 66 net jobs in the first year, and continue to support 21 net jobs each year for the 20-year life of the investment.91
George Mason University researchers found that investing in more renewable energy in Virginia could create between 108,000 and 172,000 jobs between 2010 and 2035.92 Investing in clean energy is not only a good strategy for reducing dangerous greenhouse gas pollution but also for creating jobs.

VIRGINIA SAFE COASTPOLICY RECOMMENDATIONS:
A 10-Point Plan for Protecting Our Coastand Promoting Solutions to Climate Change

VIRGINIA SAFE COAST POLICY RECOMMENDATIONS 34
Rising tides are lapping at Virginia’s shores, and bold action is now necessary to put the Commonwealth on a path towards greater sustainability.
Just last September, the United States Environmental Protection Agency issued a proposal to regulate CO2 emissions from new power plants under the authority of the Clean Air Act, noting the need to “combat climate change and improve public health.” The proposed pollution limits, which are 51 percent lower than the average emissions rate for U.S. coal-fired power, make it very unlikely that new coal-fired power plants will be built unless significant and costly investments are made in carbon capture technology.93
Moreover, in June 2014 the EPA issued proposed rules for existing power plants to reduce their carbon pollution nationwide by 25 percent below 2005 levels by 2020 and 30 percent below 2005 levels by 2030.94 As states begin to explore how these new rules will impact their energy sector, it is now clear that Virginia—along with every other state in the nation—will have to figure out a way to reduce its greenhouse gas output in a fair, efficient, and cost-effective way.
When it comes to developing effective climate change policy, delay is no longer an option. Virginia’s Commission on Climate Change, created by then-Governor Tim Kaine, issued its final report in 2008, and Governor Terry McAuliffe has said his administration will revisit the report’s recommendations. Those recommendations must be updated based on recent scientific research and technological advancements to form a set of climate change policy goals for the McAuliffe administration. These goals should lay out a vision for how Virginia can meet new federal GHG reduction standards, achieve even greater GHG reductions in order to avoid the worst consequences of climate change, and protect coastal communities from sea level rise and extreme weather through adaptation policy.
The following is a set of 10 recommendations for how Virginia can cut GHG emissions, better protect its vulnerable coastal communities, and position itself as a global market leader in the growing clean technology sector. The Commonwealth should move quickly to adopt some or all of these recommendations and set strong policies into law to ensure their implementation.
Introduction

MITIGATION1. Regulate greenhouse gases: The Commonwealth of Virginia should join the Regional Greenhouse
Gas Initiative (RGGI). This initiative currently caps CO2 from power plants in nine states from Maine to Maryland. Virginia should join RGGI or drive the development of a similar regional collaboration among other southeastern states. This would help the Commonwealth to comply with new federal CO2 regulations through a flexible, market-based system that could also generate new and significant funds—as much as $209 million per year—for coastal adaptation measures.
2. Enact a mandatory energy eff iciency resource standard: The Commonwealth should capture Virginia’s untapped energy efficiency potential and reap the associated environmental and jobs benefits by setting ambitious, mandatory energy reduction goals for the Commonwealth.
3. Enact a mandatory clean electricity standard with a cap on old facilities: The Commonwealth should make Virginia’s clean electricity standard more ambitious and legally binding while placing reasonable limits on the eligibility of decades-old energy facilities like those involving hydropower and biomass.
4. Encourage signif icant development of solar power: The Commonwealth should set a mandatory “solar carve-out” goal for Virginia and clear the regulatory hurdles that stymie solar development.
5. Encourage signif icant development of offshore wind: Virginia’s elected leaders should call on Congress to immediately pass the federal investment tax credit and enact a state policy framework to make the Commonwealth a more attractive place in which to invest in offshore wind.
ADAPTATION6. Provide dedicated state funding for adaptation efforts in Virginia’s Tidewater region: After joining the
Regional Greenhouse Gas Initiative (RGGI) or forming a similar group with neighboring states, Virginia should dedicate much of the CO2 allowance-auction revenue to climate adaptation efforts in the Tidewater region. This move could raise as much as $209 million per year while diversifying Virginia’s stream of adaptation revenue to include more state-based, non-federal dollars.
7. Form an integrated task force focused on protecting military assets: The Commonwealth should gather experts to coordinate adaptation planning between military leaders and Virginia’s “joint subcommittee on recurrent flooding.”
8. Improve emergency planning in Hampton Roads for climate-related disasters: The efforts between state and local planning officials should be coordinated to improve evacuation and emergency shelter management efforts.
9. Protect communities through “living shoreline” adaptation measures: Localities should work closely with state agencies to develop comprehensive, site-specific living shoreline plans.
10. Develop local accommodation strategies along with state and local partnerships to evaluate “strategic retreat” from vulnerable areas: A set of actions to preserve the continued use of coastal lands should be developed. It is also important to evaluate the necessity and logistics of moving people, ecosystems, and development away from areas forecasted to be permanently affected by climate change in the next century.
VIRGINIA SAFE COAST POLICY RECOMMENDATIONS 35

MITIGATION
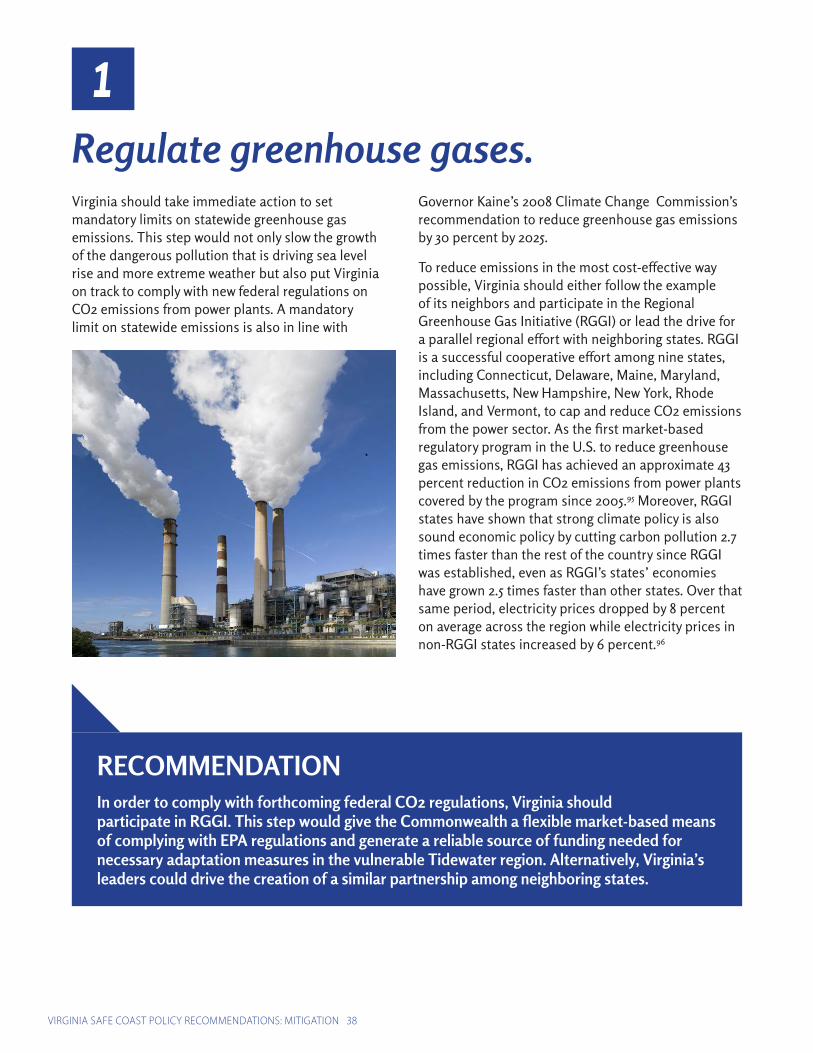
VIRGINIA SAFE COAST POLICY RECOMMENDATIONS: MITIGATION 38
1
Virginia should take immediate action to set mandatory limits on statewide greenhouse gas emissions. This step would not only slow the growth of the dangerous pollution that is driving sea level rise and more extreme weather but also put Virginia on track to comply with new federal regulations on CO2 emissions from power plants. A mandatory limit on statewide emissions is also in line with
Governor Kaine’s 2008 Climate Change Commission’s recommendation to reduce greenhouse gas emissions by 30 percent by 2025.
To reduce emissions in the most cost-effective way possible, Virginia should either follow the example of its neighbors and participate in the Regional Greenhouse Gas Initiative (RGGI) or lead the drive for a parallel regional effort with neighboring states. RGGI is a successful cooperative effort among nine states, including Connecticut, Delaware, Maine, Maryland, Massachusetts, New Hampshire, New York, Rhode Island, and Vermont, to cap and reduce CO2 emissions from the power sector. As the first market-based regulatory program in the U.S. to reduce greenhouse gas emissions, RGGI has achieved an approximate 43 percent reduction in CO2 emissions from power plants covered by the program since 2005.95 Moreover, RGGI states have shown that strong climate policy is also sound economic policy by cutting carbon pollution 2.7 times faster than the rest of the country since RGGI was established, even as RGGI’s states’ economies have grown 2.5 times faster than other states. Over that same period, electricity prices dropped by 8 percent on average across the region while electricity prices in non-RGGI states increased by 6 percent.96
RECOMMENDATION In order to comply with forthcoming federal CO2 regulations, Virginia shouldparticipate in RGGI. This step would give the Commonwealth a flexible market-based means of complying with EPA regulations and generate a reliable source of funding needed for necessary adaptation measures in the vulnerable Tidewater region. Alternatively, Virginia’s leaders could drive the creation of a similar partnership among neighboring states.
Regulate greenhouse gases.
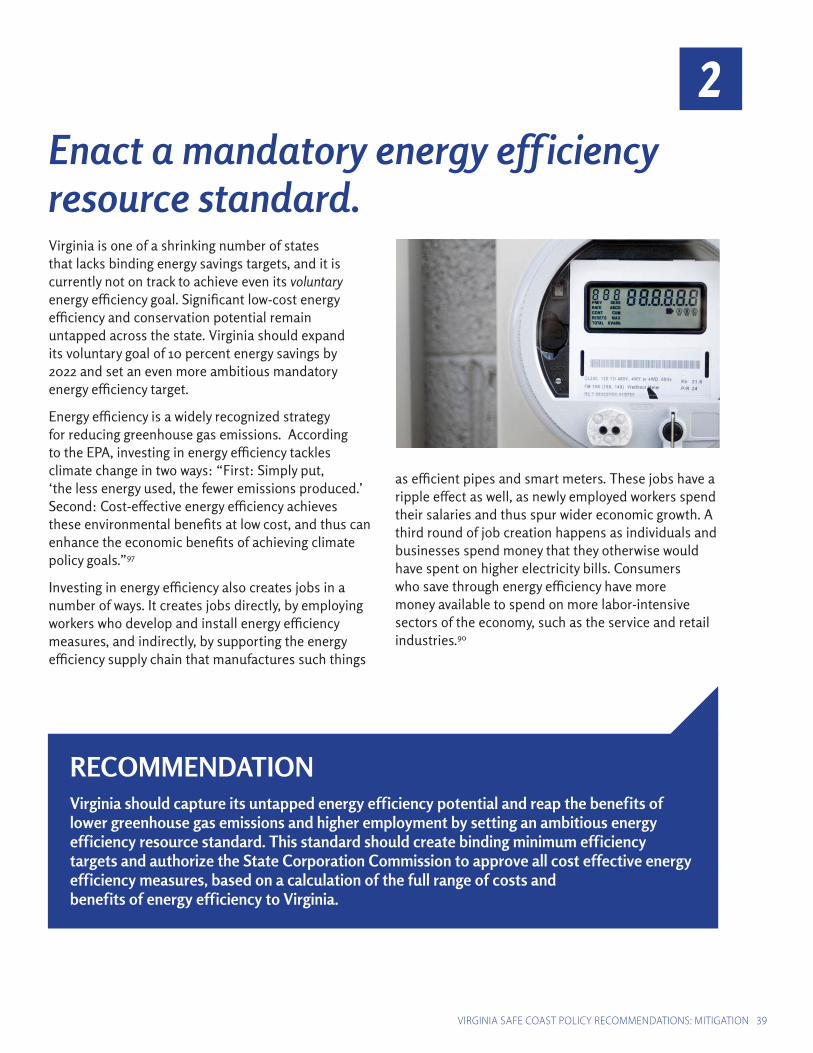
VIRGINIA SAFE COAST POLICY RECOMMENDATIONS: MITIGATION 39
2
Virginia is one of a shrinking number of states that lacks binding energy savings targets, and it is currently not on track to achieve even its voluntary energy efficiency goal. Significant low-cost energy efficiency and conservation potential remain untapped across the state. Virginia should expand its voluntary goal of 10 percent energy savings by 2022 and set an even more ambitious mandatory energy efficiency target.
Energy efficiency is a widely recognized strategy for reducing greenhouse gas emissions. According to the EPA, investing in energy efficiency tackles climate change in two ways: “First: Simply put, ‘the less energy used, the fewer emissions produced.’ Second: Cost-effective energy efficiency achieves these environmental benefits at low cost, and thus can enhance the economic benefits of achieving climate policy goals.”97
Investing in energy efficiency also creates jobs in a number of ways. It creates jobs directly, by employing workers who develop and install energy efficiency measures, and indirectly, by supporting the energy efficiency supply chain that manufactures such things
as efficient pipes and smart meters. These jobs have a ripple effect as well, as newly employed workers spend their salaries and thus spur wider economic growth. A third round of job creation happens as individuals and businesses spend money that they otherwise would have spent on higher electricity bills. Consumers who save through energy efficiency have more money available to spend on more labor-intensive sectors of the economy, such as the service and retail industries.90
RECOMMENDATION Virginia should capture its untapped energy efficiency potential and reap the benefits of lower greenhouse gas emissions and higher employment by setting an ambitious energy efficiency resource standard. This standard should create binding minimum efficiency targets and authorize the State Corporation Commission to approve all cost effective energy efficiency measures, based on a calculation of the full range of costs andbenefits of energy efficiency to Virginia.
Enact a mandatory energy eff iciencyresource standard.

VIRGINIA SAFE COAST POLICY RECOMMENDATIONS: MITIGATION 40
3
Twenty-nine states have already passed mandatory renewable portfolio standard (RPS) laws, a move that allows them to significantly expand their renewable energy development. RPS laws require states to obtain a growing portion of their electricity from renewable energy and have been one of the dominant drivers of clean energy growth in this country. Between 1999 and 2012, 69 percent of the wind power capacity built in the United States was located in states with RPS policies; in 2012, this proportion rose to 83 percent.73
Today, Virginia has a voluntary RPS, passed in 2007, that sets a goal of attaining 15 percent of Virginia’s electricity from renewable sources by 2025. To date, however, there are no commercial-scale wind or solar projects in the Commonwealth. Additionally, Virginia’s current RPS policy allows the unrestricted eligibility of old hydro facilities, many of which were built prior to World War II, as well as decades-old biomass facilities that have the potential to pollute at levels on par with coal. Given the fact that commercial-scale renewable energy projects have yet to take root in Virginia, it is hard to see why Virginians should pay a premium for aging hydro and biomass facilities that could be operating even without an RPS. By diverting funding away from the development of new clean energy
technologies, the old hydro and biomass resources prevent the deployment of climate change solutions that reduce pollution below current levels and create new jobs.
RECOMMENDATION Virginia’s RPS should be strengthened by setting a more ambitious legally binding target. Virginia should also get more out of its current RPS by limiting the amount of compliance that can be fulfilled by decades-old energy facilities like those involving hydro and biomass, which do not advance environmental or economic development goals. In order to lower greenhouse gas emissions and create new jobs, Virginia’s RPS policy should encourage the construction of new clean energy projects.
Dominion Virginia Power’s Yorktown Coal-Fired Power Station located on the York River in Yorktown, Virginia
Enact a mandatory clean electricity standard with a cap on old facilities.

VIRGINIA SAFE COAST POLICY RECOMMENDATIONS: MITIGATION 41
4
Solar power creates jobs. Of the 10 states with the highest levels of clean energy job creation in 2013, as ranked by Environmental Entrepreneurs,85 half of them also rank among the 10 states with the highest levels of solar energy development, according to the Solar Energy Industry Association.99 Unfortunately, Virginia lags far behind its peers in these areas, despite its great potential. Virginia has enough land suitable for solar development to power the Commonwealth 17 times over—simply by using technology that exists today.99 The state should take a number of steps to develop solar power with its abundant resources.
First, the Commonwealth’s RPS should be amended to include a solar carve-out. By requiring that a certain percentage of Virginia’s electricity comes from solar, this provision would go a long way toward establishing a robust solar market in Virginia and delivering the associated clean energy and jobs benefits.
Further, the 2013 state law (now codified in § 67-701) that prevents community associations from prohibiting the installation or use of a solar energy collection device on an owner’s property needs clarification. Community associations are still allowed to establish “reasonable restrictions concerning the size, place, and manner of placement of such solar energy collection devices on property designated and intended for individual ownership and use.” The definition of “reasonable restrictions” must be more clearly articulated to make sure that this provision cannot be used to unfairly discriminate against solar power in the market place.
The Commonwealth should also encourage third-party power purchase agreements (PPAs) for solar financing.
The model works as follows: “An installer/developer builds a solar energy system on a customer’s property at no cost. The solar energy system offsets the customer’s electric utility bill, and the developer sells the power generated to the customer at a fixed rate, typically lower than the local utility. At the end of the PPA contract term, property owners can extend the contract and even buy the solar energy system from the developer.”100
States using this model have found it to be a successful way to develop solar power. In California, for example, more residential solar systems were financed through third-party developers than through traditional cash purchases in 2011. A third-party model financed 80 percent of residential solar installations in Colorado in the first months of 2012.100 Crucially, both California and Colorado passed legislation encouraging PPAs by explicitly excluding third-party owned systems from being considered utilities.101
The third-party PPA model is proving to be highly successful; in fact, GTM Research forecasts that the third-party-owned residential solar market will be worth $5.7 billion by 2016.80 Recognizing this financial model’s growing importance to solar development, the National Renewable Energy Laboratory released a guidance document for states and jurisdictions in 2010 outlining the regulatory and legislative challenges associated with third-party solar financing along with practical solutions that have been implemented around the country to overcome those challenges.101 Policymakers should consult that 2010 report as the Commonwealth seeks to increase the size of its local solar industry.
RECOMMENDATION Virginia should establish a market for in-state solar by setting a solar carve-out goal in the state’s RPS. In order to meet that goal, Virginia should clear the regulatory hurdles that stymie solar development, for example by clarifying community association “reasonable restrictions” rules so they do not discriminate against solar. Virginia should also take actions, including those recommended by the National Renewable Energy Laboratory, to explicitly exclude systems owned by third-parties from being considered utilities and to advance the adoption of third-party solar power purchase agreements.
Encourage signif icant development of solar power.

VIRGINIA SAFE COAST POLICY RECOMMENDATIONS: MITIGATION 42
5
Offshore wind is one of Virginia’s most promising and scalable renewable energy resources. Located next to densely populated urban centers where electricity demand is growing, energy prices are highest, and space for land-based wind development is limited, Virginia’s offshore land, which extends 50 nautical miles off the coast, could sustain enough wind power to almost quintuple the Commonwealth’s electricity generation capacity.102
Looking toward the long term, Virginia should be much more ambitious in its development of offshore wind. Dominion Virginia Power’s current 15-year energy outlook, or Integrated Resource Plan, calls for the development of a mere 12 megawatt (MW) pilot offshore wind program in 2018, even though the utility recently won the rights to develop much more than that. In September 2013, the U.S. Bureau of Ocean Energy Management awarded Dominion a lease block that would support 2,000 MW of offshore wind—enough electricity to power approximately 700,000 homes—if the area were fully developed. Dominion should move rapidly to develop the significant clean energy potential of wind power.
A critical step toward developing wind power is the extension of the federal investment tax credit (ITC), which expired on the last day of 2013. This incentive allowed developers to take a tax credit on 30 percent of capital expenditures related to wind projects. Its extension is vital to ensuring the economic viability of offshore wind farms. Efforts to renew and extend the ITC are underway on Capitol Hill, and Virginia’s elected leaders should call on Congress to immediately pass it, knowing that a fully developed offshore wind industry has the capacity to add more than 10,000 full-time career-length jobs to the Commonwealth.103
Virginia should also explore other state policies to encourage offshore wind development, including two identified by the National Resource Defense Council (NRDC).106 One policy would be to create Offshore Renewable Energy Credits (ORECs) to ensure more revenue certainty. ORECs can be sold by offshore wind operators to electric utilities, creating a guaranteed revenue stream above the market price of electricity. Requiring utilities to buy some quantity of ORECs is an effective policy strategy that other states, such as Maryland and New Jersey, are pursuing to attract offshore wind investment near their shores.
Another option identified by the NRDC is to create public-private co-lending programs through a state “green bank” in order to ensure sufficient and affordable debt capital. Green banks, which are now operating in a handful of states, could issue bonds, repurpose existing funds, or help finance a limited number of initial projects under the auspices of a public-private financing institution focused on clean energy.
RECOMMENDATION Because the extension of the federal ITC is necessary for offshore wind farm viability, Virginia’s elected leaders should call on Congress to immediately pass this tax credit. Virginia should also put in place a state policy framework to make the Commonwealth a more attractive place in which to invest. That framework could include the creation of Offshore Renewable Energy Credits to ensure more revenue certainty for developers, and public-private co-lending programs through state “green banks” to help finance a limited number of initial projects.
Encourage signif icant development of offshore wind.
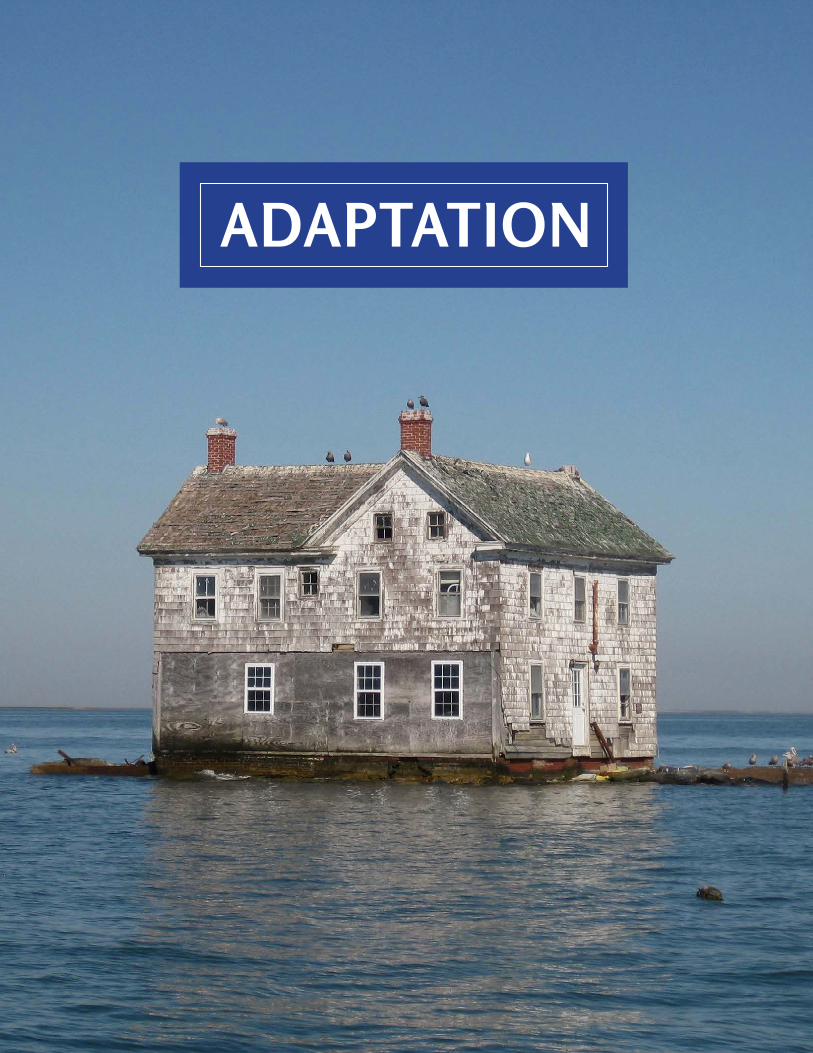
ADAPTATION

VIRGINIA SAFE COAST POLICY RECOMMENDATIONS: ADAPTATION 44
Adaptation efforts in the Tidewater region will be very expensive. A study recently commissioned by the city of Norfolk and completed by the Dutch engineering firm Fugro found that the costs to build seawalls and elevate homes in the city would exceed $1 billion.107 The city of Virginia Beach spent $1.2 million in 2013 on an interim project to install temporary measures to protect five homes, 15 garages and 570 feet of roadway in the Cape Story neighborhood. Constructing more effective measures in that neighborhood alone could cost as much as $70 million.106
Currently, most of the funding for local adaptation efforts comes from cost sharing arrangements with the U.S. Army Corps of Engineers (USACE).107 Smaller projects can be funded through the USACE’s Continuing Authorities Program, which allows for a roughly 50-50 cost sharing split between USACE and localities.108 Larger projects that exceed $11 million are also often funded by USACE, although they must go
through a multi-year 21-step federal process.
Federal funds will continue to be vital sources of revenue as Tidewater Virginia braces for more turbulent weather and rising tides. But a greater diversity of funding sources would strengthen the Commonwealth’s ability to protect its shores without waiting for approval from Washington. As described in the first recommendation of this section, Virginia’s participation in RGGI or a similar regional organization would provide a much needed source of revenue. Since RGGI auctioning began in September 2008, states have raised a combined $1.8 billion in proceeds. Each state has discretion in how they spend that new revenue, and most investments have fallen into four categories: energy efficiency, clean and renewable energy, direct bill assistance, and greenhouse gas abatement and climate change adaptation programs.109
By not participating in these regional auctions, Virginia
6Provide dedicated state funding for adaptation efforts in Virginia’s Tidewater region.
House being raised in preparation for future flooding in Larchmont, Norfolk, Virginia
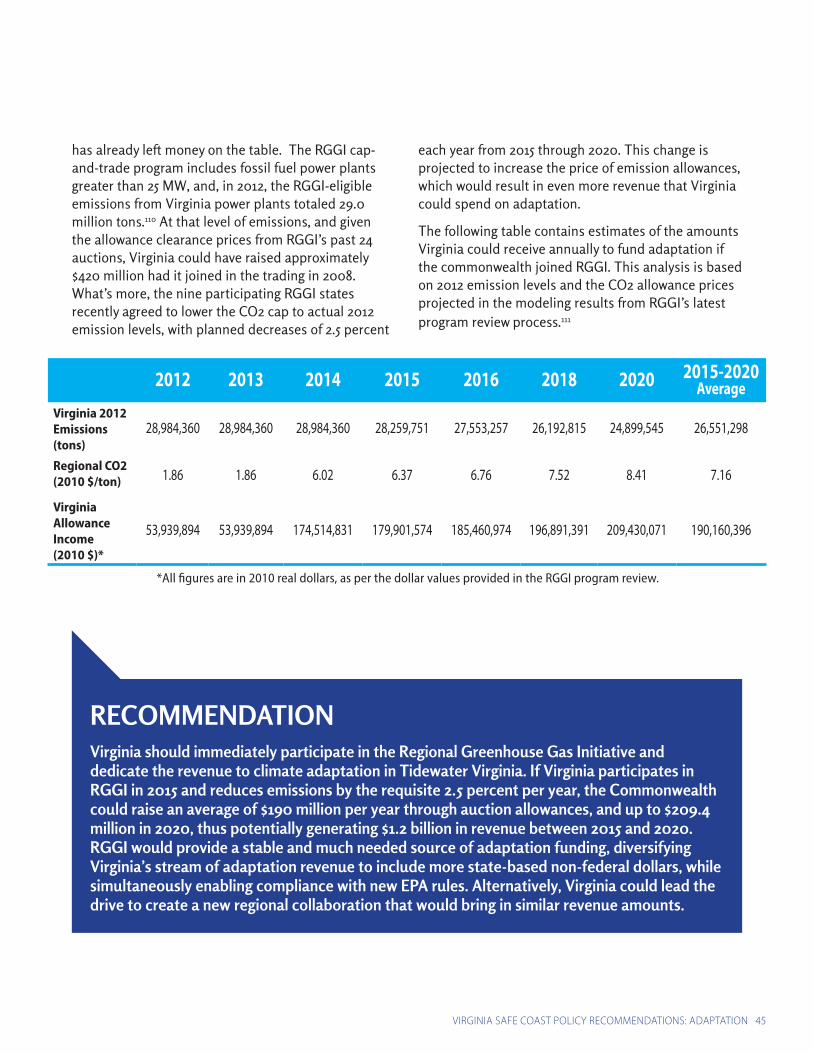
VIRGINIA SAFE COAST POLICY RECOMMENDATIONS: ADAPTATION 45
2012 2013 2014 2015 2016 2018 2020 2015-2020 Average
Virginia 2012 Emissions (tons)
28,984,360 28,984,360 28,984,360 28,259,751 27,553,257 26,192,815 24,899,545 26,551,298
Regional CO2 (2010 $/ton) 1.86 1.86 6.02 6.37 6.76 7.52 8.41 7.16
Virginia Allowance Income(2010 $)*
53,939,894 53,939,894 174,514,831 179,901,574 185,460,974 196,891,391 209,430,071 190,160,396
*All figures are in 2010 real dollars, as per the dollar values provided in the RGGI program review.
has already left money on the table. The RGGI cap-and-trade program includes fossil fuel power plants greater than 25 MW, and, in 2012, the RGGI-eligible emissions from Virginia power plants totaled 29.0 million tons.110 At that level of emissions, and given the allowance clearance prices from RGGI’s past 24 auctions, Virginia could have raised approximately $420 million had it joined in the trading in 2008. What’s more, the nine participating RGGI states recently agreed to lower the CO2 cap to actual 2012 emission levels, with planned decreases of 2.5 percent
each year from 2015 through 2020. This change is projected to increase the price of emission allowances, which would result in even more revenue that Virginia could spend on adaptation.
The following table contains estimates of the amounts Virginia could receive annually to fund adaptation if the commonwealth joined RGGI. This analysis is based on 2012 emission levels and the CO2 allowance prices projected in the modeling results from RGGI’s latest program review process.111
RECOMMENDATION Virginia should immediately participate in the Regional Greenhouse Gas Initiative and dedicate the revenue to climate adaptation in Tidewater Virginia. If Virginia participates in RGGI in 2015 and reduces emissions by the requisite 2.5 percent per year, the Commonwealth could raise an average of $190 million per year through auction allowances, and up to $209.4 million in 2020, thus potentially generating $1.2 billion in revenue between 2015 and 2020. RGGI would provide a stable and much needed source of adaptation funding, diversifying Virginia’s stream of adaptation revenue to include more state-based non-federal dollars, while simultaneously enabling compliance with new EPA rules. Alternatively, Virginia could lead the drive to create a new regional collaboration that would bring in similar revenue amounts.

VIRGINIA SAFE COAST POLICY RECOMMENDATIONS: ADAPTATION 46
The Strategic Environmental Research and Development Program (SERDP) within the Department of Defense (DoD) warns that climate change is a threat to military readiness and infrastructure, and that future climate conditions need to be incorporated into “planning, design, and operations of military facilities.”8 DoD military facilities are absolutely vital to the Hampton Roads region: Defense-related activities and spending account for 41 percent of the region’s economy, generates approximately $35.2 billion in gross regional product annually, and supports about 393,000 jobs.112
The SERDP study warned that the civil infrastructure on which military installations depend—such as drinking water wells, transportation, utility corridors, and storm water conveyance systems—may already be vulnerable to climate change-related impacts and will likely become more vulnerable over time. The study also named several
states and municipalities that are already addressing coastal infrastructure as part of their vulnerability and adaptation planning. These local civilian efforts, “particularly those designed to reduce the vulnerability of energy systems and transportation,” can greatly reduce military vulnerability and “influence DOD capacity to ensure installation readiness and to deploy forces.”
SERDP also advised that coordination between military installations and state and local government is vital for “optimal outcomes.” A joint resolution passed during Virginia’s 2014 legislative session will establish a joint subcommittee to formulate recommendations for the development of a comprehensive and coordinated planning effort to address “recurrent flooding” (HJ 16 / SJ 3). The joint subcommittee will have a total of 11 members, with 8 legislative members (5 from the House of Delegates and 3 from the Senate) and 3 non-legislative citizen members (1 business leader, 1 representative of the environmental community, and 1 local official representing Virginia’s flood-prone communities). This subcommittee will recommend short- and long-term adaptation strategies.
This subcommittee is currently Virginia’s best vehicle for establishing a strategic long-term plan for coastal adaptation, but it lacks a military representative. This subcommittee must coordinate with Virginia’s coastal military installations to ensure that the Commonwealth’s “recurrent flooding” adaptation strategy thoroughly addresses military installations, defense infrastructure, and military readiness.
7
RECOMMENDATION Governor McAuliffe should immediately form an integrated task force of experts to coordinate between military installations and Virginia’s joint subcommittee on recurrent flooding. The task force should work with the military to formulate recommendations to reduce military vulnerability in the Hampton Roads region and work with Virginia’s joint subcommittee to incorporate those recommendations into the group’s short- and long-term adaptation strategies.
Form an integrated task force focused on protecting military assets.
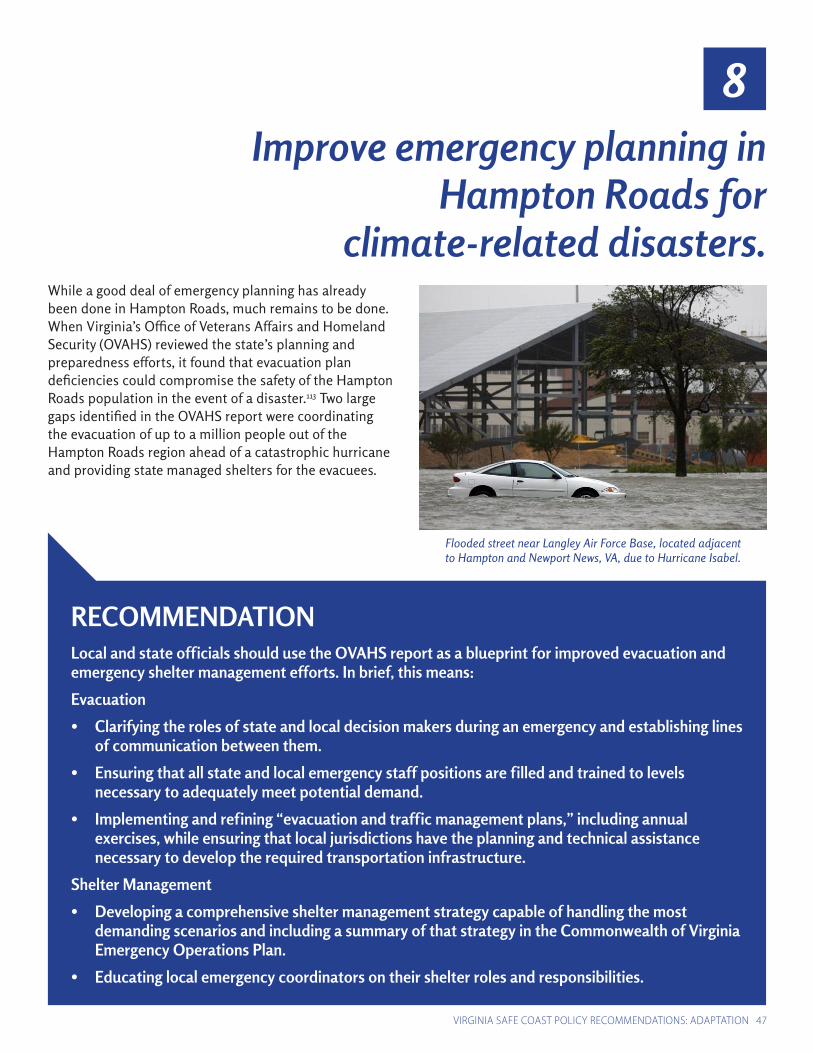
VIRGINIA SAFE COAST POLICY RECOMMENDATIONS: ADAPTATION 47
Improve emergency planning in Hampton Roads for
climate-related disasters.
RECOMMENDATION Local and state officials should use the OVAHS report as a blueprint for improved evacuation and emergency shelter management efforts. In brief, this means:
Evacuation
• Clarifying the roles of state and local decision makers during an emergency and establishing lines of communication between them.
• Ensuring that all state and local emergency staff positions are filled and trained to levels necessary to adequately meet potential demand.
• Implementing and refining “evacuation and traffic management plans,” including annual exercises, while ensuring that local jurisdictions have the planning and technical assistance necessary to develop the required transportation infrastructure.
Shelter Management
• Developing a comprehensive shelter management strategy capable of handling the most demanding scenarios and including a summary of that strategy in the Commonwealth of Virginia Emergency Operations Plan.
• Educating local emergency coordinators on their shelter roles and responsibilities.
8
Flooded street near Langley Air Force Base, located adjacentto Hampton and Newport News, VA, due to Hurricane Isabel.
While a good deal of emergency planning has already been done in Hampton Roads, much remains to be done. When Virginia’s Office of Veterans Affairs and Homeland Security (OVAHS) reviewed the state’s planning and preparedness efforts, it found that evacuation plan deficiencies could compromise the safety of the Hampton Roads population in the event of a disaster.113 Two large gaps identified in the OVAHS report were coordinating the evacuation of up to a million people out of the Hampton Roads region ahead of a catastrophic hurricane and providing state managed shelters for the evacuees.

In 2010 the Hampton Roads Planning District Commission urged planners to consider the challenge of adapting to climate change as an opportunity to improve regional infrastructure so that it is “better suited to a more volatile climate” and “more resilient to the weather patterns the region already deals with.”1
There is increasing recognition that while “shoreline hardening”—that is, physical protection measures such as seawalls and storm surge barriers—may provide short-term relief for existing shorelines, these measures can in many cases cause more harm than good. The 2008 Virginia governor’s report on climate change recommended that the state avoid widespread shoreline hardening, and instead adopt policies that allow the “living shoreline” to migrate. Living shorelines involve “plants, sand, and limited use of rock to provide shoreline protection and maintain valuable habitat.” These types of projects can stabilize the shoreline, protect the surrounding riparian and intertidal environment, improve water quality via filtration of upland run-off, and create new habitats for aquatic and terrestrial species.26
In the long term, coastal resiliency requires adaptation to the new shoreline rather than attempting to preserve the old.27 In 2008, the Virginia General Assembly passed a law, now codified in § 28.2-104.1, that requires the development of general permit
regulations for living shorelines and encourages their use as the preferred alternative for stabilizing tidal shorelines in the Commonwealth.
9
RECOMMENDATION Living shoreline strategies should become the first option for protecting coastal communities. Localities should work closely with the State Corporation Commission and the Department of Conservation and Recreation to develop comprehensive site-specific living shoreline plans.
Protect communities through “living shoreline” adaptation measures.
VIRGINIA SAFE COAST POLICY RECOMMENDATIONS: ADAPTATION 48

In addition to protection strategies, the Hampton Roads Regional Planning Commission named two other basic categories of response to sea level rise: accommodation and retreat.1 Essentially, vulnerable coastal structures and environments can be protected from encroaching seas by either accommodating to tolerate flooding or relocating further from the coast. Accommodation and protection are the obviously preferable options for established local communities. But with rising sea levels and more extreme weather putting greater strain on Virginia’s coasts, there is an increasing need for state and local planners to
consider strategic retreat and to focus on moving economic growth away from vulnerable areas.
Accommodation strategies can include elevating buildings, beach replenishment, or enhancing wetlands. Some of these strategies, like the elevation of coastal homes by property owners, are already being implemented in some of Virginia’s coastal regions. Measures that allow water to flow under or through existing structures without causing damage can provide similar short-term benefits.
One immediate action local governments can
10
Damaged homes in Hampton, Virginia from Hurricane Isabel
Develop accommodation strategies, along with state and local partnerships
to evaluate “strategic retreat” from vulnerable areas.
VIRGINIA SAFE COAST POLICY RECOMMENDATIONS: ADAPTATION 49
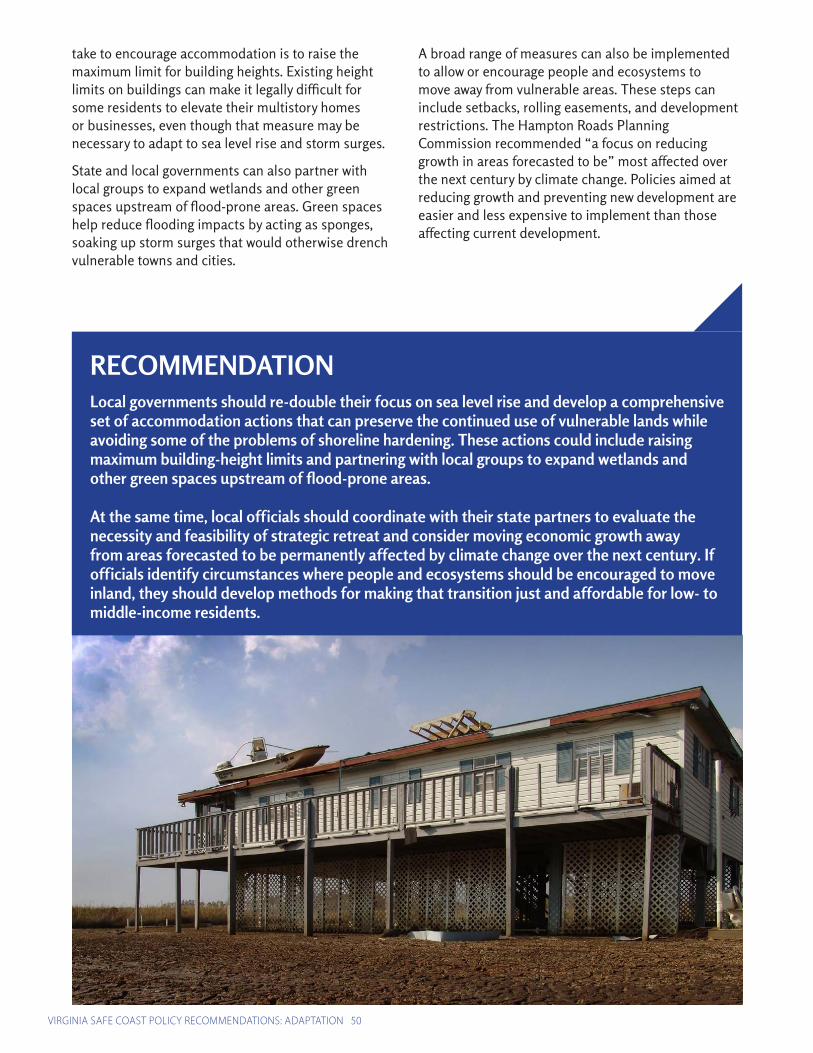
take to encourage accommodation is to raise the maximum limit for building heights. Existing height limits on buildings can make it legally difficult for some residents to elevate their multistory homes or businesses, even though that measure may be necessary to adapt to sea level rise and storm surges.
State and local governments can also partner with local groups to expand wetlands and other green spaces upstream of flood-prone areas. Green spaces help reduce flooding impacts by acting as sponges, soaking up storm surges that would otherwise drench vulnerable towns and cities.
A broad range of measures can also be implemented to allow or encourage people and ecosystems to move away from vulnerable areas. These steps can include setbacks, rolling easements, and development restrictions. The Hampton Roads Planning Commission recommended “a focus on reducing growth in areas forecasted to be” most affected over the next century by climate change. Policies aimed at reducing growth and preventing new development are easier and less expensive to implement than those affecting current development.
RECOMMENDATION Local governments should re-double their focus on sea level rise and develop a comprehensive set of accommodation actions that can preserve the continued use of vulnerable lands while avoiding some of the problems of shoreline hardening. These actions could include raising maximum building-height limits and partnering with local groups to expand wetlands and other green spaces upstream of flood-prone areas.
At the same time, local officials should coordinate with their state partners to evaluate the necessity and feasibility of strategic retreat and consider moving economic growth away from areas forecasted to be permanently affected by climate change over the next century. If officials identify circumstances where people and ecosystems should be encouraged to move inland, they should develop methods for making that transition just and affordable for low- to middle-income residents.
VIRGINIA SAFE COAST POLICY RECOMMENDATIONS: ADAPTATION 50
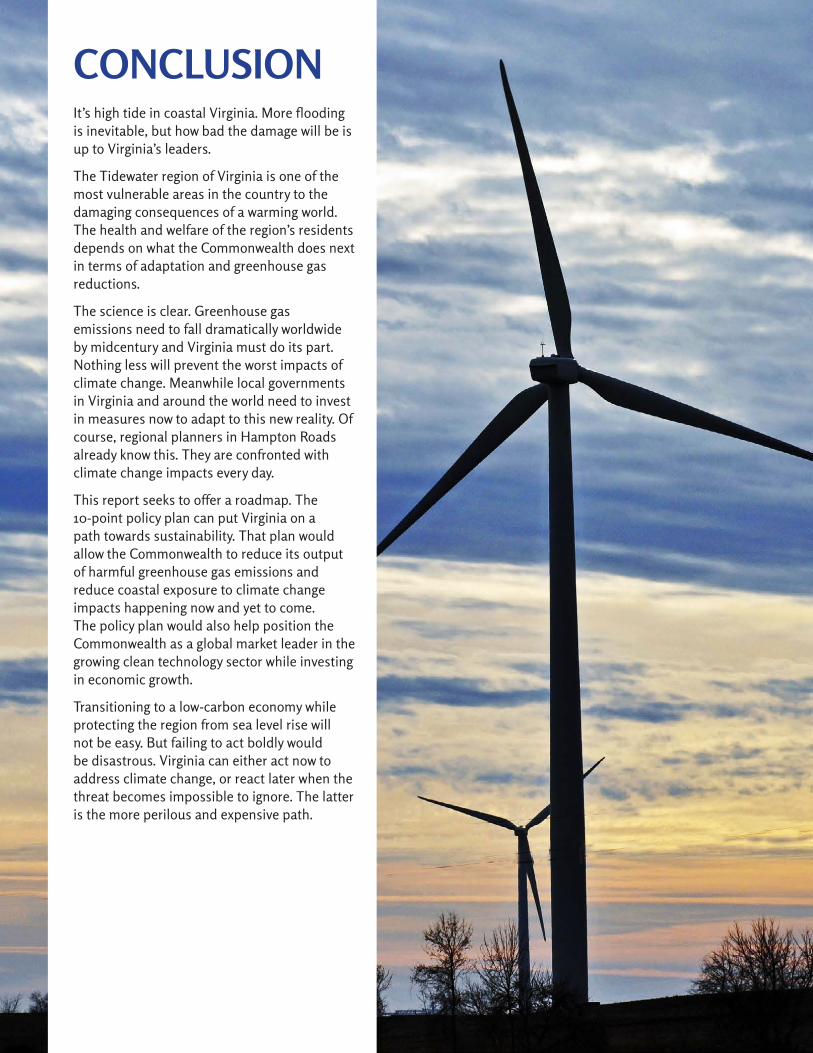
CONCLUSION 49
CONCLUSIONIt’s high tide in coastal Virginia. More flooding is inevitable, but how bad the damage will be is up to Virginia’s leaders.
The Tidewater region of Virginia is one of the most vulnerable areas in the country to the damaging consequences of a warming world. The health and welfare of the region’s residents depends on what the Commonwealth does next in terms of adaptation and greenhouse gas reductions.
The science is clear. Greenhouse gas emissions need to fall dramatically worldwide by midcentury and Virginia must do its part. Nothing less will prevent the worst impacts of climate change. Meanwhile local governments in Virginia and around the world need to invest in measures now to adapt to this new reality. Of course, regional planners in Hampton Roads already know this. They are confronted with climate change impacts every day.
This report seeks to offer a roadmap. The 10-point policy plan can put Virginia on a path towards sustainability. That plan would allow the Commonwealth to reduce its output of harmful greenhouse gas emissions and reduce coastal exposure to climate change impacts happening now and yet to come. The policy plan would also help position the Commonwealth as a global market leader in the growing clean technology sector while investing in economic growth.
Transitioning to a low-carbon economy while protecting the region from sea level rise will not be easy. But failing to act boldly would be disastrous. Virginia can either act now to address climate change, or react later when the threat becomes impossible to ignore. The latter is the more perilous and expensive path.

ENDNOTES 52
ENDNOTES1. Hampton Roads Planning District Commission. “Climate Change in Hampton Roads.” Feb. 2010. <http://www.virginia.edu/crmes/fhwa_
climate/files/HRPDC-Report-1.pdf>2. U.S. Travel Association, and Virginia Tourism Authority. The Economic Impact of Domestic Travel on Virginia Counties 2012. Aug. 2013. 3. Saunders, Stephen., et al. “Virginia Special Places in Peril.” Natural Resources Defense Council, Rocky Mountain Climate Organization. Sept. 2010.
<http://www.rockymountainclimate.org/images/VA_SpecialPlaces.pdf>4. “Executive Order: Chesapeake Bay Protection and Restoration.” The White House. 12 May 2009. <http://executiveorder.chesapeakebay.net/EO/
file.axd?file=2009%2f8%2fChesapeake+Executive+Order.pdf>5. Duffy, J. E. “Vanishing and Emerging Ecosystems of Coastal Virginia: Climate Change Impacts and Adaptation.” William & Mary Virginia Institute
for Marine Science. Oct. 2008. <http://www.vims.edu/research/units/programs/icccr/_docs/coastal_ecosystems.pdf>6. “Economic Impact of the Department of Defense in Hampton Roads.” Hampton Roads Planning District Commission, Oct. 2013.7. “Langley Air Force Base: Vulnerable to Sea Level Rise.” US Department of Defense. 2013. <http://web.ornl.gov/sci/knowledgediscovery/
Langley/docs/Langley_Air_Force_Base2.pdf>8. “Assessing Impacts of Climate Change on Coastal Military Installations: Policy Implications.” Strategic Environmental Research and
Development Program, US Departments of Defense, Energy, Environmental Protection Agency. Jan. 2013. <http://www.serdp.org/content/download/17219/192680/version/1/file/SERDP+Coastal+Assessment+White+Paper_January+2013.pdf>
9. “Severe weather in North America.” Munich Re. 2012.10. “Fifth Assessment Report, Working Group III: Mitigation of Climate Change.” Intergovernmental Panel on Climate Change. 13 Apr. 2014. <
http://www.ipcc-wg3.de/assessment-reports/fifth-assessment-report>11. Van der Hoeven, Maria. “We can have safe, sustainable energy.” The Guardian. 24 Apr. 2012. <http://www.theguardian.com/
commentisfree/2012/apr/24/we-can-have-safe-sustainable-energy>12. “How does electricity affect the environment?” United States Environmental Protection Agency. 9 Sept. 2013. <http://www.epa.gov/
cleanenergy/energy-and-you/affect/air-emissions.html>13. “Emission Guidelines for Existing Stationary Sources: Electric Utility Generating Units.” 40 CFR Part 60. 2014.14. Koch, Wendy. “Rising sea levels torment Norfolk, Va., and coastal U.S.” USA Today.18 Dec. 2013. <http://www.usatoday.com/story/news/
nation/2013/12/17/sea-level-rise-swamps-norfolk-us-coasts/3893825/>15. “Recurrent Flooding for Tidewater Virginia.” Virginia Institute of Marine Science. Senate Document No. 3. Feb. 2013. <http://ccrm.vims.edu/
recurrent_flooding/Recurrent_Flooding_Study_web.pdf>16. “Norfolk Flooding Strategy Overview.” City of Norfolk. N.d. <http://www.norfolk.gov/DocumentCenter/View/12702> 17. “Future Sea Level Change.” Future Climate Change. U.S. Environmental Protection Agency. 4 Mar. 2014. <http://www.epa.gov/climatechange/
science/future.html#sealevel>18. “Battleground Dispatches: Norfolk Readies for Future Storms, Sea Level Rise.” PBS NewsHour. 6 Dec. 2012. <http://www.pbs.org/newshour/bb/
politics-july-dec12-norfolk_12-06/>19. “How Are Flood Insurance Premium Discounts Calculated?” National Flood Insurance Program Community Rating System. Federal Emergency
Management Agency. 2 May 2014. <http://www.fema.gov/national-flood-insurance-program-community-rating-system>20. Condon, Robert H., et al. “Jellyfish blooms result in a major microbial respiratory sink of carbon in marine systems.” Proceedings of the National
Academy of Sciences 108.25 (2011): 10225-10230.21. Malmquist, David. “Study highlights under-appreciated benefit of oyster restoration.” VIMS. 7 May 2013. <http://www.vims.edu/
newsandevents/topstories/oyster_buffer.php>22. Bouchard, Joseph, “Climate Action Network 2013-06-27.” Newsletter. 27 Jun. 2013.23. Li, Honghai, Lihwa Lin, and Kelly A. Burks-Copes. “Modeling of coastal inundation, storm surge, and relative sea-level rise at Naval Station
Norfolk, Norfolk, Virginia, USA.” Journal of Coastal Research 29.1 (2012): 18-30.24. Grannis, Jessica. “Adaptation Tool Kit: Sea-Level Rise and Coastal Land Use.” Georgetown Climate Center. 31 Oct. 2011. <http://www.
georgetownclimate.org/sites/default/files/Adaptation_Tool_Kit_SLR.pdf>25. “Shoreline Armoring: The Pros and Cons.” National Oceanic and Atmospheric Administration. N.d. <http://stateofthecoast.noaa.gov/shoreline/
shoreline_armoring.html>26. “Living Shorelines.” National Oceanic and Atmospheric Administration. N.d. <http://www.habitat.noaa.gov/restoration/techniques/
livingshorelines.html> 27. Bryant, Preston, Jr. “A Climate Change Action Plan.” Virginia Governor’s Commission on Climate Change. 10 Dec. 2008. <http://www.
sealevelrisevirginia.net/docs/homepage/CCC_Final_Report-Final_12152008.pdf>28. Stiles, William, Molly Mitchell, and Troy Hartley. “Policy Climate for Climate Change in Virginia: Overview of Adaptation Policy, Planning and
Implementation Landscape.” Sea Grant Law& Policy Journal. 5 (2012): 15.29. “Battleground Dispatches: Norfolk Readies for Future Storms, Sea Level Rise.” PBS NewsHour. 6 Dec. 2012. 30. “2011 CoreLogic Storm Surge Report.” CoreLogic. 3 May 2011.31. Adams, Kathy. “Va. Beach Weighs $1.2M Temporary Fix for Flooding.” The Virginian-Pilot. 23 Jun. 2013. <http://hamptonroads.com/2013/06/va-
beach-weighs-12m-temporary-fix-flooding>32. From the U.S. Environmental Protection Agency’s Greenhouse Gas (GHG) Customized Search, which retrieves data from the GHF database in
Envirofacts. <http://www.epa.gov/enviro/facts/ghg/customized.html>33. “Greenhouse Gas Emissions from Large Facilities: 2010, 2012.” U.S. Environmental Protection Agency. Database. N.d. <http://ghgdata.epa.gov/
ghgp/main.do>

ENDNOTES 53
34. “Clean Energy.” U.S. Environmental Protection Agency. Last updated: 7 May 2014. <http://www.epa.gov/cleanenergy/energy-and-you/affect/air-emissions.html>
35. Schlissel, David, Jeffrey Loiter, and Anna Sommer. “Changing Course: A Clean Energy Investment Plan for Dominion Virginia Power.” The Institute for Energy Economics and Financial Analysis, Optimal Energy, Sommer Energy. 2013. <http://www.wiseenergyforvirginia.org/new-power/changing-course/>
36. Van der Hoeven, Maria. “We can have safe, sustainable energy.” The Guardian. 24 Apr. 2012. <http://www.theguardian.com/commentisfree/2012/apr/24/we-can-have-safe-sustainable-energy>
37. Jacobe, Dennis. “Americans Want More Emphasis on Solar, Wind, Natural Gas.” Gallup Politics. Gallup. 27 Mar. 2013. <http://www.gallup.com/poll/161519/americans-emphasis-solar-wind-natural-gas.aspx>
38. Krosnick, Jon A., and Bo MacInnis. “Does the American public support legislation to reduce greenhouse gas emissions?” Daedalus 142.1 (2013): 26-39.
39. “Green Power Market.” U.S. Environmental Protection Agency. N.d. <http://www.epa.gov/greenpower/gpmarket/>40. “What’s Energy Efficiency?” Lawrence Berkeley National Laboratory. N.d. <http://eetd.lbl.gov/ee/>41. “Lazard’s Levelized Cost of Energy Analysis – Version 7.0.” Lazard. Aug. 2013. <http://gallery.mailchimp.com/ce17780900c3d223633ecfa59/
files/Lazard_Levelized_Cost_of_Energy_v7.0.1.pdf>42. “Ten Largest Plants by Generating Capacity, 2010.” U.S. Energy Information Administration. Table. N.d. <http://www.eia.gov/electricity/state/
virginia/pdf/virginia.pdf>43. “Integrated Resource Plan.” Dominion Electric and Power Company. 30 Aug. 2013.<https://www.dom.com/about/pdf/irp/chapter-2.pdf>
Chapter 2, Figure 2.2.3.44. “Market Trends: Electricity Demands.” Annual Energy Outlook 2014. U.S. Energy Information Administration. 7 May 2014. <http://www.eia.gov/
forecasts/aeo/MT_electric.cfm>45. “State Energy Efficiency Scorecard Ranking.” American Council for an Energy-Efficient Economy. 2013. <http://aceee.org/energy-efficiency-
sector/state-policy/aceee-state-scorecard-ranking>46. “State Energy Efficiency Policy Database.” American Council for an Energy-Efficient Economy. 2013. <http://aceee.org/sector/state-policy/
virginia>47. “10-Year Plan (2012-2021) of Electric Companies in Maryland.” Public Service Commission of Maryland. See appendix table 2(a). Apr. 2013.
<http://webapp.psc.state.md.us/intranet/Reports/TYP2021.pdf>48. “Final 2013 Energy-Efficiency: Forecast 2016-2022.” ISO New England. 22 Feb. 2013. <http://www.iso-ne.com/committees/comm_wkgrps/
othr/enrgy_effncy_frcst/2013frcst/iso_ne_final_ee_forecast_2016_2022.pdf>49. “Offshore Wind Research and Development.” U.S. Department of Energy, Office of Energy Efficiency and Renewable Energy. N.d. <http://
energy.gov/eere/wind/offshore-wind-research-and-development>50. “Offshore Wind Energy.” Bureau of Ocean Energy Management. N.d. <http://www.boem.gov/Renewable-Energy-Program/Renewable-Energy-
Guide/Offshore-Wind-Energy.aspx>51. Schwartz, Mark, et al. “Assessment of Offshore Wind Energy Resources for the United States.” National Renewable Energy Laboratory. Jun. 2010.
<http://www.nrel.gov/docs/fy10osti/45889.pdf> Table B1 shows that Virginia has 94,448 MW of technical offshore wind potential.52. “Virginia Electricity Profile 2012.” U.S. Energy Information Administration. <http://www.eia.gov/electricity/state/Virginia/> Virginia has 24,109
MW of generation capacity.53. “2010 Virginia Energy Plan.” Virginia Department of Minerals, Mines and Energy. 2010. <http://www.dmme.virginia.gov/DE/LinkDocuments/
VEP_Section6_Renewables.pdf> See Table 6-1.54. “Virginia Activities.” Bureau of Ocean Energy Management. N.d. <http://www.boem.gov/State-Activities-Virginia/>55. “Integrated Resource Plan.” Dominion Electric and Power Company. 30 Aug. 2013. <https://www.dom.com/about/pdf/irp/chapter-5.pdf> See
Figure 5.3.1.56. “The European offshore wind industry - key trends and statistics 2013.” The European Wind Energy Association. Jan. 2014. <http://www.ewea.
org/fileadmin/files/library/publications/statistics/European_offshore_statistics_2013.pdf>57. “Offshore Wind Energy: Action needed to deliver on the Energy Policy Objectives for 2020 and beyond.” Commission of the European
Communities. Communication. 13 Nov. 2008. <http://eur-lex.europa.eu/LexUriServ/LexUriServ.do?uri=CELEX:52008DC0768:EN:HTML>58. Navigant Consulting, Inc. U.S. Offshore Wind Market and Economic Analysis. Rep. no. DE-EE0005360. U.S. Department of Energy. 17 Oct. 2013.
Web. <http://www1.eere.energy.gov/wind/pdfs/offshore_wind_market_and_economic_analysis_10_2013.pdf>.59. “Maryland Activities.” Bureau of Ocean Energy Management. N.d. <http://www.boem.gov/Renewable-Energy-Program/State-Activities/
Maryland.aspx>60. “Secretary Jewell Announces Milestone for Commercial Wind Energy Development in Federal Waters.” U.S. Department of the Interior. Press
release. 17 Dec. 2013. <http://www.doi.gov/news/pressreleases/secretary-jewell-announces-milestone-for-commercial-wind-energy-development-in-federal-waters.cfm>
61. “Offshore Wind for Maryland.” The Office of Maryland Governor Martin O’Malley. N.d. <http://www.governor.maryland.gov/wind.html>62. “Offshore Wind Renewable Energy Credits.” The Office of Maryland Governor Martin O’Malley. Presentation. N.d. <http://www.governor.
maryland.gov/documents/OSWtestimony2013.pdf>63. “History.” Wind Energy Foundation. N.d. <http://www.windenergyfoundation.org/about-wind-energy/history>64. Mooiman, Mike. “Windfall? – Wind Energy in New Hampshire.” Energy in New Hampshire. New Hampshire Local Energy Solutions, 3 June 2013.
Web. <http://nhenergy.blogspot.com/2013/06/windfall-wind-energy-in-new-hampshire.html> 65. “2012 Wind Technologies Market Report.” U.S. Department of Energy, Office of Energy Efficiency and Renewable Energy. Aug. 2013. <http://
www1.eere.energy.gov/wind/pdfs/2012_wind_technologies_market_report.pdf>66. Lee, April. “Half of power plant capacity additions in 2013 came from natural gas.” Today in Energy. U.S. Energy Information Administration. Apr.
ENDNOTES 54
2014. <http://www.eia.gov/todayinenergy/detail.cfm?id=15751>67. “The Outlook for renewable energy in America.” American Council on Renewable Energy. 2014. <http://www.acore.org/files/pdfs/ACORE_
Outlook_for_RE_2014.pdf>68. Shahan, Zachary. “Cost of Wind Power — Kicks Coal’s Butt, Better than Natural Gas (& Could Power Your EV for $0.70/gallon.)” Clean Technica. 5
Jan. 2011. <http://cleantechnica.com/2011/05/01/cost-of-wind-power-kicks-coals-butt-better-than-natural-gas-could-power-your-ev-for-0-70gallon/>
69. “Installed Wind Capacity.” U.S. Department of Energy, Office of Energy Efficiency & Renewable Energy. Map. 26 Feb. 2014. <http://www.windpoweringamerica.gov/wind_installed_capacity.asp>
70. “Estimates of Wind Land Area and Wind Energy Potential, by State, for Areas >=30% Capacity Factor at 100 m.” National Renewable Energy Laboratory. 4 Feb. 2011. <http://apps2.eere.energy.gov/wind/windexchange/pdfs/wind_maps/wind_potential_80m_30percent.pdf>
71. “Generation Queues: Active.” PJM. <http://www.pjm.com/planning/generation-interconnection/generation-queue-active.aspx>72. “Renewable Portfolio Standards.” National Renewable Energy Laboratory. N.d. <http://www.nrel.gov/tech_deployment/state_local_activities/
basics_portfolio_standards.html>73. Wiser, Ryan, and Mark Bolinger. “2012 Wind Technologies Market Report.” National Renewable Energy Laboratory. Aug. 2013.74. Hensley, John. “AWEA State RPS Market Assessment 2013.” American Wind Energy Association. 2013. <http://www.awea.org/Resources/
Content.aspx?ItemNumber=5669>75. “Virginia: Voluntary Renewable Energy Portfolio Goal.” Database of Incentives for Renewables & Efficiency. <http://www.dsireusa.org/
incentives/incentive.cfm?Incentive_Code=VA10R>76. Analysis based on data compiled from: “U.S. Solar Market Insight 2013 Year in Review.” Solar Energy Industry Association and GTM Research. 4
Mar. 2014. <http://www.seia.org/research-resources/solar-market-insight-report-2013-year-review>77. “U.S. Solar Market Trends 2012.” Interstate Renewable Energy Council. 2012.78. “Photovoltaic (Solar Electric.)” Solar Energy Industry Association. N.d. <http://www.seia.org/policy/solar-technology/photovoltaic-solar-
electric>79. Analysis based on data compiled from: Lopez, Anthony, et al. “U.S. Renewable Energy Technical Potentials: A GIS-Based Analysis.” National
Renewable Energy Laboratory. Jul. 2012.80. “U.S. Solar Market Insight 2012 Year in Review.” Solar Energy Industry Association and GTM Research. 14 Mar. 2013. <http://www.seia.org/
research-resources/us-solar-market-insight-2012-year-review>81. “Renewable Portfolio Standard.” Clean Energy Group, States Advancing Solar. N.d. <http://www.statesadvancingsolar.org/policies/policy-and-
regulations/renewable-portfolio-standard>82. “Solar Carve-Outs in Renewable Portfolio Standards.” Database of Incentives for Renewables & Efficiency. N.d. <http://www.dsireusa.org/solar/
solarpolicyguide/?id=21>83. “BLS green jobs definition.” Bureau of Labor Statistics. N.d. <http://www.bls.gov/green/green_definition.pdf>84. Muro, Marc, Jonathan Rothwell, and Devashree Saha. “Sizing the Clean Economy: A National and Regional Green Jobs Assessment.” Brookings
Institution, Metropolitan Program, with Battelle Technology Partnership Practice. 13 July 2011. <http://www.brookings.edu/~/media/research/files/reports/2011/7/13%20clean%20economy/0713_clean_economy.pdf>
85. “Clean Energy Works for Us: 2013 Year-in-Review and Q4 Report.” Environmental Entrepreneurs. 2014. <http://www.e2.org/ext/doc/E2CleanEnergyJobs2013Year-EndandQ4.pdf>
86. “Renewable Portfolio Standards Policies.” Database of State Incentives for Renewables & Efficiency. Map. Mar. 2013. <http://www.dsireusa.org/documents/summarymaps/RPS_map.pdf>
87. “Renewable Portfolio Standard Policies with Solar / Distributed Generation Provisions.” Database of State Incentives for Renewables & Efficiency. Map. Mar. 2013. <http://www.dsireusa.org/documents/summarymaps/Solar_DG_RPS_map.pdf>
88. Polin, Robert, James Heintz, and Heidi Garrett-Peltier. “The Economic Benefits of Investing in Clean Energy.” Center for American Progress and the University of Massachusetts Amherst Political Economy Research Institute. Jun. 2009. <http://www.peri.umass.edu/fileadmin/pdf/other_publication_types/green_economics/economic_benefits/economic_benefits.PDF>
89. “Jobs and Other Economic Benefits.” In Benefits of Renewable Energy Use. Union of Concerned Scientists. 8 April 2013. <http://www.ucsusa.org/clean_energy/our-energy-choices/renewable-energy/public-benefits-of-renewable.html#jobs>
90. Bell, Casey. “Energy Efficiency Job Creation: Real World Experiences.” American Council for an Energy-Efficient Economy. Oct. 2012. <http://www.aceee.org/files/pdf/white-paper/energy-efficiency-job-creation.pdf>
91. “How Does Energy Efficiency Create Jobs?” American Council for an Energy-Efficient Economy. Fact sheet. N.d. <http://aceee.org/files/pdf/fact-sheet/ee-job-creation.pdf>
92. Fuller, Stephen S., John McClain, and Joanna Biernacka-Lievestro. Potential Economic Impacts of Renewable Energy in Virginia. Rep. Center for Regional Analysis - George Mason University, Dec. 2011. <http://cra.gmu.edu/pdfs/Potential_Economic_Impacts_of_Renewable_Energy.pdf>
93. “Air Emissions.” In How does electricity affect the environment? U.S. Environmental Protection Agency. 9 Sept. 2013. <http://www.epa.gov/cleanenergy/energy-and-you/affect/air-emissions.html>
94. “Emission Guidelines for Existing Stationary Sources: Electric Utility Generating Units” 40 CFR Part 60. 2014.95. Data Sources: RGGI 2005-2008 Emissions. <http://www.rggi.org/historical_emissions; 2009‐2012 Emissions: https://rggi-coats.org/eats/
rggi/index.cfm?fuseaction=search.rggi_summary_report_input&clearfuseattribs=true;Adjusted Budget: http://www.rggi.org/docs/ProgramReview/February11/13_02_11_IPM.pdf>
96. Shattuck, Peter. “The Regional Greenhouse Gas Initiative: Performance To-Date and the Path Ahead. “ ENE. May 2014. <http://www.env-ne.org/public/resources/ENE_RGGI_Report_140523_Final2.pdf>
97. “Energy Efficiency as a Low-Cost Resource for Achieving Carbon Emissions Reductions.” U.S. Environmental Protection Agency. Sept. 2009. <http://www.epa.gov/cleanenergy/documents/suca/ee_and_carbon.pdf>
ENDNOTES 55
98. Solar Energy Industry Association. “2013 Top 10 Solar States.” 2014. <http://www.seia.org/sites/default/files/resources/Top-10-Solar-States-Infographic.pdf>
99. Analysis based on data compiled from: Lopez, Anthony, et al. “U.S. Renewable Energy Technical Potentials: A GIS-Based Analysis.” National Renewable Energy Laboratory. July 2012.
100. Solar Energy Industry Association. “Third-Party Solar Financing.” Issues & Policies.101. Collins, Kathryn, Bethany Speer, Karlynn Cory, National Renewable Energy Laboratory, and Duke University. “Solar PV Project Financing:
Regulatory and Legislative Challenges for Third-Party PPA System Owners.” Tech. no. NREL/TP-6A2-46723. 2010. 102. Data sources: Offshore wind potential: Schwartz, Mark, et al., National Renewable Energy Laboratory (June 2010). “Assessment of Offshore
Wind Energy Resources for the United States.”; Virginia generation capacity: U.S. Energy Information Administration. “Virginia Electricity Profile 2012.” <http://www.eia.gov/electricity/state/Virginia/>
103. “Va4wind.” Va4wind: Offshore Wind by 2020.104. “Fulfilling the Promise of U.S. Offshore Wind.” National Resources Defense Council. Feb. 2013). <http://www.nrdc.org/business/files/offshore-
wind-investment.pdf>105. “Battleground Dispatches: Norfolk Readies for Future Storms, Sea Level Rise.” PBS NewsHour. Dec. 2012. <http://www.pbs.org/newshour/bb/
politics-july-dec12-norfolk_12-06/>106. Adams, Kathy. “Va. Beach Weighs $1.2M Temporary Fix for Flooding.” Hampton Roads Pilot. June 2013. <http://hamptonroads.com/2013/06/va-
beach-weighs-12m-temporary-fix-flooding>107. Mitchell, Molly (Marine Scientist Supervisor at the Virginia Institute of Marine Science, Center for Coastal Resources Management.) Telephone
interview. 17 Apr. 2014.108. Hamor, Michelle. “USACE Flood Risk Management Partners in Shared Responsibility.” Hampton Roads Sea Level Rise / Flooding Adaptation
Forum. 13 Mar. 2013. 109. “Regional Investment of RGGI CO2 Allowance Proceeds, 2011.” Regional Greenhouse Gases Initiative. Nov. 2012. <http://www.rggi.org/docs/
Documents/2011-Investment-Report__ES.pdf>110. “Greenhouse Gas Emissions from Large Facilities” in GHGRP 2012: Reported Data. U.S. Environmental Protection Agency. 2012.111. RGGI 91 Cap_MR IPM model results prepared by ICF International112. Clary, James, and Greg Grootendorst (Oct. 2013.) Economic Impact of the Department of Defense in Hampton Roads. Hampton Roads
Planning District Commission.113. “Shelter and Evacuation Gap Report (Final).” Virginia Office of Veterans Affairs and Homeland Security.
SIDEBAR ENDNOTES1. “An Information Statement of the American Meteorological Society.” American Meteorological Society. 20 Aug. 2012.2. “Greenhouse Gas Bulletin: The State of Greenhouse Gases in the Atmosphere Based on Global Observations through 2011.” World
Meteorological Organization. 2012.3. “Annual Greenhouse Gas Index.” National Oceanic and Atmospheric Administration. Spring 2014. <http://www.esrl.noaa.gov/gmd/aggi/aggi.
html>4. “Global Carbon Budget 2013.” Global Carbon Project. 19 Nov. 2013. <http://www.globalcarbonproject.org/carbonbudget/13/files/GCP_
budget_2013.pdf>5. “Climate Change Impacts in the United States.” Third U.S. National Climate Assessment. U.S. Global Change Research Program. May 2014.6. “Climate Change in Hampton Roads.” Hampton Roads Planning District Commission. 2010.7. Atkinson, Larry P., Tal Ezer, and Elizabeth Smith. “Sea level rise and flooding risk in Virginia.” Sea Grant Law and Policy Journal, Vol. 5, No. 2. 2012-
2013.8. Saunders, Stephen, Thom Easley and Theo Spencer. “Virginia Special Places in Peril.” Rocky Mountain Climate Organization and the National
Resources Defense Fund. Sept. 2010. <http://www.rockymountainclimate.org/images/VA_SpecialPlaces.pdf>9. “The Economic Impact of Domestic Travel On Virginia Counties 2012.” U.S. Travel Association, and Virginia Tourism Authority. Report. Aug. 2013.
<http://www.vatc.org/uploadedFiles/Research/2012EconomicImpactofDomesticTravelonVirginiaandLocalities.pdf>10. “Virginia Beach Tourism Continues ‘On a Roll.’” City of Virginia Beach. Press release. 26 Feb. 2013.11. “Rising Sea Level at Virginia Beach, VA,” Climate Hot Map: Global Warming Effects Around the World. Union of Concerned Scientists. 2011. <
http://www.climatehotmap.org/global-warming-locations/virginia-beach-va-usa.html>12. “Big Beach Renourishment Complete.” Norfolk District. U.S. Army Corps of Engineers. 7 Aug. 2013. <http://www.nao.usace.army.mil/Media/
NewsStories/tabid/3058/Article/16864/big-beach-renourishment-complete.aspx> 13. “Big Beach a big success.” Hampton Roads Pilot. Editorial. 12 Sep. 2011. <http://hamptonroads.com/2011/09/big-beach-big-success>14. “Assessing Impacts of Climate Change on Coastal Military Installations: Policy Implications.” U.S. Departments of Defense, Energy,
Environmental Protection Agency; Strategic Environmental Research and Development Program. Jan. 2013.15. Stiles, William, Molly Mitchell, and Troy Hartley. “Policy Climate for Climate Change in Virginia: Overview of Adaptation Policy, Planning and
Implementation Landscape.” Sea Grant Law & Policy Journal. 5 (2012): 15. 16. “Langley Air Force Base: Vulnerable to Sea Level Rise.” U.S. Department of Defense. 2013. <http://web.ornl.gov/sci/knowledgediscovery/
Langley/docs/Langley_Air_Force_Base2.pdf>17. Li, Honghai, Lihwa Lin, and Kelly A. Burks-Copes. “Modeling of coastal inundation, storm surge, and relative sea-level rise at Naval Station
Norfolk, Norfolk, Virginia, USA.” Journal of coastal research 29.1 (2012): 18-30. 18. “Climate Signals: A Guide to Selected Extreme Weather and Climate Change.” ClimateNexus. May 2012. <http://climatenexus.org/wp-content/
ENDNOTES 56
uploads/2012/05/signals.pdf>19. “Fifth Assessment Report, Working Group III: Mitigation of Climate Change.” Intergovernmental Panel on Climate Change. 13 Apr. 2014.
<http://www.ipcc-wg3.de/assessment-reports/fifth-assessment-report>20. Karl, Thomas R., Melillo, Jerry M. and Thomas C. Peterson. “Global Climate Change Impacts in the United States.” Cambridge University Press.
2009. <http://downloads.globalchange.gov/usimpacts/pdfs/climate-impacts-report.pdf>21. “Third National Climate Assessment.” National Climate Assessment and Development Advisory Committee. 2013.22. “Overwhelming Risk: A Guide to Flood Insurance in a World of Rising Seas.” Union of Concerned Scientists. 2013. <http://www.ucsusa.org/
assets/documents/global_warming/Overwhelming-Risk-Full-Report.pdf>23. Dutzik, Tony, Elizabeth Ridlington and Tom Van Heeke. “In the Path of the Storm: Global Warming, Extreme Weather, and the Impacts of
Weather-Related Disasters in the United States from 2007 to 2012.” Environment America Research & Policy Center. Apr. 2013. <http://www.environmentamerica.org/sites/environment/files/reports/In%20the%20Path%20of%20the%20Storm-2013.pdf>
24. “Shelter and Evacuation Gap Report (Final).” Virginia Office of Veterans Affairs and Homeland Security. Jan. 2013.25. “Severe weather in North America.” Munich Re. 2012. <http://www.munichreamerica.com/site/mram/get/documents_E1449378742/mram/
assetpool.mr_america/PDFs/3_Publications/ks_severe_weather_na_exec_summary.pdf>26. Stiles, Skip and Shannon Hulst. “Homeowners Insurance Changes in Coastal Virginia.” Wetlands Watch. Jul. 2013. <http://www.floods.org/
ace-files/documentlibrary/committees/Insurance/WetlandsWatch_Insurance-study.pdf>27. Statement of Craig Fugate, Administrator Federal Emergency Management Agency, U.S. Department Of Homeland Security, Before The
Committee on Banking, Housing and Urban Affairs Subcommittee on Economic Policy, U.S. Senate, Washington, D.C., “Implementation of the Biggert-Waters Flood Insurance Reform Act of 2012.” 113th Cong. 2013. <http://www.fema.gov/media-library-data/bb350d766a3dd4a4f8ecec0ccc783957/9-18-13_IMPLEMENTATION+OF+THE+BIGGERT-WATERS+FLOOD+INSURANCE+REFORM+ACT+OF+2012.pdf>
28. Felberbaum, Michael, and Vergakis, Brock. “Flood insurance rates are on the rise in Virginia.” Hampton Roads Pilot. 24 Mar. 2014. <http://hamptonroads.com/2014/03/flood-insurance-rates-are-rise-virginia>
29. “Ocean Acidification: Starting with the Science.” National Research Council. 2013. <http://dels.nas.edu/resources/static-assets/materials-based-on-reports/booklets/OA1.pdf>
30. “A Climate Change Action Plan.” Virginia Governor’s Commission on Climate Change. 10 Dec. 2008.31. Fears, Darryl. “Crabs, supersized by carbon pollution, may upset Chesapeake’s balance.” The Washington Post. 7 Apr. 2013. <http://www.
washingtonpost.com/national/health-science/2013/04/07/a0c29f48-972f-11e2-b68f-dc5c4b47e519_story.html>32. “Leading Scientists from All over the World Call for Immediate Action to Stop Ocean Acidification.” United Nations Environmental, Scientific,
and Cultural Organization. Press release. 30 Jan. 2009. <http://www.unesco.org/new/en/media-services/single-view/news/leading_scientists_from_all_over_the_world_call_for_immediate_action_to_stop_ocean_acidification/#.U2vl2PldV8E>
33. “Humans Threaten Wetlands’ Ability to Keep pace with Sea-level Rise.” College of William & Mary. Virginia Institute of Marine Science. 4 Dec. 2013. <http://www.vims.edu/newsandevents/_docs/kirwan_nature_review.pdf>
34. “Delta Works Flood Protection, Rhine-Meuse-Scheldt Delta, Netherlands.” Water Technology. N.d. <http://www.water-technology.net/projects/delta-works-flood-netherlands/>
35. “MOSE Project, Venice, Venetian Lagoon, Italy.” Water Technology. N.d.36. Jansen, Peter, and Piet Dircke. “Against the Deluge: Storm Surge Barriers to Protect New York City.” Proc. of ASCE Metropolitan Section
Infrastructure Group Seminar 2009 Conference. N.p., 31 Mar. 2009. <http://biotech.law.lsu.edu/climate/ocean-rise/against-the-deluge/15-verrazano_narrows_barrier.pdf>
37. Economic Impact of Hurricane Sandy Potential Economic Activity Lost and Gained in New Jersey and New York. U.S. Department of Commerce. Rep. Economics and Statistics Administration Office of the Chief Economist. Sept. 2013. <http://www.esa.doc.gov/sites/default/files/reports/documents/sandyfinal101713.pdf>
38. A. R. Brandt et al. “Methane Leaks from North American Natural Gas Systems.” Science. 14 Feb. 2014:733-735.39. “CIRES and NOAA Scientists Observe Significant Methane Leaks in a Utah Natural Gas Field.” University of Colorado Boulder. N.p., 5 Aug. 2013.
Web.40. Dana R. Caulton, et al. Toward a better understanding and quantification of methane emissions from shale gas development. PNAS 2014:
1316546111v1-201316546.41. Hamburg, Steven. “Methane: A Key to Dealing With Carbon Pollution?” Energy Exchange. Environmental Defense Fund, 5 Nov. 2013.42. Mitchell, Molly. “Conversation with Molly Mitchell, Marine Scientist Supervisor at the Virginia Institute of Marine Science, Center for Coastal
Resources Management.” Telephone interview. 17 Apr. 2014.43. Hamor, Michelle. “USACE Flood Risk Management Partners in Shared Responsibility.” Hampton Roads Sea Level Rise / Flooding Adaptation
Forum. 13 Mar. 2013.

ACEEE:
AWEA:
BOEM:
DOD:
DOE:
EPA:
GHG:
HRPDC:
IEA:
IPCC:
IRP:
kWh:
MW:
MWh:
American Council for an Energy-Efficient Economy
American Wind Energy Association
Bureau of Ocean Energy Management
Department of Defense
Department of Energy
Environmental Protection Agency
Greenhouse gas
Hampton Roads Planning District Commission
International Energy Agency
Intergovernmental Panel on Climate Change
Integrated Resource Plan (published by Dominion Power)
Kilowatt hour
Megawatt
Megawatt hour
ABBREVIATIONS LISTNFIP:
NOAA:
NRDC:
NREL:
ODU:
OREC:
OVAHS:
RGGI:
RPS:
SERDP:
SREC:
USACE:
VIMS
National Flood Insurance Program
National Oceanic and Atmospheric Administration
National Resources Defense Council
National Renewable Energy Laboratory
Old Dominion University
Offshore wind renewable energy credit
Office of Veterans Affairs and Homeland Security
Regional Greenhouse Gas Initiative
Renewable Portfolio Standard
Strategic Environmental Research and Development Program
Solar renewable energy certificate
U.S. Army Corps of Engineers
Virginia Institute of Marine Sciences
ABBREVIATIONS LIST 57
