lcms technology in the forensic laboratory 033109 - · pdf filelc/ms technology in the...
TRANSCRIPT
Agilent Technologies:
LC/MS Technology in the Forensic Laboratory y
Dr Peter JW StoneApplication ScientistAgilent Technologies, Inc.
Page 1
Agilent Forensic/Tox LC/MS Agenda
Part I- Hardware Innovation & Choices
Part II- Non-Targeted Screening with Accurate Mass (TOF/QTOF)
Part III- High Throughput Target Screening with Dynamic MRMs

Targeted versus Non-Targeted Screening Workflow
AMRTStart CreateEdit
AMRT EditorMS-MS LibStart Create
EditLibrary Editor
Non-Targeted Screening ID Confirmation
TOF based Screening
Qual, MFE, MFCStart
Report
TOF-QTOF based Confirmation/IdentificationQual, MFE, MFC
Report
Yes
MaybeNo
Confirm
Edit Edit
StopReport
No Stop
Yes
Start
Targeted Screening Calibrated QuantQQQ based Screening
Stop
Quant, Scheduled MRMStart Yes
Maybe
No
QQQ based Quantitation
Quant, Scheduled MRM
Report
Quantitate
Report
StartFind MRM Transitions
Optimize CEOptimizer Stop
MRM DB
Method Optimization, MRM DB Building
Page 3
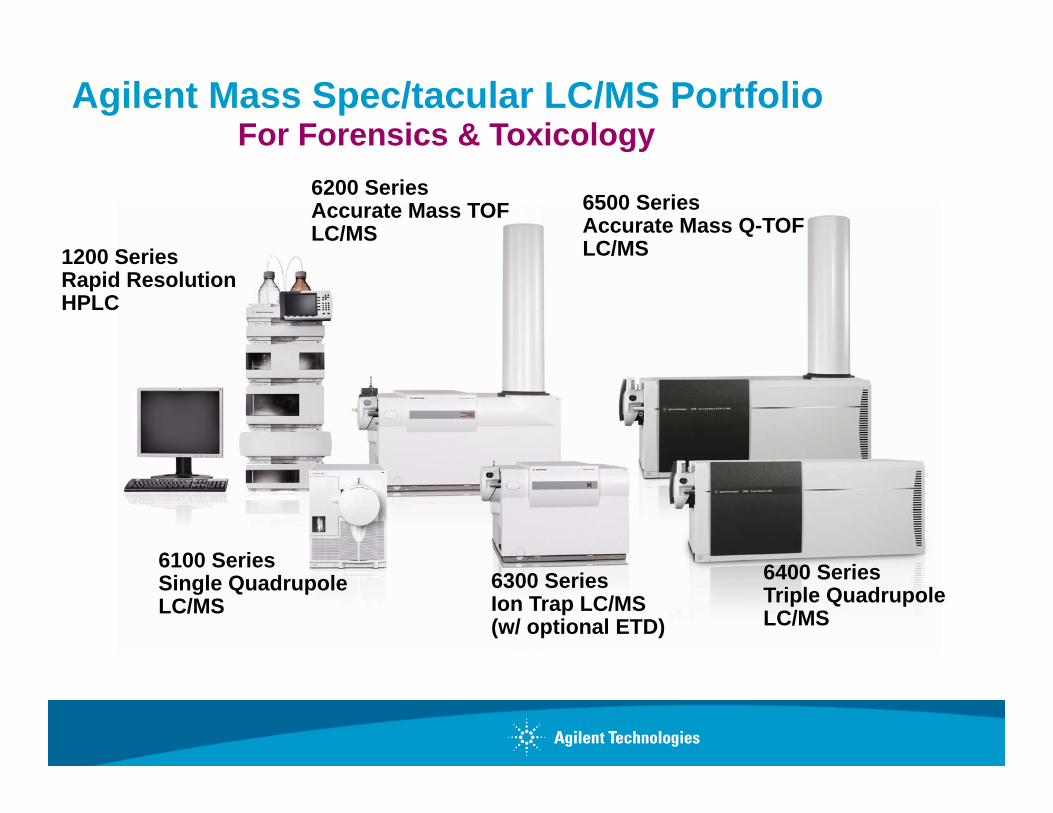
Agilent Mass Spec/tacular LC/MS PortfolioFor Forensics & Toxicology
1200 Series
6200 Series Accurate Mass TOFLC/MS
6500 Series Accurate Mass Q-TOFLC/MS
gy
1200 Series Rapid Resolution HPLC
LC/MS
6100 Series6100 Series Single Quadrupole LC/MS
6300 Series Ion Trap LC/MS(w/ optional ETD)
6400 Series Triple QuadrupoleLC/MS
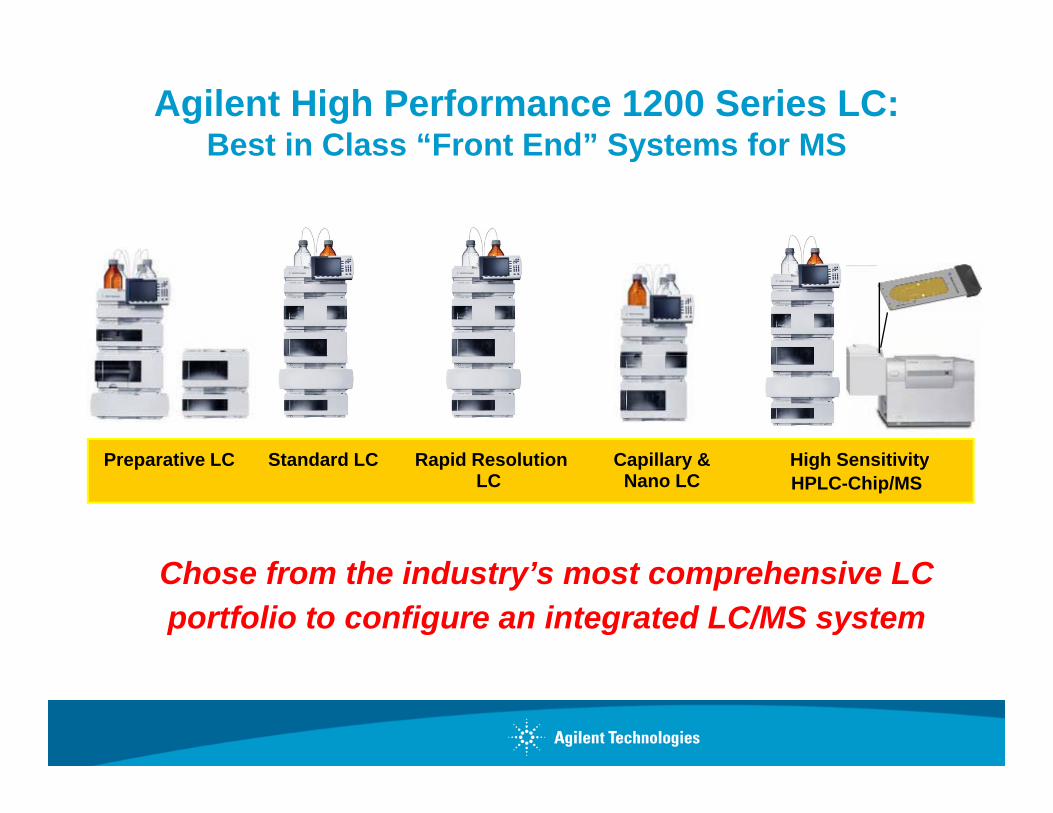
Agilent High Performance 1200 Series LC:Best in Class “Front End” Systems for MSBest in Class Front End Systems for MS
Preparative LC Capillary &Standard LC Rapid Resolution High SensitivityPreparative LC Capillary & Nano LC
Standard LC Rapid ResolutionLC
High SensitivityHPLC-Chip/MS
Chose from the industry’s most comprehensive LC portfolio to configure an integrated LC/MS system
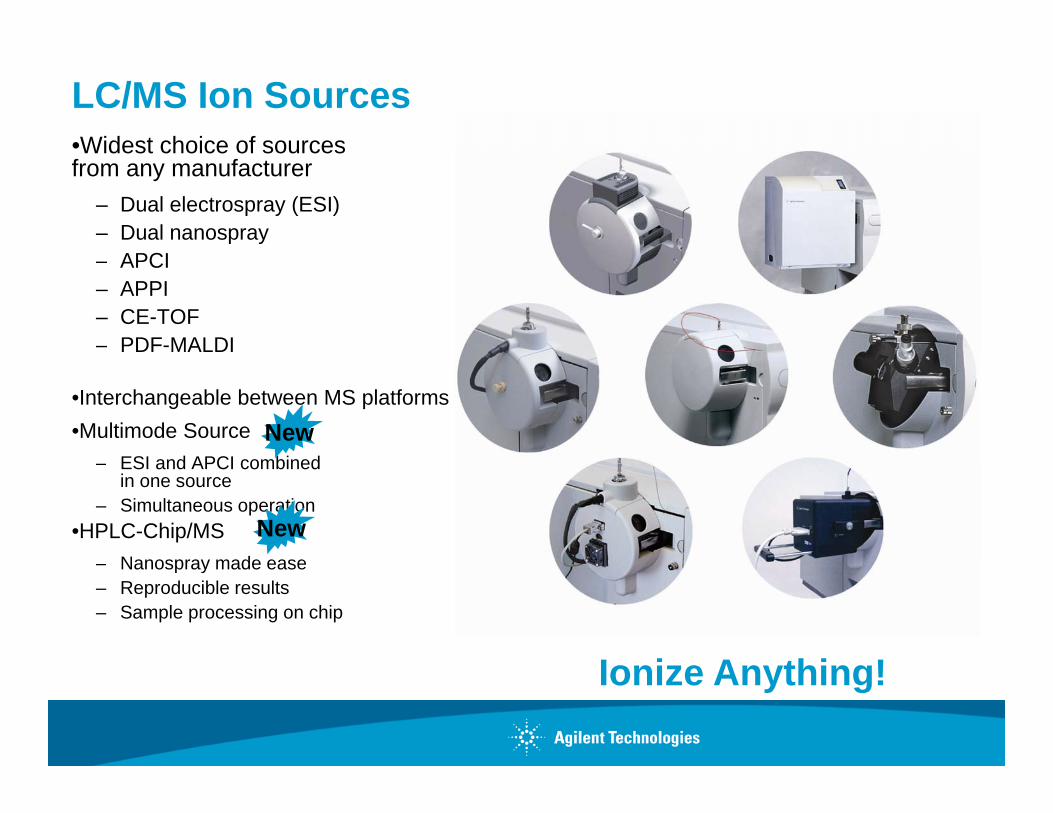
LC/MS Ion Sources•Widest choice of sourcesWidest choice of sourcesfrom any manufacturer
– Dual electrospray (ESI)– Dual nanospray
APCI– APCI– APPI– CE-TOF– PDF-MALDI
•Interchangeable between MS platforms•Multimode Source
ESI d APCI bi dNew
– ESI and APCI combined in one source
– Simultaneous operation•HPLC-Chip/MS
Nanospray made ease
New– Nanospray made ease– Reproducible results– Sample processing on chip
I i A thi !Ionize Anything!

Agilent Jet Stream Ion Generation Gas Dynamics Viewy
Nebulizing gas Enhanced efficiency nebulizer
Nozzle voltage
Super-heated sheath gas
The super-heated sheath gas collimates the
Heated drying gas
p gnebulizer spray and creates a dramatically “brighter source” Resistive sampling
capillaryPatent Pending
Ancient proverb:
On a Dark night you can see more starsOn a Dark night you can see more stars
How many peaks?
8
How many peaks?Move the slider to adjust the signal to noise ratio.
Agilent Jet Stream
Enter slide show mode to see the animation
on this page.
9
Key Applications
•Controlled Substance Testing
Trace Elements Testing (ICP/MS)
LC/MS
•Trace Elements Testing (ICP/MS)
• Accelerants/Explosive Residues LC/MS
•Toxicology
– Determines the absence or presence of drugs and their t b lit t d t t i b
LC/MS
metabolites to demonstrate prior use or abuse
• mt-DNA Analysis(Examples include – Marijuana, Cocaine, Opiates, pPhencyclidine, Amphetamines, Barbituates,
Benzodiazepines, ethylglucuronide, Methadones, Propoxyphene, steroids,HPP, peroxide explosives.)
Page 10

Controlled Substance Testing.Simplified LC/MS Workflow:Simplified LC/MS Workflow:
Unknowns screening using CE/LC/TOF:• Controlled Substance testing matrix (urine, blood,
sometimes oral fluid) plus sample clean-up/preparation;
• Standardized Rapid Resolution Fast LC methodology;
• CE or LC/TOF - All the data all the time;
• Automated confirmatory reporting using MasshunterSoftware:
• Molecular Feature Extractor (MFE) for automatic data mining and compound identification;compound identification;
• Agilent Masshunter Personal Compound Database (PCD) for screening using Accurate Mass;
• 7000 forensic/Tox analytes in Agilent PCD database (Controlled Substances, Explosives, Doping, etc). Database user-
fi bl / d blconfigurable/upgradable;• Seamless integration with Masshunter Qualitative analysis software.
• Configurable Reporting of Positives and/or Negatives for Screen.Quantitation?
Page 11
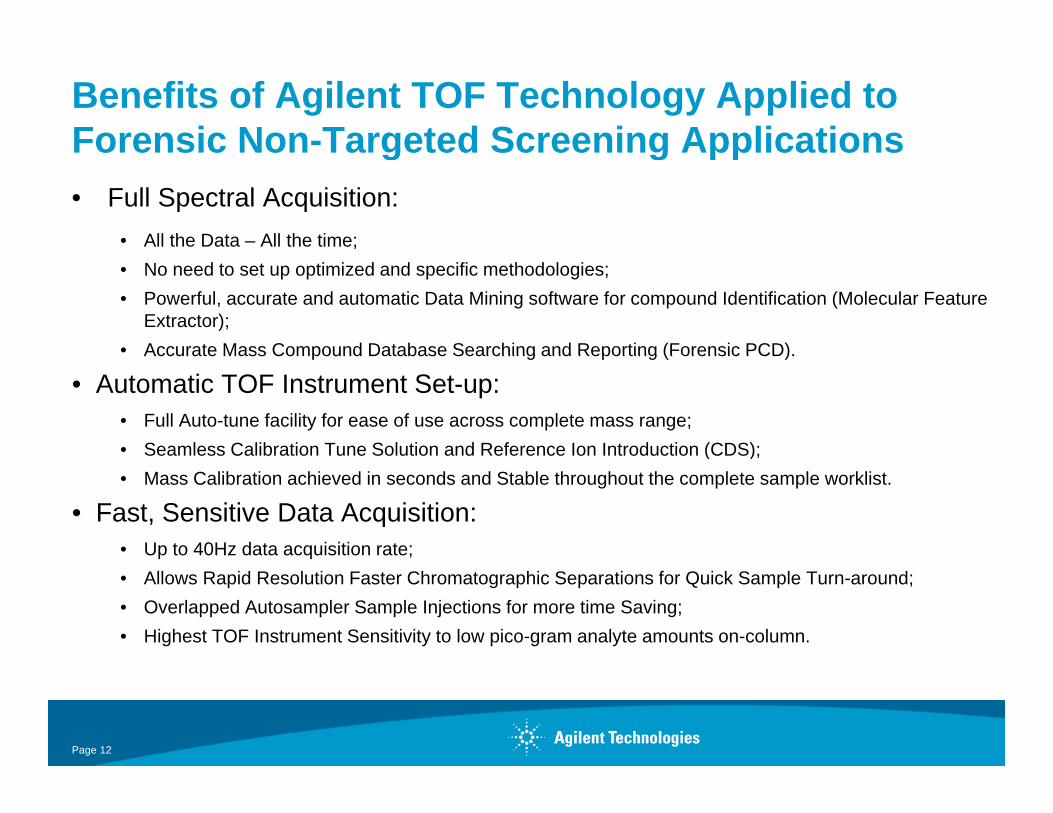
Benefits of Agilent TOF Technology Applied to Forensic Non-Targeted Screening ApplicationsForensic Non Targeted Screening Applications• Full Spectral Acquisition:
• All the Data – All the time;• No need to set up optimized and specific methodologies;• Powerful, accurate and automatic Data Mining software for compound Identification (Molecular Feature
Extractor);• Accurate Mass Compound Database Searching and Reporting (Forensic PCD).Accurate Mass Compound Database Searching and Reporting (Forensic PCD).
• Automatic TOF Instrument Set-up:• Full Auto-tune facility for ease of use across complete mass range;• Seamless Calibration Tune Solution and Reference Ion Introduction (CDS);( );• Mass Calibration achieved in seconds and Stable throughout the complete sample worklist.
• Fast, Sensitive Data Acquisition:• Up to 40Hz data acquisition rate;• Allows Rapid Resolution Faster Chromatographic Separations for Quick Sample Turn-around;• Overlapped Autosampler Sample Injections for more time Saving;• Highest TOF Instrument Sensitivity to low pico-gram analyte amounts on-column.
Page 12
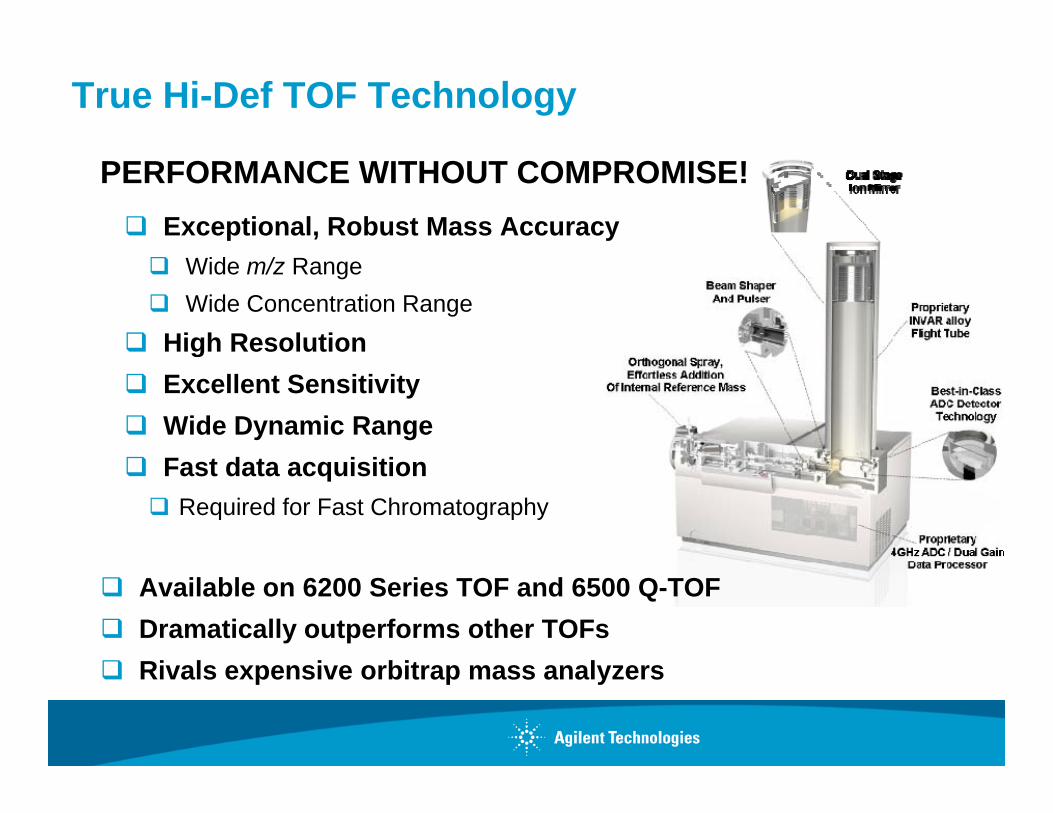
True Hi-Def TOF Technology
PERFORMANCE WITHOUT COMPROMISE!Exceptional, Robust Mass Accuracy
Wide m/z RangeWide Concentration Range
High ResolutiongExcellent SensitivityWide Dynamic RangeF t d t i itiFast data acquisition
Required for Fast Chromatography
Available on 6200 Series TOF and 6500 Q-TOFDramatically outperforms other TOFsRi l i bit lRivals expensive orbitrap mass analyzers
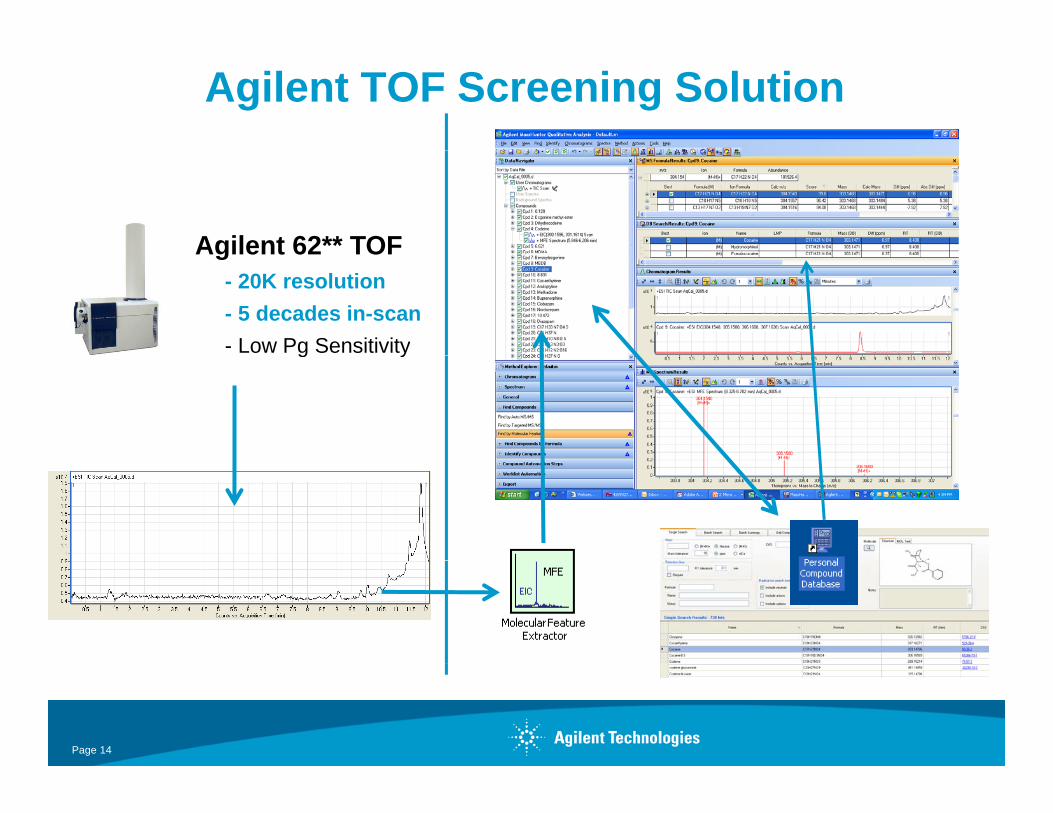
Agilent TOF Screening Solution
Agilent 62** TOFAgilent 62 TOF- 20K resolution- 5 decades in-scan- Low Pg Sensitivityg y
Page 14
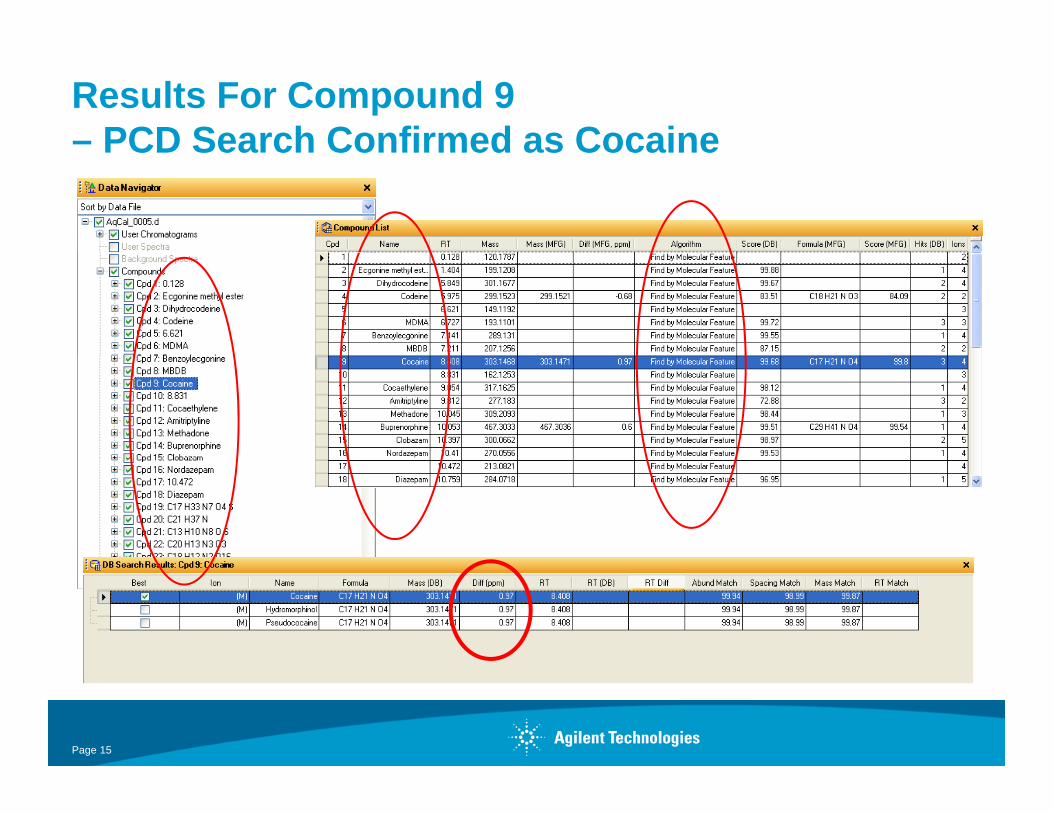
Results For Compound 9 – PCD Search Confirmed as CocainePCD Search Confirmed as Cocaine
Page 15
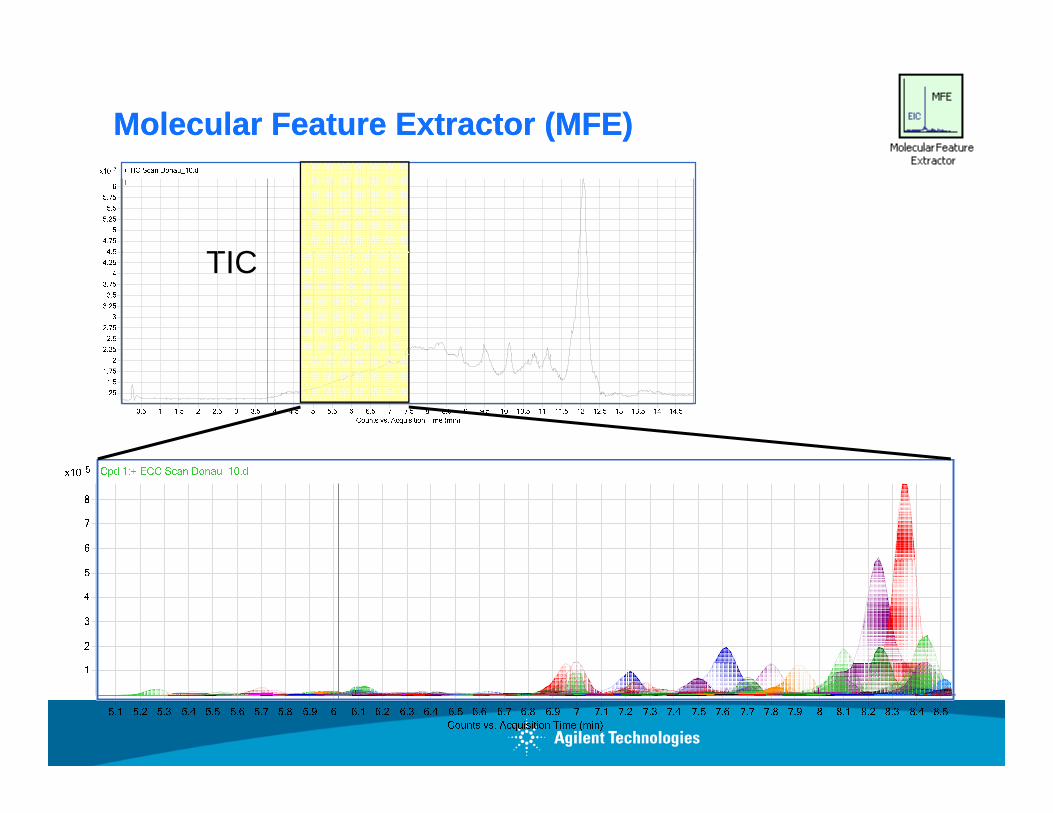
Molecular Feature Extractor (MFE)Molecular Feature Extractor (MFE)
TICTIC

Molecular Feature Extractor (MFE)Molecular Feature Extractor (MFE)

Agilent Personal Compound Database - Forensics/ToxicologyForensics/Toxicology
Database containing ~7000 Forensic/Doping Analytes
•Automated Reporting•Controlled Substances•Explosives•WADA Exclusion List•Accurate Mass Confirmation•Retention time Confirmation•Spectral Match Scoring (based on Isotopic Pattern & Accurate Mass spacing)
Page 18

Qualitative Screen Report – Compound 9 (Cocaine)
Page 19

Worklist Screening Automation
Sample Injection
Data Mine with MFE
Search Forensic PCD
Print Analysis ReportDatabase Positives?
Page 20

Custom Report Output from Worklist Automation
5ppm mass windowReporting of positive Hits only
Page 21
5ppm mass windowp g p y

Results For Compound 9 – PCD Search Confirmed as Cocaine Scoring based onPCD Search Confirmed as Cocaine
EIC of Cocaine
Monoisotopic mass(varies in ppm)
Scoring based on
EIC of CocaineMass 303.1471(50 ng/ml)Isotope spacing
Isotope distribution(varies in %)
( g )Isotope spacing(varies in ppm)
Isotope Scoring0.99931 linear correlationUsing TOF for Quantitation
Page 22

Retention Time Scoring (example – hydromorphone & morphine)( p y p p )
2ppm mass tolerance window:
morphine [C17H19NO3], m/z=285.1365hydromorphone [C17H19NO3], m/z=285.1365
Page 23

Retention Time Scoring (example – hydromorphone & morphine)
hydromorphone/
Page 24
hydromorphone/morphine

Isobaric Compounds
Page 25

Personal Compound Database – Structures and ability to update retention times semi-automaticallyability to update retention times semi automatically
Page 26

Non-Targeted Screen Summary (QTOF/TOF)
•Agilent TOF for ‘unknown’ forensic screening (sub 2ppm mass accuracy.)accuracy.)•Agilent MassHunter PCD for Forensics utilizes the accurate mass data to provide reliable ‘positives’ for qualitative forensic screens.
•Extra Confirmation with Isotope abundance (pattern) spacing and mass•Extra Confirmation with Isotope abundance (pattern), spacing and mass matching.• >7000 Forensic analytes.•Fully Automated integration with MassHunter Qualitative Analysis SWFully Automated integration with MassHunter Qualitative Analysis SW.
•Improved & Reliable Data mining Algorithm (MFE or MS/MS.)•Low pico-gram on-column Sensitivity.Fully Automated•Fully Automated.
•Excellent TOF Quantitative performance.
Page 27

Screening Using Ion Trap (MSn)
SampleThe Agilent ion trap applicability in MSn modes for production of high quality and consistenthigh-quality and consistent fragmentation spectra by utilizing fragmentation ramping routines (Smart Frag)routines (Smart Frag).
The quality of the MSn spectra is of utmost importance when
Ion Trap MS
+ve ID ?
is of utmost importance when searching against predefined libraries so that ion ratios and other confirmatory “fits” yield a
Quantitation
ve ID ? ot e co ato y ts y e d arealistic ID
Forensic Library ~ 400 drugsQuantitation y g

Stage 1 – AutoMSn Screening and Library Searching (Ion Trap)Searching (Ion Trap)Case Study 1 – AutoMSn Screen and library Search
(Alprazolam) 17MIX00010.D: TIC +MS2(309.0)
5x10Intens.
(Alprazolam) 17
0.5
1.0
1.5
280.9
17. +MS2(309.0), 4.9-5.7min
1.5
4x10Intens.
130.0
4.0 4.2 4.4 4.6 4.8 5.0 5.2 5.4 Time [min]
164.9 205.9223.9240.9
17. THC Library 1: Alprazolam; IT ESI +MS2(309) (P: 983, F: 985, R: 984, M: 1000)0.0
0.5
1.0Recorded Spectrum1 ng/ml sample
205 0241.0
280.9
NN
NCl
250
500
750
1000
1250
Library Spectrum
164.9 205.0 223.9 N0
50 100 150 200 250 300 350 400 450 m/z

Stage 1 – AutoMSn Screening and Library Searching (Ion Trap)Searching (Ion Trap)Case Study 2 – AutoMSn Screen and library Search
(THC active/blood extract)(THC-active/blood extract)24 BLOOD014.D: TIC +MS2(315.0), Smoothed (6.0,3, GA)
4
5
6
4x10Intens.
259.0
25. +MS2(315.0), 10.6-11.0min
4000
Intens.
2
3
10.0 10.5 11.0 11.5 12.0 12.5 13.0 13.5 Time [min]
Recorded Spectrum135.0
192.9
233.0296.1
314.2
H25. THC Library 1: Delta9-tetrahydrocannabinol; IT ESI +MS2(315) (P: 755, F: 913, R: 756, M: 1000)
0
1000
2000
3000
1250
1 ng/ml sample
Library Spectrum135.0
164.9
192.9
232.9
259.0
273.0297.1
O
O
H
0
250
500
750
1000
100 200 300 400 500 m/z

Stage 1 Qualitative Screen Resume
Case Study 1:
Ion Trap AutoMSn Library Search (Alprazolam) with library• Ion Trap AutoMSn Library Search (Alprazolam) with library match factors:
1 Purity: 9831. Purity: 983
2. Fit: 985
3 RFit 9843. RFit: 984
4. Match Factor: 1000

Stage 2 – Quantitative Analysis (Ion Trap XCT plus)Case Study 1 – contd.Case Study 1 cont .
AlprazolamCalibration Curve
(pg on-column)
Units = pg on-column
LOD = 100fg on-column
Units pg on column
LOD 100fg on column(S/N>5)
Correlation = 0 999886Correlation 0.999886

Positive case verification procedure(Real Olympic Game Sample – Athlete has been administered Triamcinolone Acetonide for Therapeutic Use)
Triamc. Acetonide Ion 5
Triamc. Acetonide Ion 1
IStd Ion
Triamc. Acetonide Ion 2
Triamc. Acetonide Ion 3
Triamc. Acetonide Ion 4
Spectra compared to library and QC
S/N over 25 for Corticosteroid concentration
Presentation #Society of Forensic ToxicologistsNashville, TN, 17 – 21 Oct 2005
all EICs is below 15 ng/mL

Target Screening Using high sensitivity 6460 Triple QuadrupoleTriple Quadrupole
Subfemtogram, on-column sensitivity
Five Orders of LinearityFive Orders of Linearity3,000 m/z mass rangeFast Pos/Neg switching, 100 millisecNew Method Development Tool – MH Optimizer“Dynamic Multiple Reaction Monitoring” for MRMs scheduled by peak
retention times instead of time segmentsg

MassHunter “Dynamic MRM”
Many applications require screening of 100 – 1000 compounds in one MRM method !• Food, environmental and Forensic analysis (e.g. Doping Control)• Subsequent quantitation of positives in dedicated methods
WITHOUT Dynamic MRM• Need to manually set up multiple time segments to maximize dwell time• Tedious and fragile for chromatographic time shifts• Tedious and fragile for chromatographic time shifts
WITH Dynamic MRM• Automatic setup of overlapping time segments without user intervention• Automatic setup of overlapping time segments without user intervention• Even less MRMs per time results in even longer dwell time / sensitivity• Unaffected by chromatographic time shifts

MRM (Multiple Reaction Monitoring)
IonsIons
Spectrum with background
Q1 lets onlytarget ion 210
Collision cell breaks ion 210
Q3 monitors onlycharacteristic
210
backgroundions (from ESI)
target ion 210 pass through
210
breaks ion 210 apart
characteristic fragments 158 and 191 from ion 210 for quant and
222
268 280165 210158
191
210 for quant and qual.
158191
January 2008
170 210 250 290 190 210 150 170 190 210 160 190no chemical background

Segmentation with NO Dynamic MRM functionality300 Component Standard300 Component Standard
100pg on-column
Page 37

NO Seqmentation with Dynamic MRMs
EIC Overlay of 250 analyte Mix spiked into Matrix(500 total transitions, on‐column amount 2.5pg) using dynamic MRMs.

3x101.725 1 1
1.31.325
1.351.375
1.41.425
1.451.475
1.51.525
1.551.575
1.61.625
1.651.675
1.71 1
ΔRt
0.8750.9
0.9250.95
0.9751
1.0251.05
1.0751.1
1.1251.15
1.1751.2
1.2251.25
1.275
x3 x4 x4 x3 x4 x2 x1# Concurrent dMRM =
Constant Cycle time
0.450.475
0.50.525
0.550.575
0.60.625
0.650.675
0.70.725
0.750.775
0.80.825
0.85
8.366
x3 x4 x4 x3 x4 x2 x1
0.050.075
0.10.125
0.150.175
0.20.225
0.250.275
0.30.325
0.350.375
0.40.425
0.45
Counts vs. Acquisition Time (min)0.5 1 1.5 2 2.5 3 3.5 4 4.5 5 5.5 6 6.5 7 7.5 8 8.5 9 9.5 10 10.5 11 11.5 12 12.5 13 13.5 14 14.5 15 15.5 16 16.5
Selection of 24 component transitions from previous slideTo illustrate efficiency of cycle times using dynamic MRMs.y y g y

3x101.725 1 1
1.31.325
1.351.375
1.41.425
1.451.475
1.51.525
1.551.575
1.61.625
1.651.675
1.71 1
0.8750.9
0.9250.95
0.9751
1.0251.05
1.0751.1
1.1251.15
1.1751.2
1.2251.25
1.275
x3 x4 x4 x3 x4 x2 x1# Concurrent dMRM =
Constant Cycle time
0.450.475
0.50.525
0.550.575
0.60.625
0.650.675
0.70.725
0.750.775
0.80.825
0.85
8.366
x3 x4 x4 x3 x4 x2 x1
0.050.075
0.10.125
0.150.175
0.20.225
0.250.275
0.30.325
0.350.375
0.40.425
0.45
Counts vs. Acquisition Time (min)0.5 1 1.5 2 2.5 3 3.5 4 4.5 5 5.5 6 6.5 7 7.5 8 8.5 9 9.5 10 10.5 11 11.5 12 12.5 13 13.5 14 14.5 15 15.5 16 16.5
Selection of 24 component transitions from previous slideTo illustrate efficiency of cycle times using dynamic MRMs.y y g y

MassHunter OptimizerAutomated MRM Method Development SoftwareAutomated MRM Method Development Software or 6400 series Triple Quad LC/MS
C d ifi ti i ti f MRM i tCompound-specific optimization for MRM experiments• Selection and optimization of precursor ion and fragment ions• Support of optimization with multiple methods (e.g. pos/neg)• Creation of a compound database with optimized results
WITHOUT Optimizer:• Manual optimization for 500 compounds
=> several WEEKS of tedious interactive work!
WITH Optimizer:WITH Optimizer:• Optimization can be fully automated
=> One or a few DAYS unattended work!

QQQ Analyte Optimization:2 k tti2 key settings.
Fragmentor Voltage Collision Energy
Page 42

Optimizer Compound Set-up
Page 43

Optimized Compound Results & Method Setup
Page 44

Targeted Screen of Spiked Oral Fluid Extract200 D MRMs Drugs of Abuse200 D_MRMs Drugs of Abuse• Generic Dynamic MRM Methodology created for Rapid
Resolution 5min Screen.• Column – Zorbax Eclipse Plus C18 (2.1 x 50mm, 1.8um)• Solvent A – 0.01% formic acid/5mM Ammonium formate (Water)• Solvent B - 0.01% formic acid/5mM Ammonium formate (acetonitrile)• Gradient –
• 0 min –> B= 5%• 0.5min -> B=5%• 2min -> B=60%• 3min -> B=100%3min B 100%
• Overall analysis time – 5 min, Column regeneration – 2min.• Flow Rate – 0.5 ml/min
Page 45

Dynamic MRM transitions – Spiked Compounds200 DMRMs in total (5min run time)200 DMRMs in total (5min run time)
CompoundName Precursor Q1-Res Product Q2-Res Frag CE RT RT Delta IonPolarity7-aminoclonazepam 286.0 unit 222.0 unit 159 25 1.581 0.5 Positive
7-aminoflunitrazepam 284.1 unit 135.1 unit 159 25 1.500 0.5 PositiveClobazam 301.1 unit 259.0 unit 138 17 3.011 0.5 PositiveClonazepam 316.1 unit 270.1 unit 158 25 2.923 0.5 PositiveFlunitrazepam 314.1 unit 268.1 unit 158 25 2.951 0.5 PositiveFlurazepam 388.2 unit 315.0 unit 158 21 2.755 0.5 PositiveLorazepam 321.0 unit 275.0 unit 113 21 3.033 0.5 PositiveLormetazepam 335.0 unit 289.0 unit 143 21 3.122 0.5 PositiveMedazepam 271.1 unit 91.1 unit 107 41 3.324 0.5 PositiveMidazolam 326.1 unit 209.0 unit 154 33 3.406 0.5 PositivenorDiazepam 271.1 unit 165.0 unit 117 21 3.325 0.5 PositiveOxazepam 287.1 unit 241.0 unit 143 21 3.032 0.5 PositiveOxazolam 329.1 unit 271.0 unit 123 21 3.316 0.5 PositivePrazepam 325.1 unit 271.0 unit 123 17 3.408 0.5 PositiveTemazepam 301.1 unit 255.0 unit 102 21 3.095 0.5 Positive7-aminoclonazepam 286.0 unit 121.1 unit 159 25 1.581 0.5 Positive
7-aminoflunitrazepam 284.1 unit 256.3 unit 159 25 1.500 0.5 PositiveClobazam 301.1 unit 224.1 unit 138 17 3.011 0.5 PositiveClonazepam 316.1 unit 214.0 unit 158 25 2.923 0.5 PositiveFlunitrazepam 314.1 unit 239.1 unit 158 25 2.951 0.5 PositiveFlurazepam 388.2 unit 317.1 unit 158 21 2.755 0.5 PositiveLorazepam 321.0 unit 303.0 unit 113 21 3.033 0.5 PositiveLormetazepam 335.0 unit 317.0 unit 143 21 3.122 0.5 PositiveMedazepam 271.1 unit 207.1 unit 107 41 3.324 0.5 PositiveMidazolam 326.1 unit 223.1 unit 154 33 3.406 0.5 PositivenorDiazepam 271.1 unit 140.0 unit 117 21 3.325 0.5 PositiveOxazepam 287.1 unit 269.0 unit 143 21 3.032 0.5 PositiveOxazolam 329.1 unit 140.0 unit 123 21 3.316 0.5 PositivePrazepam 325.1 unit 140.0 unit 123 17 3.408 0.5 PositiveTemazepam 301.1 unit 283.0 unit 102 21 3.095 0.5 Positive
Page 46

Overlaid Chromatogram of Spiked Benzos in OF
10 pg on-column
Page 47

Overlaid Chromatogram of 10 more Spiked Benzosin OF (5min analysis screen)in OF (5min analysis screen)
10 pg on-column
0.03min
ΔRT = 0 2 min (12 sec)
Page 48
ΔRT 0.2 min (12 sec)

Performance – LOD, Cal Curves & Signal/Noise
CompoundLOD
(fg on-column)S/N = 17.3
Compound (fg on column)Clobazam 126Clonazepam 91.5Flunitrazepam 47.5Flurazepam 43.0Lorazepam 186Lormetazepam 45.9Lormetazepam 45.9Midazolam 1.2 pgOxazepam 145Oxazolam 235Prazepam 23.7Temazepam 156
Correlation = 0.99871953
Page 49

Performance – LOD, Cal Curves & Signal/Noise
CompoundLOD
(fg on-column) S/N = 15.0Compound (fg on column)Clobazam 126Clonazepam 91.5Flunitrazepam 47.5Flurazepam 43.0Lorazepam 186Lormetazepam 45.9Lormetazepam 45.9Midazolam 1.2 pgOxazepam 145Oxazolam 235Prazepam 23.7Temazepam 156
Correlation = 0.99844314Correlation 0.99844314
Page 50

Performance – LOD, Cal Curves & Signal/Noise
CompoundLOD
(fg on-column) S/N = 5.0Compound (fg on column)Clobazam 126Clonazepam 91.5Flunitrazepam 47.5Flurazepam 43.0Lorazepam 146Lormetazepam 45.9Lormetazepam 45.9Midazolam 1.2 pgOxazepam 145Oxazolam 235Prazepam 23.7Temazepam 156
Correlation = 0.99674595Correlation 0.99674595
Page 51

Pesticide Mix Injected as 100 fg on-columnQuantitation Results
Methabenzthiazuron 9.874 712 0.1210 121.0Quantitation Results
Compound RT ResponseFinalConc Accuracy
3-OH Carbofuran 7.410 236 0.1286 128.6Acetamiprid 7.274 564 0.1113 111.3Aldicarb sulfone 4.665 144 0.1294 129.4Aldicarb sulfoxid 4.316 204 0.1911 191.1Aldicarb 8.585 152 0.1233 123.3Amidosulfuron 8 858 13 0 0311 31 1
Dioxacarb 7.300 526 0.1253 125.3
Diuron 11.053 898 0.0878 87.8
Ethiofencarb-sulfon 7.680 83 0.1325 132.5
Fenobucarb 11.926 58 0.0840 84.0
Fenuron 6.924 643 0.1074 107.4
Methiocarb sulfon 7.687 144 0.1485 148.5
Methiocarb sulfoxid 7.174 1003 0.0946 94.6
Methomyl 5.294 407 0.1375 137.5
Metosulam 10.085 59 0.1280 128.0
Metoxuron 8.666 377 0.1088 108.8
Metsulfuron methyl 8.924 31 0.1007 100.7
Monalide 6.884 237 0.0666 66.6
Monolinuron 10.314 74 0.0965 96.5
Naptalam 9.503 15 0.1357 135.7Amidosulfuron 8.858 13 0.0311 31.1Aminocarb 7.231 1087 0.1156 115.6Asulam 3.191 14 0.0883 88.3Azoxystrobin 12.101 223 0.1522 152.2Bendiocarb 7.300 526 0.1253 125.3Butocarboxym 8.463 152 0.1637 163.7Butocarboxym-sulfoxid 4.316 203 0.1239 123.9Buturon 11.086 63 0.0691 69.1Carbendazim 7.212 2565 0.1027 102.7Carbetamid 9 130 229 0 1395 139 5
Flazasulfuron 11.167 20 0.0881 88.1
Fluazifop 12.094 27 0.0607 60.7
Flumequine 9.931 406 0.1438 143.8
Flumetsulam 6.941 79 0.1058 105.8
Fluometuron 11.053 898 0.0878 87.8
Fluroxypyr 7.409 328 0.1308 130.8
Flutriafol 11.016 141 0.1222 122.2
Foramsulfuron 10 328 20 0.1318 131.8
Nicosulfuron 9.338 32 0.1486 148.6
Oxamyl 5.047 1120 0.1239 123.9
Oxasulfuron 9.379 273 0.1353 135.3
Propoxur 9.791 601 0.1491 149.1
Prosulfurone 11.448 46 0.3549 354.9
Pyracarbolid 9.911 913 0.1013 101.3
Quinmerac 6.430 566 0.1278 127.8
Rimsulfuron 10.231 12 0.0000 0.0
Siduron 12.076 261 0.1457 145.7
Positives Coverage = 87% @ 100fgCarbetamid 9.130 229 0.1395 139.5Carbofuran 9.886 713 0.1149 114.9Carboxine 10.111 82 0.1297 129.7Chlorotoluron 10.607 462 0.1473 147.3Chlorsulfuron 9.372 25 0.1586 158.6Cinosulfuron 9.324 115 0.1878 187.8Clothianidin 6.544 115 0.1391 139.1Cyazofamid 8.381 64 0.0817 81.7Cycluron 11.375 400 0.1369 136.9Demethon S meth l 9 902 278 0 1122 112 2
Foramsulfuron 10.328 20 0.1318 131.8
Fuberidazole 8.535 1193 0.1590 159.0
Imazamox 6.890 38 0.1031 103.1
Imazapyr 5.558 101 0.1088 108.8
Imazaquin 9.557 103 0.1222 122.2
Imazethaphyr 8.390 163 0.1440 144.0
Imidacloprid 6.608 59 0.1077 107.7
Iodosulfuron methyl 11.314 14 0.0432 43.2
I b h N 53 0 1337 133 7
Sulcotrione 7.500 66 0.1240 124.0
Tebuthiuron 10.041 1318 0.1203 120.3
Thiabendazole 8.171 771 0.1602 160.2
Thiacloprid 7.931 673 0.1237 123.7
Thiametoxam 5.516 298 0.1076 107.6
Thidiazuron 9.463 21 0.0770 77.0
Thifensulfuron-methyl 9.009 45 0.1142 114.2
Thiodicarb 10.600 85 0.1277 127.7
Thiofanox sulfone 7.157 618 0.1114 111.4
Positives Coverage = 99% @ 1pgDemethon-S-methyl 9.902 278 0.1122 112.2Demethon-S-methyl-sulfon 5.657 291 0.1162 116.2Demeton-S-methyl sulfoxide 5.513 902 0.1223 122.3Dichlorphen 5.520 191 0.1131 113.1Diethofencarb 12.110 311 0.1340 134.0Difenoxuron 11.188 476 0.1452 145.2
Isocarbophos-Na 11.434 53 0.1337 133.7
Isoproturon 11.112 666 0.1358 135.8
Linuron 11.841 117 0.1945 194.5
7.157Thiofanox sulfoxide 6.881 188 0.1088 108.8
Thiofanox 10.675 202 0.1654 165.4
Thiophanat-ethyl 11.402 201 0.1786 178.6
Tralkoxydim 15.928 781 0.1267 126.7
Triasulfuron 9.999 55 0.1511 151.1
Tribenuron methyl 11.190 24 0.4215 421.5
Tricyclazole 8.371 505 0.1441 144.1
Triflusulfuron-methyl 12.286 34 0.1049 104.9

Target Screen Summary
• Highly sensitive QQQ with Agilent Jetstream ESI technology
Femtogram range for LODs• Femtogram range for LODs
• Dynamic MRM functionality, enabling faster chromatography with large suite of analytes without the need for segmentationwith large suite of analytes without the need for segmentation
• Automatic method optimization, for swift method set-up
A t t d R ti i k d f M H t kli t• Automated Reporting invoked from MassHunter worklist
Thank you for listening, any questions?
Page 53