laying a foundation for peace? micro-effects of
TRANSCRIPT

Laying a Foundation for Peace?Micro-Effects of Peacekeeping in Cote
d’Ivoire
Eric Mvukiyehe∗Cyrus Samii†
August 27, 2009
Prepared for the 2009 Meetingof the American Political Science Association, Toronto.
Abstract
Multidimensional peacekeeping operations have been central to UnitedNations efforts to end protracted internal conflicts and consolidate postwarpeace. Recent empirical studies have shown that these operations are asso-ciated with prolonged peace after civil war. However, there have been fewquantitative efforts to evaluate peacebuilding components such as economicrehabilitation, political development assistance, or human rights promotionintegrated within peacekeeping operations. We use original data from a sur-vey of the local population in Cote dIvoire and conflict event data to identifymicro-effects of the United Nations Operations in Cote dIvoire (UNOCI).We find little to support the idea that UNOCIs deployments significantlyaffected the security situation, which had already improved tremendously
∗Department of Political Science, Columbia University. Email: [email protected].†Department of Political Science, Columbia University. Email: [email protected]. For
their very useful input, we thank the staff of the Evaluation Division of the United Nations Officefor Internal Oversight Services, William Durch, Page Fortna, Francesco Mancini, and participantsat the 2008 FBA Peacekeeping Working Group at New York University and the Columbia Univer-sity IGERT-IDG workshop. We thank Ragnhild Nordas and the Peace Research Institute of Oslofor sharing Cote d’Ivoire conflict events data.
1

prior to UNOCIs arrival, and we find only a suggestive association betweenfeelings that insecurity would mar forthcoming elections and deploymentpatterns. We do find that UNOCIs presence was associated with less severeeconomic losses, and that penetration of electoral assistance activities wasassociated with more confidence in forthcoming elections. Finally, we donot find a clear association between deployments and the restoration of localauthorities. Taken as they are, the results suggest the need to emend cur-rent theories of why peacekeeping works–perhaps de-emphasizing securityaspects, and placing more emphasis on the economic and political program-matic aspects. While these results are preliminary, they suggest the potentialof micro-level studies of intermediate peacebuilding outcomes to improveour understanding of how peacekeeping helps to build peace in war-torn so-cieties
1 Introduction
Over the past two decades, peacekeeping has been central to United Nations’ (UN)efforts to end protracted internal conflicts and consolidate postwar peace. Sincethe 1990s, the UN moved beyond traditional peacekeeping operations whose mainfocus had been on military functions such as monitoring ceasefire agreements orsetting buffer zones between belligerents to more complex and multidimensionaloperations. These have included a wide range of activities such as providing lawand order to the local population, rebuilding infrastructures, reforming economicand political institutions or promoting democratic participation (Diehl 1994; Rat-ner 1995; Russett and O’Neal 2001; Jarstad and Sisk 2005; Durch 2006; Call andWyeth 2008).
Underlying this shift was the belief that military peacekeeping alone would notlead to self-sustaining peace unless accompanied by robust peacebulding effortsto address (i) structural factors believed to have been responsible for war in thefirst place and (ii) economic and political consequences of war that may leavea society vulnerable to renewed conflict (United Nations [Boutros-Ghali] 1992;Boutros-Ghali 2001; Cousens and Kumar 2001).
Three recent empirical studies, each employing different methods, have shownthat multidimensional peacekeeping operations are strongly associated with pro-longed peace after civil war. (Gilligan and Sergenti 2008; Fortna 2008; Doyle
2

and Sambanis 2006). Gilligan and Sergenti’s analysis demonstrates that this as-sociation is likely causal. Nonetheless, scholars and policymakers have debatedthe efficacy of multidimensional operations’ strategies to bring about economicgrowth and democracy (Paris 2004; Marten 2004).
These quantitative studies of peacekeeping effectiveness have been carried outat the mission and country level, studying whether peacekeeping operations havesucceeded in preventing the recurrence of another war. There have been few quan-titative efforts to evaluate specific peacebuilding components—such as economicrehabilitation, political development assistance, or human rights promotion—thatare embedded within multidimensional peacekeeping operations.1 Each peace-building component encompasses programs and activities designed to achieve in-termediate peacebuilding outcomes. These are discrete subgoals related to specificmandated elements (Russett and O’Neil 2001; Stedman et al. 2002). Many ofthese intermediate peacebuilding outcomes are presumed to be an essential pre-requisite to political stability and lasting peace (Kumar 1997 and 1998; Chopra1998). This presumption motivates our empirical analysis.
We use a micro-level approach to study intermediate peacebuilding outcomeswithin the context of the United Nations Operations in Cote d’Ivoire (UNOCI).We use original survey data, conflict event data, and other socio-economic vari-ables to measure micro-effects of peacekeeping in a number of ways.
We advance the study of peacekeeping in at least three ways. First, interme-diate peacebuilding outcomes are potential mechanisms at work in peacebuilding.Logically, if we do not find that peacekeeping affects some intermediate outcome,then we begin to cast doubt on the claim that such outcomes are integral to the
1For a comprehensive listing and a detailed description of each of these componentsand, the Handbook on United Nations Multidimensional Peacekeeping Operations accessi-ble at ¡http://www.peacekeepingbestpractices.unlb.org/Pbps/library/Handbook on UN PKOs.pdf¿.There are many descriptive studies of peacekeeping operations. These include the “LessonsLearned” reports conducted within the UN Department of Peacekeeping Operations (UNDPKO)itself. While extremely useful, these tend to be limited to descriptions of “key” episodes in apeacekeeping mission. They do not attempt to measure the general impact of peacekeeping activ-ities. An exception is the recent study by Humphreys and Weinstein (2007), which examined thedisarmament, demobilization and reintegration (DDR) component of the peacekeeping mission inSierra Leone. Our study follows in the example set by that study, although we cover different typesof activities and peacebuilding outcomes.
3

mechanism through which peacekeeping prolongs peace. Of course, there are lim-its to what we can infer. A finding of positive micro-level effects in conjunctionwith sustained macro-level peace within a single country does not allow us to inferthat the micro effects and macro peace are related. Such inferences require addingother macro-level comparisons to the analysis. This micro analysis can thus in-form future macro-level analysis. Second, intermediate outcomes are more undercontrol of peacekeeping (insofar as they are direct effects of specific programsand activities) than is the end outcome (i.e. overall peacebuilding). The latter islikely to be influenced by other factors outside control of peacekeeping. Thus,from a policy perspective, intermediate outcomes may make it possible to deter-mine what about peacekeeping works and what does not. Third, we contribute todeveloping micro-level methods for studying peacekeeping impacts. The micro-level quantitative approach allows us to construct, with rigor, a nuanced picture ofwhat peacekeeping operations actually do inside a country.
This is still a work in progress, but a summary of our results at this point areas follows. We find no general impact of the peacekeeping operation on people’sperceptions about whether resumption of conflict was likely at different points intime, and civilian victimization rates had already fallen to very low rates long be-fore the operation even deployed. Respondents did tend to state that the UNOCI-monitored Zone of Confidence created obstacles to renewing hostilities, and thereis a suggestive association between concerns about insecurity in forthcoming elec-tions and the absence of peacekeeping deployments. But the evidence thus farsuggests that UNOCI’s direct impact on the security situation was negligible. Wefind a suggestive association between peacekeeping deployments and economicwell-being, and between electoral sensitization activities and confidence in forth-coming elections. We find no clear association between the restoration of localauthorities and deployments. These associations will be subjective to more thor-ough causal analysis in future versions of this paper.
The paper proceeds as follows: the next section provides a bit of background tothe UNOCI operation. We then describe our methods. Next, we present findingswith respect to intermediate peacebuilding outcomes. We conclude by discussinghow we can improve the study of peacekeeping with micro-level analysis.
4

2 Background to the intervention
The civil war in Cote d’Ivoire erupted on September 19, 2002, following a failedcoup led by some 800 soldiers in a preemptive move against their planned de-mobilization from the armed forces. The rebels quickly gained control of majortowns in the northern and western regions. By the end of September, the rebelshad consolidated control on the northern half of the country, leading to a defactopartition of the country between the North (predominantly Muslim) and the South(predominantly Christian). Later, they merged with rebels from two other armedgroups who were operating from western regions and created a new umbrellapolitical movement called Forces Nouvelles (New Forces), with Forces Armeesdes Forces Nouvelles (FAFN) or Armed Forces of New Forces in English, as itsarmed wing. The group’s main political demands included the resignation of thecountry’s president, the holding of inclusive national elections, and the end to dis-crimination against northern populations. The fighting intensified in the ensuingmonths, putting strain on the political order and causing severe disruptions in thesocial and economic welfare of the population. By 2004, the conflict was militar-ily stalemated, and French forces (also known as La Licorne) were monitoring thecompliance of warring parties with the January 2003 Linas-Marcoussis ceasefireagreement. The political leadership from both sides and the international com-munity struggled to find a negotiated solution to the conflict. In year since theoutbreak of the war, the peace process has gone through at least seven peace ac-cords and three transitional governments. The culmination of the peace processat the time when this study was fielded was the Ouagadougou Accords (March2007).
These agreements in the peace process have included provisions for UN peace-keeping operations to assist with implementation of the ceasefire and peace ac-cords. The United Nations Mission in Cte d’Ivoire (MINUCI), a political mission,was set up by the Security Council in May 2003 to complement the operationsof the peacekeeping force of the Economic Community of West African States(ECOWAS) and French troops. In April 2004, MINUCI was replaced by theUnited Nations Operation in Cte d’Ivoire (UNOCI)—a multi-dimensional peace-keeping operation tasked with a wide range of activities, including protecting
5

civilians, building infrastructure, helping with the disarmament of combatants,and assisting with national and local elections. The political transition is stillrunning its course and the first postwar legislative and presidential elections arescheduled for November 29, 2009. However, there is an opportunity to ascertainthe impacts of UNOCI thus far, and we do so in this study.
3 Relevant intermediate peacebuilding outcomes
We focus on intermediate peacebuilding outcomes associated with increasing peo-ple’s (i) sense of security, (ii) ability to be economically productive, and (iii) senseof political normalcy and their ability to resolve political issues through peace-ful democratic means. We take these to be core components of peacebuilding.Restoring people’s sense of security would seem to be a necessary condition foreconomic and political improvements, and so there would seem to be a certain pri-macy to (i). Nonetheless, we are also interested in testing the claim that securityprovision increases the likelihood of sustainable peace by permitting growth in theeconomy and in democratic practice. Belief in the benefits of such economic anddemocratic transformation is a central premise in what we understand as the im-plicit theory that motivates multidimensional peacekeeping.2 Our aim is to studywhether there is evidence that such processes actually do follow from peacekeep-ing interventions. Our analysis is not exhaustive. There are possible indicatorsother than those that we use, and there are other components of multidimensionalpeacekeeping missions that we do not explore here due to time-constraints or lackof appropriate data.
4 Methods
4.1 Identifying impacts
We make systematic comparisons between individuals and communities who didand did not have exposure to peacekeeping activities. When time-varying data
2The intellectual cornerstone of this implicit theory is Boutros-Ghali’s original An Agenda forPeace (United Nations 1992).
6

are available, we study outcomes before and after deployments. This strategymakes sense provided that (i) there is some micro-variation in programmatic ac-tivities, (ii) program effects are reasonably measured at the individual- or com-munity level, (iii) we can find recipient and non-recipient communities that aresufficiently similar to permit inference with little omitted variable bias, and (iv)micro-effects are sufficiently local such that there is negligible spill-over of ef-fects from recipient communities into the non-recipient comparison communi-ties.3 Condition (i) holds with respect to many of UNOCI’s activities in Coted’Ivoire.4 With respect to (ii), UNOCI’s mandate contains activities such as voterregistration or education, civilian protection, and repatriation of refugees and in-ternally displaced persons, which are explicitly designed to operate at these lowerlevels of aggregation. National-level activities, such as reform of state-level in-stitutions, are likely important components of peacekeeping, but we do not studythem here. We discuss condition (iii) below in the context of an examination ofpatterns of exposure to peacekeeping activities. We worked to make (iv) plausibleby sampling in localities that were sufficiently distant from each other.
4.2 Data
Our outcome data come from our own survey of the population of Cote d’Ivoire.The survey was commissioned in the summer 2008 by the Inspection and Evalu-ation Division of the Office of Internal Oversight Services of the United Nationsas an assessment of UNOCI’s accomplishments, of public perceptions toward themission, and of what priorities remained. We operated as strictly independentconsultants with a mandate to conduct a scientific assessment. The survey sampleincluded 1,459 individuals aged 15 years or older, composed of a national sampleof 1,206 civilians and a sample of 253 ex-combatants that was quite limited due tosecurity and political conditions in the country. We use the high-quality civiliansample for all of our statistical analysis below, reserving use of the low quality
3In the jargon of the causal inference literature, condition (iii) encompasses the “overlap” and“unconfoundedness” principles, and condition (iv) encompasses the “non-interference” principle.Refer to Morgan and Winship (2007).
4The various programs included in UNOCI’s mandate can be found athttp://www.un.org/Depts/dpko/missions/unoci/mandate.html
7

ex-combatant sample for descriptive and illustrative purposes only.
Figure 1: Locations of respondents’ homes
Respondents’ Prewar Locations (ca. 2002) Respondents’ Postwar Locations (ca. 2008)
Descriptive statics for the sample and a map of respondents’ home locationsare in Table 1 and Figure 1, respectively. The civilian sample was drawn in 68localities based on a geographic stratification of the country into five regions:north, center, west, south, and the city of Abidjan. We oversampled within aband across the middle of the country known as the Zone of Confidence becausesubjects there were of particular interest to the commissioning agency. We useweights to correct for those types of sampling differences. Target households wereselected at random from clusters drawn probability proportional to size withineach of the strata. Respondents within households were selected at random froma roster of available adults. Overall, 88% of the first adult chosen in this wayparticipated; for the rest of the interviews, a second or third choice was made.We hired and trained local enumerators through the Ligue Ivoirien des Droits del’Homme. The enumerators conducted the interviews in local languages using astandard questionnaire. The data were entered by trained staff at INS.5
5More details of the design and data are available in a technical annex to the original impactevaluation. Please contact the authors for a copy. The survey instrument (in French) is alsoavailable.
8

Table 1: Sample demographics
Civilians CombatantsNo. Weighted SE for No.
in Sample sample weighted in SampleDemographic sample percent percenta percent sample percent
Gender:Male 876 73 46 2 235 93
Female 330 27 54 6 18 7Ethnicity:
Mande 334 28 26 3 134 53Gour 102 8 8 2 35 14Krou 293 24 22 3 67 26Akan 460 38 43 4 16 6Other 17 1 1 <1 1 <1
Age:15-30 yrs 612 51 62 5 118 4730-50 yrs 480 40 33 3 119 47
50+ yrs 114 9 5 1 16 6Education:
No formal education completed 348 29 45 5 156 62Primary education or more completed 858 71 55 4 97 38Urban/Rural:
Ruralb 676 56 43 5 13 5Urbanb 530 44 57 7 240 95
Income:No regular monetary income 724 60 64 5 180 71
Regular monetary income 482 40 36 3 73 29
Total sample size is 1,206 for civilians and 253 for combatants.a Detailed information on the weights is in a separate Technical Appendix that is available from the authors.b The urban/rural classification refers to the respondent’s current location, and it refers to towns and other small population
centers in addition to larger cities (e.g. Man or Abidjian).
As per the mandate that we were given in designing the study, the sample wasdrawn to meet two aims. Unfortunately, practical constraints force the aims towork against each other. The first aim, and the subject of this paper, was to assesspeacekeeping impacts. The second aim was to describe general conditions in thepopulation. The first aim would have us design a sampling plan that minimizedthe potential for confounding. Setting for ourselves the goal of estimating theeffects of peacekeeping in places that would likely receive peacekeeping, such asampling plan would try match sampled peacekeeping recipient communities withnon-recipient communities. The problem is that such a sample would likely leaveus with little or no data in areas that we would want in order to describe general
9

conditions in the population. We did our best with the information and knowledgethat we had at the time to balance these competing aims in our sampling plan.
Data on the location, scale, and timing of peacekeeping deployments werebased on the deployment maps issued by UNDPKO. Conflict events data werefrom the Peace Research Institute of Oslo’s “Armed Conflict Location and EventData” (ACLED) project, which generates time- and geo-coded conflict eventsdatasets from news reports (Nordas et al 2008). Demographic data and pre-wareconomic conditions data were from the Institut National de la Statistique de Coted’Ivoire (INS), and more fine-grained population distribution data were from geo-coded estimates by Columbia University’s Center for International Earth ScienceInformation Network. Infrastructure data were from Bogetic and Sanogo (2005).
4.3 Estimation
Sample sizes within regions were not so large and so the benefits of random sam-pling notwithstanding, we wanted to correct for deviations from population distri-butions in our sample. We thus used poststratification weights based on the mostrecent and reliable population information available, which in our judgment camefrom the high-quality INS 2005 Demographic and Health Survey (n=9686).6 Un-less explicitly noted, estimates below use these weights, and should thus be con-sidered estimates on the population (rather than on the sample).
Because peacekeeping activities are assigned at the level of communities, weoften use sous-prefectures and municipalities, analogous to counties, as community-level units of analysis. The sizes of household samples ranged considerably acrossthe 41 communities in civilian respondents currently reside (0%, 25%, 50%, 75%,and 100% quantiles are 5, 17, 20, 26, 266, respectively). We thus used hierarchicalsmall area estimation methods, as demonstrated in Gelman and Hill (2007, espe-cially pp. 301-210), to estimate community-level outcome variables. Rao (2003)discusses cross-validation studies that have shown such methods to be superiorto direct estimation (i.e. just taking the community mean) with sparse data. Forcommunities with few observations, the method effectively draws the estimated
6Details on the derivation of the weights are in the technical appendix to the original impactevaluation. This is available from the authors.
10

community average to the national mean, biasing the analysis in favor of accept-ing null hypotheses. We consider this a conservative approach to dealing withinstances of sparse data.
Estimates of the impact of peacekeeping activities took different forms, de-pending on the data available. In cases where over-time information was avail-able, we used panel methods, which allow us to purge the data of certain unmea-sured but fixed confounders. In cases where only cross-section information wasavailable, we use cross-sectional methods that, while still sensitive to possible un-measured confounders, attempt to be minimally reliant on modeling assumptions.To preserve the flow of the discussion below, we put the details of our estimationmethods in the appendix.
5 Exposure patterns and the potential for identify-ing impacts
The deployment of peacekeeping forces and related activities is based on missionassessments of need and feasibility. The features of localities that cause them toreceive deployments may confound estimates of the impact of peacekeeping. Fig-ure 2 shows a map of conflict deployment patterns beside a map of accumulatedpre-deployment conflict exposure. The connection is strong, but not perfect. Moregenerally, it strikes us as reasonable to believe that there is considerable loosenessin the connection between peacekeeping deployments, potential confounders (likeconflict history), and our outcomes of interest. Imperfect knowledge of the situa-tion on the ground, for example, ensures that there is always some randomness indeployment assignment. After conditioning on potential confounders and exploit-ing variation over time, this residual randomness is what we rely on to identifypeacekeeping’s micro-level impact. We use our awareness of imbalances in thedata and judgements about unmeasured factors to determine what potential biasesmay remain.
The potential for confounding in an empirical study is an attribute of the sam-ple, not the population. Thus, it is important to assess the sensitivity of our sam-ple to potential confounding. In this paper, we measure the impacts of exposure
11

Figure 2: Pre-deployment conflict events and PKO deployments
Accumulated exposure to pre−UNOCI conflict events (ca. 2004)
(Darker means more past conflict.)
Accumulated per−person deployment exposure (ca. 2008)
(Darker means more exposure.)
The left map is colored according to the number of major conflict events in a locality prior to UNOCI’s 2004 deployment.
Darker areas mean more events. The right map is colored according to accumulated per-person exposure to peacekeeping
troops (measured as armed troops per 1000 households).
to two types of program activities: peacekeeping deployments and elections sen-sitization activities. Programs are assigned at the community level, and so con-founding checks should be done at that level as well. We want to examine howthese exposure variables are associated with pre-exposure attributes of communi-ties and individuals that may also be associated to outcomes of interest. We shouldnot consider the need to condition on post-exposure variables, because doing sothreatens to bias our measures of impacts (post-treatment bias). In the analysesthat exploit over-time information, we can use differencing methods to “sweep”out the effects of fixed, pre-exposure confounders. However, even in those analy-ses, pre-exposure factors may have interactive effects with exposure itself or othertime-varying shocks. It is thus always important to examine how patterns in pre-treatment variables are related to exposure.
Consider Figure 3. From top to bottom, the graphs plot values of important
12

Figure 3: Balance of community variables over deployment levels
0 1 2 3
Sqr
t acc
umul
ated
con
flict
eve
nts
0 1 2 3 0 1 2 3 0 1 2 3 0 1 2 3
0 1 2 3
Avg
wea
lth in
dex
at s
tart
of w
ar
0 1 2 3 0 1 2 3 0 1 2 3 0 1 2 3
0 1 2 3
Log−
popu
latio
n a
t sta
rt o
f war
0 1 2 3 0 1 2 3 0 1 2 3 0 1 2 3
2004 depl.
0 1 2 3Reg
iona
l inf
rast
ruct
ure
at s
tart
of w
ar
2005 depl.
0 1 2 3
2006 depl.
0 1 2 3
2007 depl.
0 1 2 3
2008 depl.
0 1 2 3
Each dot is for a community that is included the civilian sample. The size of a dot is proportional to the size of the sample
in that community. The graphs plot values of community level variables (y axes) over deployment levels (x axes). The dots
were jittered a bit to show areas of concentration.
community-level variables over deployment levels, with one plot for each deploy-ment year (2004-2008). The variables are (1) accumulated conflict exposure, (2)local population size, (3) regional wealth levels, and (4) regional infrastructure.The deployment levels (0,1,2,3) refer to the following terms: 0 refers to no deploy-ment, 1 refers to non-forceful deployment (e.g. liaison officers) or force strengthof less than 1:1000 troops to population, 2 refers to force strength between 1:1000and 4:1000 troops to population, and 3 refers to force strength above 4:1000 troopsto population. Force strength allocations changed over time, increasing in somecommunities, and decreasing in others. Each dot in the graphs is a community,with the size of the dot proportional to the size of the sample drawn from thatcommunity (the very large dot is Abidjian).
We can study how much balance exists on important community-level vari-ables by checking whether a community, represented by a dot in a given graph,
13

has neighbors to the left and right at roughly the same height on the y-axis. Ourimpression is that balance is not so bad. Some exceptions are with Abidjian (thelarge dot), which is an outlier with respect to local infrastructure and populationsize. We would not be able to disentangle high infrastructure and population sizeeffects from other attributes of Abidjian. Also, we note that accumulated conflictevent levels are such that all communities with relatively high accumulated events(e.g. above the mean) received deployments in all periods except the first (2004).Reasonable balance exists over deployment levels 1,2, and 3. But counterfactualpredictions about how level 1,2, or 3 communities would have fared under a level0 deployment will be quite dependent on how we model the effects of accumulatedconflict events.
We are continuing to work on these balance assessments, and future versionsof the paper will include statistical summaries of balance/imbalance for other co-variates over deployment levels as well as for exposure to elections sensitizationactivities.
6 Estimates of Impacts
6.1 Security provision
Contrary to our prior beliefs about the primacy of security provision, we do notdiscern any substantial security-enhancing impact associated with UNOCI’s de-ployments to communities. We base this conclusion on (1) evidence about thetiming and location of security-related events relative to deployments, and (2) ev-idence on impacts of deployments on civilian reports on armed-conflict-relatedactivities.
As a first bit of descriptive evidence, we note that UNOCI arrived on the sceneafter a year-long lull in fighting and major reduction in victimization rates. Thelull commenced with the establishment of the confidence zone in early 2003. Fig-ure 4 shows estimated levels of civilian victimization due to violence from 2002 to2008. Each dot is an estimated number of conflict events or victimization episodesin the corresponding month; we plotted lowess curves to summarize trends. Therewere twelve major conflict events in the post-deployment period; they occurred
14

over 2004-5 within six communities. Bouake, which was the site of four of theseevents, and Korhogo, which was the site of three, were actually host to deploy-ments (out of ) at the time the events occurred. Events in Logouale (1 event),M’Bahiakro (1 event), Seguela (1 event), and Vavoua (2 events) occurred whenno deployments were present, although subsequently they all received deploy-ments. Post-2004 victimization rates were very low at the time UNOCI deployed,and they remained very low. We estimate that about 6% of households experi-enced some victimization event from 2004 to 2008. The corresponding figure forthe period of war from 2002 to 2004 is an astonishing 39%. There was clearly lit-tle scope for UNOCI’s deployments to improve things, and thus we are unable todetect any change in victimization rates around the time of the initial deploymentin early 2004. Geographic variation in post-2004 victimization reflects the geog-raphy of the renewed hostility in late 2004 and 2005. For those living in areas ofrenewed hostility either before or after the war, the rate of exposure to any of thelisted forms of victimization was 10-14% (95% CI); for those in other locations,the rate of victimization was 5-6% (95% CI). But as the evidence on the loca-tions of these conflict events foreshadows, proximity to UNOCI operations wasnot found to be significantly related to victimization risk (analysis excluded).7
There is little descriptive evidence of UNOCI deployments having been either ina position to tame major conflict dynamics, or associated with more security inthe much more secure post-confidence zone environment.
We measured the impact of UNOCI’s deployments on individuals’ reports ofevents that indicate renewed or on-going conflict. Our survey included a battery ofeight “yes-no” questions about whether people witnessed or suspected inter-ethnicfighting, presence of armed groups, or recruitment in their localities. We askedfor this information with reference to four time periods: (1) around the time of thesignature of the Linas-Marcoussis Accord and the installation of Seydou Diarra’sgovernment in January-February 2003; (2) in period just prior to the installationof Charles Konan Banny’s government in December 2005; (3) in the period justprior to the installation of Guiallaume Soro’s government in April 2007; and (4)in the period since Soro’s government was established to the time of the survey in
7Interestingly, ethnicity was an important variable: ethnic Mande were almost three times morelikely to experience post-2004 vicitimization relative to ethnic Akan.
15

Figure 4: Trends in Conflict and Victimization Over Time
+
++++++++++
+
++++++++++++
+
+++++++++
++
+++++
+
+++++++++++
+
+++++++
+
+++++++++++++++++
+
+++++++++++
+
+
+ + + +
Number of Major Armed Conflict Events for Each Date (ACLED)
1/01 1/02 1/03 1/04 1/05 1/06 1/07 1/08
0
2
11
CZ UNOCI+CZ
++ + +++
+
+++ +
+
++++
+++
+++++++++++ +++++ +++++++++ + + +++++++ + +++ + + +++
Households Exposed to Armed Conflict Per Month
1/01 1/02 1/03 1/04 1/05 1/06 1/07 1/08
017260
369698
CZ UNOCI+CZ
+
+
+++
+
+
+
+
+
++
+
+
+
+
++++
++++++++++++
+++++
+++++++++++++++ +
++
++ ++
+ +++++ + + + +
Households Displaced by War Per Month
1/01 1/02 1/03 1/04 1/05 1/06 1/07 1/08
011217
92270
CZ UNOCI+CZ
+ ++
+
+
+
+++
+++ ++
+
++
+
+
+ + ++ +++++ + +
++ +++
++ + +
Households Exposed to War−Induced Injury Per Month
1/01 1/02 1/03 1/04 1/05 1/06 1/07 1/08
0
14627
64863
CZ UNOCI+CZ
+
+
+
++
+
+
++
+ + +
+
++
+
+ + +
Households Exposed to War−Induced Sexual Abuse Per Month
1/01 1/02 1/03 1/04 1/05 1/06 1/07 1/08
0
4704
16373
CZ UNOCI+CZ
Notes: The top graph shows armed conflict event counts, and the bottom four graphs show estimates of monthly victimiza-
tion rates with trend lines (lowess fits). The dashed vertical lines mark starts of the confidence zone (“CZ”) and UNOCI
deployments (“UNOCI+CZ”). The maximum and average pre-UNOCI levels are on the vertical axes. For readability, the
y-axes are scaled to these maxima, rather than to a common scale.
August 2008.8 These responses were used to construct an index of “pessimisticreports” about the likelihood of renewed conflict in the different periods. We
8To make the survey less exhausting for respondents, we did not ask all respondents about alltime periods. Rather, all respondents were asked about the first time period. Then each respondentwas asked about only one randomly selected subsequent time period. Thus, for each latter timeperiod, we gathered data from approximately 400 of the 1,206 civilian respondents. We felt thiswould greatly increase the reliability of responses, making it worth the compromise of precision.
16

estimated how exposure to different deployment levels affected changes in pes-simistic reports over time. We controlled for any fixed effects as well as dynamiceffects of victimization events and exposure to major conflict events subsequentto UNOCI’s initial deployment. We took care to ensure no post-treatment bias inthe estimation. The appendix provides more details.
Figure 5 displays the results. The gray polygons are the 95% confidence in-tervals for estimates in baseline (i.e. no deployment) communities. The thickdashed line shows point predictions for communities with light (level 1), mod-erate (level 2), and heavy (level 3) deployments. The thin dashed lines outlinethe 95% confidence intervals for these estimates. We find that pessimistic reportsdid not decline more rapidly in deployment communities than in baseline com-munities. We know that there is imbalance over conflict exposure between peoplein baseline communities and those in deployment communities. So, more reliableinference can be drawn by comparing across deployment levels. The point predic-tions suggest that moderate and heavy deployments are more effective than lightdeployments, although this difference is only significant (95% confidence) whencontrasting light and moderate deployments during the first two years of deploy-ments. This reinforces our sense that UNOCI’s impact on security provision wassmall, if anything.
Additional descriptive evidence comes from perceptions about UNOCI andthe Zone of Confidence. A Zone of Confidence was established as part of theLinas-Marcoussis Accord in January 2003. It was a zone of geographic separa-tion between rebel forces in the North and government forces in the South. Manycombatants interviewed expressed the opinion that the Zone of Confidence madeit more difficult to launch attacks (84% stated as such) and was effective in pro-tecting them against enemy attacks (73%). But even if French, ECOWAS, andultimately UNOCI troops would monitor the Zone, it was a creation of the partiesto the conflict themselves, and had been in operation for about a year prior to UN-OCI’s arrival. The added value of UNOCI’s deployments are difficult to discern.Majorities of respondent civilians understood, unprompted, that the objective ofthe confidence zone was to prevent military clashes between the armed forces andto provide protection to the civilian population (98% and 91%, respectively). Butmost respondents nationwide (52%) disagreed with the idea that civilians within
17

Figure 5: Exposure to deployments and change in pessimistic reports
Light deployment vs. baseline
SD
cha
nge
in p
essi
mis
tic r
epor
ts in
dex
2003 2004 2005 2006 2007 2008
−1.
5−
0.75
0
Moderate deployment vs. baseline
Year
2003 2004 2005 2006 2007 2008
−1.
5−
0.75
0
Heavy deployment vs. baseline
2003 2004 2005 2006 2007 2008
−1.
5−
0.75
0
The gray region is the 95% confidence interval for estimated change in the pessimistic report index for subjects in commu-
nities that did not receive deployments. It is the same on all three graphs. The axis is scaled to the standard deviation of the
pre-deployment (2003) index values. The dashed lines show the estimated changes for subjects in recipient communities.
The thick dashed lines show the point estimates, and the thin dashed lines contain the 95% confidence intervals. For details
on the estimation, refer to the appendix.
the confidence zone were secure. Respondents emphasized primarily and in equalmeasure (i) “chaos” and a lack of law and order (57% among those who said con-fidence zone residents were less secure), and (ii) the likelihood that confidencezone residents will be victims if the war were to resume (59%). 38% of those whothought confidence zone residents were less secure emphasized a lack of confi-dence in the “impartial forces” guarding the zone; and after further probing, theprimary reasons for this lack of confidence were a sense that the impartial forceshad not “mastered the terrain.”
UNOCI may have profited from the restraint of the parties to the war, but thereis little here to suggest that the assignment of UNOCI deployments to communi-ties, per se, did much to affect the security situation within those communities.This is due in part to the fact there was not much left to do in this respect bythe time UNOCI deployed. This may also be due, in part, to limitations of theoperation itself.
18

6.2 Economic recovery
We present preliminary evidence of the potential impact of UNOCI deploymentson the restoration of the economic vitality of households. In general, UNOCI’spresence was associated with less severe economic losses experienced by house-holds, although at this point, we assert this as a merely descriptive claim. Furtheranalysis will attempt to measure causal impacts. We constructed pre- and post-warhousehold economic welfare indices by combining survey measures of materialpossessions, domicile quality, income, and amount of food consumed regularly.From these we also created a measure of economic welfare change. 9 For theeconomic change index, households achieve a negative score when their currentsituation is worse than the pre-war situation; positive scores reflect improvementsrelative to the pre-war status quo. As the map in Figure 6 displays, the areasthat have been the hardest hit economically include those near the Liberian borderwhere fighting was intense, as well as other localities within and along the Zoneof Confidence.
The map on the right in Figure 6 shows the results of a very preliminary anal-ysis, using only a dichotomous measure of whether a community was or was nothost to deployments. Future work will exploit all the variation in deploymentintensities. The map illustrates the extent to which conflict history is associatedwith economic hardship. After taking this into account, peacekeeping deploy-ments were associated with less severe economic losses. The most generous in-terpretation is given by the diagonal dashed lines, which show regression lines forpeacekeeping and non-peacekeeping localities. Despite the good fit to the data forpeacekeeping localities, note that the regression comparison forces us to extrapo-late far beyond the data for the none-peacekeeping localities. A very conservativeestimate is given by the space between the short horizontal lines to the left of
9The indices do not translate directly into tangible economic quantities. Nonetheless, we feelthat the index provides a better measure than monetary income. First, as a developing countrywith a large rural base, many needs are met through goods being handed down or exchangedwithout money. We estimate that some 20-25% of the population obtains most of their food fromsources other than markets (e.g. by growing or catching food by themselves). Second, incomestreams are often irregular in economies such as this. Thus, responses to questions about“monthlyincome” can be misleading. Rotated factor scores on the items listed above were used to producethe indices.
19

the graph. These lines indicate average economic loss levels in peacekeeping andnon-peacekeeping localities, restricting ourselves to communities that share com-mon common conflict histories. Peacekeeping localities still score better by thismeasure, but the difference is not significant at 95% confidence. The truth re-lationship probably lies somewhere between these two estimates. By exploitingall the variation in deployment intensities, we will be able to do more to reducemodel dependence of this sort.
Figure 6: Household economic change, by locality and over conflict incidencelevels
No sampleBetterBit betterLittle changeBit worseMuch worse
Pre−UNOCI Conflict Incidents
FERKESSEDOUGOU
KORHOGO
KATIOLA
BOUAKE
VAVOUA
GOHITAFLA
SAKASSOU
MAN
DJEBONOUA
LOGOUALE
BANGOLO
DALOA
ABENGOUROU
DUEKOUE
GUIGLO
BETTIE
ABIDJAN−VILLE
TABOU
SINEMATIALI
BONDOUKOU
KANI
BIANKOUMA
TANDA
BROBOFACOBLY
TRANSUATIE−N’DIEKROSANGOUINE
KOUIBLY
ZOUKOUGBEU
GBOGUHE
ARRAH
BONGOUANOUSINFRA
ISSIA
OUME
AFFERY
ADZOPERUBINO
SOUBRESASSANDRA
GRAND−BASSAM
0 4 16 36
−0.06
−0.01
The map on the left gives average household economic change for each locality in the sample. The black polygon merely
outlines the Zone of Confidence. In the graph to the right, localities’ average change in economic welfare is graphed
over past conflict history. Black names and lines correspond to areas with peacekeepers, gray corresponds to areas where
they were not. The dashed lines show regression fits; the short solid lines show average changes in economic welfare for
peacekeeping and non-peacekeeping cases that overlap on the conflict incidents dimension.
An important part of the restoration of economic normalcy is the return ofwar-displaced households to their areas of origin. When we divide the economicchange scores into “worst-off,” “middle,” and “best-off” categories, we find that42% of displaced households are in the “worst-off” category, as compared to only
20

19% of settled households.10 We estimate that approximately 30% of civilianhouseholds were residing in 2008 in places different than their 2002 home loca-tions. Violence-induced changes in locality account for approximately one thirdof these; the rest are presumably due to indirect effects of war as well as normaleconomic considerations (e.g. job seeking). Thus, about 10% of the populationoverall were “war-displaced.” About 12% of households were violently displacedbut have since returned to their pre-war home localities. Thus, some 22% experi-enced a violent displacement episode at some point. We do not consider refugeesstill residing outside Cote d’Ivoire in this calculation.11
Preliminary evidence on UNOCI’s impact on return rates is mixed. Table 2shows unadjusted estimates of displaced household return rates as well as resultsfrom a basic conditional logit regression (grouped by time period). The resultsare broken down by region and time period, as explained in the caption to thetable. UNOCI’s presence has generally been associated with slower rates of re-turn. There is significant heterogeneity in these associations. For example, returnrates in the Zone of Confidence localities reached an estimated 44.4% by 2008. Inwar-affected Centre/Nord-ouest and Sud/Est localities, return rates for the largenumbers of displaced from those regions have barely risen above a trickle for lo-calities where UNOCI has been deployed—ranging from 0 to only 3.5%. Furtheranalysis will explore these variations and come to a more definitive statement onUNOCI’s impact on displacee return.
10The middle category consists of those with economic change scores roughly equivalent to nochange in economic well-being. An estimated 51% of the population fall in this category. Thosebelow and above this score were assigned “worst off” and “best off,” respectively.
11The extent of displacement that we recorded came as a surprise to us, and thus the survey didnot contain follow-up questions that would allow us to investigate this issue in much detail. Weconsider this to an area where much more study should be done.
21

Table 2: Return of war-displaced households to pre-war home localities
Statusa Home reg.b Statisticc YearRegr. coef.d 2002 2003 2004 2005 2006 2007 2008
No PKO CNO,war n 57 81 11 9 10 10 4N 97869 130852 32035 29484 31302 31302 5676
β = 0e R 690 14223 2551 0 0 8564 0r 0.7 10.9 8 0 0 27.4 0
CNO,peace n 5 9 12 11 9 8 6N 7980 10868 17536 15120 14083 10348 7991
β ≈ 0 R 0 0 2416 1037 3735 0 763r 0 0 13.8 6.9 26.5 0 9.5
SE,war n 20 29 4N 41576 66960 7708 no obs. f
β = 1.1∗∗ R 2937 16876 0r 7.1 25.2 0
SE,peace n 2 3 2 2 2 2 1N 1889 2411 1970 1970 1970 1970 522
β =−.3 R 0 0 0 0 0 1448 0r 0 0 0 0 0 73.5 0
CZ n 51 80 37 12 7 6 6N 98821 138447 53129 19745 12942 12746 12746
β = 1.0∗∗ R 7796 25197 17924 1330 196 0 0r 7.9 18.2 33.7 6.7 1.5 0 0
PKO CNO,war n 63 62 60 59 61N no obs. f 91889 96389 92928 94956 110293
β =−1.1∗∗ R 1796 3462 489 1726 3781r 3.4 2.5 1.1 1.3 2
CNO,peace n 1 1 1 1 3N no obs. f 348 348 348 348 2706
β = .g R 0 0 0 0 0r 0 0 0 0 0
SE,war n 21 26 25 24 23N no obs. f 44827 53724 51816 50628 50065
β =−1.3∗ R 0 1908 1188 563 496r 0 3.6 2.3 1.1 1
SE,peace n 2 2 2 2 2N no obs. f 615 615 615 615 615
β = .g R 0 0 0 0 0r 0 0 0 0 0
CZ n 30 36 37 28 24N no obs. f 64003 69468 71089 54790 51818
β = .7∗ R 11201 5728 16299 2972 23033r 17.5 8.2 22.9 5.4 44.4
The number of displaced households in the sample for which full information was recorded was 234. aCategorizes house-
holds based on whether peacekeepers are stationed in prewar sous-prefecture of residence for given year. bRegion contain-
ing household’s prewar sous-prefecture of residence: “CNO,war” is conflict-affected Center/North-west, “CNO,peace”
is non-conflict-affected CNO; “SE,war” is conflict-affected South/East, “SE,peace” is non-conflict-affected SE; “CZ” is
confidence zone. cStatistics: n is number of sample households that were displaced at the start of the year. Based on
n and the sample weights, N estimates the number of households in the population displaced at the start of the year. R
estimates how many out of N returned home that year. r is the return rate, expressed as a percentage (i.e. 100* RN
). Es-
timates are based on sample weights. dCoefficient from a conditional logit regression. ∗∗ indicates p < .01, ∗ indicates
p < .1. eReference category in regression. f Peacekeepers were stationed in all sampled “SE,war” sous-prefectures, and
peacekeepers were not deployed prior to 2004. gInsufficient observations to identify regression coefficient.
22

6.3 Political rehabilitation and transformation
We collected data that will allow us to study the mission’s impact on rehabilitatingand transforming political institutions in the country. Here, we present preliminaryresults.
Figure 7: Timing of Return of Local Leaders to Communities that Experi-enced Leadership Flight During the War
Pre−UNOCI Conflict Incidents
Est
imat
ed lo
cal l
eade
r re
turn
dat
e
BANGOLO
BOUAKE
DJEBONOUA
DUEKOUE
FERKESSEDOUGOU
GUIGLO
KATIOLA
KORHOGO
LOGOUALE
MAN
SAKASSOU
VAVOUA
BIANKOUMA
BROBO
FACOBLY
KANI
SANGOUINE
SINEMATIALI
TIE−N’DIEKRO
BIANKOUMA
BROBO
FACOBLY
KANI
SANGOUINE
0 4 16 36
1/05
1/06
1/07
1/08
Notes: The graph shows estimated return dates of leaders to communities that had experienced leadership flight, plotted
over conflict history. Names of localities with peacekeepers are in black, while those without peacekeepers are in gray.
Estimates suggest that localities with more intense past conflict had leaders return much sooner than those with less intense
conflict.
The survey also measured the restoration of local political order in terms ofquestions on the flight and dates of re-establishment of local political authorities.12
Nineteen out of the 42 localities (45%) covered by the survey experienced leader-ship flight, with all such flight happening prior to UNOCI’s arrival. Among these19 localities, peacekeeping deployments were assigned to 12. Figure 7 graphs the
12This information was gathered from the surveys. Sometimes respondents gave different an-swers about whether local leaders fled and, if they fled, when they returned. Disagreement onwhether leaders fled never produced a split more even than 30% one way and 70% the other, thuswe simply took the more common response on this question. For return dates, responses tended tobe clustered around common dates, and so we simply took the average of the dates reported.
23
estimated return date of local leaders over conflict history, with UNOCI-coveredlocalities in black, and non-UNOCI-covered localities in gray. Localities with his-tories of more intense fighting actually had leaders return quite a bit sooner thanthose with less intense past conflict. Once this is taken into account, there is nosignificant difference in the return dates for localities with peacekeepers comparedto those without.
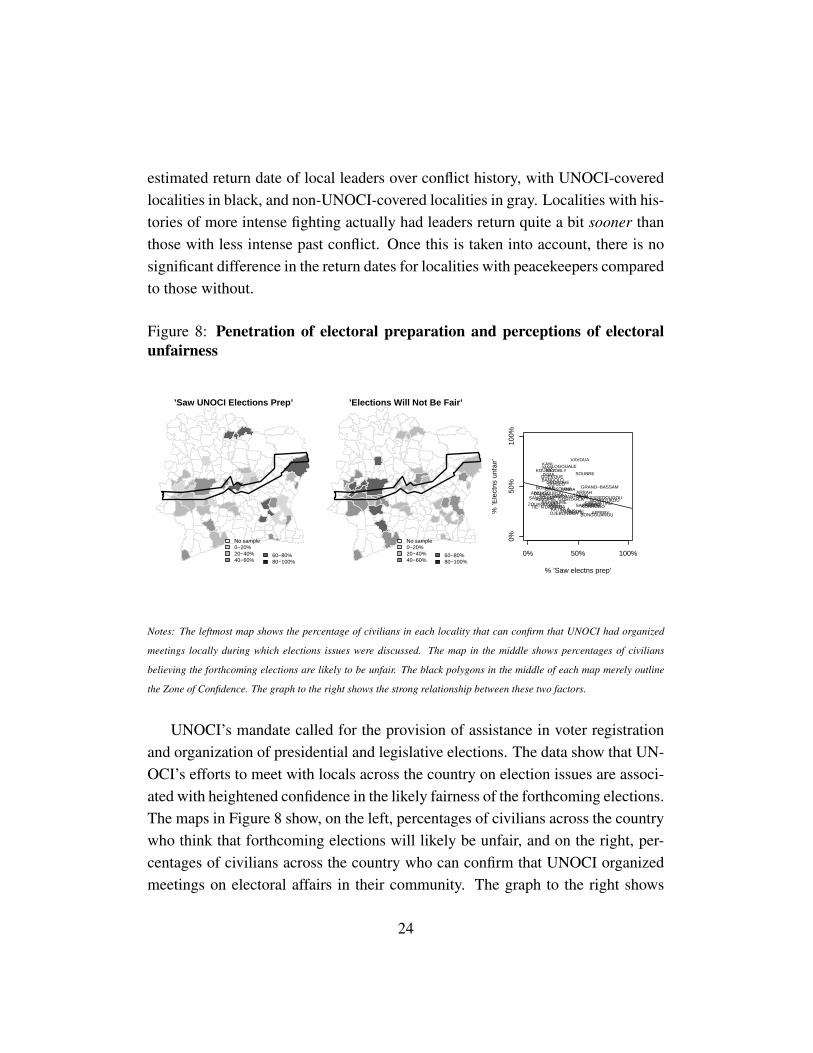
Figure 8: Penetration of electoral preparation and perceptions of electoralunfairness
’Saw UNOCI Elections Prep’
No sample0−20%20−40%40−60%
60−80%80−100%
’Elections Will Not Be Fair’
No sample0−20%20−40%40−60%
60−80%80−100%
% ’Saw electns prep’
% ’E
lect
ns u
nfai
r’FERKESSEDOUGOU
KORHOGOSINEMATIALI
BONDOUKOU
KANI
KATIOLA
BIANKOUMATANDABOUAKE
BROBO
VAVOUA
GOHITAFLA
FACOBLY
TRANSUASAKASSOU
MAN
DJEBONOUATIE−N’DIEKRO
SANGOUINE
KOUIBLYLOGOUALE
BANGOLO
DALOAABENGOUROU
ZOUKOUGBEU
GBOGUHE
ARRAH
BONGOUANOU
DUEKOUE
GUIGLO
SINFRA
ISSIA
OUME
AFFERY
ADZOPERUBINO
BETTIE
SOUBRE
SASSANDRAABIDJAN−VILLE
GRAND−BASSAM
TABOU
0% 50% 100%
0%50
%10
0%
Notes: The leftmost map shows the percentage of civilians in each locality that can confirm that UNOCI had organized
meetings locally during which elections issues were discussed. The map in the middle shows percentages of civilians
believing the forthcoming elections are likely to be unfair. The black polygons in the middle of each map merely outline
the Zone of Confidence. The graph to the right shows the strong relationship between these two factors.
UNOCI’s mandate called for the provision of assistance in voter registrationand organization of presidential and legislative elections. The data show that UN-OCI’s efforts to meet with locals across the country on election issues are associ-ated with heightened confidence in the likely fairness of the forthcoming elections.The maps in Figure 8 show, on the left, percentages of civilians across the countrywho think that forthcoming elections will likely be unfair, and on the right, per-centages of civilians across the country who can confirm that UNOCI organizedmeetings on electoral affairs in their community. The graph to the right shows
24

the strong relationship between these two factors. For example, if the number ofpeople exposed to UNOCI electoral programming increases from 25% to 75% ina locality, the number of people who doubt the likely fairness of upcoming elec-tions is predicted to decrease from about 50% to about 35%, a substantial gain inconfidence. Despite high levels of concern in the western confidence zone locali-ties, we note that perceptions of electoral fairness were not clearly associated withlocal conflict history or perceptions of local lawlessness and insecurity (analysisnot shown). Those who did recognize UNOCI’s electoral assistance role tendedto emphasize UNOCI’s meetings with local leaders and citizens to raise aware-ness about the electoral process. This appreciation varied greatly from region toregion, as indicated by the left-most map in Figure 8. Less than 10% of peoplewere estimated to be able to confirm that UNOCI was otherwise engaged in elec-toral preparations—e.g. with assistance in completing voter rolls, registration, orobserver training.
Table 3: Will forthcoming elections be fair? If not, why? (%)
Regiona Fair UnfairDishonesty Disorganization Insecurity Other
1a. No PKO, CNO, war 16 (5) 17 (9) 8 (2) 59 (2) 02a. No PKO, CNO, no war 35 (10) 14 (7) 12 (2) 30 (9) 9 (4)
3a. No PKO, SE, war No obs.c
4a. No PKO, SE, no war 61 (6) 14 (3) 13 (4) 9 (2) 3 (1)5a. No PKO, CZ 72 (6) 12 (5) 3 (3) 9 (4) 4 (3)
No PKO, total 59 (5) 14 (3) 11 (3) 13 (3) 4 (1)
1b. PKO, CNO, war 64 (6) 12 (2) 6 (3) 14 (2) 4 (2)2b. PKO, CNO, no war No obs.c
3b. PKO, SE, war 58 (5) 10 (3) 15 (4) 10 (2) 8 (2)4b. PKO, SE, no war 95 (2) 0 2 (>1) 0 3 (2)
5b. PKO, CZ 43 (11) 2 (1) 10 (6) 39 (11) 5 (2)PKO, total 58 (4) 9 (2) 12 (3) 14 (2) 7 (2)
Nationwide 58 (4) 11 (2) 12 (3) 13 (2) 6 (2)
Notes: Percents given for each row, with standard errors in parentheses. If no standard error is reported, then no observa-
tions were recorded for that cell, in which case standard errors are not available.a,b,cSee Notes a, b, and c in Table ??.
As the plot on the right in Figure 8 shows, just under half the population (about42 %) doubts that forthcoming elections would be fair. We asked for people’s rea-sons for their doubts. People’s concerns were coded as falling into one of three
25

categories: (i) concerns about dishonesty—that is, general political distrust anda belief that politicians in Cote d’Ivoire were, on the whole, dishonest; (ii) con-cerns about disorganization—that is, a sense that preparation for the electionswas disorganized, being rushed, or otherwise inadequate; (iii) concerns aboutinsecurity—that is, a sense of concern over the fact that disarmament was lag-ging, armed groups were still active, and the resumption of war seemed a realpossibility. Table 3 shows the results, broken down by region, conflict affected-ness, and whether peacekeepers were based in an individual’s locality. For thewar-affected Center/Northwest, we see an enormous increase in political confi-dence in areas with peacekeepers; nearly all of this difference is attributable tochanges in perceptions about whether insecurity will undermine elections. In thenon-war-affected South/East, we see large increases in political confidence in ar-eas with peacekeepers, although the reasons for this increase are attributable tolarge decreases in all types of concerns. In the non-war-affected Center/West, wehave no areas where peacekeepers were deployed, and insecurity concerns dom-inate among those skeptical about elections. All respondents in the war-affectedSouth/East came from areas where peacekeepers were deployed, and we note thatconcerns about disorganization predominate among skeptics there. An unusualsituation holds for the confidence zone localities. There, peacekeepers’ presenceis associated with much greater skepticism about elections, with insecurity con-cerns dominating this difference. This may be attributable to much higher concen-trations of former combatants in the areas with peacekeepers, or to other aspectsof the war history of these localities. These results would seem to contradict, atleast in some places, our conclusions about UNOCI’s negligible impact on secu-rity. This is something that we plan to examine further.
7 Conclusion
We offer a short recapitulation of the findings thus far. The quality and rich-ness of the data, combined with reasonable amounts of covariate balance in oursample, suggest that there is considerable scope for causal analysis of UNOCI’smicro-level impacts. We have already engaged in such analysis with respect tosecurity provision. We find little to support the idea that UNOCI’s deployments
26

significantly affected the security situation, which had already improved tremen-dously prior to UNOCI’s arrival. We found only a suggestive association be-tween feelings that insecurity would mar forthcoming elections and deploymentpatterns. We do find that UNOCI’s presence was associated with less severe eco-nomic losses, and that penetration of electoral assistance activities was associatedwith more confidence in forthcoming elections. We do not find a clear associ-ation between deployment patterns and the restoration of local authorities. Theintermediate outcomes that we study are not exhaustive of the types of activitiesin multidimensional peacekeeping. Future research will consider other aspects.Nonetheless, taken as they are, our preliminary results already suggest the needto emend current theories of why peacekeeping works—perhaps de-emphasizingsecurity aspects, and placing more emphasis on the economic and political pro-grammatic aspects. These results help us to unpack the strong association betweenpeacekeeping and prolonged peace—something that current quantitative studieshave not been able to do. But stronger conclusions require that we wait for theresults of our further empirical analysis.
27

Appendix
A Statistical models and estimates
A.1 Change in perceptions about renewed conflict
The nature of our data are such that for each individual, i, data on perceptionsof the possibility of renewed conflict were available for period 0 (January 2003)and one subsequent period, t (see the text for the other years). For each year,the data consisted of 8 yes-no questions about whether respondents witnessedor suspect conflict related activities in their localities. These data were used toconstruct an index of “pessimistic reports.” The steps for constructing the in-dex were as follows: first, missing binary item data were imputed with AmeliaII (Honaker et al 2009) using demographic variables, location and time fixed ef-fects, and the variable discussed below. We note that missing item values werefrequent—sometimes up to 35% of observations for a given item. This was duelargely to “don’t know” responses—but that overall, sufficient data was availableon nearly all observations to be useable. We dropped 28 observations (out of1,206) because too much data was missing. Then, a two-parameter logistic itemresponse model was fit to the data, and factor scores were extracted.13 Thesefactor scores were very highly correlated with simple sums of the items for eachindividual (ρ = .95). For the sake of this analysis, the factor scores are better thana simple summation of the items because they weight the contribution of the dif-ferent items according to their estimated “discrimination” and “difficulty”14, andbecause they are arrayed onto a scale that is not, in principle, truncated. The factorscores are such that a higher value means more pessimism about renewed or on-going conflict inherent in the answers provided by the respondent. We accountedfor uncertainty in the factor score estimates by weighting our regression analysesby the inverse of the estimated variance of the factor score estimates.
13The item response analysis was conducted with the ltm package in R (Rizopoulos 2006). Wedecided on a two-parameter model after a likelihood ratio test demonstrated significant improve-ment (p < .001) over a one-parameter Rasch model. The empirical Bayes setting was used toextract the factor scores.
14Refer to Rizopoulos (2006) for a discussion of these concepts in item response models.
28

To model the impact of deployments on the index of pessimism, we assumedthe following data generating process:
yit =αi + γc(i) +3
∑s=1
τs1(t = s)+3
∑l=1
θl1(dc(i),t = l)+3
∑s=2
3
∑l=1
βsl1(t = s)1(dc(i),t = l)
+κCc(i),t +2
∑k=1
φk1(dc(i),0t = k)+ψVit + εit
yi0 =αi + γc(i) + τ0 + εi0,
where αi is an individual level effect; γc[i] is a community level effect; τs is thetime effect for period s; dc(i),t is the deployment level (1,2, or 3) active in i’scommunity, c, in period t, if there was a deployment; Cc(i),t is an indicator forwhether there were any major conflict events in community c(i) between period 0and period t; and dc(i),0t is the accumulated peacekeeping exposure level (1 or 2)in community c(i) between periods 0 and t; and Vit is an indicator for whether theindividual experienced any victimization events between periods 0 and t . Takingthe first difference and rearranging the time effects yields the following:
yit − yi0 =3
∑s=1
(τs− τ0)1(t = s)+3
∑l=1
θl1(dc(i),t = l)+3
∑s=2
3
∑l=1
βsl1(t = s)1(dc(i),t = l)
+κCc(i),t +2
∑k=1
φk1(dc(i),0t = k)+ψVit +(εit − εi0), (1)
thus sweeping away the time-invariant effects. We can rewrite (1) as follows:
yi =3
∑s=1
τs +3
∑l=1
θl1(dc(i),t = l)+3
∑s=2
3
∑l=1
βsl1(t = s)1(dc(i),t = l)
+κCc(i),t +2
∑k=1
φk1(dc(i),0t = k)+ψVit + εi.
We assume that Cov(εi, ε j) = 0 only if c(i) 6= c( j), and so we estimated standarderrors asymptotically robust to within-community correlation (Baltagi 2005, p.14). The θl’s and βsl’s measure per-period differences attributable to deploymentsin different time periods. The κ , φk’s, and ψ are estimated to reduce spuriousness.Unbiased estimation of the θl’s and βsl’s requires that other shocks to individuals
29

or communities that occured between periods 0 and t be exogenous to peacekeep-ing deployment or inconsequential for respondent attitudes. Estimates for the 16coefficients in this model are shown in Table 4. The trajectories in Figure 5 werecomputed by summing the appropriate coefficients.
Table 4: Estimation results : pessimistic reports indexVariable Coefficient (Std. Err.)t1 -0.387 (0.056)t2 -0.508 (0.043)t3 -0.938 (0.043)d1 0.167 (0.065)d2 -0.057 (0.111)d3 0.110 (0.061)t2xd1 -0.055 (0.142)t2xd2 0.043 (0.231)t2xd3 -0.227 (0.234)t3xd1 -0.109 (0.131)t3xd2 0.246 (0.193)t3xd3 0.243 (0.228)C 0.065 (0.125)d0t1 -0.047 (0.117)d0t2 -0.338 (0.120)V0t 0.016 (0.062)
N 1178R2 0.395
DETAILS ON FURTHER ANALYSES TO BE REPORTED HERE.
30

References
Baltagi B. 2005. Econometric Analysis of Panel Data. Hoboken: Wiley.
Bogetic, Zeljko, and Issa Sanogo. 2005. “Infrastructure, productivity and urbandynamics in Cote d’Ivoire.” World Bank Africa Region Working Paper.
Boutros-Ghali B. 1996. An Agenda for Democratization. New York: UnitedNations.
Chopra J, ed. 1998. The Politics of Peace-Maintenance. Boulder: Lynne Rien-ner.
Cousens E, Kumar C. 2001. Peacebuilding as Politics: Cultivating Peace inFragile Societies. Boulder: Lynne Rienner.
Diehl P. 1994. International Peacekeeping. Baltimore, MD: Johns Hopkins Uni-versity Press.
Doyle M, Sambanis N. 2000. “International Peacebuilding: a Theoretical andQuantitative Analysis.” American Political Science Review. 94(4):779801.
Doyle M, Sambanis N. 2006. Making War and Building Peace: United NationsPeace Operations. Princeton, NJ: Princeton University Press
Durch W, ed. 2006. Twenty-First-Century Peace Operations. Washington, DC:United States Institute of Peace and the Henry L. Stimson Center.
Fortna VP. 2008. Does Peacekeeping Work? Shaping Belligerents Choices afterCivil War. Princeton, NJ: Princeton University Press.
Gelman, Andrew, and Jennifer Hill. 2007. Data Analysis Using Regression andMultilevel/Hierarchical Models. Cambridge: Cambridge University Press.
Gilligan M, Sergenti E. 2008. “Do UN Interventions Cause Peace? Using Match-ing to Improve Causal Inference.” Quarterly Journal of Political Science.3:89122.
31

Honaker J, et al. 2009. Amelia II: A Program for Missing Data. Version 1.2-13.http://gking.harvard.edu/amelia/
Humphreys M, Weinstein J. 2007. “Demobilization and Reintegration.” Journalof Conflict Resolution. 51(4):531-567.
Institut National de la Statistique (INS), Ministre de la Lutte contre le Sida, Coted’Ivoire, ORC Macro. 2006. Enquete sur les Indicateurs du Sida, Coted’Ivoire 2005: Rapport Final. Calverton, USA: INS, ORC Macro, Decem-ber 2006. Data available via the Measure DHS archive, http://www.measuredhs.com.
Jarstand A, Sisk T, eds. 2005. From War To Democracy: Dilemmas of Peace-building. New York, NY: Cambridge University Press.
King G, Zeng L. 2006. “The Dangers of Extreme Counterfactuals.” PoliticalAnalysis 14:131-59.
Kumar K, ed. 1998. Postconflict Elections, Democratization and InternationalAssistance. Boulder: Lynne Rienner Publishers
Marten K. 2004. Enforcing the Peace: Learning from the Imperial Past. NewYork: Columbia University Press
Morgan S, Winship C. 2007. Conterfacturals and Causal Inference: Meth-ods and Principles for Social Research. New York: Cambridge UniversityPress.
Nordas, Ragnhild, et al. 2008. Cote d’Ivoire Armed Conflict Location and EventData (ACLED) File. Centre for the Study of Civil Wars, Peace ResearchInstitute of Oslo.
Paris R. 1997.“Peacebuilding and the Limits of Liberal Inrernationalism,” Inter-national Security. 22(2):54-89.
Paris R. 2004. At Wars End: Building Peace After Civil Conflict. New York, NY:Cambridge University Press.
Rao, JNK. 2003. Small Area Estimation. New York: Wiley.
32
Ratner S. 1995. The New UN Peacekeeping: Building Peace in the Lands ofConflict after the Cold War. New York, NY: St. Martins Press
Rizopoulos D. 2006. “ltm: An R package for latent variable modeling and itemresponse theory analyses.” Journal of Statistical Software. 17(5):1-25.
Russett B, Oneal J. 2001. Triangulating Peace: Democracy, Interdependence,and International Organizations. New York, NY: W.W. Norton.
Stedman S et al, eds. 2002. Ending Civil Wars: The Implementation of PeaceAgreements. Boulder, CO: Lynne Rienner.
United Nations. 1992. An Agenda for Peace: Preventive diplomacy, peacemak-ing and peace-keeping. Report of the Secretary-General [Boutros Boutros-Ghali] (A/47/277 - S/24111).
Walter B. 2002. Committing to Peace: The Successful Settlement of Civil Wars.Princeton: Princeton University Press.
33