latin america: outlook and challenges - cemla · latin america: outlook and challenges alejandro...
TRANSCRIPT
International Monetary Fund Washington, DC. May 15, 2013
Latin America: Outlook and Challenges
Alejandro Werner Director
Western Hemisphere Department

Developments and Outlook
Policy Challenges and Priorities

Growth moderating toward potential, with little spare capacity
(pick up in Brazil after deceleration)
Sources: National authorities and IMF staff estimates. ¹ Includes data for Argentina, Brazil, Chile, Colombia, Costa Rica, Ecuador, Mexico, Paraguay, Peru and Venezuela.
Selected Latin America: Real GDP Growth (12-month percent change, seasonally adjusted, quarterly)
-4
-2
0
2
4
6
2006
20
07
2008
20
09
2010
20
11
2012
20
13
median
Sources: IMF, World Economic Outlook; and IMF staff estimates. 1 10–90 percentile range for all Latin American countries (excludes the Caribbean).
Latin America: Output Gaps (Percent of potential GDP)
10–90 percentile range -20
-15 -10
-5 0 5
10 15
Q1
Q3
Q1
Q3
Q1
Q3
Q1
Q3
Q1
Q3
Q1
Q3
25–75 percentil
median
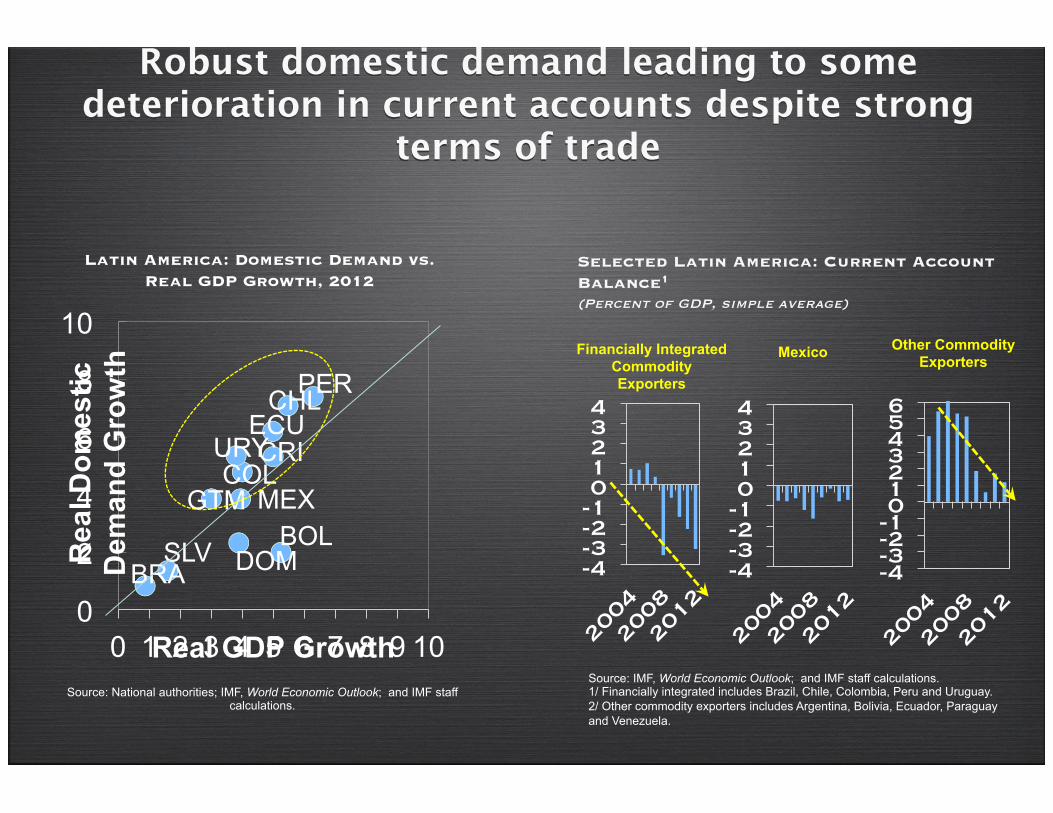
Robust domestic demand leading to some deterioration in current accounts despite strong
terms of trade
Selected Latin America: Current Account Balance1
(Percent of GDP, simple average)
Latin America: Domestic Demand vs. Real GDP Growth, 2012
Source: National authorities; IMF, World Economic Outlook; and IMF staff calculations.
-4 -3 -2 -1 0 1 2 3 4
-4 -3 -2 -1 0 1 2 3 4 5 6
Mexico Other Commodity Exporters
Financially Integrated Commodity Exporters
BOL BRA
CHL
COL CRI
DOM
ECU
SLV
GTM MEX
PER
URY
0
2
4
6
8
10
0 1 2 3 4 5 6 7 8 9 10
Rea
l Dom
estic
D
eman
d G
row
th
Real GDP Growth
-4 -3 -2 -1 0 1 2 3 4
Source: IMF, World Economic Outlook; and IMF staff calculations. 1/ Financially integrated includes Brazil, Chile, Colombia, Peru and Uruguay. 2/ Other commodity exporters includes Argentina, Bolivia, Ecuador, Paraguay and Venezuela.
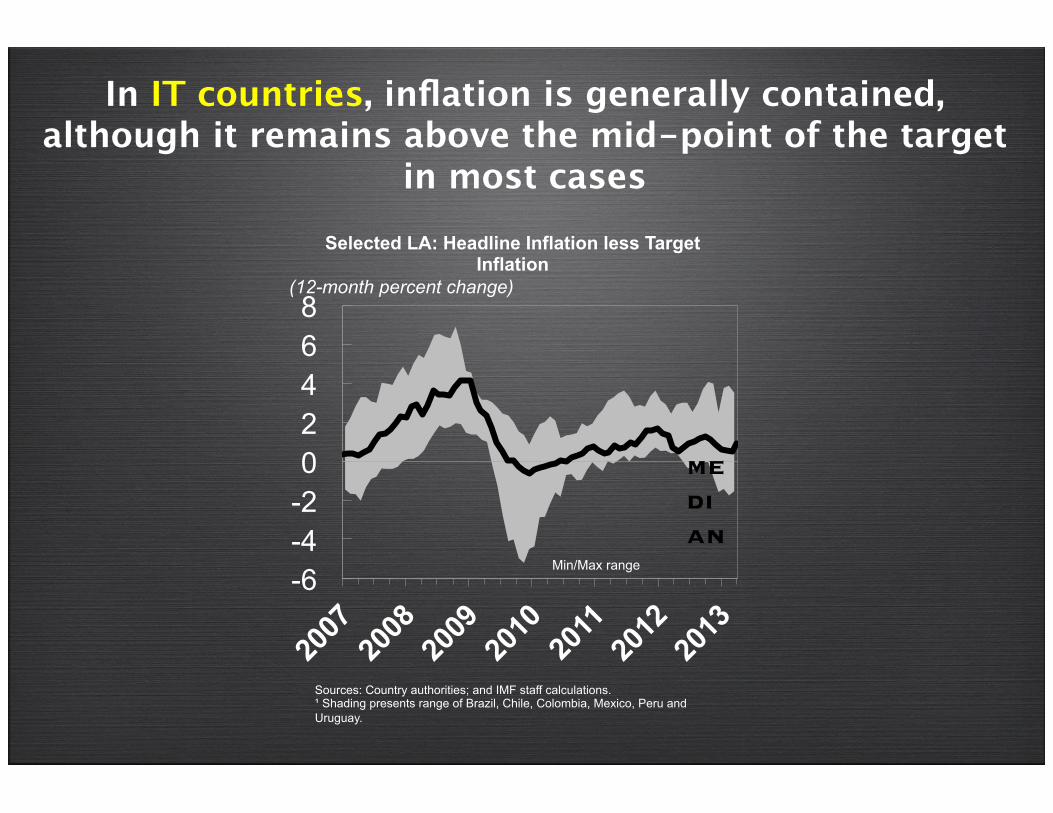
In IT countries, inflation is generally contained, although it remains above the mid-point of the target
in most cases Selected LA: Headline Inflation less Target
Inflation (12-month percent change)
Sources: Country authorities; and IMF staff calculations. ¹ Shading presents range of Brazil, Chile, Colombia, Mexico, Peru and Uruguay.
-6 -4 -2 0 2 4 6 8
median
Min/Max range
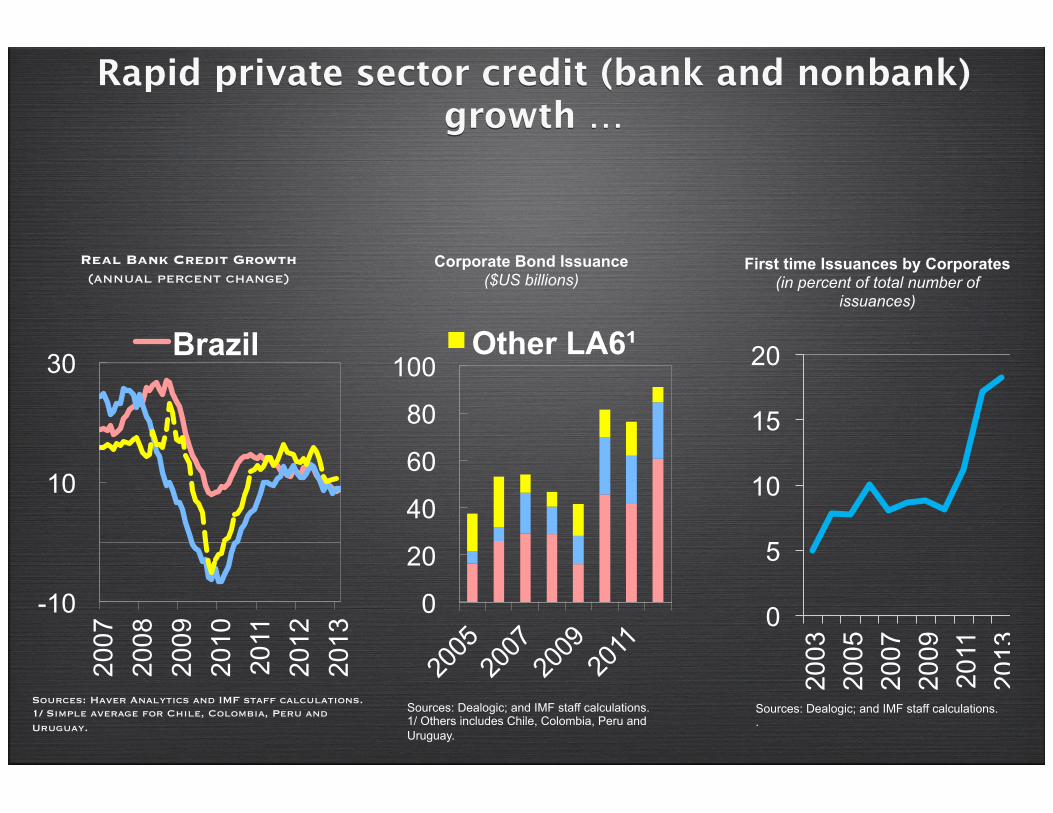
Rapid private sector credit (bank and nonbank) growth …
Real Bank Credit Growth (annual percent change)
Sources: Haver Analytics and IMF staff calculations. 1/ Simple average for Chile, Colombia, Peru and Uruguay.
0
20
40
60
80
100 Other LA6¹
Corporate Bond Issuance ($US billions)
Sources: Dealogic; and IMF staff calculations. 1/ Others includes Chile, Colombia, Peru and Uruguay.
2007
20
08
2009
20
10
2011
20
12
2013
-10
10
30 Brazil
0
5
10
15
20
2003
20
05
2007
20
09
2011
20
13
First time Issuances by Corporates (in percent of total number of
issuances)
Sources: Dealogic; and IMF staff calculations. .
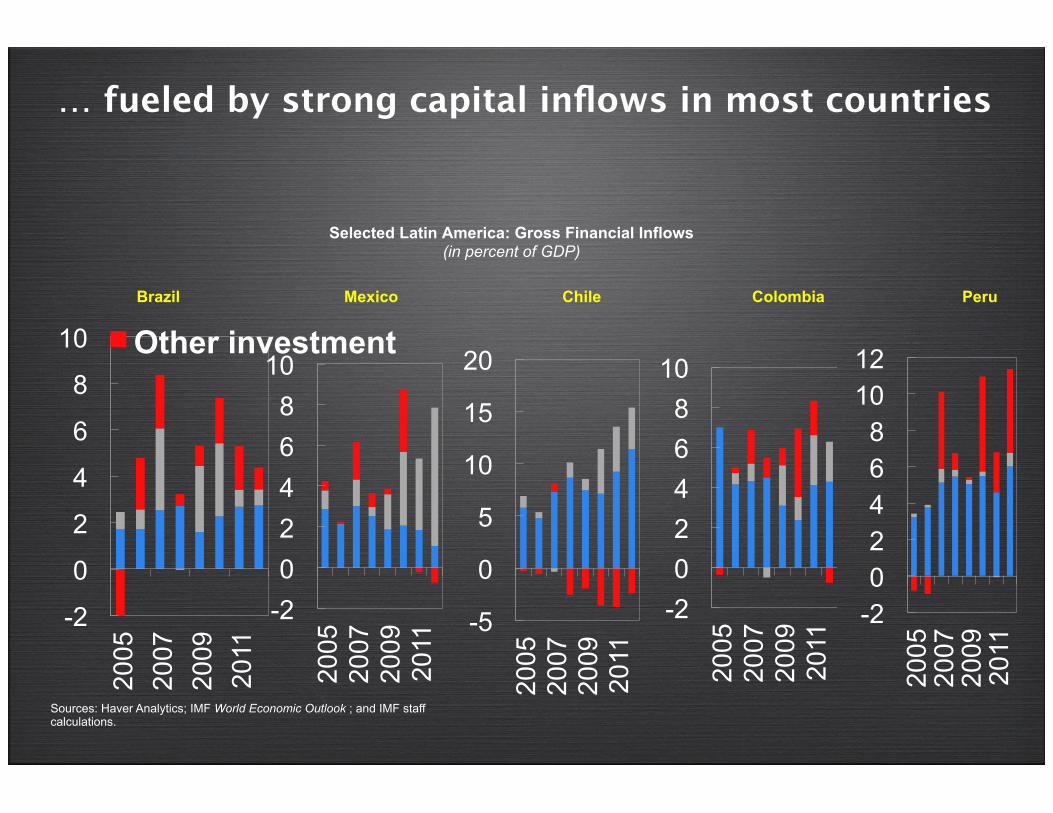
… fueled by strong capital inflows in most countries
Selected Latin America: Gross Financial Inflows (in percent of GDP)
Sources: Haver Analytics; IMF World Economic Outlook ; and IMF staff calculations.
Brazil Mexico Chile Colombia Peru
-5
0
5
10
15
20
2005
20
07
2009
20
11 -2
0 2 4 6 8
10 20
05
2007
20
09
2011
-2 0 2 4 6 8
10
2005
20
07
2009
20
11 -2
0 2 4 6 8
10 12
2005
20
07
2009
20
11 -2
0
2
4
6
8
10
2005
20
07
2009
20
11
Other investment
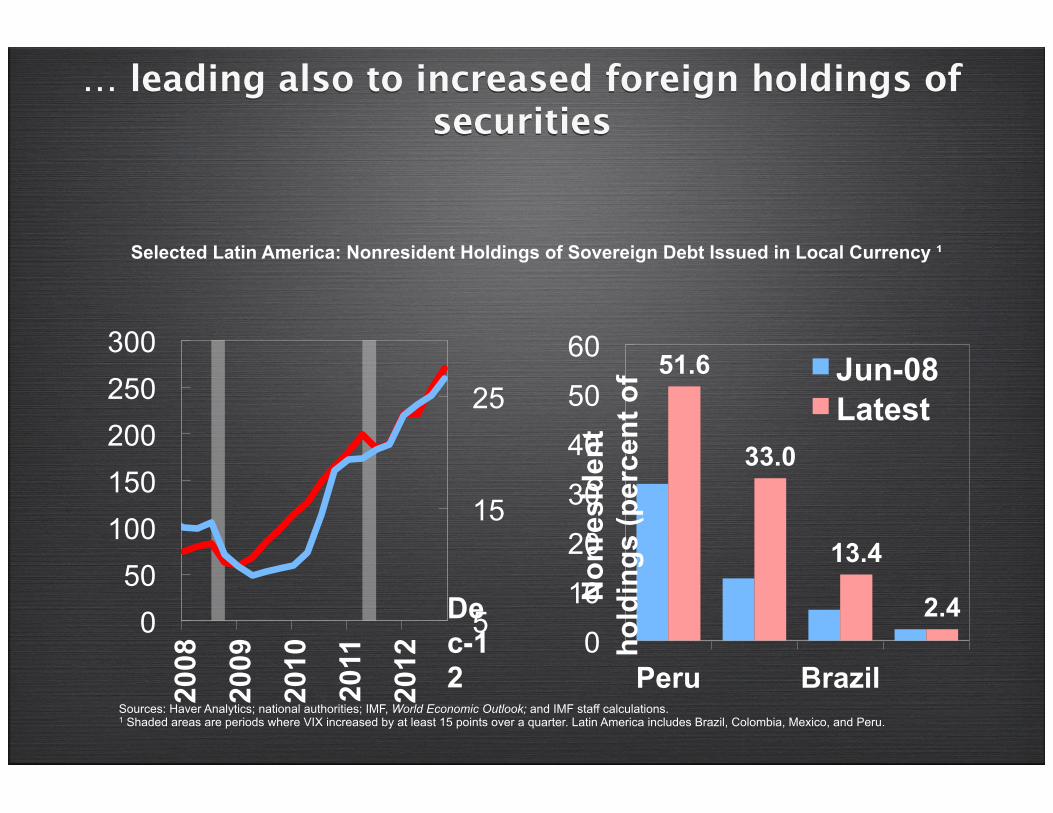
… leading also to increased foreign holdings of securities
5
15
25
0 50
100 150 200 250 300
2008
2009
2010
2011
2012
Dec-12
51.6
33.0
13.4
2.4 0
10
20
30
40
50
60
Peru Brazil
Non
resi
dent
ho
ldin
gs (p
erce
nt o
f Jun-08 Latest
Selected Latin America: Nonresident Holdings of Sovereign Debt Issued in Local Currency ¹
Sources: Haver Analytics; national authorities; IMF, World Economic Outlook; and IMF staff calculations. 1 Shaded areas are periods where VIX increased by at least 15 points over a quarter. Latin America includes Brazil, Colombia, Mexico, and Peru.
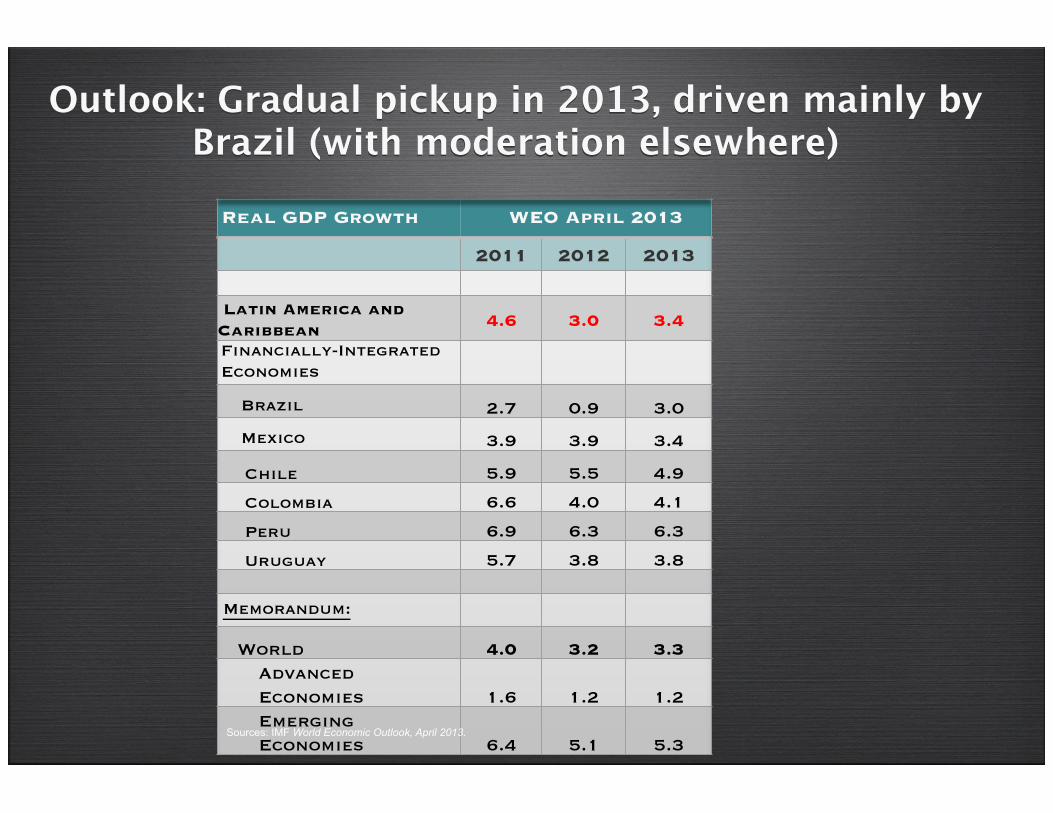
Real GDP Growth WEO April 2013
2011 2012 2013
Latin America and Caribbean 4.6 3.0 3.4
Financially-Integrated Economies
Brazil 2.7 0.9 3.0
Mexico 3.9 3.9 3.4
Chile 5.9 5.5 4.9
Colombia 6.6 4.0 4.1
Peru 6.9 6.3 6.3
Uruguay 5.7 3.8 3.8
Memorandum:
World 4.0 3.2 3.3 Advanced Economies 1.6 1.2 1.2 Emerging Economies 6.4 5.1 5.3
Outlook: Gradual pickup in 2013, driven mainly by Brazil (with moderation elsewhere)
Sources: IMF World Economic Outlook, April 2013.

New Policy Challenges
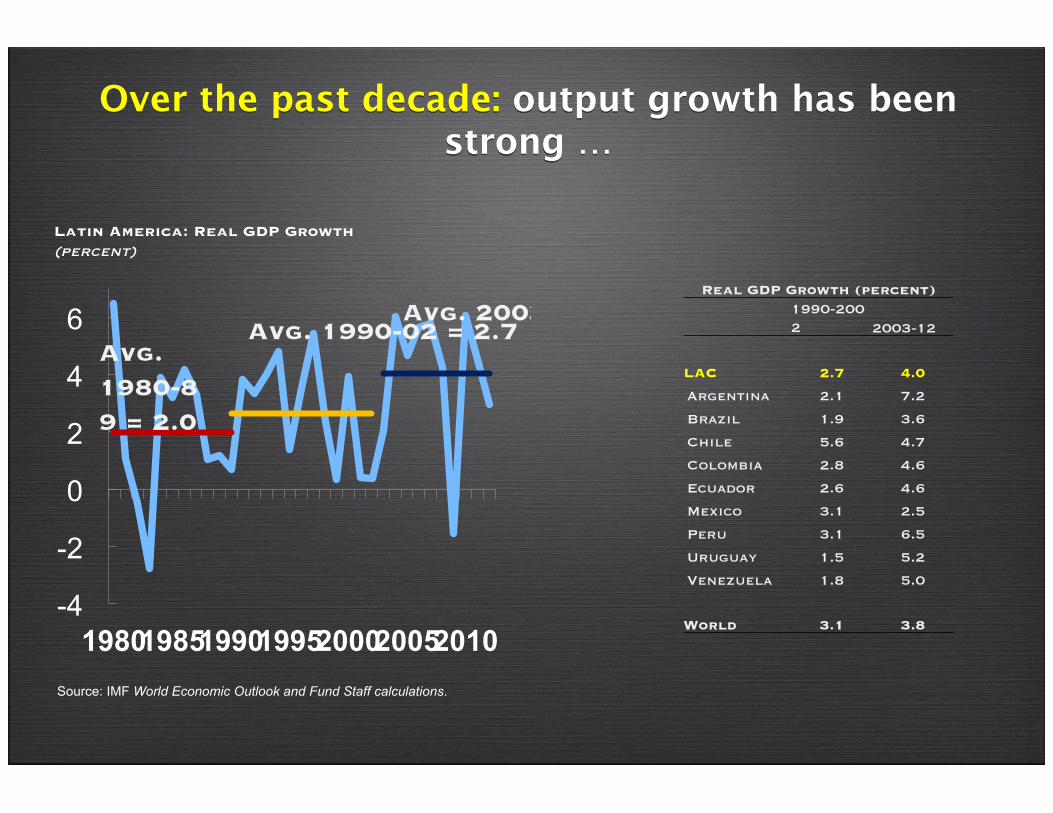
Over the past decade: output growth has been strong …
Source: IMF World Economic Outlook and Fund Staff calculations.
-4
-2
0
2
4
6
1980 1985 1990 1995 2000 2005 2010
Avg. 1980-89 = 2.0
Avg. 2003-12 = 4.0 Avg. 1990-02 = 2.7
Latin America: Real GDP Growth (percent)
Real GDP Growth (percent)
1990-2002 2003-12
LAC 2.7 4.0
Argentina 2.1 7.2
Brazil 1.9 3.6
Chile 5.6 4.7
Colombia 2.8 4.6
Ecuador 2.6 4.6
Mexico 3.1 2.5
Peru 3.1 6.5
Uruguay 1.5 5.2
Venezuela 1.8 5.0
World 3.1 3.8
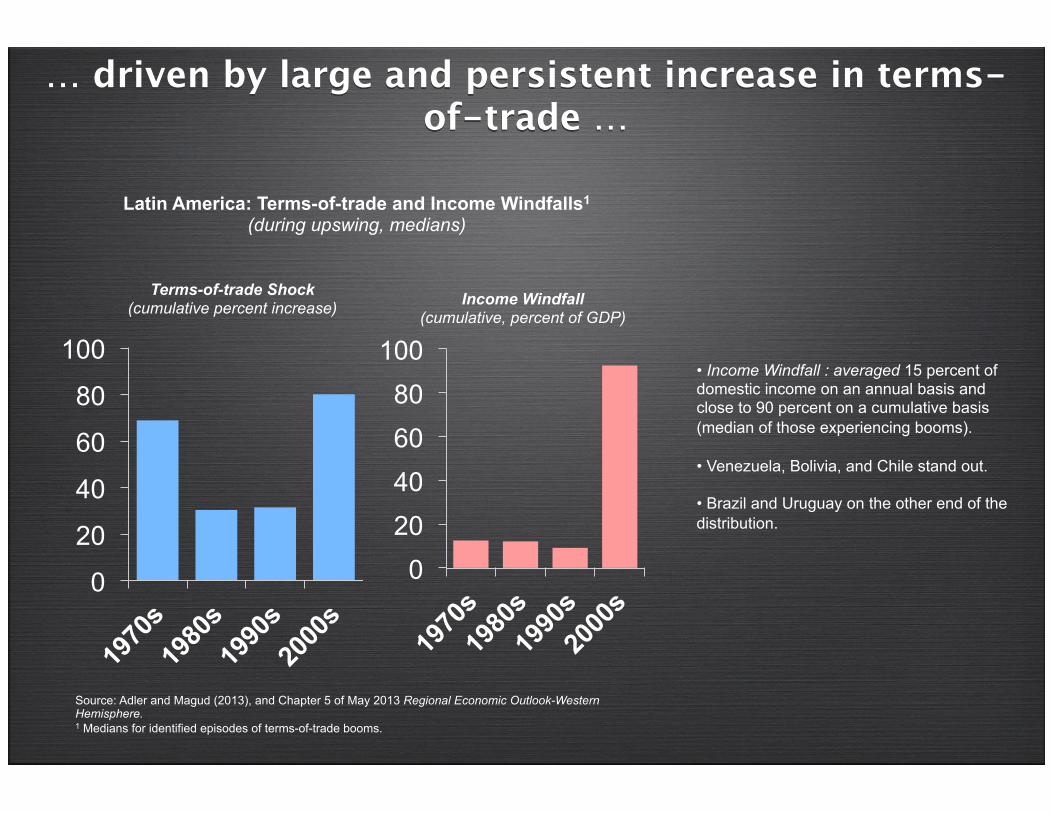
… driven by large and persistent increase in terms-of-trade …
• Income Windfall : averaged 15 percent of domestic income on an annual basis and close to 90 percent on a cumulative basis (median of those experiencing booms). • Venezuela, Bolivia, and Chile stand out.
• Brazil and Uruguay on the other end of the distribution.
0
20
40
60
80
100
0 20 40 60 80
100
Terms-of-trade Shock (cumulative percent increase)
Latin America: Terms-of-trade and Income Windfalls1
(during upswing, medians)
Income Windfall (cumulative, percent of GDP)
Source: Adler and Magud (2013), and Chapter 5 of May 2013 Regional Economic Outlook-Western Hemisphere. 1 Medians for identified episodes of terms-of-trade booms.
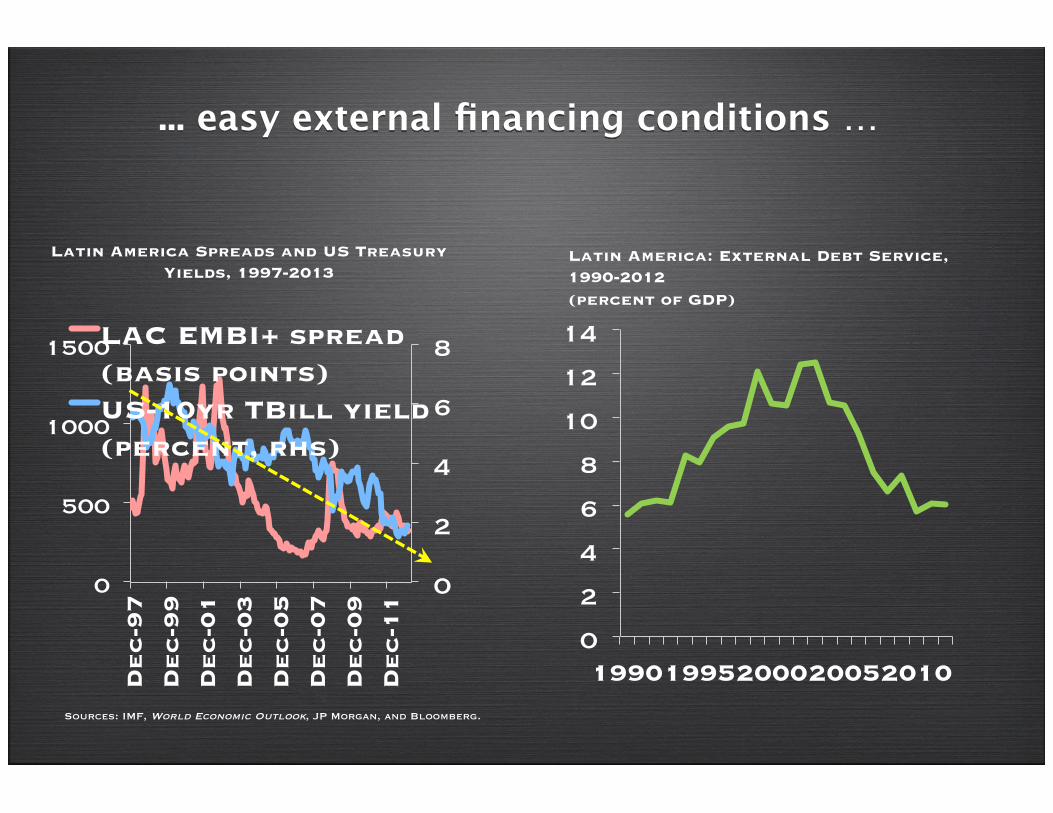
... easy external financing conditions …
0
2
4
6
8
0
500
1000
1500
De
c-9
7
De
c-9
9
De
c-0
1
De
c-0
3
De
c-0
5
De
c-0
7
De
c-0
9
De
c-1
1
LAC EMBI+ spread (basis points) US-10yr TBill yield (percent, rhs)
Latin America Spreads and US Treasury Yields, 1997-2013
Sources: IMF, World Economic Outlook, JP Morgan, and Bloomberg.
0
2
4
6
8
10
12
14
1990 1995 2000 2005 2010
Latin America: External Debt Service, 1990-2012 (percent of GDP)
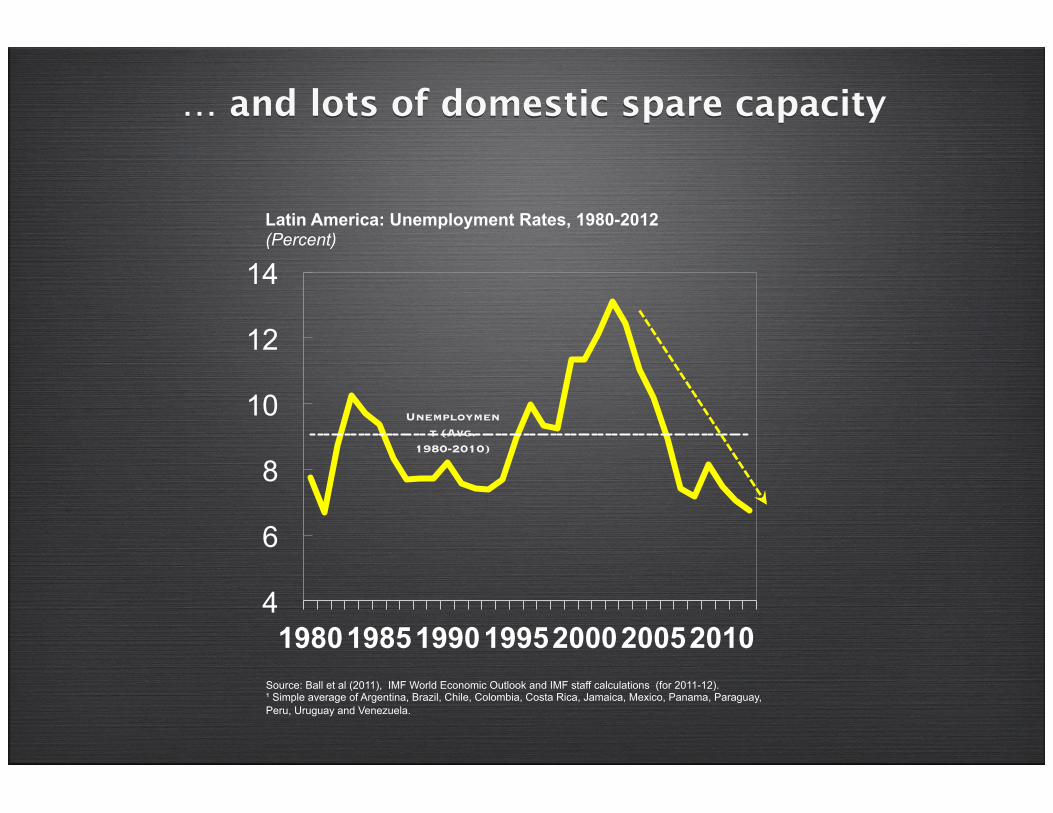
… and lots of domestic spare capacity
4
6
8
10
12
14
1980 1985 1990 1995 2000 2005 2010 Source: Ball et al (2011), IMF World Economic Outlook and IMF staff calculations (for 2011-12). ¹ Simple average of Argentina, Brazil, Chile, Colombia, Costa Rica, Jamaica, Mexico, Panama, Paraguay, Peru, Uruguay and Venezuela.
Latin America: Unemployment Rates, 1980-2012 (Percent)
Unemployment (Avg.
1980-2010)
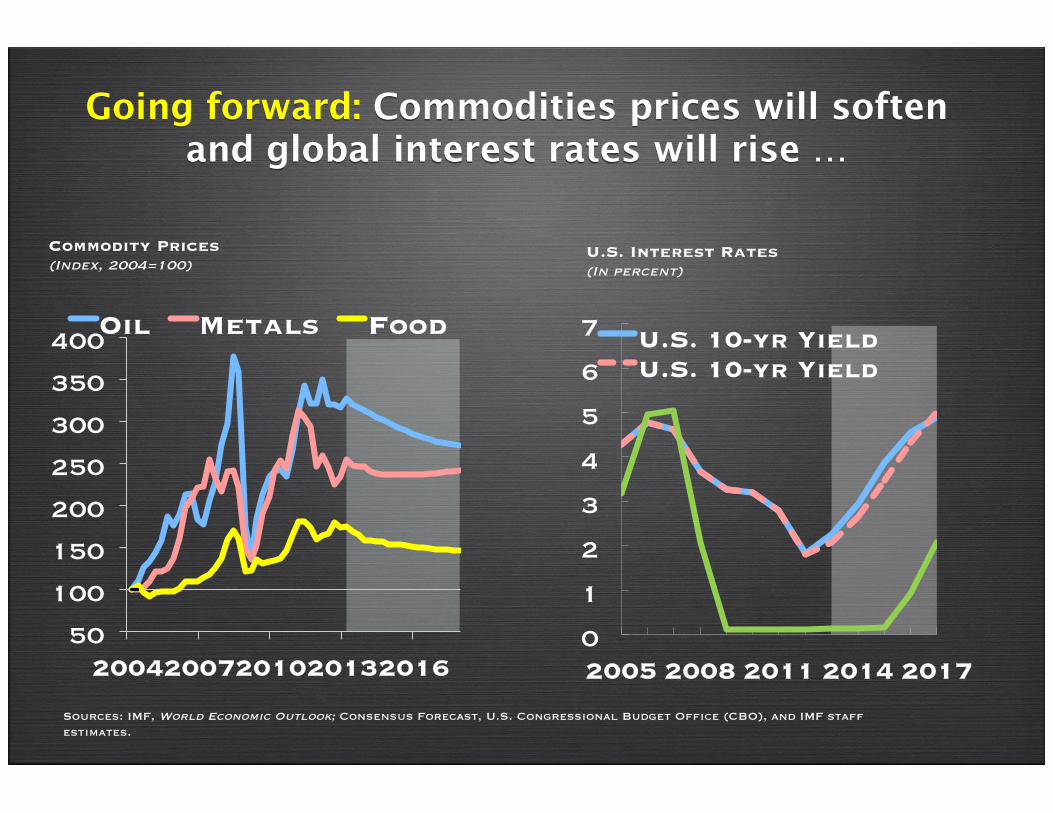
Going forward: Commodities prices will soften and global interest rates will rise …
Commodity Prices (Index, 2004=100)
Sources: IMF, World Economic Outlook; Consensus Forecast, U.S. Congressional Budget Office (CBO), and IMF staff estimates.
0
1
2
3
4
5
6
7
2005 2008 2011 2014 2017
U.S. 10-yr Yield U.S. 10-yr Yield
U.S. Interest Rates (In percent)
50
100
150
200
250
300
350
400
2004 2007 2010 2013 2016
Oil Metals Food
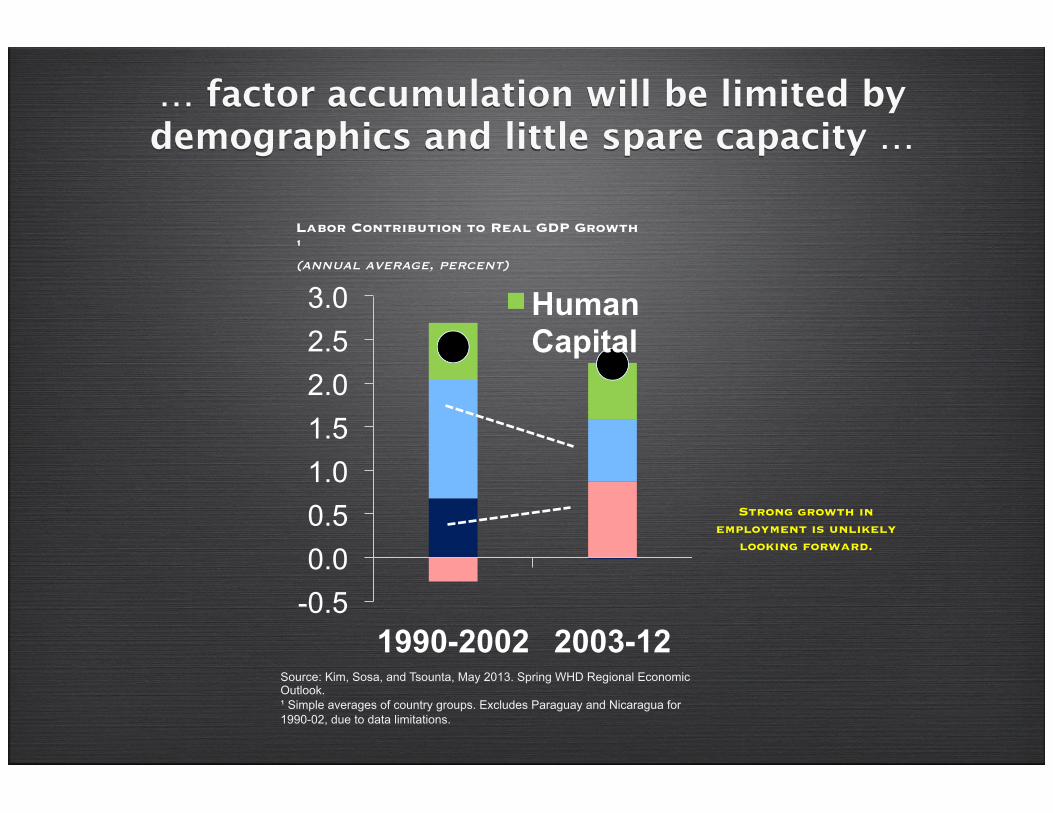
… factor accumulation will be limited by demographics and little spare capacity …
-0.5 0.0 0.5 1.0 1.5 2.0 2.5 3.0
1990-2002 2003-12
Human Capital
Source: Kim, Sosa, and Tsounta, May 2013. Spring WHD Regional Economic Outlook. ¹ Simple averages of country groups. Excludes Paraguay and Nicaragua for 1990-02, due to data limitations.
Labor Contribution to Real GDP Growth 1 (annual average, percent)
Strong growth in employment is unlikely
looking forward.
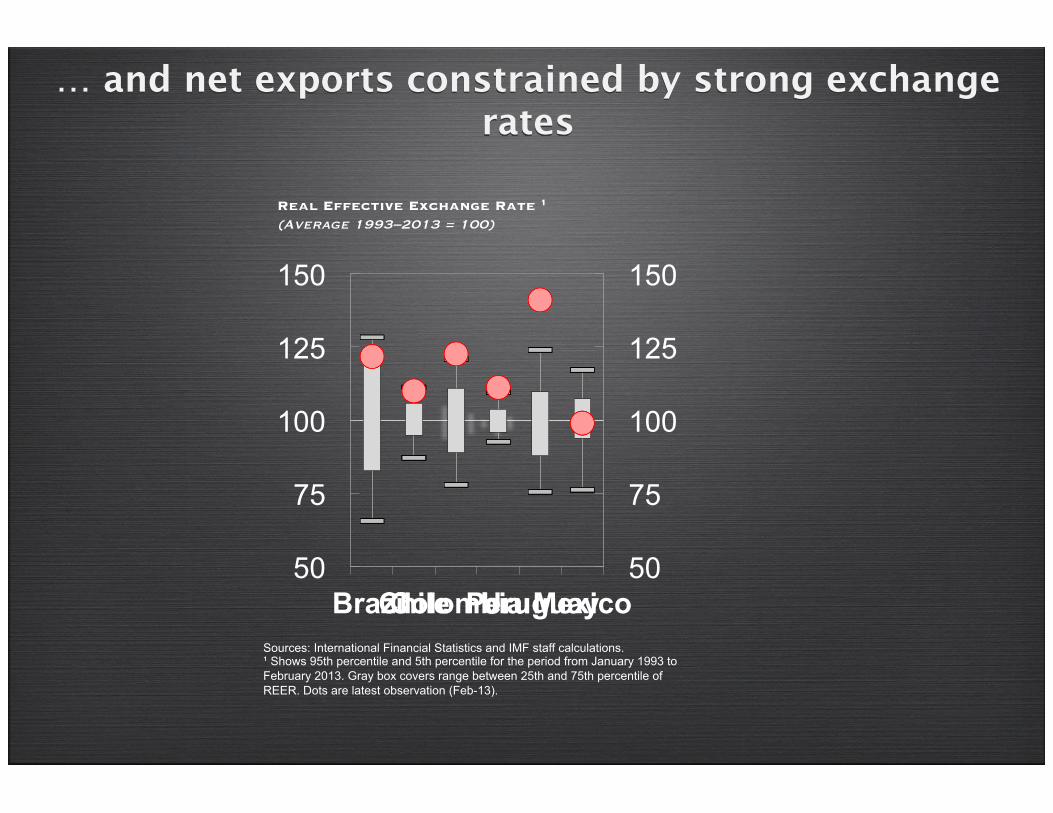
… and net exports constrained by strong exchange rates
Real Effective Exchange Rate 1 (Average 1993–2013 = 100)
Sources: International Financial Statistics and IMF staff calculations. ¹ Shows 95th percentile and 5th percentile for the period from January 1993 to February 2013. Gray box covers range between 25th and 75th percentile of REER. Dots are latest observation (Feb-13).
50
75
100
125
150
50
75
100
125
150
Brazil Chile Colombia Peru Uruguay Mexico
0
5
BR
A
CH
L
CO
L
ME
X
PE
R
UR
Y
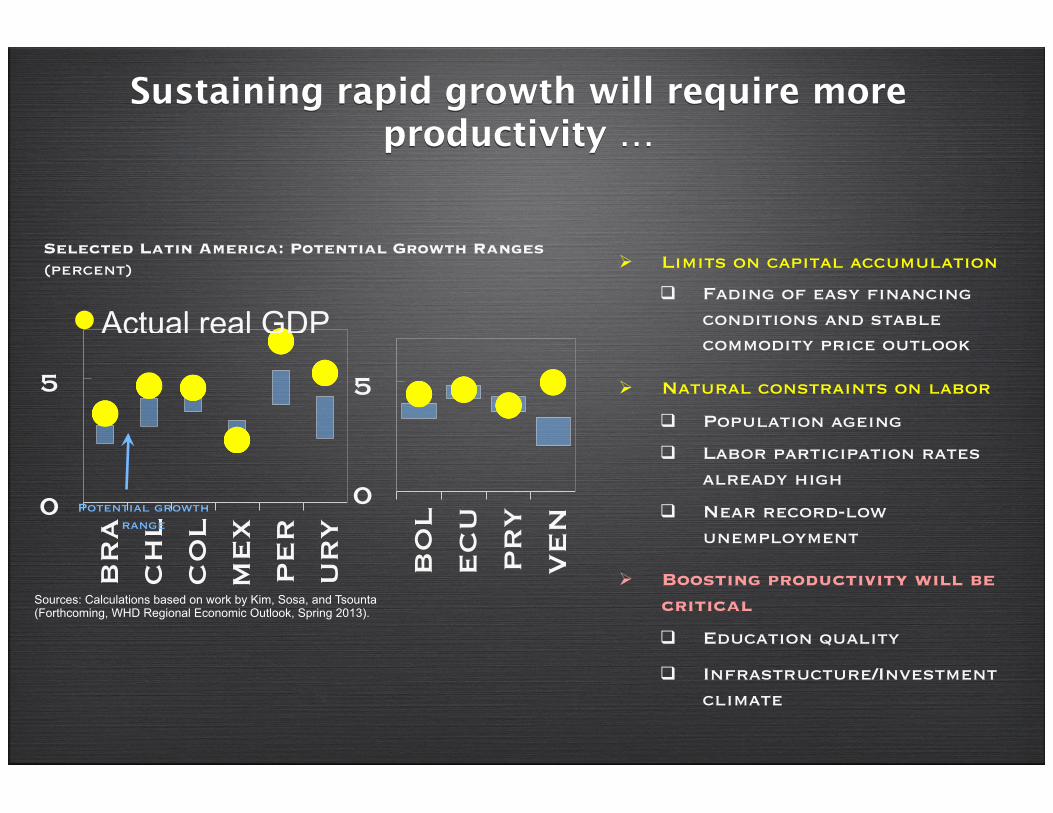
Actual real GDP
Selected Latin America: Potential Growth Ranges (percent)
0
5 B
OL
EC
U
PR
Y
VE
N
Sustaining rapid growth will require more productivity …
Ø Limits on capital accumulation
q Fading of easy financing conditions and stable commodity price outlook
Ø Natural constraints on labor
q Population ageing
q Labor participation rates already high
q Near record-low unemployment
Ø Boosting productivity will be critical
q Education quality
q Infrastructure/Investment climate
Sources: Calculations based on work by Kim, Sosa, and Tsounta (Forthcoming, WHD Regional Economic Outlook, Spring 2013).
Potential growth range
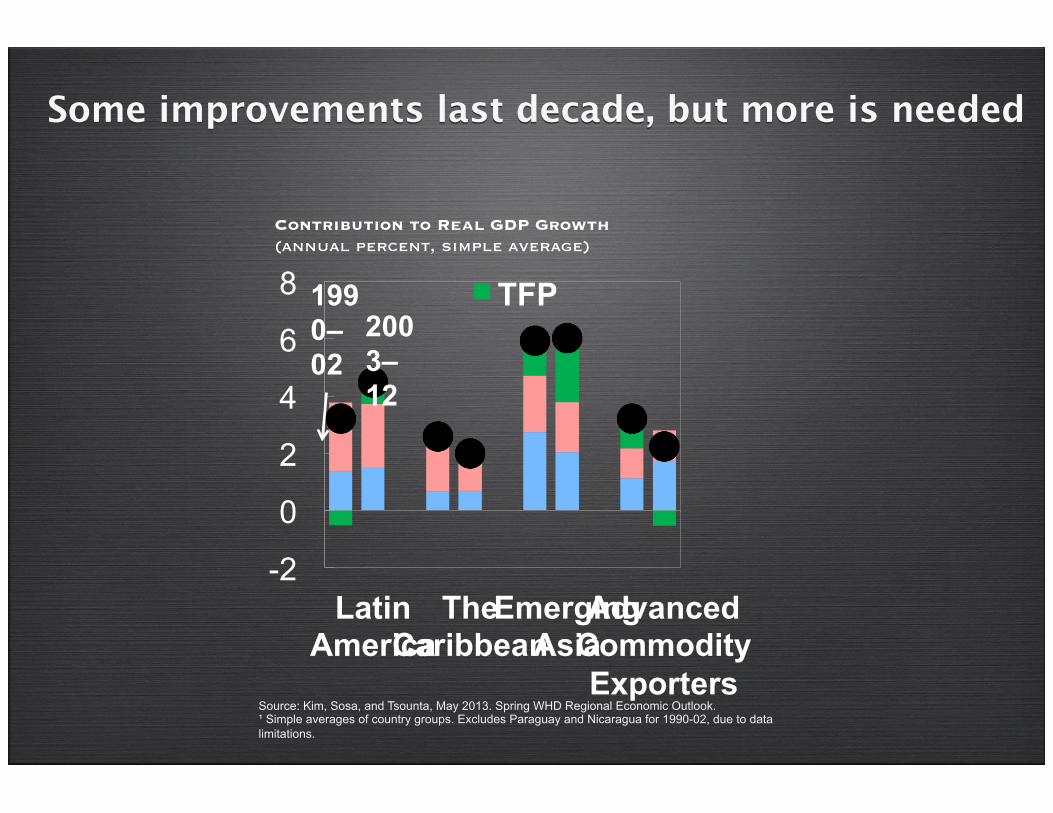
Some improvements last decade, but more is needed
Contribution to Real GDP Growth (annual percent, simple average)
-2
0
2
4
6
8
Latin America
The Caribbean
Emerging Asia
Advanced Commodity Exporters
TFP 2003–12
1990–02
Source: Kim, Sosa, and Tsounta, May 2013. Spring WHD Regional Economic Outlook. ¹ Simple averages of country groups. Excludes Paraguay and Nicaragua for 1990-02, due to data limitations.
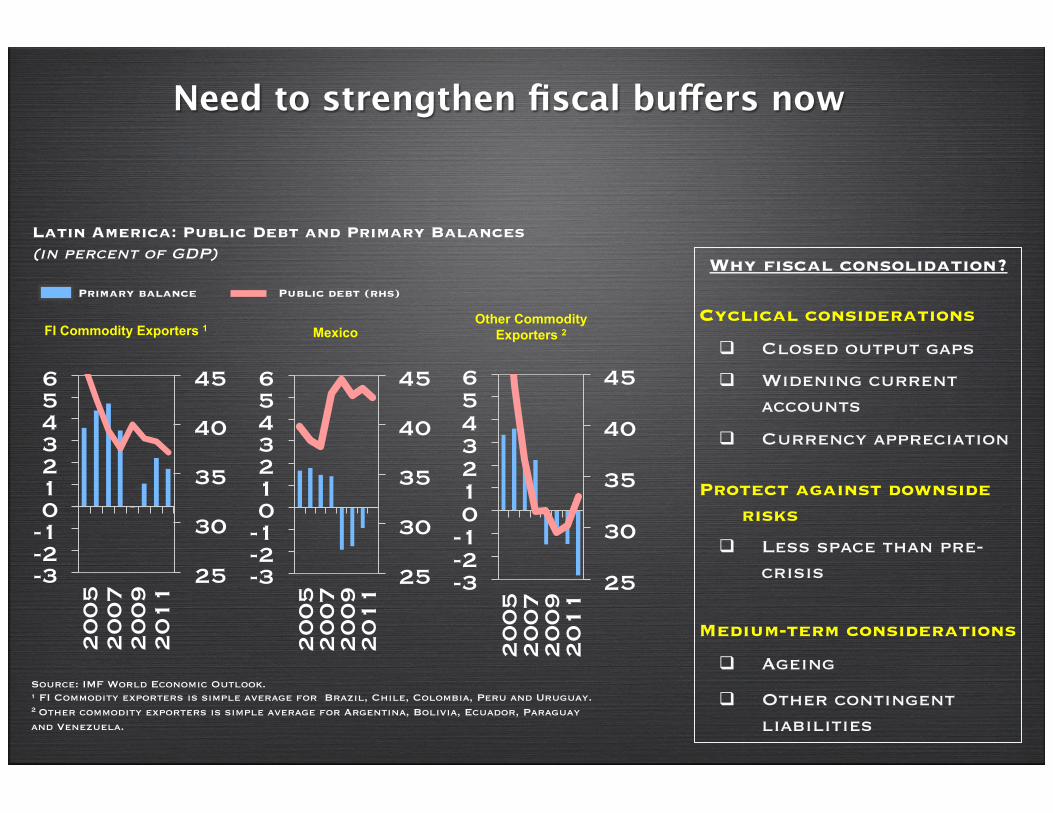
Need to strengthen fiscal buffers now
Why fiscal consolidation?
Cyclical considerations
q Closed output gaps
q Widening current accounts
q Currency appreciation
Protect against downside risks
q Less space than pre-crisis
Medium-term considerations
q Ageing
q Other contingent liabilities
Latin America: Public Debt and Primary Balances (in percent of GDP)
Source: IMF World Economic Outlook. ¹ FI Commodity exporters is simple average for Brazil, Chile, Colombia, Peru and Uruguay. 2 Other commodity exporters is simple average for Argentina, Bolivia, Ecuador, Paraguay and Venezuela.
FI Commodity Exporters 1 Mexico Other Commodity
Exporters 2
Primary balance Public debt (rhs)
25
30
35
40
45
-3 -2 -1 0 1 2 3 4 5 6
20
05
20
07
20
09
20
11 25
30
35
40
45
-3 -2 -1 0 1 2 3 4 5 6
20
05
20
07
20
09
20
11 25
30
35
40
45
-3 -2 -1 0 1 2 3 4 5 6
20
05
20
07
20
09
20
11
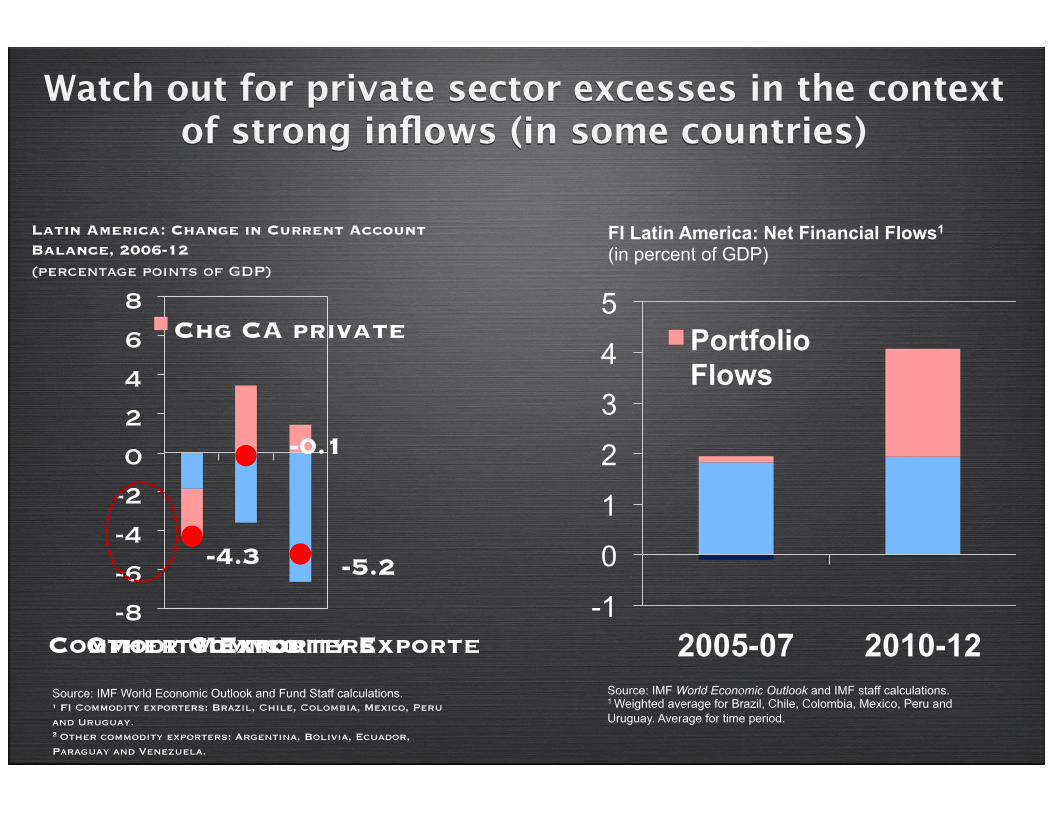
Watch out for private sector excesses in the context of strong inflows (in some countries)
-4.3
-0.1
-5.2
-8 -6 -4 -2 0 2 4 6 8
FI Commodity Exporters Mexico Other Commodity Exporters
Chg CA private
Latin America: Change in Current Account Balance, 2006-12 (percentage points of GDP)
Source: IMF World Economic Outlook and Fund Staff calculations. ¹ FI Commodity exporters: Brazil, Chile, Colombia, Mexico, Peru and Uruguay. 2 Other commodity exporters: Argentina, Bolivia, Ecuador, Paraguay and Venezuela.
-1
0
1
2
3
4
5
2005-07 2010-12
Portfolio Flows
FI Latin America: Net Financial Flows1
(in percent of GDP)
Source: IMF World Economic Outlook and IMF staff calculations. 1 Weighted average for Brazil, Chile, Colombia, Mexico, Peru and Uruguay. Average for time period.
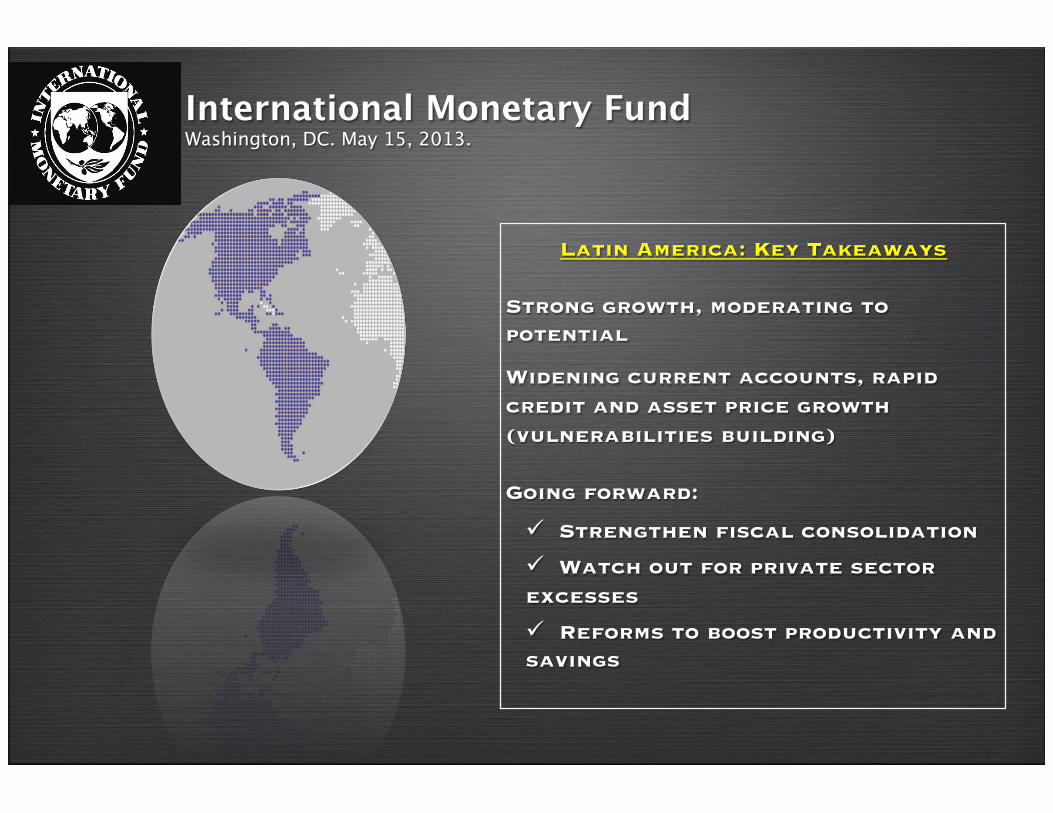
International Monetary Fund Washington, DC. May 15, 2013.
Latin America: Key Takeaways Strong growth, moderating to potential
Widening current accounts, rapid credit and asset price growth (vulnerabilities building) Going forward:
ü Strengthen fiscal consolidation
ü Watch out for private sector excesses
ü Reforms to boost productivity and savings