lateral zonation of trees along a small ohio stream
TRANSCRIPT

Lateral Zonation of Trees along a Small Ohio Stream1
RoHHRT L. VADAS, JR.2 AND JON E. SANGEK, Department of Botany and Bacteriology, Ohio Wesleyan University, Delaware, OH 43015
ABSTRACT. Riparian-vegetation patterns along a small stream in Ohio were examined with multivariate andgraphical analyses. The study focused on elevational differences in larger tree species (>10 cm DBH =diameter at breast height) on a floodplain bench, floodplain slope, and upland terrace. The three habitatzones showed differences in floral assemblages related to the flooding tolerance of tree species, the flood-plain bench showing ash-maple dominance and the other habitats yielding maple-beech-oak dominance.The floral differences were likely attributable to natural and human impacts, particularly stream floodingand possibly past logging. The results and a literature review suggest that hydrologic disturbances (forexample, flooding) create predictable, parallel patterns in floral assemblages along a lateral (stream-edgeto upland) gradient. Riparian assessments in the lateral dimension can provide information to predictthe effects of anthropogenic instream-flow alterations on riparian ecosystems, including small tributaries.
OHIO J. SCI. 97 (5): 107-112, 1997
"The oaks are just too greedy, we'll make them giveus more light" (quote from the maples in the rock song"The Trees," by Rush).
INTRODUCTIONThe species and growth-form composition of riparian
vegetation in mesic regions of North America is greatlyaffected by stream-flow regimen (Gill 1970, Broadfootand Williston 1973), including minimum and maximumflow's and fluctuations in discharge (Rood and Mahoney1990, Vadas and Weigmann 1993, Auble and others 1994,Johnson 1994). Indeed, natural flood disturbances en-hance plant productivity and biodiversity in riparianecosystems, with resulting benefits to fish and wildliferesources (Gregory and others 1991, Naiman and others1993, Decamps and Tabachi 1994). In the north-centralUS, abiotic disturbances caused by floods, drought,scouring by ice, and river meandering often enhancetree-species and forest diversity by setting back floralsuccession to earlier serai stages, that is, toward r-selected, woody species that are adapted to low nutrientand high light levels 0ohnson and others 1976; Johnson1992, 1994). Differences in stream hydrology along lateral(stream-edge to upland) and longitudinal (up- to down-stream) gradients have been examined by ecohydrolo-gists, who attempt to correlate hydrologic and floralpatterns in stream valleys (Higler 1993).
Much ecohydrologic work has been done to docu-ment the distinct lateral zonation of plant species onbenches (formerly called "terraces") that run parallel tostreams in the eastern US (Hupp 1988, Gosselink andothers 1990) and western US (Fonda 1974, Karp andMathews 1988, Brinson 1990). In particular, a higherproportion of large, woody, long-lived, shade-tolerant,and/or water-intolerant plants (that is, K-strategists) isseen at higher elevations. Grasses and other herbs
Manuscript received 20 January 1997 and in revised form 6 Janu-ary 1998 (#97-02).
2Present address: NRC Postdoctoral Research Associate, NationalMarine Fisheries Service, Southwest Fisheries Science Center, 3150Paradise Drive, Tiburon, CA 94920 USA
dominate the low bench (depositional bar), woody andherbaceous shrubs characterize the second bench (active-channel shelf), woody shrubs and mesic trees dominatethe third bench and slope (floodplain and transition),and drier-adapted trees typify the upland bench (terrace)and slope (toeslope and hillslope). Essentially, the firsttwo benches characterize the stream bank and isles(lower-riparian zone), where inundation is frequent(>5% of the time in Virginia) (Hupp and Osterkamp1985). In contrast, the third bench is in the upper-riparian zone and the upland bench is above the presenthigh water mark, with respective flood intervals of 1-3years and >3 years in Virginia (Hupp and Osterkamp1985).
Typical floral genera characterize lotic benches inNorth America. In much of the northeastern US, im-portant riparian shrubs include willow (Salix), alder(Alnus), and Viburnum, whereas floodplain trees in-clude ash (Fraxinus), maple (Acer), cottonwood(Populus), birch (Betuld), and elm (Ulmus) (Vankat1979, Hupp 1988, Brinson 1990). Upland trees includebeech-maple (Fagus-Acef) and oak-hickory (Quercus-Caryd) associations (assemblages) in wetter and drierareas, respectively.
In the present paper, multivariate and graphicalanalyses are used to examine riparian-floral patternsalong one side of a small stream in Ohio. The rapid-bioassessment study focuses on elevational differencesin larger tree species on a floodplain bench (floodplain),floodplain slope (slope), and upland terrace (upland) inrelation to stream hydrology (Fig. 1). Drier-adapted specieswere expected to be more common farther upslope,away from the stream. Tree composition on the slopewas expected to be intermediate to that on the flood-plain and upland, assuming that floral change was con-tinuous rather than discrete along the lateral gradient.
METHODS AND MATERIALSStudy Watershed
The study site is in Ohio Wesleyan University's Bohan-nan Scientific Preserve, just north of Kilbourne on thesoutheastern shore of Alum Creek (Brown township in

108 LATERAL 2ONATION OF STREAMSIDE TREES VOL. 97
UPLAND TERRACE
FIGURE 1. Habitat types along a lateral (elevation) gradient for the Ohiostudy stream.
Delaware and Morrow counties, 40°21' N and 82°55' W).This mature, second-growth forest tract is 85 to 135 yearsold (Wallace 1982) and has well to moderately drainedsoils developed on thin glacial till over Ohio shale bed-rock. The preserve is within Ohio's mesic, beech-mapleforest region (Vankat 1979)- Deciduous trees, namelybeech, maple, oak, hickory, elm, ash, and sycamore (seeTable 1 for taxa) are prevalent in the preserve, the latterprimarily on the Alum Creek floodplain. Evidence of pastlogging includes beech and maple root-sprouts and anextensive, second-growth understory of herbs andshrubs (Wallace 1982, personal observation). Agriculture isthe dominant land use on fields adjacent to the preserve.
We undertook sampling in the southeastern cornerof the preserve, on the northeastern side of a second-order, meandering tributary of Alum Creek (as de-
termined from a 1:24,000 topographical map). The un-named stream is intermittent (occasionally with zeroflow) and 1.9 km long below the confluence of its twotributaries, with an average gradient of 4.8 m/km andexposure of Ohio shale along the slope and bank. Thesample site was near the confluence in Morrow County,which ranged in elevation from 283 to 293 m along ahabitat gradient from floodplain to slope to uplandProminent herbs on the upland-forest floor were thosetypical of eastern beech-maple forests (compare Vankat1979), whereas may-apple {Podophyllum peltatuni) wasmost abundant on the floodplain. Blue-beech (Carpinuscaroliniand), hop-hornbeam (ironwood), and sugar-maple saplings dominated the upland subcanopy,whereas saplings of Ohio buckeye and hop hornbeamcharacterized the floodplain subcanopy (see Table 1for taxa)
Field WorkSampling was undertaken from late March to late
May in 1983 on two adjacent bends in the midreach ofthe study creek (compare Vadas 1984). We used thepoint-quarter method, a plotless technique that is effi-cient for sampling tree assemblages (Cox 1980, Browerand others 1990). Three transects were laid out from theupland to the stream bank, perpendicular to the stream;the first upland point was adjacent to the floodplain ofa smaller tributary of Alum Creek. Each transect was 160m long with stakes marking sampling points every 20 m,
TABLE 1
Abundance and size data for trees in three habitat types along an Ohio stream.
Tree species
Common, scientific, & abbreviated name
American beech (Fagus grandifolid)Red oak (Quercus rubra)White oak {Quercus alba)Sugar maple (Acer saccharum)Red maple (Acer rubruni)Green ash (FraxinusPennsylvania subintegerrimd)White ash (Fraxinus a. americana)
Shagbark hickory (Carya ovata)Wild black cherry (Prunus serotina)Hop hornbeam (Ostrya virginiand)Ohio buckeye (Aesculus glabra)Honey-locust (Gleditsia tricanthos)Sycamore (Platanus occidentalis)American elm (Ulmus americana)
Summary dataSimpson-Levins diversity index
ABEROA
WOASMARMAGASWAS
SHIWBCHHOOBUHLOSYCAEL
_
—
N
5002251829
0035404
525.5
Floodplain
A
80012128
40
0048701
__
4.6
D
29.5——16
33.515
23.5
—153033—
10
21—
N
22411336106
0800000
325.2
Slope
A
21132928233
0200000
4.4
D
36675933202124
17————
—
33—
N
2305
462100
7002022
243.5
Upland
A
2705
421
120
800+
041
_
3.7
D
35—35312736—
34——11—4926
33—
TOL
INININIT
TOVTVT
INININITIT
TOTO
—
N = % numerical abundance, A = % areal abundance, and + indicates <0.5%.Summary data include total number of trees and mean diameter (D) across species.Classifications of flooding tolerance (TOL) were based on Chapman and others (1982): VT = very tolerant, TO = tolerant,
IT = intermediately tolerant, and IN = intolerant.Species names follow Weishaupt (1971) and Vankat (1979). See the text for an explanation of calculations.

OHIO JOURNAL OF SCIENCE R. L. VADAS JR. AND J. E. SANGER 109
yielding 9 points per transect (total = 27 points). Thetransects were oriented NE-SW and were approximately30 m apart. This spacing prevented the same tree frombeing sampled more than once, and provided severalstakes per transect for each habitat type. Four trees weresampled per point yielding a total of 52, 32, and 24 treesfor upland, slope, and floodplain habitats, respectively.
At each stake, we assessed the nearest tree in each ofthe four quadrants. Measurements included distance ofthe tree to the stake (at 0.6 m height), tree circumferenceat 1.4 m height (to calculate diameter at breast height= DBH), and presence/absence of lianas on the tree trunk(principally poison ivy [Rhus radicans] and wild, river-side grape [Vitis riparia]). The minimum DBH for treeswas 10 cm, such that only overstory trees were sampled.
Data AnalysisAlthough the point-quarter method can provide fre-
quency, density, dominance (basal-area), and dispersionestimates for each tree species, the method is most ac-curate when tree distributions are random and samplesizes are large (Cox 1980, Brower and others 1990). Wefocused on the relative numerical and areal abundance oftrees, variables that were similar in form (Cox 1980,Brower and others 1990) and value (Vadas 1984) to rela-tive density and dominance. Tree density (TD) was fac-tored into these variables by calculating TD = 20 - DIST. Per-cent numerical abundance across all species was calcu-lated by summing TD for each tree species. Percent arealabundance across all species was calculated by sum-ming the product of TD and DBH2 for each tree species.
We used varimax-factor analysis (PROC FACTOR inSAS [1985]) and the Simpson-Levins diversity index (com-pare Vadas 1992) and graphical analyses of common treespecies and flooding-tolerance guilds to examine vegetationpatterns among habitat samples. There were 14 observations(tree species) and 6 variables, the latter including numeri-cal and areal abundances of trees in floodplain, slope, andupland habitats. This allowed two floral comparisons,between abundance parameters (within habitat types)and among elevation zones, to assess whether change intree-species composition was continuous along the lateralgradient. Habitats with floral compositions that were (1)highly similar would show their highest loadings on thesame factor axis, (2) moderately similar would show highloadings on the same factor axis but their highest load-ings would be on different axes, (3) somewhat dissimilarwould show high loadings on different axes, and (4)more dissimilar would show high loadings on the samefactor axis but the loadings would be of opposite sign(positive versus negative). Tree species were classifiedinto one of four flooding-tolerance guilds based on theclassifications of Chapman and others (1982), to test the hy-pothesis that tolerant species are relatively more abundantcloser to the stream; the guilds included "very tolerant,""tolerant," "intermediately tolerant," and "intolerant."
RESULTSThere were four univariate patterns of interest. First,
poison ivy was more common on floodplain trees thanon trees in slope and upland habitats (Appendix 1);
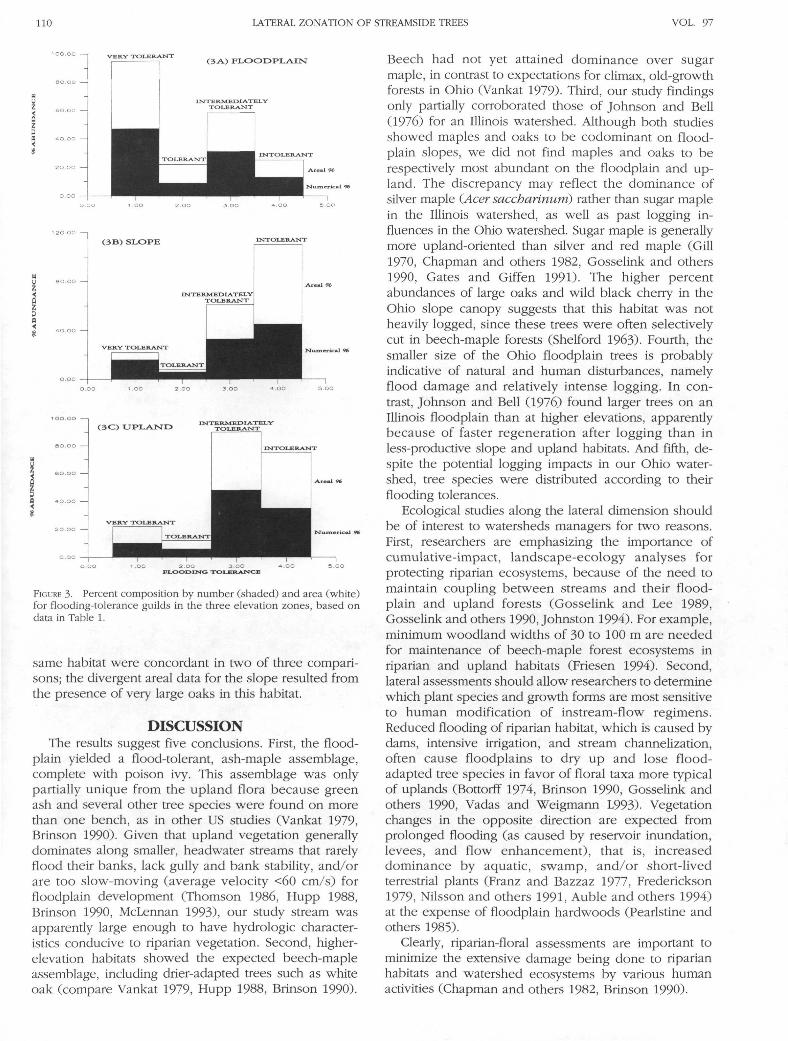
respective frequencies were 54%, 12.5%, and 12%.Second, trees were generally larger on the slope andupland than on the floodplain (Table 1). Third, commontree species (that is, those with numerical and/or arealabundance >10% in at least one habitat type) generallyshowed continuous variation in abundance along thelateral gradient (Fig. 2). Two species (American beechand sugar maple) were most abundant in the uplandand least abundant on the floodplain, two species (whiteand red oak) were mostly found on the slope, twospecies (red maple and white ash) were most abundanton the floodplain and least abundant in the upland,and one species (green ash) was ubiquitous across thethree habitat types but least abundant on the slope.Fourth, tree species tolerant to flooding were relativelymore abundant closer to the stream (Fig. 3). Very tolerantspecies were dominant and intermediately tolerant taxawere subdominant on the floodplain, whereas in-termediately tolerant and intolerant species dominatedthe slope and upland habitats.
Table 1 and multivariate (factor) analysis across treespecies further suggest that floodplain and upland vege-tation were distinct and the slope flora was more similarto upland vegetation. The floral samples each showedvery high loadings on a single factor axes (FA), such thatthere were three important axes. FA #1 was character-ized by both upland samples and numerical data forthe slope, because of dominance by sugar maple andsubdominance by American beech, green ash, and whiteoak. The upland flora was less diverse because of greatersugar-maple prevalence. FA #2 consisted of both flood-plain samples, because of dominance by white ash andsubdominance by green ash and both maple species.These samples were more diverse than the flora ofhigher elevations. FA #3 was characterized by areal datafor the slope, because of dominance by two species (sugarmaple and white oak) and subdominance by Americanbeech and red oak. Numerical and areal data for the
AMERICAN SUGAR WHITE OAK RED OAK RED MAPLE WHITE ASH GREEN ASH
• UPLANDSLOPE
B FLOODPLAIN
FIGURE 2. Relative abundance of common tree species across the threeelevation zones, based on data in Table 1. Relative abundance, whichadded up to 100% for each tree species, was the average of percentnumerical and areal abundances.
110 LATERAL ZONATION OF STREAMSIDE TREES VOL. 97
VERY TOLERANT(3A) FLOODPLAIN
1 20.00 1
(3B) SLOPE INTOLERANT
Numerical
2O.OO
FIGURE 3- Percent composition by number (shaded) and area (white)for flooding-tolerance guilds in the three elevation zones, based ondata in Table 1.
same habitat were concordant in two of three compari-sons; the divergent areal data for the slope resulted fromthe presence of very large oaks in this habitat.
DISCUSSIONThe results suggest five conclusions. First, the flood-
plain yielded a flood-tolerant, ash-maple assemblage,complete with poison ivy. This assemblage was onlypartially unique from the upland flora because greenash and several other tree species were found on morethan one bench, as in other US studies (Vankat 1979,Brinson 1990). Given that upland vegetation generallydominates along smaller, headwater streams that rarelyflood their banks, lack gully and bank stability, and/orare too slow-moving (average velocity <60 cm/s) forfloodplain development (Thomson 1986, Hupp 1988,Brinson 1990, McLennan 1993), our study stream wasapparently large enough to have hydrologic character-istics conducive to riparian vegetation. Second, higher-elevation habitats showed the expected beech-mapleassemblage, including drier-adapted trees such as whiteoak (compare Vankat 1979, Hupp 1988, Brinson 1990).
Beech had not yet attained dominance over sugarmaple, in contrast to expectations for climax, old-growthforests in Ohio (Vankat 1979). Third, our study findingsonly partially corroborated those of Johnson and Bell(1976) for an Illinois watershed. Although both studiesshowed maples and oaks to be codominant on flood-plain slopes, we did not find maples and oaks to berespectively most abundant on the floodplain and up-land. The discrepancy may reflect the dominance ofsilver maple (Acer saccharinurri) rather than sugar maplein the Illinois watershed, as well as past logging in-fluences in the Ohio watershed. Sugar maple is generallymore upland-oriented than silver and red maple (Gill1970, Chapman and others 1982, Gosselink and others1990, Gates and Giffen 1991). The higher percentabundances of large oaks and wild black cherry in theOhio slope canopy suggests that this habitat was notheavily logged, since these trees were often selectivelycut in beech-maple forests (Shelford 1963). Fourth, thesmaller size of the Ohio floodplain trees is probablyindicative of natural and human disturbances, namelyflood damage and relatively intense logging. In con-trast, Johnson and Bell (1976) found larger trees on anIllinois floodplain than at higher elevations, apparentlybecause of faster regeneration after logging than inless-productive slope and upland habitats. And fifth, de-spite the potential logging impacts in our Ohio water-shed, tree species were distributed according to theirflooding tolerances.
Ecological studies along the lateral dimension shouldbe of interest to watersheds managers for two reasons.First, researchers are emphasizing the importance ofcumulative-impact, landscape-ecology analyses forprotecting riparian ecosystems, because of the need tomaintain coupling between streams and their flood-plain and upland forests (Gosselink and Lee 1989,Gosselink and others 1990, Johnston 1994). For example,minimum woodland widths of 30 to 100 m are neededfor maintenance of beech-maple forest ecosystems inriparian and upland habitats (Friesen 1994). Second,lateral assessments should allow researchers to determinewhich plant species and growth forms are most sensitiveto human modification of instream-flow regimens.Reduced flooding of riparian habitat, which is caused bydams, intensive irrigation, and stream channelization,often cause floodplains to dry up and lose flood-adapted tree species in favor of floral taxa more typicalof uplands (Bottorff 1974, Brinson 1990, Gosselink andothers 1990, Vadas and Weigmann L993). Vegetationchanges in the opposite direction are expected fromprolonged flooding (as caused by reservoir inundation,levees, and flow enhancement), that is, increaseddominance by aquatic, swamp, and/or short-livedterrestrial plants (Franz and Bazzaz 1977, Frederickson1979, Nilsson and others 1991, Auble and others 1994)at the expense of floodplain hardwoods (Pearlstine andothers 1985).
Clearly, riparian-floral assessments are important tominimize the extensive damage being done to riparianhabitats and watershed ecosystems by various humanactivities (Chapman and others 1982, Brinson 1990).

OHIO JOURNAL OF SCIENCE R. L. VADAS JR. AND J. E. SANGER 111
ACKNOWLEDGMENTS. Field work and initial drafts of the manuscript werecompleted during the .senior author's undergraduate tenure at OhioWesleyan University. Statistical and graphical analyses and later draftsof the manuscript were done during a postdoctoral tenure in BritishColumbia (via funding from Environment Canada's Fraser River ActionPlan) and consulting tenures in Alberta with Golder Associates Ltd.and EnviResource Consulting Ltd. R. W. Elner, C. L. Hitchcock, P. G.Krannitz, and R. L. Millikin critically reviewed long-haired drafts ofthe paper, D. H. Hickcox and J. M. Ichida provided relevant informa-tion and a topographical map, and J. Wasiatycz saved the manuscriptfrom an evil computer virus.
LITERATURE CITEDAuble GT, Friedman JM, Scott ML. 1994. Relating riparian vegetation
to present and future streamflows. Ecol Applic 4:544-54.Bottorff RL. 1974. Cottonwood habitat for birds in Colorado. Amer
Birds 28:975-9.Brinson MM. 1990. Riverine forests. In: Lugo AK, Brinson M, Brown
S, editors. Forested wetlands. NY: Elsevier. p. 87-141.Broadfoot WM, Williston HL. 1973. Flooding effects on southern
forests. J For 71: 584-7.Brower JE, Zar JH, von Encle CN. 1990. Field and laboratory methods
for general ecology. 3rd edition. Dubuque, 1A: Wm C Brown. 237 p.Chapman RJ, Hinckley TM, Lee LC, Teskey RO. 1982. Impact of water
level changes on woody riparian and wetland communities. Vol-ume X. Index and addendum to volumes I-VIII. Washington: USDepartment of the Interior. Contract nr FWS/OBS-82/23 111 p.Available from: NTIS, Springfield, VA. Sponsored by the Fish &Wildlife Service.
Cox GW. 1980. Laboratory manual of general ecology. 4th edition.Dubuque, IA: Wm C Brown. 237 p.
Decamps H, Tabachi E. 1994. Species richness in vegetation alongriver margins. Symp Brit Ecol Soc 34:1-20.
Fonda RW. 1974. Forest succession in relation to river terrace develop-ment in Olympia National Park, Washington. Ecology 55:927-42.
Franz EH, Bazzaz FA. 1977. Simulation of vegetation response tomodified hydrologic regimes: a probabilistic model based on nichedifferentiation in a floodplain forest. Ecology 58:176-83-
Frederickson LH. 1979- Floral and faunal changes in lowland forestsresulting from channelization, drainage, and impoundment.Washington: US Department of the Interior. Contract nr FWS/OBS-78/91. 130 p. Available from: NTIS, Springfield, VA. Spon-sored by the Fish & Wildlife Service.
Friesen L. 1994. Research sub-program: A literature review on wildlifehabitats in agricultural landscapes. London: Canada-OntarioAgriculture Green Plan. 69 p- Available from: AAFC, London, ON.Sponsored by Agriculture & Agri-Food Canada, Research Branch.
Gates JE, Giffen NR. 1991. Neotropical migrant birds and edge effectsat a forest-stream ecotone. Wilson Bull 103:204-17.
Gill CJ. 1970. The flooding tolerance of woody species-a review. ForAbstracts 31:671-88.
Gosselink JG, Lee LC. 1989. Cumulative impact assessment in bottom-land hardwood forests. Wetlands 9:89-174.
Gosselink JG, Lee LC, Muir TA, editors. 1990. Ecological processesand cumulative impacts—illustrated by bottomland hardwood wet-land ecosystems. Chelsea, MI: Lewis Publ. 708 p.
Gregory SV, Swanson FJ, McKee WA, Cummins KW. 1991. An eco-system perspective of riparian zones. BioScience 41:540-51-
Higler LWG. 1993. The riparian community of north-west Europeanlowland streams. Freshw Biol 29:229-41.
Hupp CR. 1988. Plant ecological aspects of flood geomorphology andpaleoflood history. In: Baker VR, Kochel RC, Patton PC, editors.Flood geomorphology. NY: J Wiley, p. 335-56.
Hupp CR, Osterkamp WR. 1985. Bottomland vegetation distributionalong Passage Creek, Virginia, in relation to fluvial landscapes.Ecology 66:670-81.
Johnson FL, Bell DT. 1976. Plant biomass and net primary productionalong a flood-frequency gradient in a streamside forest. Castanea41:156-65.
Johnson WC. 1992. Dams and riparian forests: case study from the up-per Missouri River. Rivers 3:229-42.
Johnson WC. 1994. Woodland expansion in the Platte River, Nebraska:patterns and causes. Ecol Monogr 64:45-84.
Johnson WC, Burgess RL, Keammerer WR. 1976. Forest overstoryvegetation and environment on the Missouri River floodplain inNorth Dakota. Ecol Monogr 46:59-84.
Johnston CA. 1994. Cumulative impacts to wetlands. Wetlands 14:49-55.Karp RW, Mathews RC Jr. 1988. Hydraulic field survey and macro-
habitat assessment technique. Austin: State of Texas. Contract nrInstream Flow Initiative Paper 7. 36 p., & app. Available from:TWDB, Austin, TX. Sponsored by the Texas Water DevelopmentBoard, Environmental Systems Section, Freshwater Systems Unit.
McLennan DS. 1993- Vegetation dynamics and ecosystem classificationon alluvial floodplains in coastal British Columbia. In: MorganKH, Lashmar MA, editors. Riparian habitat management andresearch. Delta: Fraser River Action Plan. p. 33-43- Available from:Canadian Wildlife Service, Delta, BC. Sponsored by EnvironmentCanada.
Naiman RJ, Decamps H, Pollock M. 1993- The role of riparian corridorsin maintaining regional biodiversity. Ecol Applic 3:209-12.
Nilsson C, Eckblad A, Gardfjell M, Carlberg B. 1991- Long-term effectsof river regulation on river margin vegetation. J Appl Ecol 28:963-87.
Pearlstine L, McKellar H, Kitchens W. 1985. Modelling the impacts ofriver diversion on bottomland forest communities in the SanteRiver floodplain, South Carolina. Ecol Model 29:283-302.
Rood SB, JM Mahoney. 1990. Collapse of riparian poplar forestsdownstream from dams in western prairies: probable causes andprospects for mitigation. Environ Manage 14:451-64.
SAS (Statistical Analysis System). 1985. SAS user's guide: StatisticsVersion 5 edition. SAS Institute, Cary, NC. 956 p.
Shelford VE. 1963- The ecology of North America. Urbana, IL: Univ.Illinois Press. 610 p.
Thomson BL. 1986. Management indicator habitats: a product guideand the riparian zone [thesis]. Burnaby (BC): Simon Fraser Uni-versity. 85 p. Available from: SFU Library, Burnaby, BC.
Vadas RL Jr. 1984. Studies of canopy vegetation along transects fromthe upland woods to floodplain in central Ohio [undergraduatereport]. Delaware (OH), Ohio Wesleyan University. Available from:OWU Student Scholar 17:1-2 (abstract) and OWU Library (fullreport), Delaware, OH.
Vadas RL Jr. 1992. The springtime phytoplankton of two calcareousponds in Ohio. J Freshw Ecol 7:407-18.
Vadas RL Jr, Weigmann DL. 1993. The concept of instream flow andits relevance to drought management in the James River basin. VAWater Resour Res Ctr Bull 182. 78 p.
Vankat JL. 1979. The natural vegetation of North America: an intro-duction. NY: J Wiley. 26l p.
Wallace K. 1982. Nature preserves offer glimpses into Ohio's past.Delaware Gazette (Delaware, OH), May 24: 6.
Weishaupt CG. 1971. Vascular plants of Ohio: a manual for use in fieldand laboratory. Dubuque, IA: Kendall/Hunt. 293 p.
APPENDIX 1
Raw tree data for the three Ohio habitat types.
PT QT DISTTransect #1 Transect #2
DBH SPP DIST DBH SPP DIST
Transect #3
DBH SPP
12
34
3.563.584.659.42
0.2490.2640.1700.432
ABESMASMASMA
6.812.115.645.64
0.3180.2670.1750.526
WOAGASSMAABE
5.445.008.94
10.64
0.4980.1650.1300.323
SMASMAABESMA

112 LATERAL ZONATION OF STREAMSIDE TREES VOL. 97
APPENDIX 1 (Cont.)
PT QT DLST
Transect #1DBH SPP DIST
Transect #2DBH SPP DIST
Transect #3DBH SPP
5A
7.853.891.30
13.79
4.293.124.832.82
7.674.888.694.52
0.3680.1350.3760.699
0.1570.3560.2950.213
0.2620.3510.4370.356
WOASMA
SMA
SMA
ABE
ABE
SMA
SHI*
SHI
ABE*SHI
SMA
11.025.995.995.49
10.804.981.931.14
4.575.927.291.88
0.2260.2030.5000.523
0.4060.1320.2460.185
0.4600.2720.4650.137
SMA
AEL
ABE
SMA
GAS
ABE
SMA
SMA
ABE
ABE
SHI
SMA
8.035.465.05
11.02
3.452.973.635.08
8.0312.249.403.56
5.616.838.105.89
0.5740.1140.4930.528
0.2740.1120.5640.107
0.5080.3400.5510.310
0.2540.3380.2920.315
SMASMA
SYC
ABE*
RMA*OBLTGAS*SMA
ABE
SMA
SMA
SMA
GAS
WOA
SMA
GAS
5B 1 5.591.175.87
10.31
5.086.454.046.98
5.619.128.921.85
0.1700.1570.6430.218
0.1830.5160.4570.577
0.3050.2870.1420.335
WASWBC
WOA
ABE
SMAABE
SMA
WOA
WAS*RMA*GAS*SMA*
4.601.27
11.433.56
3.104.145.823.58
3.561.408.152.62
0.1470.1850.3180.147
0.3890.4110.2160.361
0.2720.4570.4520.422
SMAWBC
GAS
GAS
ABE
ABE
GAS
ABE
SMA
SMA
SMA
SMA
2.690.203.689.50
7.774.193.663.48
0.1170.6730.6220.536
0.4110.2950.1420.305
RMAROA
WOA
WOA
SMA
ABE
SMA
ABE
12
34
12
34
4.278.233.027.72
0.0011.686.988.69
0.3940.1910.1120.130
0.3350.1520.3280.132
WAS*WAS*H H O
GAS
RMAGAS*HLO*GAS
Floodpiain
4.172.626.051.09
4.295.772.111.12
0.3400.2950.1140.175
0.1550.1120.2970.112
WASABE*WAS
GAS'
GAS
WAS
OBU
SMA
2.845.442.314.01
5.871.425.005.51
0.1500.2570.1930.132
0.1880.3450.1040.112
WASSMA
SMA*SMA
PIHOWAS
AEL*SMA*
Presence of poison ivy is indicated by *.PT = point #, QT = quadrant #, DIST = stake-to-tree distance (m), DBH = diameter at breast height (m), and SPP = tree species.See Table 1 for SPP abbreviations.