late mover advantage: how innovative ... - marketing scholar€¦ · marketing mix effects on brand...
TRANSCRIPT
VENKATESH SHANKAR, GREGORY S. CARPENTER, andLAKSHMAN KRISHNAMURTHI*
Although pioneers outsell late movers in many markets, in some casesinnovative late entry has produced some remarkably successful brandsthat outsell pioneers. The mechanisms through which innovative latemovers outsell pioneers are unclear. To identify these mechanisms, theauthors develop a brand-level model in which brand sales are decom-posed into trials and repeat purchases. The model captures diffusion andmarketing mix effects on brand trials and includes the differential impactsof innovative and noninnovative competitors' diffusion on these effects.The authors develop hypotheses on how the diffusion and marketing mixparameters of the brands differ by market entry strategy (pioneering,innovative late entry, and noninnovative late entry). The authors testthese hypotheses using data from 13 brands in two pharmaceutical prod-uct categories. The results show that an innovative late mover can createa sustainable advantage by enjoying a higher market potential and ahigher repeat purchase rate than either the pioneer or noninnovative latemovers, growing faster than the pioneer, slowing the pioneer's diffusion,and reducing the pioneer's marketing spending effectiveness. Innovativelate movers are advantaged asymmetrically in that their diffusion can hurtthe sales of other brands, but their sales are not affected by competitors'diffusion. In contrast, noninnovative late movers face smaller potentialmarkets, lower repeat rates, and less marketing effectiveness compared
with the pioneer.
Late Mover Advantage: How Innovative LateEntrants Outsell Pioneers
Although pioneers outsell late movers in many markets(e.g., Kalyanaram and Urban t992; Robinson 1988; Robin-son and Fomell 1985; Urban et al. 1986), a growing body ofevidence suggests that in some cases late movers outsell pi-oneers (e.g., Golder and Tellls 1993; Lieberman and Mont-gomery 1988; Lilien and Yoon 1990). The personal com-puter, wine cooler, and video game markets are examples inwhich pioneers were eclipsed by late movers. Lilien andYoon (1990) find that success is lower for first and second
*Venkatesh Shankar is Assistant Professor of Marketing, College ofBusiness and Management, University of Maryland (e-mail:[email protected]). Gregory S. Carpenter is Associate Professor ofMarketing. J. L. Kellogg Graduate School of Management, NorthwesternUniversity (e-mail: [email protected]). Lakshman Krishnamurthi is A.Montgomery Ward Professor of Marketing and Chairperson, MarketingDepartment, J. L. Kellogg Graduate School of Management, NorthwesternUniversity (e-mail: [email protected]). The authors thank the editor, threeanonymous JMR reviewers, and participants at the Wharton conference onInnovation in New Product Development for insightful comments and sug-gestions. The authors also thank IMS America for providing the data usedin this research.
entrants; higher for third and fourth; and again lower forfifth, sixth, and subsequent entrants in selected French mar-kets for industrial goods. Golder and Tellis (1993) find thatmarket share leadership for pioneers is supported in only 4of the 50 product categories they studied.
Late movers can outsell pioneers in at least two ways.First, a late mover can beat a pioneer at the pioneer's owngame. The pioneer plays a central role in defining the cate-gory concept (e.g., Kleenex) and buyer preferences for thecategory (Carpenter and Nakamoto 1989). These prefer-ences are the foundation for competition between the pio-neer and later entrants in a category (e.g.. Carpenter andNakamoto 1996). By understanding these preferences, a latemover can identify a superior but overlooked product posi-tion, undercut the pioneer on prices, or out-advertise or out-distribute the pioneer, thereby beating the pioneer at its owngame. The freeze-dded coffee market offers one such ex-ample. Maxwell House's Maxim pioneered the category,but Nestle's Taster's Choice identified a superior positionand overtook Maxim (Urban et al. 1986).
Second, a late mover can overtake a pioneer through in-novation. Innovation in either product or strategy can re-
Journat of Marketing ResearchVol. XXXV (February 1998), 54-70 54
Late Mover Advantage 55
shape the category and the competitive game between thepioneer and late entrants, enabling a late mover to overtakethe pioneer (Bemdt et al. 1995; Carpenter et al. 1997; Car-penter and Sawhney 1996; Yip 1982). For example, Gillettehas built a powerful position in the razor market through aprocess of continuing innovation. Through these innova-tions, it has overtaken the pioneer. Star, and many others(Golder and Tellis 1993). The role of innovation is particu-larly vivid in evolving or so-called "high-technology" mar-kets (Carpenter and Sawhney 1996; Golder and Tellis1993), such as the video cassette recorder market, in whichthe pioneer Ampex was overtaken by Matsushita, and themicrowave market, in which the pioneer Amana waseclipsed by Samsung. Innovation plays a role in so-called"low-technology" markets as well: Tide dominates the laun-dry detergent market pioneered by Dreft, and Evereadyleads the flashlight battery market launched by Bright Star(Golder and Tellis 1993).
Existing empirical analyses of sequential entry have fo-cused on explaining the advantages associated with pioneer-ing. These analyses have produced important insights aboutthe advantages of early entry and the strategies available to latemovers (e.g.. Bowman and Gatignon 1996; Carpenter andNakamoto 1990; Kalyanaram and Urban 1992; Parker andGatignon 1996; Urban et al. 1986). These studies show that pi-oneers enjoy substantial advantages relative to late movers andthat late movers should identify superior positions and out-spend pioneers to beat them at their own game. These analy-ses, however, have not examined the impact of innovative lateentry on either the diffusion process or the responsiveness ofbrands' sales to marketing expenditures. That may suggestmechanisms of advantage for innovative late movers. For ex-ample, most previous analyses have assumed that diffusion ofcompetitors leaves the focal brand's diffusion and marketingmix effects unaffected (e.g.. Bowman and Gatignon 1996;Kalyanaram and Urban 1992; Urban et al. 1986). Other stud-ies that examine the effect of competitor diffusion (Parker andGatignon 1994, 1996) assume that this effect on the pioneer isthe same regardless of whether the competitors are innovativeor not. By not exploring innovation, many intriguing questionsabout its role remain open. For example, does innovative lateentry lead to faster diffusion, greater potential markets, andhigher repeat purchase rates compared with other entry strate-gies? Does the diffusion of an innovative late mover slow thepioneer's diffusion or reduce its marketing spending effective-ness in a way that noninnovative late movers do not?
In this article, we address these questions to identifymechanisms that enable an innovative late mover to outsella pioneer. We analyze two markets comprising 13 brands. Ineach market, the pioneer was followed by innovative andnoninnovative late entrants and was overtaken by an innov-ative late mover. We model the sales of each brand using ageneralization of the Bass (1969) model that captures theimpact of a brand's diffusion, its competitors' diffusion, itsmarketing spending, and repeat purchases on its sales. Un-like previous models of sequential entry, we model brandsales rather than trials (Parker and Gatignon 1994, 1996) ormarket share (Bowman and Gatignon 1996; Kalyanaramand Urban 1992; Urban et al. 1986), allow each brand tohave unique parameters to reflect asymmetries in competi-tion, and explicitly examine the differential impacts of dif-fusion of innovative and noninnovative competitors on
brand sales. On the basis of the model, we develop hy-potheses to explain how the diffusion and marketing spend-ing parameters differ by entry strategy (pioneering and in-novative and noninnovative late entry).
Estimating our model and testing our hypotheses pro-duces fresh insights about the role of innovation in late en-try strategy. Our results show that noninnovative latemovers have less effective marketing spending and lowerrepeat purchase rates compared with pioneers and innova-tive late entrants, which is consistent with prior empiricalstudies examining pioneers and late movers (e.g.. Bowmanand Gatignon 1996; Kalyanaram and Urban 1992; Urban etal. 1986). In addition, we show that pioneers have higher po-tential markets than noninnovative late movers and that theirdiffusion and marketing mix effectiveness are unaffected bydiffusion of noninnovative late entrants. Thus, comparedwith these weaker rivals, pioneers enjoy significant advan-tages that can be surmounted only at considerable expense.
Innovative late movers, however, face a dramatically dif-ferent situation. Our results show that innovative late entrycreates asymmetries in diffusion, response to marketing ex-penditures, market potential, and repeat rates. Comparedwith pioneers and noninnovative late entrants, innovativelate movers diffuse faster, enjoy higher market potential,and have higher repeat rates. Moreover, innovation enablesa late mover to have an impact on the pioneer's diffusionand market response that a noninnovative late mover doesnot. Greater diffusion of an innovative late mover slows thepioneer's diffusion and reduces the pioneer's marketingspending effectiveness. Greater diffusion of the pioneer andnoninnovative later entrants, conversely, does not have anyimpact on the innovative late mover. Combined, these re-sults suggest that innovative late movers can create a latemover advantage: Compared with a pioneer and noninnov-ative late movers, an innovative late mover will spend lesson marketing and generate less trial to achieve the same lev-el of unit sales. Moreover, innovative late movers are ad-vantaged asymmetrically in that their diffusion can hurt thesales of other brands, but their sales are not affected by com-petitors' diffusion. We explore the implications of these re-sults for late entry strategy, timing of entry, and the com-petitive process between pioneers and late entrants.
MODEL FORMULATION
Consider a market in which the pioneer is followed byother brands that enter sequentially, including innovativeand noninnovative late movers. Brands expend resources onmarketing to generate trials, some of which lead to repeatpurchases. They diffuse over time, affected by word ofmouth, innovative purchases, and competitors' sales. Ourinterest in this setting is to explain the sales of each brand interms of the diffusion process, its marketing efforts, and thecompetitors' diffusion. This will help reveal the impact ofinnovation on brand diffusion and market response andexamine possible sources or mechanisms of advantage forthe brands. In such a setting, we decompose brand sales intotrials and repeat purchases as follows:
(1)
where
Si, = PiCTi(, - I),
jt = sales of brand i at time t.
56 JOURNAL OF MARKETING RESEARCH, FEBRUARY 1998
Tj, = trials of brand i at time t,Pi - the repeat purchase rate of brand i,' and
CTi(, _ I) = cumulative trials of brand i at the end of timet - 1.
Brand trials are affected by both diffusion and marketingmix effects. We model the diffusion effect as consisting ofboth innovative and imitative factors, as has been doneextensively at the product category level (e.g., Bass 1969).Brand-level diffusion, however, also can be influenced bydiffusion of competitors (e.g., Mahajan, Sharma, andBuzzell 1993; Parker and Gatignon 1994, 1996; Petersonand Mahajan 1978). To account for these effects, we modelthe impact of competitors' diffusion on a brand's trials. Toexamine the differential impact of innovative and noninno-vative competitors on a brand's diffusion process, weinclude separate variables for the diffusion of innovativeand noninnovative competitors.^
A brand's trial depends on its marketing spending (e.g.,Chatterjee and Eliashberg 1990; Kalish 1983; Parker andGatignon 1994, 1996). Marketing mix effects at the brandlevel have been shown to be asymmetric (Bowman andGatignon 1996; Carpenter et al. 1988; Carpenter andNakamoto 1989; Parker and Gatignon 1994) and can be af-fected by increased competition (Gatignon, Anderson, andHeisen 1989). To capture these, we specify unique market-ing spending parameters for each brand and allow these pa-rameters to differ depending on the diffusion of competitors.Competitor diffusion reflects competitor dominance, whichinfluences a brand's marketing effects (Schmalensee 1987).As a competitor brand diffuses over time, its pool ofadopters expands. Greater numbers of adopters increase thecompetitor brand's dominance in the market and this can af-fect significantly the effectiveness of a brand's marketingactivities. The impact of competitor diffusion may differ de-pending on whether the competitors are innovative or not.To examine the differential impacts of innovative and non-innovative competitors on a brand's marketing effects, weinclude separate variables for the diffusion of innovativeand noninnovative competitors.
Specifically, we model brand trials as
(2) Ti, = [a; + bi CTi(, _ i) + cji CSii(t - i) + CiN CSiN(. - D]
I - CTi(, - :)]TMi,P - D
where i, t, I, and N represent brand, time, innovative com-petitors, and noninnovative competitors, respectively,
ai = coefficient of external influence of brand i,b, = word-of-mouth coefficient of brand i,Cji = coefficient of influence of innovative com-
petitors on brand i's diffusion,CSji(i _ I) = total cumulative sales of innovative competi-
tors of brand i at the end of time t - 1,
'We assume a brand's repeat purchase rate to be constant for two rea-sons. First, it enables tractability of model estimation. Second, priorresearch has found this assumption to be appropriate (e.g., Hahn et al.1994). It should be noted that this assumption is more valid in contexts inwhich the extent of brand switching and competitive effects on repeat pur-chases are lower, for example, ethical drug and computer software markets.
2The noninnovative competitors of each late mover brand include thepioneer.
CjN = coefficient of influence of noninnovativecompetitors on brand i's diffusion,
- 1) = tot^l cumulative sales of noninnovative com-petitors of brand i at the end of time t - 1,
Mi = market potential for brand i,i, = total marketing mix expenditures of brand i
at time t,Pio - brand i's marketing mix parameter,
Pi[ and piN are coefficients of influence of innovative andnoninnovative competitors' diffusion, respectively, onbrand i's marketing mix parameter, and the other terms aredefined as previously. The multiplicative form of Equation2 has been found to describe new product growth well(Bass, Krishnan, and Jain 1994; Jain and Rao 1990). It en-ables us to examine separately diffusion and marketing mixeffects on brand trials. Diffusion effects are captured in fiveparameters, namely, ai, bj, Ci|, Ci , and Mi. As in the originalBass (1969) model, ai and bi capture the impacts of innova-tive and imitative purchases, respectively, on brand i's trials.We capture the impact of competitors' diffusion on abrand's diffusion by decomposing competitors into twogroups, namely, innovative and noninnovative brands.Separate parameters Ci, and CiN capture the impacts of thediffusion of innovative and noninnovative competitors, re-spectively.3 Brand i's market potential is captured by Mi.We allow each brand to have its separate market potential.Differences in Mi reflect differences in brand positioningcreated by differences in each brand's physical attributes.The model can be extended to capture the impact of mar-keting mix on market potential (e.g., Kalish 1985; Parkerand Gatignon 1994).
We capture the impact of marketing mix activitiesthrough the term TMi, and its coefficients pio, Pi|, and piN.Pio reflects the impact of brand i's marketing activities on itstrial. Pii and pi^ capture the impacts of the diffusion of in-novative and noninnovative competitors, respectively, onthe effectiveness of brand i's marketing efforts. We assumethe exponent of TMi, is less than one, which is consistentwith empirical evidence (Bass, Krishnan, and Jain 1994).For a similar modeling approach, see Jain and Rao (1990)and Parker and Gatignon (1994, 1996).
Combining the brand trial and repeat purchase compo-nents, we specify brand sales as
(3) Si, = [ai + bi CTi(, - I) + ci[ CSii(, _ n + ciN CSiN(i - n]
[Mi - CTi(, - ii]TMi,Pio + PiiCSiK. - 1) + PiNCSiNo - n
+ PiCTi(, - D + Ei,,
where Ei, is an error term assumed to have a mean of 0. Allother terms are defined as previously.'*
Equation 3 is a generalization of the Bass (1969) model.If competitors' diffusion, marketing spending, and repeatpurchase variables are excluded from Equation 3, it reducesto Bass' (1969) original model. We extend it in ways con-
^We represent diffusion of competitive brands by an observable variable,namely, competitor cumulative sales, because unlike own cumulative trials,trials of competitor brands cannot be estimated using the iterative estima-tion method that we propose subsequently.
''We subsequently te.st for the assumption of normality of residuals.
Late Mover Advantage 57
sistent with previous approaches in the diffusion literature.We include the marketing efforts in a manner similar to Jainand Rao's (1990) and Parker and Gatignon's (1994, 1996)extensions of the Bass (1969) model. We include the impactof competitor diffusion on brand trials in a manner similarto Parker and Gatignon (1996) and include repeat purchasessimilar to Hahn and colleagues (1994). In this formulation,marketing effort principally affects brand trials, whereas themarket potential and repeat purchase rates are determinedby other factors, such as the product attributes. Unlike thesemodels, however, we capture the impact of competitor dif-fusion on both diffusion effects (through C||CS|(, _ i) +C|NCSN(t- 1)) and marketing mix effects (through |3iiCS|(t_ i)+ PiNCSN(t- 1))- Furthermore, we capture the effects of in-novative and noninnovative competitors on a brand's salesseparately. Table I summarizes how our model compareswith prior models in the literature.
Compared with previous models of sequential entry.Equation 3 offers two principal advantages. First, by model-ing total brand sales rather than brand trials or market share,we can estimate diffusion parameters, market potential, andrepeat rates for each brand using a single model. Previousmodels of market shares estimate diffusion parameters forall brands but the pioneer and provide no estimates of mar-ket potential (e.g.. Bowman and Gatignon 1996; Kalya-naram and Urban 1992; Urban et al. 1986). Analyses ofbrand trials alone provide estimates of market potential butnot repeat purchase rates (e.g., Parker and Gatignon 1994,1996). In contrast. Equation 3 provides estimates of bothmarket potential and repeat rates for each brand.
Second, by allowing each brand to have unique parame-ters. Equation 3 captures asymmetries in both diffusion andmarket response. Asymmetries in market response havebeen shown to exist (Bowman and Gatignon 1996; Parkerand Gatignon 1994, 1996), but the role of innovation in cre-ating these asymmetries has not been addressed. Equation 3captures two sources of asymmetry due to innovative lateentry. One is the different diffusion, marketing mix, and re-peat purchase parameters for each brand (a|, bj, PJQ, and pj).The other is the differential competitive influence related tobrand diffusion and market response (c^, CJN, PH, and Pi^).Significant differences in these parameters indicate poten-tially important asymmetries in diffusion and market re-sponse. By separating the late entrants into innovative andnoninnovative late entrants, we are able to assess the differ-
ence in the competitive impact of innovative late entrantsrelative to noninnovative late entrants on the pioneer's dif-fusion and market response.
Equation 3 captures the impact of innovation in two ways.First, innovation will be reflected in differences in trial andrepeat purchase parameters. All brands in Equation 3 haveunique parameters; differences between innovative and non-innovative late entrants will reflect the impact of innovationon trial and repeat rates. Second, innovation will be reflect-ed in the impact of the diffusion of innovative late moverson the trials of competitors' brands. Equation 3 can be gen-eralized as well to account for other roles of innovation.^
HYPOTHESES
The form of Equation 3 enables us to develop hypothesesabout how the parameters differ by different market entrystrategies, namely, pioneering and innovative and noninno-vative late entry. Testing these hypotheses reveals howinnovative late entry can create a competitive advantageover pioneers or noninnovative late entrants.
Brand Growth
Consider first the variation in growth rates of brands byentry strategy. Kalyanaram and Urban (1992) find that laterentrants grow faster than early entrants in market share rel-ative to the pioneer, which implies that later entrants willdiffuse faster in sales than early entrants. Kalyanaram andUrban (1992), however, do not consider the role of innova-tion. The pioneer is faced with the task of creating aware-ness for the product category and its brand. Late movers,however, only need to develop brand awareness and can relyon the pioneer's efforts to establish the category. After a cat-egory is established, innovativeness may provide relativeadvantage over other brands that in turn can lead to fasteradoption (Rogers 1995). Clearly, an innovative late moverdoes not need to develop category awareness, and given thatconsumers know about the category, it might be easier for itto develop awareness for its brand relative to its rivals.^Therefore, innovative late movers will grow faster than non-
'Equation 3 also could be used for forecasting brand sales. That, how-ever, is not the purpose in constructing it. As a result, other models,designed primarily for forecasting (e.g., Hahn et al. 1994; Kalish 1985),may be more suitable for that task.
6We thank an anonymous reviewer for this explanation.
Table 1COMPARISON OF OUR MODEL WITH RELEVANT LITERATURE
Model
Bass (1969)Bowman and Gatignon (1996)Hahn and colleagues (1994)Jain and Rao (1990)Kalish (1985)Kalyanaram and Urban (1992)
Parker and Gatignon (1994. 1996)Urban and colleagues (1986)
Our research (1997)
DependentVariable
TrialsMarket share
SalesTrialsTrials
Relativemarket share
TrialsRelative
market shareSales
AsymmetricComi>etition
NoYesYesNoNoNo
YesNo
Yes
Estimationof MarketPotential
YesNoYesYesYesNo
YesNo
Yes
Estimation ofRepeat Rate
NoNoYesNoNoYes
NoNo
Yes
CompetitorDiffusion
NoNoNoNoNoNo
YesNo
Yes
Separate Impacts ofInnovative andNoninnovative
Competitors
NoNoNoNoNoNo
NoNo
Yes

58 JOURNAL OF MARKETING RESEARCH, FEBRUARY 1998
itinovative late movers that in tum will grow faster than thepioneer. We formalize this as
H|j: Noninnovative late entrants grow faster than the pioneer.H||,: Innovative late entrants grow faster than the pioneer.HIJ.: Innovative late entrants grow faster than noninnovative late
movers.
The diffusion parameters a; and bj determine brand i'sgrowth rate. Brand i will grow faster than brand j if at leastone of the coefficients a, or b, is greater than aj or bj, respec-tively, and the other coefficient is at least equal (Bass 1969).Therefore, H|a predicts that a^ > ap and bfj > bp (N = non-innovative late mover, P = pioneer), with at least one ofthese being a strict inequality. H|(, and Hi^ predict that a| >a, or bl > b|, with at least one of these being a strict inequal-ity for i E {P, N), respectively (I - innovative late mover).
Competitor Diffusion
Consider next the impact of competitors' diffusion on thepioneer's diffusion. The impact of competitors' diffusionmay differ depending on whether the competitors are inno-vative or noninnovative late entrants. Creater diffusion of alate entrant might not hurt the pioneer and in some caseswill lend greater credibility to the category, which aids thediffusion of the pioneer (Carpenter and Nakamoto 1989).This is more likely to be the case for noninnovative lateentrants. In contrast, greater diffusion of an innovative latemover is likely to have the opposite effect, challenging thepioneer's dominance and slowing its diffusion. This sug-gests the following:
H2a: Greater diffusion of innovative late movers slows the pio-neer's diffusion.
H2b: Greater diffusion of noninnovative late movers has a non-negative influence on the pioneer's diffusion.
Competitor diffusion effects are captured by Cn and Cj . Apositive coefficient indicates that greater cumulative sales ofcompetitors will increase brand i's sales. A negative coeffi-cient suggests the opposite impact. Hja predicts Cpi < 0, andH2b predicts Cp > 0.
Market Potential
Market potential is likely to differ for the pioneer and latemovers. Pioneers initially face the prospect of a small mar-ket potential. Awareness is low, the cost of gaining trial ishigh, and the risk associated with market entry is high(Kalish and Lilien 1986a, b). Successful pioneers, however,might retain a larger share of buyers but need not have largerpotential markets than all late entrants. In contrast, an inno-vative late entrant can free-ride on the category awarenessand buyer education created by the pioneer and appeal to agreater pool of adopters than the pioneer if it offers greatervalue through superior positioning (Lieberman and Mont-gomery 1988). Therefore, market potential for innovativelate movers may be at least as high as that for the pioneer.Noninnovative late movers, conversely, might suffer fromperceptual disadvantage relative to the pioneer (Carpenterand Nakamoto 1989) and therefore will face a potentiallysmaller market. In addition, brands that enter a category lateare likely to have a smaller potential pool of adopters(Parker and Gatignon 1996). This suggests the following;
H3a: Market potential for an innovative late mover is as high asthat for the pioneer.
H3I,: Market potential of the pioneer is higher than that for anoninnovative late mover.
H3a and H^^, imply that Mj > Mp > M N .
Marketing Expenditures
Consider next the impact of brand i's marketing expendi-tures on its sales, which is captured by PJQ. Bowman andGatignon (1996) find that marketing effectiveness of lateentrants is not as high as that of the pioneer. Other studies,for example Gatignon, Weitz, and Bansal (1990); Hahn andcolleagues (1994); and Shankar (1997), however, find thatsuperior brands have higher marketing spending effective-ness. We argue that the first result is likely to hold for non-innovative late entrants, whereas the second result shouldhold for innovative late entrants. Innovative products sub-stantially enhance credibility, beliefs, and attitudes for com-munication messages, making marketing communicationsmore effective (Rogers 1995). It is easier to promote a supe-rior brand than one that is similar to all the other brands(Gatignon, Weitz, and Bansal 1990). These arguments leadto the following hypotheses:
H^^[ Noninnovative late movers have lower marketing spendingeffectiveness than pioneers.
H4[,: Noninnovative late movers have lower marketing spendingeffectiveness than innovative late movers.
Therefore, H4a implies o, and H41, implies
Competitor Impact on Marketing ExpendituresEffectiveness
Consider next the impact of competitors' diffusion on thepioneer's marketing mix response. Prior research suggeststhat the marketing effectiveness of incumbents can beaffected by subsequent brands (Gatignon, Anderson, andHelsen 1989) and competitive brand dominance, which isreflected by the extent of competitors' diffusion(Schmalensee 1987). Greater diffusion of an innovative lateentrant enhances its brand dominance, which in tum willcast doubt on the pioneer's dominance and thus reduce thepioneer's marketing effectiveness. As the innovative branddiffuses over time, it gains momentum that effectively candiminish the marketing spending effectiveness of the pio-neer. In contrast, greater diffusion of noninnovative latemovers is not likely to hurt the pioneer. In some cases, it canbring greater credibility to the pioneer (Carpenter andNakamoto 1989), which may increase the pioneer's market-ing effectiveness. This implies the following hypotheses:
Hsa. Innovative late movers' diffusion has a negative effect onthe pioneer's marketing spending effectiveness.
H51,: Noninnovative late movers' diffusion has a non-negative in-fluence on the pioneer's marketing spending effectiveness.
The impact of competitor diffusion on a brand's marketingmix is captured by Pi| and Pi^. Thus, H^^ implies Pp| < 0,and H5(, implies pp^ > 0.
Repeat Purchase
Finally, consider the repeat purchase rate p;. Considerfirst pioneers versus noninnovative later entrants. The pio-neer can define the category or preempt superior perceptual
Late Mover Advantage 59
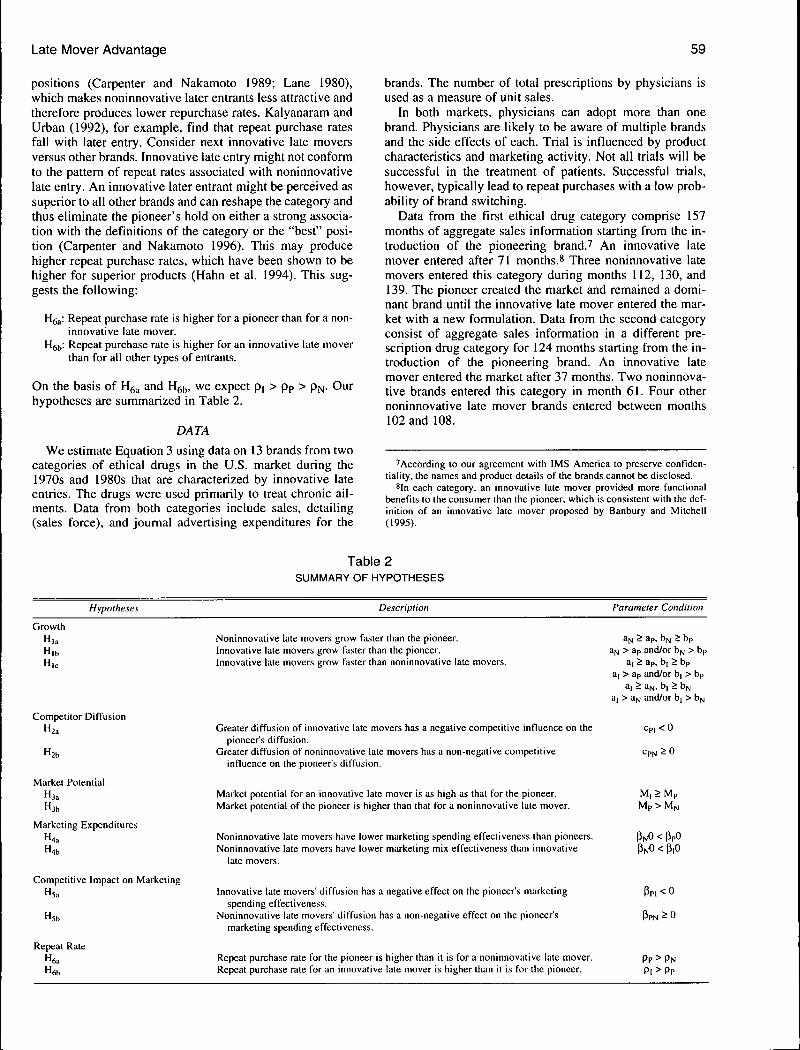
positions (Caqjenter and Nakamoto 1989; Lane 1980),which makes noninnovative later entrants less attractive andtherefore produces lower repurchase rates. Kalyanaram andUrban (1992), for example, find that repeat purchase ratesfall with later entry. Consider next innovative late moversversus other brands. Innovative late entry might not conformto the pattern of repeat rates associated with noninnovativelate entry. An innovative later entrant might be perceived assuperior to all other brands and can reshape the category andthus eliminate the pioneer's hold on either a strong associa-tion with the definitions of the category or the "best" posi-tion (Carpenter and Nakamoto 1996). This may producehigher repeat purchase rates, which have been shown to behigher for superior products (Hahn et al. 1994). This sug-gests the following:
Hgai Repeat purchase rate is higher for a pioneer than for a non-innovative late mover.
Hgi,: Repeat purchase rate is higher for an innovative late moverthan for all other types of entrants.
On the basis of H^^ and Hgj,, we expect p| > pp > PN. Ourhypotheses are summarized in Table 2.
DATA
We estimate Equation 3 using data on 13 brands from twocategories of ethical drugs in the U.S. market during the1970s and 1980s that are characterized by innovative lateentries. The drugs were used primarily to treat chronic ail-ments. Data from both categories include sales, detailing(sales force), and journal advertising expenditures for the
brands. The number of total prescriptions by physicians isused as a measure of unit sales.
In both markets, physicians can adopt more than onebrand. Physicians are likely to be aware of multiple brandsand the side effects of each. Trial is infiuenced by productcharacteristics and marketing activity. Not all trials will besuccessful in the treatment of patients. Successful trials,however, typically lead to repeat purchases with a low prob-ability of brand switching.
Data from the first ethical drug category comprise 157months of aggregate sales information starting from the in-troduction of the pioneering brand.^ An innovative latemover entered after 71 months.^ Three noninnovative latemovers entered this category during months 112, 130, and139. The pioneer created the market and remained a domi-nant brand until the innovative late mover entered the mar-ket with a new formulation. Data from the second categoryconsist of aggregate sales information in a different pre-scription drug category for 124 months starting from the in-troduction of the pioneering brand. An innovative latemover entered the market after 37 months. Two noninnova-tive brands entered this category in month 61. Four othernoninnovative late mover brands entered between months102 and 108.
'According to our agreement with IMS America to preserve conHden-tiality. the names and product details of the brands cannot be disclosed.
In each category, an innovative late mover provided more functionalbenefits to the consumer than the pioneer, which is consistent with the def-inition of an innovative late mover proposed by Banbury and Mitchell(1995).
Table 2SUMMARY OF HYPOTHESES
Hypotheses Description Parameter Condition
Growth
Competitor Diffusion
Market Potential
H3a
Hjb
Marketing Expenditures
Competitive Impact on Marketing
Hja
Hjb
Repeat Rate
Noninnovative late movers grow faster than the pioneer.Innovative late movers grow faster than the pioneer.Innovative late movers grow faster than noninnovative late movers.
Greater diffusion of innovative late movers has a negative competitive influence on thepioneer's diffusion.
Greater diffusion of noninnovative late movers has a non-negative competitiveinfluence on the pioneer's diffusion.
Market potential for an innovative late mover is as high as that for the pioneer.Market potential of the pioneer is higher than that for a noninnovative late mover.
Noninnovative late movers have lower marketing spending effectiveness than pioneers.Noninnovative late movers have lower marketing mix effectiveness than innovative
late movers.
Innovative late movers' diffusion has a negative effect on the pioneer's marketingspending effectiveness.
Noninnovative late movers' diffusion has a non-negative effect on the pioneer'smarketing spending effectiveness.
Repeat purchase rate for the pioneer is higher than it is for a noninnovative late mover.Repeat purchase rate for an innovative late mover is higher than it is for the pioneer.
a^ 5 ap, bivi > bp> ap and/or bfj > bpaj > ap, b[ > bp
| > ap and/or b | > bpa, > aN, b | > bN
| > a|,j and/or b | > b^
cp, <0
M|>MpMp > MN
PNO < PpOPNO < PiO
PPI<0
PPN>0
PP>PNPI>PP

60 JOURNAL OF MARKETING RESEARCH, FEBRUARY 1998
The data for categories I and II are summarized in Table3, which shows that the innovative late mover in each cate-gory has higher average monthly sales than either thepioneer or the noninnovative late movers. Although the in-novative late mover's average spending is higher than thepioneer's and the noninnovative late movers' in category I,it is lower in category II. The innovative late movers in bothcategories, however, overtook the pioneers in monthly salesas reflected by the average sales in the last month of the da-ta in Table 3. The key question is. How?
We exogenously determined the innovativeness of thebrands through a survey of 32 physicians who prescribedrugs in these categories. We measured innovativenessalong four primary dimensions: dosage, efficacy, side ef-fects, and range of indications. These dimensions are con-sistent with those used in previous studies of ethical drugs(e.g., Gatignon, Weitz, and Bansal 1990; Hahn et al. 1994).On each dimension, physicians rated the innovativeness ofeach brand on a five-point scale ranging from "very poor" to"very good."^ We computed an overall measure of innova-tiveness by averaging across the four dimensions. We foundthe overall innovativeness of the second entrant in each cat-egory to be significantly higher than the pioneer's, whereaswe found the innovativeness of the other late entrants ineach category to be either significantly lower than or equalto that of the pioneer, which is consistent with an acceptedperception among physicians about these brands.'O In addi-tion, the innovative late entrant in each category was per-ceived to be higher than all the other brands on one dimen-sion of innovativeness and at least as high as the otherbrands in the remaining dimensions.
We exclude price and distribution from our analysis forseveral reasons. During the period of the data, there was notmuch pressure on physicians, the decision makers in thismarket, to pay attention to prices. No generic products en-tered during the period of data, so there was no price com-petition, which is consistent with other studies on ethicaldrugs (e.g., Gatignon, Weitz, and Bansal 1990; Hahn et al.1994). We do not have data on distribution. The companiesthat produced and marketed the brands in the data sets, how-
'We asked physicians to rate the innovativeness of each brand as theyperceived the brand when it was launched and as they perceived it at pre-sent. These two sets of ratings are consistent because the niieans of the rat-ings in all the dimensions across the two time frames are not significantlydifferent for the 13 brands in our sample.
'"Based on t-tests of differences ofthe overall innovativeness ratings ofthe brands in each category {p < .05).
ever, employ essentially the same distribution channels, sodistribution is not a differentiating factor.
MODEL ESTIMATION
We estimate the brand sales model by iterative nonlinearleast squares (INLLS) similar to the method proposed byHahn and colleagues (1994), because the cumulative trialsCTj( in Equation 3 are not observable. In this method, weperform the following steps:
(1) Select a value of Pi* and calculate CTj, from the equatiotiCTjt = CTi(, _ ,) + Ti,, t > 0, where T,, = S;, - Pi CTit. Notethat CTj, are the cumulative trials at the end of period t, sothat CTio = 0.
(2) Obtain parameter estimates of aj, bj, Mj, PJQ, and Pj throughnonlinear least squares (NLLS) using the calculated variableCTj,
(3) If \p(^ - pj I < A., where X is some predetermined small num-ber (e.g., .001), terminate the procedure. Otherwise, start theiteration again by replacing the pj' in step 1 with the pj ob-tained in step 2.
To get starting values for the parameters in the nonlinearbrand sales model, we first estimated a model of trials with-out marketing mix effects using NLLS after step 1. We usedthe parameters from this model as the first set of starting val-ues for the corresponding parameters in the final model. Toensure that global optimum is reached, we used ten differentsets of starting values (using a grid search procedure) andchecked the resulting parameter values for convergence. Weconstrained the exponent on marketing mix spending to beless than one to reflect diminishing returns to marketing mixexpenditures. We tested for autocorrelation and normality ofresiduals. The null hypothesis of normal distribution ofresiduals cannot be rejected in each brand sales model,which suggests that the assumption of normality of errorsholds. The first-order autocorrelation of the residuals did notexceed .25 for any of the brands, which suggests that auto-correlation is not a major problem (Srinivasan and Mason1986)."
' 'To ensure that our results are not idiosyncratic to our model specifica-tion, we compare our brand sales model with a comparable alternativemodel. We discuss the alternative model formulation and results in theAppendix.
Table 3SUMMARY STATISTICS OF MARKET DATAa
Brands (Category)
Pioneer (I)Innovative Late Mover (I)Noninnovative Late Movers (I)Pioneer (II)Innovative Late Mover (II)Noninnovative Late Movers (II)
AverageSample
Size(Months)
1578631
1248735
AverageMonthly Sales(Prescriptions)(in thousands)
1000.71071.9
140.4732.9
1040.8211.3
Average Sales inLast Month
of Data(Prescriptions)(in thousands)
988.01722.0226.7832.0
1539.0268.2
Average MonthlyMarketingSpending
(in thousandsof dollars)
1229.62201.51629.71683.21464.31588.3
"Used with the expressed written permission of IMS America, Ltd.
Late Mover Advantage 61
RESULTS
Brand Growth
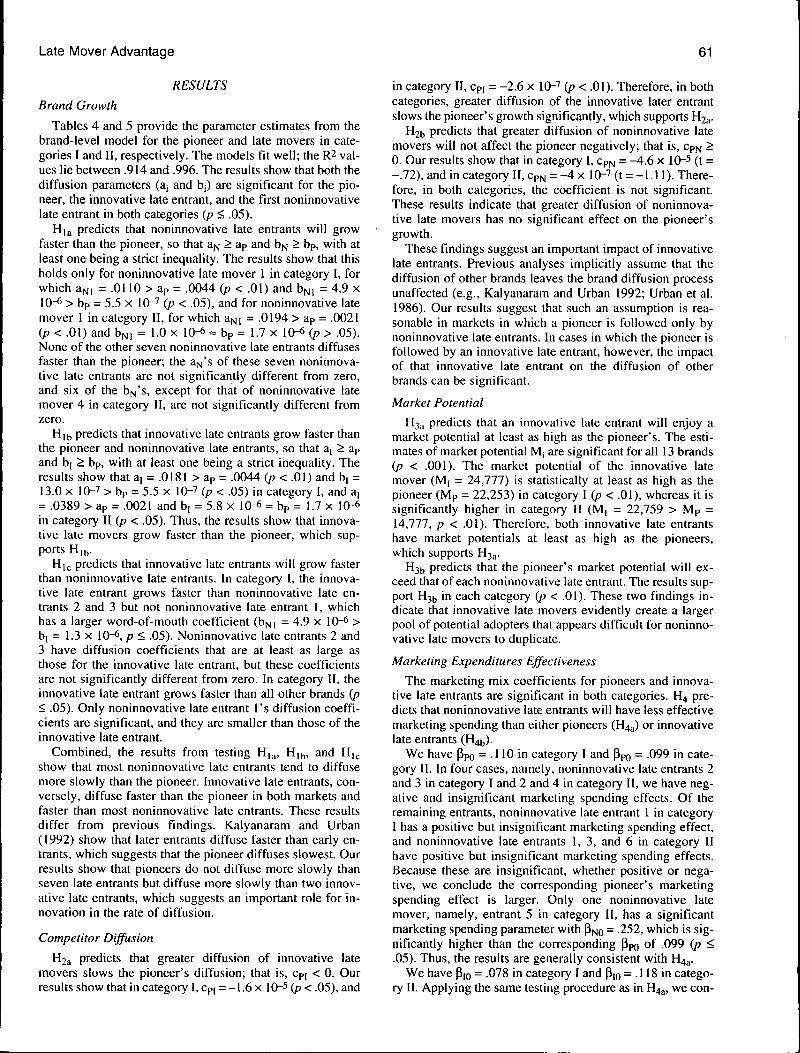
Tables 4 and 5 provide the parameter estimates from thebrand-level model for the pioneer and late movers in cate-gories I and II, respectively. The models fit well; the R2 val-ues lie between .914 and .996. The results show that both thediffusion parameters (aj and bi) are significant for the pio-neer, the innovative late entrant, and the first noninnovativelate entrant in both categories {p < .05).
H|a predicts that noninnovative late entrants will growfaster than the pioneer, so that a^ > ap and b^ > bp, with atleast one being a strict inequality. The results show that thisholds only for noninnovative late mover 1 in category I, forwhich aNi = .0110 > ap = .0044 (p < .01) and b^x = 4.9 x10⁻⁶ > bp = 5.5 X 10-'' ip < .05), and for noninnovative latemover 1 in category II, for which a^i = .0194 > ap = .0021ip < .01) and bNi = 1.0 x 10-6 = bp = 1.7 x 10⁻⁶ (p > .05).None of the other seven noninnovative late entrants diffusesfaster than the pioneer; the a^'s of these seven noninnova-tive late entrants are not significantly different from zero,and six of the b^'s, except for that of noninnovative latemover 4 in category II, are not significantly different fromzero.
H|b predicts that innovative late entrants grow faster thanthe pioneer and noninnovative late entrants, so that a[ > apand b| > bp, with at least one being a strict inequality. Theresults show that a| = .0181 > ap = .0044 (p < .01) and b| =13.0 X 10⁻⁷ > bp = 5.5 X lO-'' {p < .05) in category I, and a,= .0389 > ap = .0021 and b, = 5.8 x 10-6 = bp = 1.7 x 10⁻⁶in category II (p < .05). Thus, the results show that innova-tive late movers grow faster than the pioneer, which sup-ports H|b.
Hic predicts that innovative late entrants will grow fasterthan noninnovative late entrants. In category I, the innova-tive late entrant grows faster than noninnovative late en-trants 2 and 3 but not noninnovative late entrant 1, whichhas a larger word-of-mouth coefficient (bfji = 4.9 x 10⁻⁶ >b| = 1.3 X 10⁻⁶, p < .05). Noninnovative late entrants 2 and3 have diffusion coefficients that are at least as large asthose for the innovative late entrant, but these coefficientsare not significantly different from zero. In category II, theinnovative late entrant grows faster than all other brands {p< .05). Only noninnovative late entrant l's diffusion coeffi-cients are significant, and they are smaller than those of theinnovative late entrant.
Combined, the results from testing H\^, H|(,, and H|j.show that most noninnovative late entrants tend to diffusemore slowly than the pioneer. Innovative late entrants, con-versely, diffuse faster than the pioneer in both markets andfaster than most noninnovative late entrants. These resultsdiffer from previous findings. Kalyanaram and Urban(1992) show that later entrants diffuse faster than early en-trants, which suggests that the pioneer diffuses slowest. Ourresults show that pioneers do not diffuse more slowly thanseven late entrants but diffuse more slowly than two innov-ative late entrants, which suggests an important role for in-novation in the rate of diffusion.
Competitor Diffusion
H2a predicts that greater diffusion of innovative latemovers slows the pioneer's diffusion; that is, Cpi < 0. Ourresults show that in category I, Cp( = -1.6 x 10⁻⁵ (p < .05), and
in category II, Cpj = -2.6 x 10"'' (p < .01). Therefore, in bothcategories, greater diffusion of the innovative later entrantslows the pioneer's growth significantly, which supports H2a.
H21, predicts that greater diffusion of noninnovative latemovers will not affect the pioneer negatively; that is, Cp ^0. Our results show that in category I, Cp^ = -4.6 x 10-^ ( t =-.72), and in category II, CpN = -4 x lO"'' (t = -1.11). There-fore, in both categories, the coefficient is not significant.These results indicate that greater diffusion of noninnova-tive late movers has no significant effect on the pioneer'sgrowth.
These findings suggest an important impact of innovativelate entrants. Previous analyses implicitly assume that thediffusion of other brands leaves the brand diffusion processunaffected (e.g., Kalyanaram and Urban 1992; Urban et al.1986). Our results suggest that such an assumption is rea-sonable in markets in which a pioneer is followed only bynoninnovative late entrants. In cases in which the pioneer isfollowed by an innovative late entrant, however, the impactof that innovative late entrant on the diffusion of otherbrands can be significant.
Market Potential
H3a predicts that an innovative late entrant will enjoy amarket potential at least as high as the pioneer's. The esti-mates of market potential Mj are significant for all 13 brands(p < .001). The market potential of the innovative latemover (M| = 24,777) is statistically at least as high as thepioneer (Mp = 22,253) in category I {p < .01), whereas it issignificantly higher in category II (M] = 22,759 > Mp =14,777, p < .01). Therefore, both innovative late entrantshave market potentials at least as high as the pioneers,which supports H3a.
H3(, predicts that the pioneer's market potential will ex-ceed that of each noninnovative late entrant. The results sup-port H3(, in each category (p < .01). These two findings in-dicate that innovative late movers evidently create a largerpool of potential adopters that appears difficult for noninno-vative late movers to duplicate.
Marketing Expenditures Effectiveness
The marketing mix coefficients for pioneers and innova-tive late entrants are significant in both categories. H4 pre-dicts that noninnovative late entrants will have less effectivemarketing spending than either pioneers (H4a) or innovativelate entrants (H4b).
We have Ppg = .110 in category I and Ppo - .099 in cate-gory II. In four cases, namely, noninnovative late entrants 2and 3 in category I and 2 and 4 in category II, we have neg-ative and insignificant marketing spending effects. Of theremaining entrants, noninnovative late entrant 1 in categoryI has a positive but insignificant marketing spending effect,and noninnovative late entrants 1, 3, and 6 in category IIhave positive but insignificant marketing spending effects.Because these are insignificant, whether positive or nega-tive, we conclude the corresponding pioneer's marketingspending effect is larger. Only one noninnovative latemover, namely, entrant 5 in category II, has a significantmarketing spending parameter with p^o = .252, which is sig-nificantly higher than the corresponding Ppo of .099 (p <.05). Thus, the results are generally consistent with H4a.
We have Pio = .078 in category I and Pio = . 118 in catego-ry II. Applying the same testing procedure as in H4a, we con-
62 JOURNAL OF MARKETING RESEARCH, FEBRUARY 1998
Oo
1
cu.aca
tuQOCOtu_l<CO
<
m
EC
IIIIIc ^ •
| 3 ^
XCN
X
en
X
1
XON
rS
X
1
Xo
S iX X— (N-^ rn
X Xen »n
2?i58
X X
o
o
oTl
*
oGO
m(N
082
1
m
146
X Xp rn—' rn1 '-^
i-OI
Xm
1
i-OI
Xoas
i s^Sj ^ ^ >—^ ^—' ^ ^ ^ ^ ^ ^ ^ ^
CN 'O 1^ o r* >
?; i i i'X Xo >o
X X<N O
ii ii iiXO\
XOv;
X Xm.
Xm
Xin
iiX X
OO —
m —OO m
BS:g;
;5 i i iS i i, o — — — — — —• ^^ X X XX XX *o o
CN r ^CN —
Io
X XTt Tt
S-01
Xm
IXTt
X Xo i
°P
m
.01, 0 0 — — « —
-i -i OO (
XX ^ 'ON 00
I f* ^—' '—' 'J tJ
o
ai
•,—:
C
u3a.
arke
t
S
1OQC
arke
t
2
X'E00c
arke
t
00
arke
t
2
N
a.
B
—
"ica
i
cOO
ca
i
ific
i
cop-K-•X-
c3
C
3i^
'cop
*
Ote
Hi
arki
dj
ble
C4
1O
c1

Late Mover Advantage 63
trOO
ILU
tr
111Q
O
CC I JI— <
LU
<CCCQLLOcr
•Ml
soU
UIU
O
o
Late
^ ^ r
1 ^ ^
1^
.5 S ^s -3
IIS
1 3 ^
13:2
g -5! Ol. e s.
6X
VO
CN
S-O
I
Xc*
(6.
6XqT
IX
CN
| 6X Xm en
*VO ^— CN
(N ^ ^
0112
1262 6
XOv
T
S-O
I
Xoood
S-O
I
XVO
r^1
IX
fSen
0191
0086
rn —" o r-"O CN 6 6 O O
XXp p
| 6X X
X X
CN —^
X X X XOv O
— .— oo •
66X XvO en
"S 2g 1o E
2,6
X XO oo
en
075 en
047
^ ^
X X—1 u-1
-01X»nCN
f l-01
X»/-)
CN
6X
( N
T
6XoCN
X XON OS
X XTT VO
66X XO vO
•o S.
in oo— enm (NCN - ^
O Ov— CN
iS
OO ON z, z:• o X X
•o -o
C ^ Jj-
o o
t
6Xo
2X
CO
Tf-
021 Ov800
041
1
105 6
Xeno6
6Xoooo
6X
CN
6XOvCN
O
039
018
eg —
66X X
66X X
-H- VO
66 66
II
X X
en m
00 2
l —
8
a.
111 -i. — y
p
s2co
DO
p(U
c5c
'5op
op
C
3U
'5op
c<uoa.
eg
Eu
• - —

64 JOURNAL OF MARKETING RESEARCH, FEBRUARY 1998
elude that the innovative late entrant in each of the two cate-gories has more effective marketing than the noninnovativelate entrants in the corresponding category with the exceptionof noninnovative late mover 5 in category II, which has a sig-nificant marketing spending parameter with P^Q = -252. Thisis significantly higher than the corresponding Pio of. 118 (p <.05). These results are generally consistent with H41,.
These results draw an important contrast with previousfindings based on models assuming symmetric effects ofmarketing mix efforts (e.g., Kalyanaram and Urban 1992;Urban et al. 1986). These previous models assume that allentrants have equally effective marketing mixes. Our resultsshow that marketing spending of noninnovative late entrantsis significantly less effective than those of pioneers and in-novative late movers. Comparing the marketing effective-ness of innovative late movers with pioneers, we find thatthey are equally effective in both categories.
Competitor Impact on Marketing ExpendituresEffectiveness
Our results also show that the pioneer's marketing spend-ing effectiveness is affected significantly by the innovativelate mover's diffusion but not by the noninnovative latemovers' diffusion.
H5a states that the diffusion of innovative late entrantswill reduce the pioneer's marketing spending effectiveness.Our results show that Ppi = -1.2 x 10^ (p < .05) in catego-ry I and pp| = -6.2x {(y {p< .01) in category II, which sup-ports H5a.
H51, states that the diffusion of noninnovative late moverswill not reduce the pioneer's marketing spending effective-ness. Our results show that pp^ is not significantly differentfrom zero in either category.
These results reveal an asymmetry in competition associ-ated with innovative late entry. As the innovative latemover's sales grow, the pioneer's marketing spending ef-fectiveness falls. In contrast, the pioneer's marketing spend-ing is not affected by sales growth of noninnovative latemovers. This asymmetry could be an important source oflate mover advantage.
Repeat Purchase Rate
Finally, the results for repeat purchase rate pi show thatthe repeat purchase parameters are significant for all thebrands (p < .05).
Hga predicts that each noninnovative late entrant has a re-peat purchase parameter significantly less than the pioneer's.The results in categories I and II confirm this expectation, pp- .066 in category I is greater than that of the three noninnov-ative late movers (p < .05), and pp - .072 in category II isgreater than that of the six noninnovative late movers (p < .05).
Hgb predicts a higher repeat purchase parameter for the in-novative late entrant compared with all other brands. The re-peat rates of the innovative late movers in categories I and II(Pi = .088 and .096, respectively) are higher than those of oth-er brands in these categories, which supports H(|^, (p < .05).
Although the results for pioneers versus noninnovativelate entrants are consistent with Kalyanaram and Urban's(1992) finding on repeat rates, the results on innovative latemovers suggest a source of advantage for innovative latemovers relative to other brands. Thus, noninnovative latemovers are disadvantaged with respect to pioneers, but in-novative late entrants are advantaged relative to pioneers in
repeat purchases. With higher repeat rates, more trials of theinnovative late movers are converted to repeat purchases,which means the cost of building sales is significantly low-er for an innovative late entrant than for the other brands.
Summary
The results of the brand-level sales model show thatinnovative late movers grow faster than the pioneer, slow itsdiffusion, and reduce its marketing mix effectiveness, whichis consistent with our hypotheses. The market potentials ofinnovative late movers are higher than those of noninnova-tive late entrants and equal to or greater than that of the pio-neer. Innovative late movers also enjoy higher repeat ratesthan either the pioneer or noninnovative late movers. Thesebenefits can create a late mover advantage, enabling aninnovative late entrant to outsell a pioneer.
ENTRY TIMING AND INNOVATIVENESS
Our results show an advantage associated with innovativelate entry in two categories. In both cases, however, theinnovative late entrants entered considerably before the non-innovative late entrants (month 72 versus months 112, 127,and 139 in category I, and month 38 versus months 61, 102,103, and 108 in category II), which suggests that timing ofentry might be another possible explanation for our results.To explore the relative contribution of innovativeness andentry timing to the pattern of parameters observed, we con-struct the following regression model that links each keyestimated parameter to innovativeness and entry timing:
(4) Zki = a t + Yk INNi + 5k TIMi +
where Z i is the estimate of parameter k of brand i from thebrand sales model, k G {a, b, M, PQ, p), INN; is a measureof innovativeness of brand i, TIMj is the timing of its entry,ak, Yk, and 5|; are regression coefficients associated withparameter k, and u j is an error term. We allow this errorterm to be heteroscedastic, because the estimated parametersfrom different brand level models have different standarderrors. We point out that this regression analysis is limited bythe number of brands available, which in this instance is 13.
We expect innovativeness to have a positive effect andtiming of entry to have a negative effect on each parameter.Thus, we expect the coefficient of innovativeness Yk 'o bepositive and that of timing of entry 8] to be negative in eachmodel. We estimate five cross-sectional models, one foreach parameter k. Although the parameters from the brandsales model, a, b, Po, and p, are comparable across the twocategories, the market potential parameter M is not. There-fore, we use a relative market potential measure (RMj) asthe dependent variable, where RM; is the ratio of brand i'smarket potential to that of the pioneer. For a standardizedmeasure of entry timing that is comparable across cate-gories, we use the ratio of the month of a brand's entry to themonth of transition from the early growth to the late growthstages in its category.'2
'2To determine the period of transition between the early and late growthstages in the life cycle, we model each category's sales as an S-shapedcurve and find the inflection point on this curve. Among the three possibleS-shaped functional forms we tried for modeling category sales, namely,logistic, log-reciprocal, and advertising budget (ADBUDG) forms, thelogistic model provided the best fit of category sales for both categories.The inflection points of the logistic category sales model in categories I andII occur in months 66 and 68, respectively.
Late Mover Advantage 65
Results
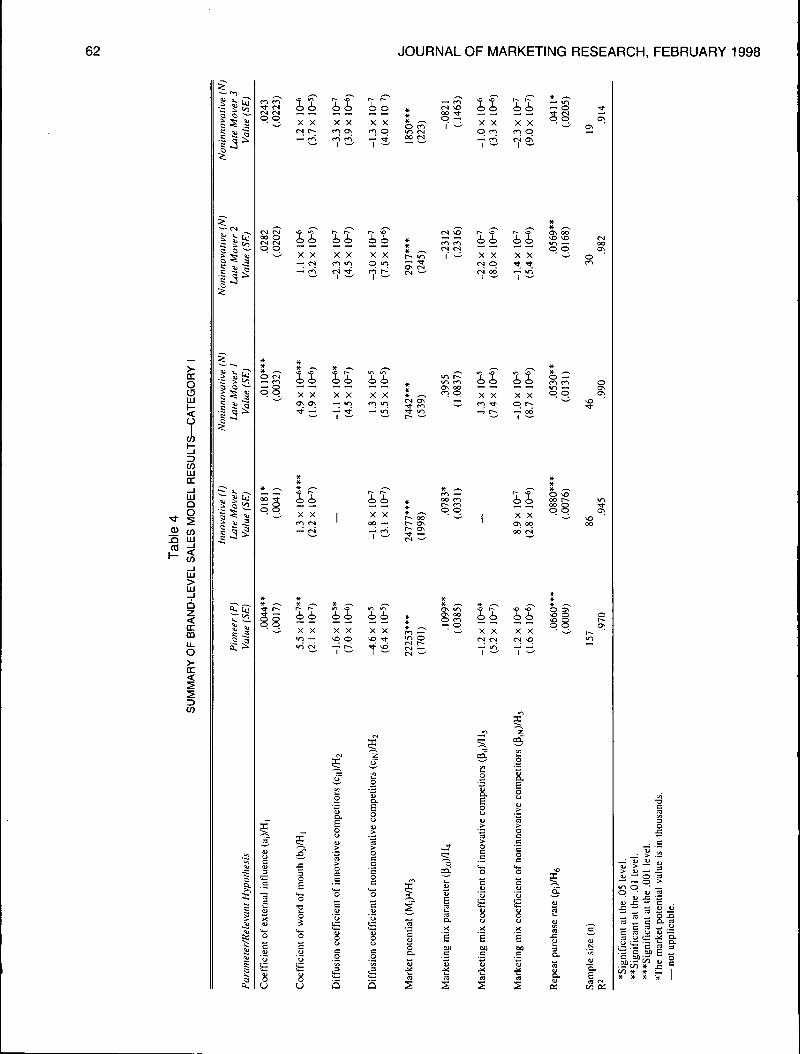
Table 6 summarizes the results of the regression model. Itshows that both intiovativeness and timing of entry signifi-cantly influence the relative market potential of a brand inthe expected direction (coefficients of 3.849 and -.412,respectively, p < .01) and the correlation of predicted andactual values of the dependent variable is high (.923).'3 Theresults indicate that innovativeness increases a brand's rela-tive market potential, whereas late entry decreases a brand'spotential. The relationship of repeat purchase rate with inno-vativeness and timing of entry is also strong (correlation of.889). More innovative brands have higher repeat purchaserates (coefficient of .724). The coefficient of timing of entry,however, is not significant, which means that timing ofentry cannot explain differences in repeat purchase rates.This suggests that the low repeat purchase rates of noninno-vative late movers relative to pioneers that we found in ouranalysis of brand sales models is due to the lower innova-tiveness of the noninnovative late mover brands and not tolate entry. This result differs from that of Kalyanaram andUrban (1992), who report that repeat purchases declinedwith order of entry, which suggests a penalty in repeat ratesfor delayed entry. Our results do not indicate any penalty inrepeat rates associated with later entry but suggest that aperception of inferiority with respect to the pioneer in inno-vativeness hurts late entrants. Therefore, brands with greaterinnovativeness enjoy both higher market potential andgreater repeat rates than other brands, whereas earlier
correlation between actual and predicted values of the dependentvariable is reported because the R2 of GLS (weighted least squares) regres-sion is not interpretable in terms of proportion of explained variance (Judgeet al. 1985). Because we cannot ascertain the variance of relative marketpotential estimate (it is the ratio of two estimated parameters), we use OLS(ordinary least squares) estimation for the regression of relative marketpotential with innovativeness and entry timing. However, we estimated amodel of absolute market potential with innovativeness and entry timingusing GLS regression and found the results to be consistent with those ofOLS regression.
entrants benefit only from a higher market potential thanlater entrants.
The coefficient of external influence increases with inno-vativeness (p < .01), which is consistent with our expecta-tion. But the coefficient of external influence also increaseswith entry timing (p < .05), which is contrary to our expec-tation. The overall fit of this regression model, however, ispoor as indicated by the correlation between predicted andactual values of the dependent variable (.274). Innovative-ness and timing of entry do not have significant influenceson the word-of-mouth effect and the marketing mix parame-ter (p < .05). Thus, our prediction is not supported for thesetwo parameters. The fits of these two regression models arealso poor as can be seen by the correlation coefficients.
A possible explanation as to why the results are consistentwith our prediction for market potential and repeat purchaserate is that these parameter estimates are significant for all13 brands and therefore have less unreliability. This is notthe case for the coefficient of external influence or the word-of-mouth or the marketing mix parameters, in which sever-al estimates are insignificant.
The regression model results suggest a trade-off betweeninnovation and entry timing. An analysis of optimal entrytiming for an innovative late mover is outside the scope ofthis work and is discussed in the Further Resetirch section.However, we can illustrate some of the implications of thistrade-off for market potential, an important factor in the en-try timing decision (Kalish and Lilien 1986a, b).'4 Table 7
'•tWe considered the possibility of the sales of the innovative late moversin both categories arising primarily from switching by users of the pio-neering brand, which might reflect a pure substitution phenomenon. How-ever, we concluded that this was not the predominant case in these two cat-egories because physicians seldom switched prescriptions for patientsusing one brand to a new brand, both to ensure continuity of the treatmentprogram and to avoid the possibility of adverse medical reaction in patientsthat could arise from changing brands. Thus, because first purchases dom-inate brand choice and switching is not common, market potential is a keydeterminant of competitive advantage for brands in these categories.
Table 6REGRESSION ANALYSIS OF BRAND SALES MODEL PARAMETERS
Parametertntercept
(SE)Innovativeness"
(SE)Timing''
(SE)
Correlation ofPredicted and
Actuai Values of theDependent Variable
Coefficient of external influence (a,)
Coefficient of word of mouth (b|)
Relative market potential (RM,)
Marketing mix parameter (P;o)
Repeat purchase rate (p,)
-.303**(.088)
-6.5 X 10⁻⁷(2.0 X 10⁻⁶)
-2.689*(1.091)
-.150(.413)
-.657***(.094)
.309**(.087)
1.4 X 10⁻⁶(2.0 X 10⁻⁶)
3.849**(1.060)
.262(.401)
.724***(.093)
.013*(.006)
3.1 X 10⁻⁷(2.4 X 10⁻⁷)
-.412***(.100)
-.058(.146)
-.002(.007)
.274
.213
.923
.287
.889
*Significant at the .05 level.**Significant at the .01 level.***Significant at the .001 level.^Innovativeness is measured as a ratio of the brand's perceived innovativeness over the pioneer's.iJTiming of entry is measured as a ratio of the time of entry to the time taken for the category sales to slow down.

66 JOURNAL OF MARKETING RESEARCH, FEBRUARY 1998
Table 7IMPLICATIONS FOR MARKET POTENTIAL OF ENTRY TIMING
AND INNOVATION
Scenario(% IncrementalInnovativeness)
1 (2%)2 (5%)3(10%)4(15%)
AvailableWaiting Time
(Months)
38.156.687.5
118.3
shows that, for example, a late mover that is perceived to be2% more innovative than the pioneer can wait only 38months after the pioneer's entry if it wants to achieve thesame market potential as the pioneer, whereas a late moverthat is considered 15% more innovative can take as long as118 months to enter.
DISCUSSION
Late Mover Advantage
Our analysis of 13 brands across two ethical drug cate-gories characterized by innovative late entries replicatesprevious findings on the advantages of pioneering (e.g..Bowman and Gatignon 1996; Kalyanaram and Urban 1992).We show that, comptired with noninnovative late entrants,pioneers have higher rates of repeat purchase and moreeffective marketing spending. In addition, however, weidentify three new ways by which pioneers outsell noninno-vative late entrants compared with prior research. Pioneershave higher potential markets than noninnovative latemovers, tend to diffuse faster than many noninnovative latemovers, and are not affected in diffusion and marketing mixeffectiveness by noninnovative late entrants. Previous stud-ies show that later entrants grow more quickly than earlyentrants, which suggests that pioneers will grow moreslowly than noninnovative late movers (e.g., Kalyanaramand Urban 1992). Instead, we find that pioneers grow fasterthan many noninnovative late entrants. Combined with ourfindings that replicate previous studies, this suggests thatnoninnovative late movers face even higher hurdles in somecases than previously was recognized.'5
Our analysis, however, shows that innovative late entrycan produce an advantage relative to pioneering. Innovativelate movers grow faster than pioneers, have higher marketpotentials, and have higher repeat rates. In addition, innova-tive late entry can have a more fundamental impact on a pi-oneer. It can slow the pioneer's growth and reduce its mar-keting spending effectiveness. Thus, innovative late entrantsare advantaged compared with pioneers. It is important tonote that these advantages are asymmetric with respect toother brands. Diffusion of other brands does not have anysignificant impact on the diffusion and marketing spendingeffectiveness of innovative late entrants in the two cate-gories analyzed. From Tables 4 and 5, the diffusion andmarketing spending coefficients of noninnovative competi-
'^It should be noted that Kalyanaram and Urban (1992) study taste-related products bought in supermarkets where switching and variety seek-ing are more prevalent than for ethical drugs. Therefore, first purchases andmarket potential are more important for ethical drugs than for consumerpackaged goods. We thank an anonymous reviewer for pointing this out.
tors on the innovative late mover (CJN and Pi^, respectively)are insignificant in both categories. These results reveal aninteresting pattern of competition. The pioneer is advan-taged asymmetrically relative to noninnovative late entrantsbut disadvantaged asymmetrically relative to innovative latemovers.
Implications
These findings suggest new strategies for late entry.Assuming that late entrants cannot affect a pioneer's diffu-sion or marketing effectiveness and that late entrants havelower repeat rates and less effective marketing outlays, fewoptions are available to a late mover. It must identify a supe-rior position, and/or undercut on prices, and/or spend moreon its marketing mix to overcome the disadvantagesimposed by late entry and beat the pioneer at its own game.In doing so, late entrants face a disadvantage. Although theymight gain additional information about the market as theywait to enter, waiting also means that the cost of gainingtrial and sustaining repeat purchases will be higher com-pared with earlier entrants. Even if a late mover achieves thesame level of sales as the pioneer, the late mover's cumula-tive profits might be smaller without the benefit of themonopoly period enjoyed by the pioneer. Despite theseobstacles, some late movers have been successful at beatingthe pioneer at its own game.
Our analysis, however, shows other ways a late mover ad-vantage can be created using a fundamentally different strat-egy. Rather than spending resources on marketing activitiesto beat the pioneer at its own game, a late entrant can devoteits efforts to redefining the game in such a way that benefitsthe late mover and disadvantages the pioneer. This strategyis consistent with the preference formation explanation ofpioneering advantage (Carpenter and Nakamoto 1989), inwhich the pioneer gains a competitive advantage by shiftingpreferences toward itself and becoming associated stronglywith the category. If a late entrant can "restart" the learningprocess, it can redefine the market, become associatedstrongly with the reshaped category, and thus gain an ad-vantage over the pioneer (Carpenter and Nakamoto 1994).Innovation can help reshape a category. In the process, theadvantages of the pioneer become its disadvantages com-pared with the innovative late mover—it is now associatedwith an "old" form of the category and suffers as a result.
Further Research
Our findings suggest interesting directions for furtherresearch. First, it would be useful to generalize our results toother categories in other industries. It is encouraging thatour findings in two product categories provide evidence forthe existence of mechanisms of advantage for innovativelate movers. The generalizability of our results, however, islimited by the fact that both categories are in the same indus-try. Replicating our analysis in other categories from otherindustries would be a useful avenue for further research.Doing so, however, requires data on the sales and marketingefforts of each brand from the start of the category oversome sufficient time span for the pioneer and the innovativeand noninnovative late entrants. The absence of historicaldata limits the number of industries that can be examined.Even so, a replication would be useful.
Second, our brand sales model could be expanded. Ourresearch extends repeat purchase diffusion models with
Late Mover Advantage 67
marketing mix effects by explicitly including differentialcompetitor influences on a brand's diffusion and marketingmix effects. Two directions for future extensions are to in-clude nonconstant market potential and repeat purchaserates. In some markets, market potential and repeat purchasemight vary with the brand's own and competitors' market-ing expenditures or prices. Expanding the sales model tocapture these effects would be helpful methodologically.
Third, our analysis could be used as a basis for optimalentry timing analysis. As noted previously, our analysis sug-gests a trade-off between innovativeness and entry timing.Exploring the optimal implications of our response modelrequires constructing a differential game between entrants inwhich timing and entry strategy are decision variables (forrelated work, see Cohen, Eliashberg, and Ho 1996). To doso, we would need information on product developmentcosts and the cost structure associated with the entry strate-gy. With this additional information, the optimal solutioncan be determined, most likely through numerical analysis.
CONCLUSION
Although late movers outsell pioneers in some markets,the mechanisms through which they do so has received lit-tle attention. Our analysis of 13 brands in two ethical drugmarkets show that innovative late movers outsell pioneersnot by "beating them at their own game" but by affecting thediffusion and marketing spending effectiveness of pioneers.In our sample, innovative late movers grew faster than pio-neers, slowed the growth pioneers, and reduced the effec-tiveness of pioneers' marketing efforts. These advantagesasymmetrically favor innovative late movers. Their diffu-sion reduces the sales of other brands, but their sales are nothurt by the corresponding diffusion of other brands. Thesefindings, combined with our results showing that innovativelate movers enjoy larger market potentials and higher repeatrates than either the pioneer or other late entrants, suggestsignificant new mechanisms for outselling pioneers.
APPENDIX: ALTERNATIVE MODEL
Model Formulation
To ensure that our results are not idiosyncratic to ourmodel specification, we compare our brand sales modelresults with those from an alternative model. Although themodels in the literature listed in Table 1 are related models,their structures are subsets of our model structure. A modi-fied version of Lilien, Rao, and Kalish's (1981) sales modelthat incorporates differential competitive influence on diffu-sion and market effects, however, has a different structureand can serve as an appropriate alternative model for com-parison. This model is
(Al) Si(, + 1) - Si, = (au TMi, + ai2 TM^KNi - Si,)
where
i - Sic)
Ni - Si,),
i, = the total marketing spending of innovative com-petitors of brand i at time t,
t = the total marketing spending of noninnovativecompetitors of brand i at time t,
i, = the sales of innovative competitors of brand i attime t,
t = the sales of noninnovative competitors of brandi at time t,
j = the total number of available adopters duringeach period of brand i.
aji through ai7 are model parameters, and the other terms areas defined previously.
Because Lilien, Rao, and Kalish's (1981) model consid-ers only detailing spending and does not include the differ-ential impact of competitors, we modify their model toinclude total marketing spending and separate terms for theeffects of innovative and noninnovative competitors to en-able comparison with our model.
In this model, we expect the own-marketing mix coeffi-cients ail, ai2 > 0 ^nd the diffusion coefficient ai4 > 0, as pertheir original model. In addition, we expect that the compet-itive coefficients for the pioneer ap3, apg < 0 and ap5, ap7 >0, which is consistent with our predictions on the impact ofinnovative versus noninnovative brands, respectively. Weestimated the alternative model by NLLS.'^
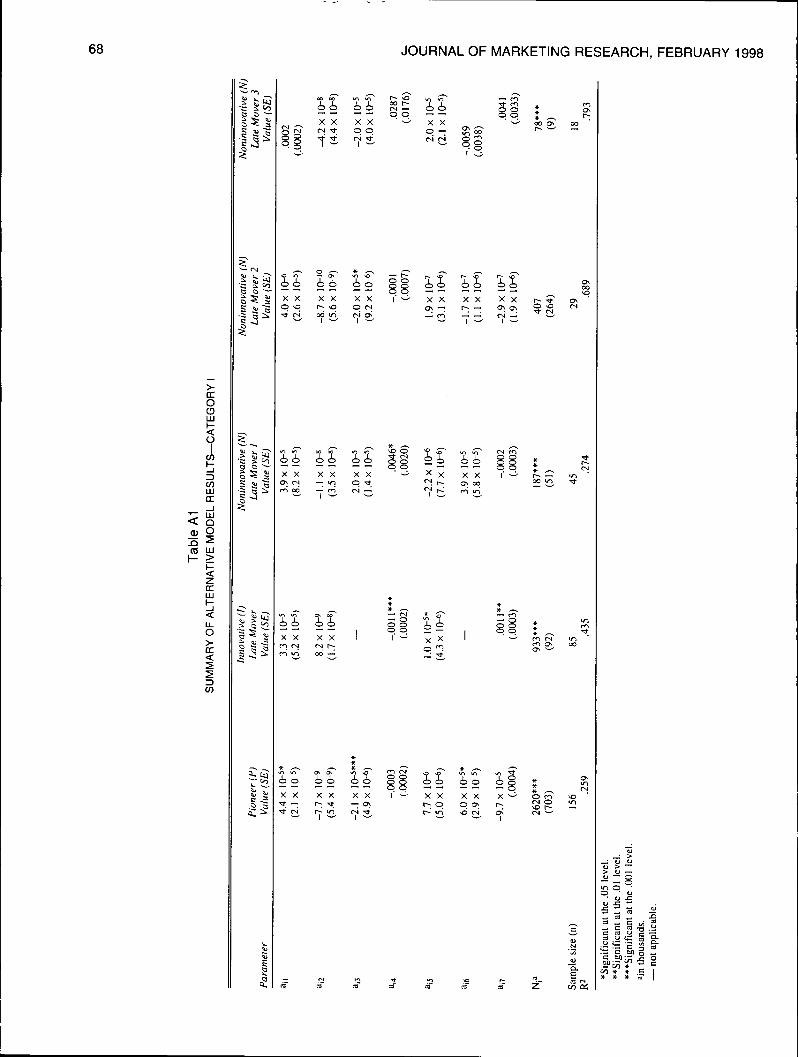
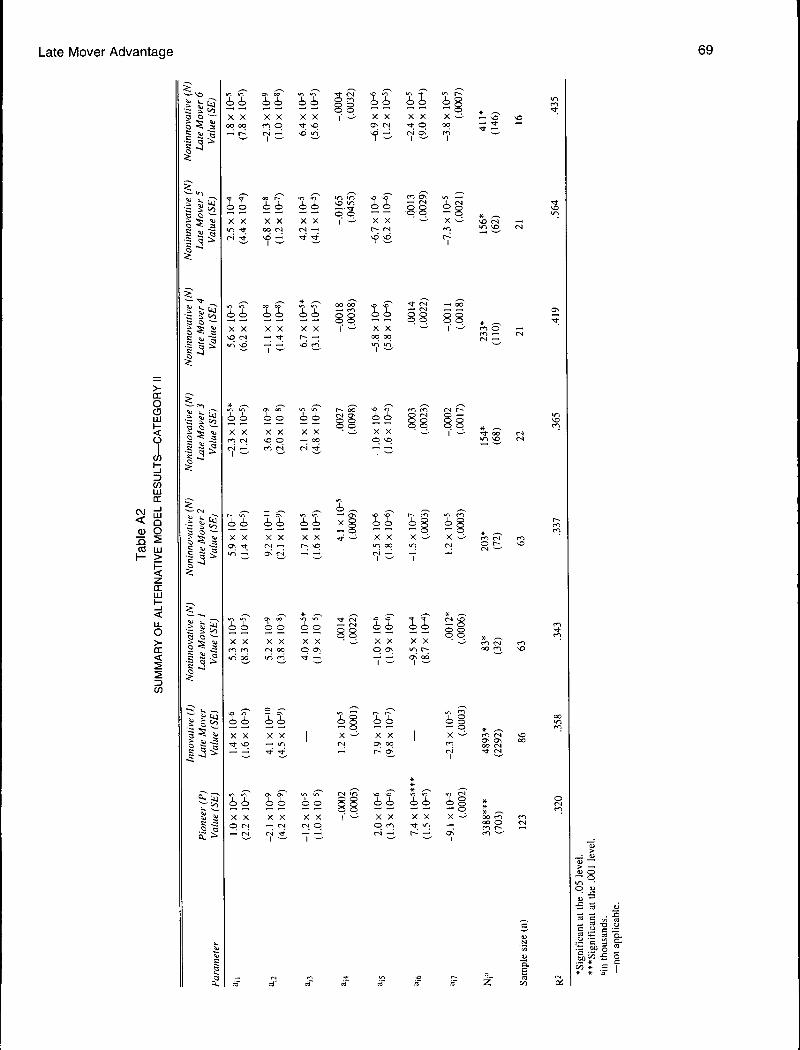
Results
In Tables Al and A2, we present the alternate modelresults for categories I and II, respectively. The modelsseem to fit well overall, but the fit varies from a low R2 of.26 for the pioneer in category 1 to a high R2 of .80 for non-innovative late mover 3 in category 1. Except in four cases,all the parameters, when significant, are in the expecteddirection. In particular, the impact of the innovative latemover on the pioneer can be seen from ap3, which is nega-tive and significant in category I, and from apg, which isnegative and significant in both categories.
We compare our model with the alternate model on threecriteria: degree of fit, proportion of estimates with signs thatdiffer from what industry experts expect, and percentage ofsignificant estimates, as suggested by Hahn and colleagues(1994). Whereas the first criterion is critical from a statisti-cal viewpoint, the last two criteria are important from amanagerial decision-making standpoint. Although the R2values in our model exceed the corresponding R^ values ofthe alternative model, it is not an appropriate criterionbecause the dependent variables are different in the twomodels. The alternative model provided only four signifi-cant parameter estimates with unexpected signs out of a to-tal of 100 estimates (4%), whereas our model had no signif-icant estimates with unexpected signs. Finally, whereas 21%of the parameters produced by the alternative model are sig-nificant and are of the expected sign, 45% of the estimatesof our model are significant with expected signs.
'*We did not consider an alternative two-stage estimation procedure sug-gested by Lilien, Rao, and Kalish (1981), because this procedure assumesown- and competitive-marketing mix effectiveness to be approximatelyequal, whereas our purpose is to investigate asymmetry in competitiveeffects.
68 JOURNAL OF MARKETING RESEARCH, FEBRUARY 1998
(£O
COLU
crT ^ LLJ
^ O
CD LLI
*" Icr
>-cr<
H
5^5?
X Xo o
1^ NO ui i roo 1^ "L llpi — o o
• ^ X Xq —r-i (N
iiX X
O NO
— Ov
ii iX Xp (N
I —'
I O L X X. XI O O O O O
^ XX XXON -^ r-; —
X X
iiX X
iiX X
q ^CS —^
X XO\ oo
XX
od —
s;Xo
:
tn m OS t> "n ^ CO (
O O O O O O O '—' — . . . —• —. — Q ,XX XX XX r
W1 >O
iiXX XXr o o O\
i;X O CO
CN ONO [^
r - q
— 3 ^ XI
^ C 00 o —
Late Mover Advantage 69
tro(5LU
UJQO
J3
EC
2CO
1^
X Xoq oo
ilX X
66X Xs o CN
6 6
6 6XX
CO p
i6X XOC) rJ
id
66X X
L L so "no o . . . • . < ^— — o oXX r o
66X X
so en
X X XX
CS ^
66 ^i iiXX XX XXON ^ c^ ~" r~ " ^»n — ON <N — —
66 66 66 ^:XX
CN oo
•£> '^ <n '
66 6.
66 66 66X
—1
XCN
X(N
T
Xp
X XOS CN
sn —
11 Si• ^ X X
oo oo
IIX Xo so
IIX Xin ooCN —^
IIX XO OS
6 6X_^
-—X 1>n
s-0
——X
( N
8O• ^
6X
O N
6——XOO
IIX Xp rnCN —
X X^ pCS ON
-iX O
^ ^ C* Ov in ^^
^1 88 ^8XX ' ^ X O
— oo
88
p '
ll S
66 6;
en om —'CN —'
Cli
3 S , -g
70 JOURNAL OF MARKETING RESEARCH, FEBRUARY 1998
Although the alternative model provided results in theright direction, we select our model over the alternativemodel from the standpoint of testing our hypotheses because(1) our model formulation decomposes sales into first andrepeat purchases, which enables us to compute the repeatpurchase rate, (2) it readily provides estimates of parametersdetermining competitive advantage, such as market poten-tial and repeat rate, and (3) the estimates are consistent withthe expectation of industry experts.
REFERENCES
Banbury, C. M. and W. Mitchell (1995), "The Effect of Introduc-ing Important Incremental Innovations on Market Share andBusiness SuTv\va.l" Strategic Management Journal, 16, 161-82.
Bass, F. M. (1969), "A New Product Growth Model for ConsumerDurables," Management Science, 15, 215-27.
, T. V. Krishnan, and D. C. Jain (1994), "Why the BassModel Fits Without Decision Variables," Marketing Science, 13(3), 203-23.
Bemdt, E. R., L. Bui, D. Reiley, and G. L. Urban (1995), "Infor-mation Marketing and Pricing in the U.S. Anti-Ulcer Drug Mar-ket," American Economic Review, Papers and Proceedings, 85(2), 100-105.
Bowman, Douglas and Hubert Gatignon (1996), "Order of Entry asa Moderator of the Effect of Marketing Mix on Market Share,"Marketing Science, 15 (3), 222-42.
Carpenter, Gregory S., L. G. Cooper, D. M. Hanssens, and D. F.Midgley, (1988), "Modeling Asymmetric Competition," Mar-keting Science, 7 (Fall), 393-412.
, D. R. Lehmann, K. Nakamoto, and S. Walchli (1997), "Pi-oneering Disadvantage: Consumer Response to DifferentiatedEntry and Defensive Imitation," working paper. NorthwesternUniversity.
• and Kent Nakamoto (1989), "Consumer Preference For-mation and Pioneering Advantage," Journal of Marketing Re-search, 26 (August), 285-98.
and (1990), "Competitive Strategies for Late Entryinto a Market with a Dominant Brand," Management Science,36 (October), 1268-78.
and (1994), "Reflections on 'Consumer PreferenceFormation and Pioneering Advantage,'" Journal of MarketingResearch, 39 (November), 570-73.
and (1996), "Impact of Consumer Preference For-mation on Marketing Objectives and Competitive SecondMover Strategies," Journal of Consumer Psychology, 5 (4),325-58.
and M. Sawhney (1996), "Multi-Generation New ProductStrategy: The Role of Consumer Learning in Evolving Mar-kets," working paper. Marketing Department, NorthwesternUniversity.
Chatterjee, R. and J. Eliashberg (1990), "Innovation DiffusionProcess in a Heterogeneous Population: A Micromodeling Ap-proach," Management Science, 36 (9), 1057-79.
Cohen, Morris, Jehoshua Eliashberg, and Teck-Hua Ho (1996),"New Product Development: The Performance and Time-to-Market Tradeoff," Management Science, 42 (February), 173-86.
Gatignon, Hubert, E. Anderson, and K. Helsen (1989), "Competi-tive Reactions to Market Entries: Explaining Interfirm Differ-ences," Journal of Marketing Research, 21 (November), 387-98.
, Barton Weitz, and Pradeep Bansal (1990), "Brand Intro-duction Strategies and Competitive Environment," Journal ofMarketing Research, 27 (November), 390-401.
Golder, Peter and Gerard Tellis (1993), "Pioneering Advantage:Marketing Logic or Marketing Legend," Journal of MarketingResearch, 30 (May), 158-70.
Hahn, M., S. Park, L. Krishnamurthi, and A. Zoltners (1994),"Analysis of New Product Diffusion Using a Four-SegmentTrial-Repeat Model," Marketing Science, 13 (3), 224-47.
Jain, Dipak and Ram C. Rao (1990), "Effect of Price on the De-mand for Durables: Modeling, Estimation, and Findings," Jour-nal of Business & Economic Statistics, 8, 163-70.
Judge, George G., W. E. Griffiths, R. Carter Hill, H. Lutkepohl,and Tsoung-Chao Lee (1985), The Theory and Practice ofEconometrics, 2d ed. New York: John Wiley & Sons.
Kalish, Shiomo (1983), "Monopolistic Pricing with Dynamic De-mand Production Cost," Marketing Science, 2 (2), 135-60.
(1985), "A New Product Adoption Model with Price, Ad-vertising and Uncertainty," Management Science, 31 (Decem-ber), 1569-85.
and Gary Lilien (1986a), "A Market Entry Timing Modelfor New Technologies," Management Science, 32 (February),194-205.
and (1986b) "Application of Innovation DiffusionModels in Marketing," in Innovation Diffusion Models in Mar-keting, Vijay Mahajan and Jerry Wind, eds. Cambridge, MA:Ballinger.
Kalyanaram, Gurumurthy and Glen L. Urban (1992), "DynamicEffects of the Order of Entry on Market Share, Trial Penetration,and Repeat Purchases for Frequently Purchased ConsumerGoods," Marketing Science, 11, (Summer), 235-50.
Lane, W. J. (1980), "Product Differentiation in a Market with En-dogeneous Sequential Entry," Belt Journal of Economics, 11(Spring), 237-60.
Lieberman, Marvin B. and David B. Montgomery (1988), "First-Mover Advantages," Strategic Management Journal, 9, 41-58.
Lilien, G., A. Rao, and S. Kalish (1981), "Bayesian Estimation andControl of Detailing Effort in a Repeat Purchase Diffusion En-vironment," Management Science, 27 (May), 493-506.
and Eunsang Yoon (1990), "The Timing of CompetitiveMarket Entry: An Exploratory Study of New Industrial Prod-ucts," Management Science, 36 (5), 568-85.
Mahajan, Vijay, S. Sharma, and R. Buzzell (1993), "Assessing theImpact of Competitive Entry on Market Expansion and Incum-bent Sales," Journal of Marketing, 57 (July), 39-52.
Parker, Philip and Hubert Gatignon (1994), "Specifying Competi-tive Effects in Diffusion Models: An Empirical Analysis," In-ternational Journal of Research in Marketing, 11, 17-39.
and (1996), "Order-of-Entry, Trial Diffusion, andElasticity Dynamics: An Empirical Case," Marketing Letters, 7(January), 95-109.
Peterson, Robert A. and Vijay Mahajan (1978), "MultiproductGrowth Models," in Research in Marketing, J. Sheth, ed. Green-wich, CT: JAI Press, 201-31.
Robinson, William T. (1988), "Sources of Market Pioneer Advan-tages: The Case of Industrial Goods Industries," Journal of Mar-keting Research, 25 (1), 87-94.
and Claes Fomell (1985), "Sources of Market Pioneer Ad-vantages in Consumer Goods Industries," Journal of MarketingResearch, 22 (August), 305-17.
Rogers, E. M. (1995), Diffusion of Innovations, 4th ed. New York:The Free Press.
Schmalensee, Richard (1987), "Standards for Dominant Firm Con-duct: What Can Economics Contribute?" in The Economics ofMarket Dominance, D. Hay and J. Vickers, eds. New York:Basil Blackwell, 61-88.
Shankar, Venkatesh (1997), "Pioneers' Marketing Mix Reactionsto Entry in Different Competitive Game Structures: TheoreticalAnalysis and Empirical Illustration," Marketing Science, 16 (3),271-93.
Srinivasan. V. and C. Mason (1986), "Nonlinear Least Squares Es-timation of New Product Diffusion Models," Marketing Science,5 (2), 169-78.
Urban, G. L., T. Carter, S. Gaskin, and Z. Mucha (1986), "MarketShare Rewards to Pioneering Brands: An Empirical Analysis ofStrategic Implications," Management Science, 32 (June), 645-59.
Yip, George (1982), Barriers to Entry. Lexington, MA: LexingtonBooks.