laser induced fluorescence measurement of ion velocities ...peplweb/pdf/aiaa-99-2424_lif.pdf ·...
TRANSCRIPT
AIAA 99–2424Laser Induced FluorescenceMeasurement of Ion Velocities in thePlume of a Hall Effect ThrusterGeorge J. Williams, Jr., Timothy B. Smith,Frank S. Gulczinski, III, Brian E. Beal,Alec D. Gallimore, and R. Paul Drake
University of Michigan, Ann Arbor, MI 48109
35th AIAA/ASME/SAE/ASEE JointPropulsion Conference and Exhibit20–23 June 1999/Los Angeles, CA
For permission to copy or republish, contact the American Institute of Aeronautics and Astronautics1801 Alexander Bell Drive, Suite 500, Reston, VA 20191–4344
Laser Induced Fluorescence Measurement of
Ion Velocities in the Plume of a Hall E�ect
Thruster
George J. Williams, Jr.,� Timothy B. Smith,�
Frank S. Gulczinski, III,� Brian E. Beal,y
Alec D. Gallimore,z and R. Paul Drakex
University of Michigan, Ann Arbor, MI 48109
Laser induced uorescence (LIF) was used to measure the mean and variance of thevelocity distribution of xenon ions in the plume of the P5 Hall thruster. The data indicatean acceleration region extending several centimeters downstream of the exit plane. Signif-icant plume divergence and spreads in velocities equivalent to about 1 eV were observed.Speeds measured correspond to ion energies smaller than those measured with molecularbeam spectroscopy at similar points of interrogation in the plume. LIF measurementstaken 10 to 50 cm downstream indicate that the \spike" observed in the plume is a regionof interaction caused by inward divergence from the discharge annulus.
A Nuclear magnetic dipole interaction constantB Nuclear electric quadrapole interaction constantc Light speed, 2:9979� 108 m/sE Term energy, JF Total angular momentum quantum numberg(�) Thermally-broadened lineshapeh Planck constant, 6:6261� 10�34 J-sI Nuclear spin quantum numberIsp Speci�c impulse, sJ Electronic angular momentum quantum numberk Boltzmann constant, J/KM Ion mass, kgT Temperature, Kv Velocity component, m/s� Downstream beam angle from vertical, deg� Lateral beam angle from vertical, deg� Frequency, Hz
Subscripts
A AxialD Downstreamhfs Hyper�ne structureis Isotopic structureO O�-axiso Line centerR Radial
�Graduate Student, Student Member, AIAA.yUndergraduate Student, Student Member, AIAA.zAssociate Professor and director of lab, Associate Fellow
AIAA.xProfessor.
Copyright c 1999 by George J. Williams, Jr.. Published bythe American Institute of Aeronautics and Astronautics, Inc. withpermission.
Introduction
ELECTRIC propulsion devices such as ion enginesand Hall thrusters are emerging as replacements
for chemical rockets on satellites and planetary probes;their higher speci�c impulse allows them to use sig-ni�cantly less propellant. Accurate measurements ofthruster performance and predictions of spacecraftcontamination are crucial for their application.The ion energy distributions in the plumes of Hall
thrusters have been the object of extensive diag-nostic investigations. Retarding potential analyzers(RPAs),1 laser induced uorescence (LIF),2 molecularbeammass spectroscopy (MBMS)1,3 and various otherprobes4 have been used to evaluate the performanceof thrusters and their integration on spacecraft. How-ever, probes may perturb the plasma, yielding datathat are not representative of the actual thruster per-formance.Di�erences in these measurements may be due to
the accuracy of the measurement, to di�erences in theion energy characteristics at di�erent downstream po-sitions in the plume, or to a combination of these andother factors.LIF measurements were performed from 0.01 to 0.5
m downstream of the exit plane of a Hall thruster togenerate near-�eld and some far-�eld data to compareto probe (MBMS) data. All experiments were per-formed in the large vacuum test facility (LVTF) at thePlasmadynamics and Electric Propulsion Laboratory(PEPL) at the University of Michigan.
TheoryLaser Induced Fluorescence
Laser induced uorescence (LIF) is the incoherentemission of photons from an unstable energy level
1 of 11
American Institute of Aeronautics and Astronautics Paper 99{2424

(electronic in the case of xenon or other monatomics)populated by the absorption of photons from the laser.In general, the wavelengths (i.e., energies) of the ab-sorbed and emitted photons are di�erent. Indeed,emission may occur at many di�erent wavelengths.The absorbing singly ionized xenon, Xe II, will \see"
the wavelength of the incoming photons shifted by therelative motion of the ion in the direction of the pho-ton. This Doppler e�ect is observed as a shift in theresonant wavelength as the laser is scanned over a veryshort range. The change in photon frequency 4� is
4� = �ovi=c = vi=c (1)
Xe II has natural absorption/emission transitionsthroughout the visible spectrum. The 5d4D � 6p4P 0
(605.28 nm) Xe II transition was selected to stimulatethe emission. The 6s4P � 5p4P 0 (529 nm) emission isstrongest for this upper state and was selected to becollected.Both two-beam and three-beam con�gurations in-
terrogated the plasma. Two beams permitted simul-taneous measurements of azimuthal and axial velocitycomponents.5 Three beams yielded simultaneous az-imuthal, axial, and radial velocity components.The beams were split just downstream of the dye
laser, as shown in Fig. 1. The beams entered thechamber parallel to each other, were re ected down-ward and passed through a focusing lens, crossing atthe focal point of the lens{the LIF interrogation point.The lens also reduced the beam diameters (which hadgrown over the 12 m path length) to less than 0.1 cm.
1
2
3
4
6
5
toLVTF
7
8to A-D
system
Index:1. Argon-ion laser2. Dye laser3. Wavemeter4. Chopper5. Opto-galvanic cell6. Monochromator7. I-V op amp circuit8. Lock-in amplifier
Fig. 1 Laser division and modulation.
The beam passing through the focusing lens centerremained perpendicular to the axis of the thruster, di-rectly measuring the azimuthal component of velocity,and is referred to below as the \vertical" beam. Asecond beam, referred to as the \downstream" beam,entered the focusing lens downstream from the lenscenter, measuring the velocity at an angle � from ver-tical and perpendicular to the thruster face. The third
beam, the \lateral," entered the focusing lens at thethird vertex of a right triangle, measures the velocityat an angle � from vertical and parallel to the thrusterface. Figure 2 shows the relationships between mea-sured and calculated velocities.
V
V
V
αβ
α
β
Azimuthal
Vertical Beam Lateral Beam
Downstream Beam
Radial
Axial
X
Y
Z
Thrus te r
Fig. 2 Measured and calculated velocities.
The axial velocity component vA can be deducedfrom the vertical velocity vV and the downstream ve-locity vD by
vA =vD � vV cos�
sin�(2)
Similarly, the lateral velocity vL and vV yield the ra-dial velocity
vR =vL � vV cos �
sin �(3)
Assuming statistical independence of the temperatures(distributions) associated with each velocity compo-nent, the true axial temperature, TA, can be calcu-lated given the \temperatures" in the radial, TR, ando�-axis, TO , directions. This assumption yields an el-liptical relationship:
cos2(�=2� �) + (TV =TA)2 sin2(�=2� �) = (TV =TO)
2
(4)Solving for the axial temperature yields
TA = TV
�(TV =TO)
2 � 1
cos2�+ 1
��1=2(5)
Similarly, TR is a function of TL, TV , and �:
TR = TV
�(TV =TL)
2 � 1
cos2 �+ 1
��1=2(6)
Fluorescence Lineshape Model
There are nine stable isotopes of xenon, seven ofwhich have natural abundances greater than one per-cent. Each of these isotopes has a slightly di�erentterm energy at a given energy level. This energy dif-ference results in isotopic splitting.The two isotopes with an odd atomic mass, 129Xe
and 131Xe, have a non-zero nuclear spin quantum num-ber I, resulting in hyper�ne splitting of the atomicenergy levels. This hyper�ne structure (hfs) is consid-erably broader than the isotopic structure, and pro-vides most of this transition's characteristic shape.
2 of 11
American Institute of Aeronautics and Astronautics Paper 99{2424

The lighter isotope, 129Xe, has I = 1=2, while 131Xehas I = 7=2. The total angular momentum quantumnumber F takes values
F = I + J; I + J � 1; : : : ; jI � J j (7)
where J is the total electronic angular momentum.6
Figure 3 shows the hyper�ne splitting and allowedtransitions for the 4P5=2 �
4 D7=2 line.
0
80,000
90,000
100,000
110,000
E (1/cm)
5p P
6s[2] ( P )
6p[2] ( P )
5d[3] ( D )
6051Å5252 Å
(a) LIF fine structure (b) Hyperfine structure of Xe II 6051 Å absorption line
129 Xe 131 XeI = 3/2 I = 7/2
F' = 23
F = 3
4J = 5/2
J = 7/2
1 = F'23
4
2 = F3
4
5
Fig. 3 Hyper�ne structure of Xe II.
The extra term energy due to hfs is given by
Ehfs = AC
2+B
(3C=4)(C + 1) � I(I + 1)J(J + 1)
2I(2I � 1)J(2J � 1)(8)
where A is the nuclear magnetic dipole interaction con-stant, B is the nuclear electric quadrapole interactionconstant and
C = F (F + 1)� I(I + 1)� J(J + 1) (9)
The transition rule for hyper�ne splitting is of a famil-iar form, 4F = 0;�1 where F = 0 ! F 0 = 0. Therelative intensity of each hyper�ne component is givenfor a J ! J � 1 transition by7
I(F ! F � 1) /P (F )P (F � 1)
F(10)
I(F ! F ) /(2F + 1)
F (F + 1)P (F )Q(F ) (11)
I(F � 1! F ) /Q(F )Q(F � 1)
F(12)
where P (F ) = (F + J)(F + J + 1) � I(I + 1) andQ(F ) = I(I + 1)� (F � J)(F � J + 1).This model uses published isotopic shifts and hyper-
�ne structure constants for the Xe II 4P5=2 and4D7=2
energy levels.8
To properly model line broadening, we would nor-mally convolve instrument and thermal broadeninginto a Voigt pro�le.9 In classical emission and absorp-tion spectroscopy, the relevant Lorentzian linewidthbelongs to the monochromator; for LIF, though, themonochromator remains at a constant setting, sim-ply acting as a line �lter, and the relevant Lorentzianlinewidth belongs to the laser.For plasmas at or above room temperature, the
laser linewidth �L � 1 MHz is much smaller than the
Doppler broadening �D , and the Voigt pro�le simpli-�es to a purely thermally-broadened lineshape
g(�) =1
�o
� ��
�1=2exp
��
�� � �o�o
�2!(13)
where � = Mc2=2kT .For the isotopes with even mass numbers (i.e., with-
out hfs), the line intensity is linearly proportional tothe naturally-occurring abundance for each isotope.For 129Xe and 131Xe, the line intensity is linearly pro-portional to the product of the isotopic abundanceand the relative intensity of the hyper�ne components.Thus, the signal resulting from scanning the laser overthe absorption wavelength range is the sum of N = 17lines,
S(�) = C
NXi=1
pigi(�) (14)
where pi is the intensity for each line i, gi(�) isthe shape function given above and C is a constantrepresenting a whole series of unknowns, includingplasma density, collection solid angle, monochromatorthroughput, photomultiplier tube e�ciency, outputcurrent-to-voltage ampli�cation and analog-to-digitalconverter range. The center for each line is
�i = [(E+Ehfs+Eis)0� (E+Ehfs +Eis)
00]=h; (15)
where Ehfs is the hyper�ne term energy and Eis is theisotopic shift.8
By varying the temperature T and frequency shiftwith respect to a stationary reference plasma4�, themodeled signal can provide a good �t to the data. AnIDL code implementing this model was developed, us-ing a Davidson-Fletcher-Powell optimization routineto provide a replicable \best-�t."
Apparatus and ProcedureThruster
The University of Michigan, in conjunction with theUnited States Air Force, has developed a 5 kW classHall thruster, the P5, for basic research purposes. Aphotograph of the thruster is given in Fig. 4. Thisthruster underwent performance and probe testing10
that indicated it operated at performance levels and ina manner consistent with thrusters under commercialdevelopment.11{13
Thruster power was provided by laboratory powersupplies. The main discharge was supplied by aSorensen Model DCR 600-16T. The electromagnetswere powered separately, the inner by a Kikusui ModelPAD 55-10L and the outer by a Kikusui Model PAD35-10L. The cathode heater was a Sorensen ModelDCS 55-55, and the igniter was a custom-built high-voltage ignition supply. The thruster discharge circuitwas electrically isolated during operations. A �lter
3 of 11
American Institute of Aeronautics and Astronautics Paper 99{2424

Fig. 4 Photograph of the P5 Hall e�ect thruster.
consisting of 1.3 equivalent resistance in series withthe discharge current and a 95 �F capacitor in parallelwas used to damp out thruster oscillations.The annular discharge channel is 2.5 cm wide and
is on a 7.4 cm radius. The cathode was mounted atroughly 45 degrees from vertical to facilitate LIF. TheP5 was interrogated at 0, �0.5 and �1.0 cm from thecenter of the discharge channel. The P5 was movedaxially to enable interrogation from 0.1 to 50 cm. Ta-ble 1 gives the thruster operating conditions used inthis study.
Facility
Tests were performed in the 6 m x 9 m LVTF. Thisis the same facility used in previous work at PEPL, butprior to these tests, it was re�tted with four CVI ModelTM-1200 Re-Entrant Cryopumps, each of which is sur-rounded by a liquid nitrogen ba�e. These cryopumpsprovide a xenon pumping speed measured at 140,000l/s with a base pressure of less than 2�10�7 Torr. Pro-pellant ow was controlled by two MKS Model 1100Flow Controllers.
The P5 was positioned on a probe table, which al-lowed two degrees of freedom over about a meter ineach direction. The two translation stages were con-trolled and monitored via a computer. Resolution wason the order of 0.025 cm for both stages.
Laser and Optics
An argon-ion pumped Coherent dye laser (899-29model) was used with Rhodamine-6G dye. Typicalpower was 0.25 W at 605 nm. The laser wavelengthwas scanned over a 0.01 to 0.04 nm range (10 to 30GHz) in 0.061 pm (50 MHz) increments. The scanningand the synchronized data collection were computercontrolled.
Because of the large natural uorescence at 529 nm,the laser beams were chopped to phase lock the laserinduced uorescence. In order to distinguish veloc-ity components, the downstream, vertical, and lat-eral beams were chopped at 1300 Hz, 1000 Hz, and880 Hz respectively. About 10 percent of the lat-eral beam was split o� downstream of the chopperand passed through the center of a hollow cathodein a Hamamatsu opto-galvanic cell with Xe and Negases. The voltage applied across the opto-galvaniccell determined the plasma density and temperature:330 V gave a strong Xe II signal. A Chromex 0.5m monochromator with a Hamamatsu 928 photo-multiplier tube (PMT) collected the uorescence.The laser and optics shown schematically in Fig. 1
are located in a controlled atmosphere/low-dust enclo-sure. The beams are delivered to the LVTF and thento the thruster as shown in Fig. 5. The mirrors and fo-cusing lens were protected from sputtering depositionand erosion by an enclosure with anti-re ection coatedwindows, while the collection lens was protected bytwo separate anti-re ection coated windows. The u-orescence from the thruster plume was collected by a500M Spex monochromator with a Hamamatsu 928PMT.Operational ampli�er circuits converted the PMT
current signals to voltage signals. Lock-in ampli�ersthen isolated the uorescence components of thesesignals. The Coherent 899-29 Autoscan software col-lected and matched the laser frequency to these sig-nals.Laser alignment was facilitated by a 0.1 cm diame-
ter steel wire centered on the downstream face of thethruster. The wire was roughly 7.4 cm from the centerof the discharge annulus. The laser beam focal vol-umes were overlaid on the wire. The locations of thelaser spots were measured at two locations below thefocusing lens, yielding accurate values for the angles �and �.Each data collection point required four steps:
1. move the thruster to establish the point of inter-rogation
2. set the laser wavelength to the upper edge of thescan range,
3. take a computer-controlled scan of the threethruster LIF signals over a period of several min-utes, and
4. take a second, shorter scan of the reference cellsignal.
Results
The LIF signal strength was optimized at mostpoints of interrogation. A record of the ampli�ersettings provided a rough indication of the relative
4 of 11
American Institute of Aeronautics and Astronautics Paper 99{2424

Table 1 P5 operating conditions.
Disc. Disc. Discharge Cathode FacilityVoltage Current Flow Rate Flow Rate Pressure
Condition (V) (A) (sccm) (sccm) (10�6 Torr)1.5 kW 300 5.3 60.0 6.0 5.52.5 kW 500 5.3 60.0 6.0 5.53.0 kW 300 10.4 114 6.0 8.5
Beams fromlaser room
Focusing lens
Collection lensP5
Collimated fluorescence
Fig. 5 Laser beam delivery and uorescence optics schematic.
plasma densities. At the exit of the thruster, the densi-ties were highest in the center of the discharge channel.The density peak shifted to the inner edge of the chan-nel at 10 cm.
Periodically, a polarizer was used to vary the powerof the laser beam upstream of the �rst beam splitteras a check for saturation and power broadening. Nosaturation or power broadening was observed.
Near-�eld
Two sets of near-�eld data were taken during 1.5kW operation. Two-beam data were collected at 0.1,0.65, 1.0 and 10. cm. Three-beam data were takenat 0.5, 1.0 and 10. cm. Di�erences in the data at 1.0and 10. cm were used to estimate the uncertainty inthe measurements of velocity and temperature. Thisanalysis indicated a ten percent error in velocity anda twenty percent error in temperature. The referencecell removed wavelength-related uncertainty, and theangles of the interrogating beams were measured towithin one percent. The most likely source of error wasthe curve �tting used in the data reduction, which isfairly sensitive to noise in the recorded spectral lines.The uncertainties are re ected by error bars in thedata presentation below. Data were also taken over
the same matrix at the 3 kW operating condition, butonly at 1 cm during 2.5 kW operation.
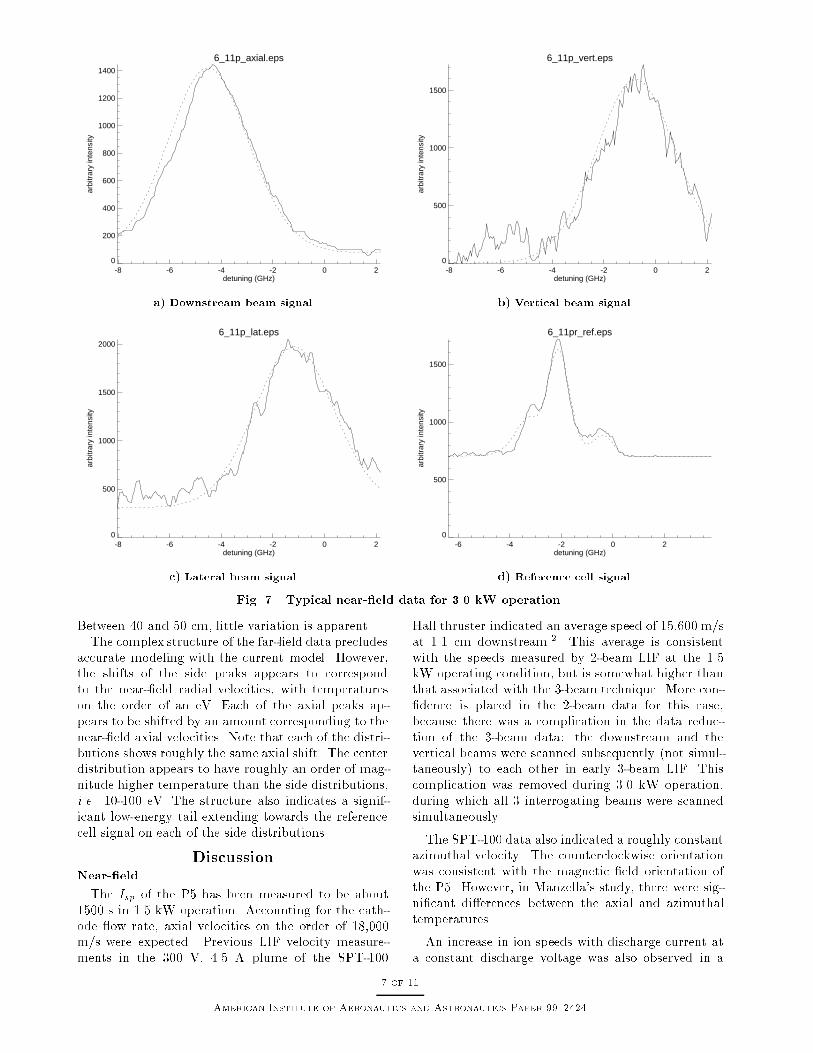
Figures 6 and 7 show typical sets of near-�eld datafor 1.5 kW and 3 kW operation. These �gures showtrends typical of all near-�eld data. Note that the datais presented in terms of detuning frequency, facilitatingthe use of Eqn. 1. A negative frequency shift impliesa Doppler shift in the opposite direction to the laser;i.e, downstream for the axial component, inwards forthe radial component, and upwards for the azimuthalcomponent. Fits used to �nd the Doppler shift and thetemperature of each component are given as dottedlines.
Figure 8 shows the axial velocity pro�les for the 1.5kW case. The velocities are fairly uniform across thedischarge, and there is a distinct acceleration of theions over the �rst 10 cm. Speeds increase on averagefrom 11000 m/s at 0.1 cm to 16000 m/s at 10 cm.This is shown more clearly in Fig. 9, which shows thesame data in terms of energy. Note that the energiesare signi�cantly below the discharge voltage (300 V).The axial velocity increased towards the center of thethruster in 2.5 kW operation. The speeds varied from19,200 m/s to 24,000 m/s.
Figures 10 and 11 show similar trends in axial ve-
5 of 11
American Institute of Aeronautics and Astronautics Paper 99{2424

6_6ix2_ax.eps
-8 -6 -4 -2 0detuning (GHz)
0
500
1000
1500
2000
2500ar
bitr
ary
inte
nsity
a) Downstream beam signal.
6_6iv2_vert.eps
-8 -6 -4 -2 0detuning (GHz)
0
200
400
600
800
arbi
trar
y in
tens
ity
b) Vertical beam signal.
6_6iv2_lat.eps
-8 -6 -4 -2 0detuning (GHz)
0
500
1000
1500
2000
arbi
trar
y in
tens
ity
c) Lateral beam signal.
6_6iv2_ref.eps
-8 -6 -4 -2 0detuning (GHz)
0
200
400
600
800
1000
arbi
trar
y in
tens
ity
d) Reference cell signal.
Fig. 6 Typical near-�eld data for 1.5 kW operation.
locity and axial energy for the 3 kW case. Note thatthe speeds are slightly higher in the 3 kW case. Onaverage, the speed increases from 13000 m/s to 17000m/s. The increase may result from an increase in thecurrent to the inner magnet from 3 A to 4 A.
Figures 12 and 13 show radial velocity pro�les forthe 1.5 and 3.0 kW cases. Note that the radial veloc-ity increased with increasing power. Positive velocitiesare towards the thruster centerline. As might be ex-pected, the divergence is greater near the sides of thechannel and minimized along its centerline; however,the velocities are largely independent of axial position.Figures 14 and 15 give vector plots of the in-plane ve-locities of the ions emitted in the 1.5 and 3.0 kW casesrespectively.
Figures 16 and 17 show the temperatures associatedwith the axial velocities. There was a slight increasein temperature with axial position. All three velocitycomponents had similar temperatures at a given pointof interrogation. The temperatures generally fell in the1 to 2 eV range. The temperatures observed during 2.5
kW operation were comparable.
The azimuthal velocity appeared to be roughly in-dependent of position. The azimuthal velocities wereroughly 750 m/s for the 1.5 kW case and 1100 m/s at3.0 kW. The rotation was clockwise in both cases.
Far-�eld
Data were also taken along the centerline of thethruster 10, 20, 30, 40, and 50 cm downstream. Strong uorescence was detected at each of these locations,but the signal at 10 cm was the weakest. The rangeof axial locations was limited to within 50 cm by theexperimental setup. These data were taken with onlytwo beams: downstream and vertical.
Figure 18 shows the data taken at the various ax-ial positions. Note that at 20 cm (Fig. 18a) thereare three distinct populations: one shifted well abovethe reference datum, one below, and a third (muchweaker) population shifted slightly above the datum.As the axial distance increases, the side peaks tend tomerge towards the center. The center distribution issimultaneously narrowing and increasing in intensity.
6 of 11
American Institute of Aeronautics and Astronautics Paper 99{2424
6_11p_axial.eps
-8 -6 -4 -2 0 2detuning (GHz)
0
200
400
600
800
1000
1200
1400
arbi
trar
y in
tens
ity
a) Downstream beam signal.
6_11p_vert.eps
-8 -6 -4 -2 0 2detuning (GHz)
0
500
1000
1500
arbi
trar
y in
tens
ity
b) Vertical beam signal.
6_11p_lat.eps
-8 -6 -4 -2 0 2detuning (GHz)
0
500
1000
1500
2000
arbi
trar
y in
tens
ity
c) Lateral beam signal.
6_11pr_ref.eps
-6 -4 -2 0 2detuning (GHz)
0
500
1000
1500
arbi
trar
y in
tens
ity
d) Reference cell signal.
Fig. 7 Typical near-�eld data for 3.0 kW operation.
Between 40 and 50 cm, little variation is apparent.The complex structure of the far-�eld data precludes
accurate modeling with the current model. However,the shifts of the side peaks appears to correspondto the near-�eld radial velocities, with temperatureson the order of an eV. Each of the axial peaks ap-pears to be shifted by an amount corresponding to thenear-�eld axial velocities. Note that each of the distri-butions shows roughly the same axial shift. The centerdistribution appears to have roughly an order of mag-nitude higher temperature than the side distributions,i.e. 10-100 eV. The structure also indicates a signif-icant low-energy tail extending towards the referencecell signal on each of the side distributions.
DiscussionNear-�eld
The Isp of the P5 has been measured to be about1500 s in 1.5 kW operation. Accounting for the cath-ode ow rate, axial velocities on the order of 18,000m/s were expected. Previous LIF velocity measure-ments in the 300 V, 4.5 A plume of the SPT-100
Hall thruster indicated an average speed of 15,600 m/sat 1.1 cm downstream.2 This average is consistentwith the speeds measured by 2-beam LIF at the 1.5kW operating condition, but is somewhat higher thanthat associated with the 3-beam technique. More con-�dence is placed in the 2-beam data for this case,because there was a complication in the data reduc-tion of the 3-beam data: the downstream and thevertical beams were scanned subsequently (not simul-taneously) to each other in early 3-beam LIF. Thiscomplication was removed during 3.0 kW operation,during which all 3 interrogating beams were scannedsimultaneously.
The SPT-100 data also indicated a roughly constantazimuthal velocity. The counterclockwise orientationwas consistent with the magnetic �eld orientation ofthe P5. However, in Manzella's study, there were sig-ni�cant di�erences between the axial and azimuthaltemperatures.
An increase in ion speeds with discharge current ata constant discharge voltage was also observed in a
7 of 11
American Institute of Aeronautics and Astronautics Paper 99{2424

Stanford, low-power Hall thruster operation.14 Theacceleration region, however, appeared to have roughlya 100 V potential fall in both 1.5 kW and 3.0 kWoperation.Figure 19 shows an MBMS energy spectrum taken
10 cm downstream of the center of the discharge chan-nel during 1.5 kW operation.3 The peak energy wasmeasured at 260 V with respect to ground. Note thatthere was also a weaker (1:8) peak at 350 V. The peakenergy measured by LIF was about 210 V (roughly 230V with respect to ground). No second distribution wasdetected, but the data is su�ciently noisy that a muchweaker signal is not precluded at velocities roughly cor-responding to 350 V. This second distribution wouldappear in the high energy wing of the data shown inFig. 6. The temperature from the LIF scan is muchnarrower than that from the MBMS data. The reasonfor this is unclear, but may be due to the divergenceof the beam or the presence of multiply charged xenonions. Both would broaden the MBMS data.The axial temperatures and azimuthal velocities in
this study are in good agreement with near-�eld LIFon another Hall thruster.1 However, in that study thetemperatures varied signi�cantly between axial and az-imuthal components.The presence of an acceleration region downstream
of the thruster agrees with previous LIF data14 andwith recent probe measurements.15 This region ap-pears to extend beyond 10 cm from the exit plane.
6 10 3
8 103
1 104
1.2 10 4
1.4 10 4
1.6 10 4
1.8 104
2 10 4
-15 -10 -5 0 5 10 15
0.1 cm0.5 mm
0.65 cm1.0 cm
10.0 cm
Axi
al V
eloc
ity (
m/s
)
Distance from the center of the discharge channel (mm)
Distance downstream of the exit plane
Fig. 8 Axial velocity pro�les for 1.5 kW operation.
Far-�eld
The crossing of the radial components along thecenterline of the thruster appears to build the spikeobserved during operation. Whether the ions are ac-tually colliding is unclear. The glow associated withthe spoke would tend to support collisions, but theion velocities can be redirected via collisionless inter-actions.As axial distance increased, narrowing of the global
distribution coincided with a decrease in radial veloc-ity. The qualitatively wide distribution in the center
0
50
100
150
200
250
-15 -10 -5 0 5 10 15
0.1 cm0.5 cm
0.65 cm1.0 cm
10.0 cm
Axi
al E
nerg
y (e
V)
Distance from the center of the discharge channel (mm)
Distance downstream of the exit plane
Fig. 9 Peak energy pro�les for 1.5 kW operation.
6 103
8 103
1 104
1.2 104
1.4 104
1.6 104
1.8 104
2 104
-15 -10 -5 0 5 10 15
0.1 cm0.5 mm
1.0 cm10.0 cm
Axi
al V
eloc
ity (
m/s
)
Distance from the center of the discharge channel (mm)
Distance downstream of the exit plane
Fig. 10 Axial velocity pro�les for 3.0 kW opera-tion.
0
50
100
150
200
250
300
-15 -10 -5 0 5 10 15
0.1 cm0.5 cm
1.0 cm10.0 cm
Axi
al E
nerg
y (e
V)
Distance from the center of the discharge channel (mm)
Distance downstream of the exit plane
Fig. 11 Peak energy pro�les for 3.0 kW operation.
of the global distribution is not visible in the data at50 cm (Fig. 18d). However, the center distributionmay still be present, but masked within the complexstructure. This broader distribution (caused by cross-velocities) may be what has been measured by probesin the far-�eld. The 20 eV distribution observed by
8 of 11
American Institute of Aeronautics and Astronautics Paper 99{2424

-6000
-4000
-2000
0
2000
4000
6000
-15 -10 -5 0 5 10 15
5 mm10 mm100 mm
Vel
ocity
(m
/s)
Position relative to channel centerline (mm)
Fig. 12 Radial velocity pro�les for 1.5 kW opera-tion.
-8000
-6000
-4000
-2000
0
2000
4000
6000
8000
-15 -10 -5 0 5 10 15
1 mm10 mm100 mm
Vel
ocity
(m
/s)
Position relative to channel centerline (mm)
Fig. 13 Radial velocity pro�les for 3.0 kW opera-tion.
-15 -10 - 5 0 5 1 0 1 5
2
4
6
8
1 0
1 2
0
0
0
0
0
0
0
Distance from center of discharge channel (mm)
Dis
tanc
e do
wns
trea
m (
mm
)
Fig. 14 Vector plot of the 1.5 kW velocities.
MBMS measurements at 10 cm is also consistent withthis phenomenological explanation. More data takeno� the thruster centerline and better modeling wouldbe required to verify this.
Conclusions
Three-beam LIF has been demonstrated as a viablediagnostic technique for Hall thruster plume velocitymeasurements. Simultaneous measurement of all threevelocity components was achieved. While measured
- 15 -1 0 - 5 0 5 1 0 1 5
2
4
6
8
1 0
1 2
0
0
0
0
0
0
0
Distance from center of discharge channel (mm)
Dis
tanc
e do
wns
trea
m (
mm
)
Fig. 15 Vector plot of the 3.0 kW velocities.
0
0.5
1
1.5
2
-15 -10 -5 0 5 10 15
0.1 cm0.5 cm
0.65 cm1.0 cm
10.0 cm
Ion
Tem
pera
ture
(eV
)
Distance from the center of the discharge channel (mm)
Distance downstream of the exit plane
Fig. 16 Ion temperature pro�les for 1.5 kW oper-ation.
0
0.5
1
1.5
2
2.5
3
3.5
-15 -10 -5 0 5 10 15
0.1 cm 1.0 cm 10.0 cm
Ion
Tem
pera
ture
(eV
)
Distance from the center of the discharge channel (mm)
Distance downstream of the exit plane
Fig. 17 Ion temperature pro�les for 3.0 kW oper-ation.
speeds were lower than those predicted by MBMS mea-surements, they are not inconsistent with previous LIFmeasurements. Repeated measurements will be per-formed to statistically quantify the uncertainty.An acceleration region was observed extending sev-
eral centimeters (>10 cm) downstream of the P5 exit
9 of 11
American Institute of Aeronautics and Astronautics Paper 99{2424

1.0
0.8
0.6
0.4
0.2
0.0
Nor
mal
ized
Inte
nsity
605.300605.295605.290605.285605.280605.275605.270605.265Wavelength (nm)
Axial Data Ref. Cell Data Radial Data
a) 20 cm downstream.
1.0
0.8
0.6
0.4
0.2
0.0
Nor
mal
ized
Inte
nsity
605.300605.295605.290605.285605.280605.275605.270605.265Wavelength (nm)
b) 30 cm downstream.
1.0
0.8
0.6
0.4
0.2
0.0
Nor
mal
ized
Inte
nsity
605.300605.295605.290605.285605.280605.275605.270605.265
Wavelength (nm)
c) 40 cm downstream.
1.0
0.8
0.6
0.4
0.2
0.0
Nor
mal
ized
Inte
nsity
605.295605.290605.285605.280605.275605.270605.265
Wavelength (nm)
d) 50 cm downstream.
Fig. 18 Far-�eld data taken along the P5 center-line.
plane. The temperatures of the three velocity compo-nents were roughly equal and constant. Both of thesesupport the hypothesis that ionization takes placelargely upstream of the exit plane and that there isa distributed acceleration region downstream of theexit plane.
LIF was demonstrated to be of value in the far-�eldas well as in the near-�eld The divergence in the near-�led region was roughly independent of axial positionand gave rise to a complex velocity distribution alongthe thruster centerline. The more-or-less axial compo-nent of this distribution has a wide half-width, whichmay account for the widths observed using physicalprobes. Future investigations will explore this phe-nomenon more fully.
0.00E+00
2.00E-17
4.00E-17
6.00E-17
8.00E-17
1.00E-16
1.20E-16
1.40E-16
1.60E-16
1.80E-16
0.00 500.00 1000.00 1500.00 2000.00
Ion Energy [V]
Fig. 19 Ion energy distribution measured byMBMS.
Acknowledgments
This work was made possible by the continuing sup-port of NASA John Glenn Research Center at LewisField and the personnel associated with the On-BoardPropulsion Branch. The research has been carried outunder NASA Grants NAG 31572 and NGT-3-52311.The authors would also like to thank the other stu-dents in the PEPL group for their assistance and sup-port.
References1King, L. B. et al., \Transport-property Measurements in
the Plume of an SPT-100 Hall Thruster," AIAA Journal of
Propulsion and Power , Vol. 14, No. 3, March 1998, pp. 327{
335.2Manzella, D. H., \StationaryPlasma Thruster Ion Velocity
Distribution,"Proceedings of the 30th Joint Propulsion Confer-
ence, AIAA-94-3141, June 1994.3Gulczinski, F. S., Hofer, R. R., and Gallimore, A. D.,
\Near-Field Ion Energy and Species Measurements of a 5
kW Laboratory Hall Thruster," Proceedings of the 35th Joint
Propulsion Conference, AIAA-99-2430, June 1999.4Domonkos, M. T. et al., \Very Near-�eld Plume Investi-
gation of the D-55," Proceedings of the 33rd Joint Propulsion
Conference, AIAA-97-3062, July 1997.5Keefer, D. et al., \Multiplexed Laser Induced Fluorescence
and Non-Equilibrium Processes in Arcjets," Proceedings of the
25the Plasmadynamics and Lasers Conference, AIAA-94-2656,
July 1992.6Kopfermann,H., Nuclear Moments, Academic Press, 1958.7Candler, C., Atomic Spectra and the Vector Model, Van
Nostrand, 1964.8Bingham, C. et al., \Collinear fast-beam laser spectroscopy
experiment: measurement of hyper�ne structure and isotope
shifts in Xe II," Nuclear Instruments and Methods, Vol. 202,
No. 147, May 1982.9Verdeyen, J., Laser Electronics, Prentice-Hall, 1995.10Haas, J. et al., \Performance Characteristics of a 5 kW
Laboratory Hall Thruster," Proceedings of the 34th Joint
Propulsion Conference, AIAA 98-3503, July 1998.11Arkhipov, B. et al., \Extending the Range of SPT Op-
eration: Development status of 300 and 4500 W Thrusters,"
Proceedings of the 32nd Joint Propulsion Conference, AIAA
96-2708, July 1996.12Garner, C. E. et al., \`Evaluation of a 4.5 kW D-100
Thruster with Anode Layer," Proceedings of the 32nd Joint
Propulsion Conference, AIAA 96-2967, July 1996.13Petrosov, V. A. et al., \Investigation 4.5 kW High E�-
ciency Hall Type T-160 Electric Thruster," Proceedings of the
24th International Electric Propulsion Conference, IEPC 95-03,
Sept. 1995.
10 of 11
American Institute of Aeronautics and Astronautics Paper 99{2424

14Cedolin, R. et al., \Laser-Induced Fluorescence Study of a
Xenon Hall Thruster," Proceedings of the 33rd Joint Propulsion
Conference, AIAA-97-3053, July 1997.15Haas, J. M., Hofer, R. R., and Gallimore, A. D., \Hall
Thruster Discharge Chamber Plasma Characterization using a
High Speed Axial Reciprocating Electrostatic Probe," Proceed-
ings of the 35th Joint Propulsion Conference, AIAA-99-2426,
June 1999.
11 of 11
American Institute of Aeronautics and Astronautics Paper 99{2424