laser-induced fluorescence measurements of a two-stage
TRANSCRIPT

Laser-Induced Fluorescence Measurements of a Two-Stage Microwave
Electrothermal Thruster Plume
Vincent P. Chiravalle*, Sohail H. Zaidi**, Edgar Y. Choueiri#, R.B. Miles##
Applied Physics Group Department of Mechanical and Aerospace Engineering
Princeton University, Princeton NJ 08540
Abstract The operating characteristics of a prototype two-stage microwave electrothermal thruster (MET) have been investigated. The thruster incorporates a novel supersonic energy addition stage. A Laser Induced Fluorescence (LIF) technique was used to make measurements of temperature and velocity in the exhaust plume, with and without the supersonic energy addition. A numerical model was developed to simulate microwave-sustained discharge in the thruster with argon as the propellant gas. The simulation results agreed with the experimental observations of change both in temperature and plume velocity as energy is added to the supersonic stage of the thruster. In general, as a result of supersonic energy addition, a reduction in temperature and exhaust velocity along the centerline of the thruster was observed. It has been concluded that most of the energy added to the supersonic stage was deposited in the laminar boundary layer. It was also found that heat transfer to the thruster walls was much more significant than expected.
A. Introduction Satellites orbiting the Earth serve many civil and military functions including communication, observation and navigation. Future applications include interplanetary and exo-solar system missions for space exploration and search for extra terrestrial life. The cost of such endeavors will depend to a great extent on the specific impulse of the propulsion systems. Various electric propulsion devices have been developed for high specific impulse and include Ion engines1-4, Hall thrusters5-11, devices using arc jets12-13, devices with solar cells14-15, nuclear energy based devices16, Magnetoplasmadynamics (MPD) thrusters17, and gas-fed pulsed plasma thrusters (GF-PPT)18. The specific impulse in these thrusters, depending on the design, may vary from 600 sec to 10,000 sec. Electric propulsion systems such as these overcome the specific impulse limitation inherent in the combustion of conventional rocket fuels by utilizing electromagnetic forces to heat or accelerate a gas directly.
The microwave electrothermal thruster (MET) is a special class of electric propulsion thruster in which a microwave-sustained plasma heats a propellant gas that subsequently expands through a nozzle to generate thrust. The fact that a microwave–sustained plasma can be created without electrodes, which are present in all other electric propulsion devices, may allow microwave thrusters to attain a longer lifetime and operate with water vapor as the propellant. Oxygen atoms produced in the high temperature conditions of a water vapor discharge destroy the electrodes in an electric propulsion device. * Graduate Student, Member AIAA **Research Staff Member, Member AIAA #Professor, Member AIAA ##Professor, Fellow AIAA Copyright © 2003 by the authors. Published by the American Institute of Aeronautics and Astronautics, Inc., with permission.
1

Microwave electrothermal thrusters have been the focus of research for more than twenty years19 but this technology has never been tested in space. Different configurations have been explored for coupling microwave power to a gas, and the cylindrical resonant cavity design, with a standing-wave electric field pattern inside the cavity, was found to be the most promising for thruster application19. Microwave electrothermal thrusters suffer from fundamental limitations on the specific impulse due to the maximum temperature (~ 2000 K) that can be sustained by the thruster walls. A specific impulse between 1500 sec to 3000 sec is generally required for orbit-raising missions. This specific impulse range is within the performance envelope of ion engines and Hall thrusters but lies well beyond the capabilities of the microwave thrusters. The work presented in this paper investigates one possible way to circumvent the limitations of the single-stage MET by adding energy to the propellant in the supersonic, expanding section of the nozzle, thus creating a two-stage thruster. For this purpose, a two-stage thruster has been designed to operate using argon as the propellant gas. Two microwave sources have been employed to provide energy to subsonic and supersonic sections of the thruster independent of each other. A laser induced fluorescence technique has been used to measure simultaneously temperature and velocity in the exhaust plume both with and without energy addition in the supersonic section of the thruster. The following sections describe both the theoretical and experimental endeavors to explore this concept.
B.Two-Stage MET-100 Thruster 1. Modes in Cylindrical Cavity
The field patterns, or modes, which exist in an empty cylindrical waveguide are well known. The components of the electromagnetic field are described by Maxwell’s equations. The thruster MET-100 used in this study was designed to operate in an TM011 resonant mode. This is a mode which is characterized by an axially symmetric distribution of electric field strength. The electric field equations describing the TM011 in cylindrical coordinates are given as20
=
METMETMET
METr l
zrrJ
Jlr
JE .sin.
... 01
101
ππ (1)
=
METMETZ l
zrJ
JE .cos.010
π (2)
where Jm is the Bessel function of order m and Jmn is the nth root of Jm. rMET and lMET respectively represent the radius and the length of the cavity. From the solution of the Maxwell’s equations for the TM011 resonant condition, it is found that there is a basic relationship between the cavity radius and its resonant length. For each radius value, there is a unique (real) resonant length solution which is given by the following equation20
2
0122
−
=
MET
MET
rJ
cfπ
l π (3)
where f is the microwave frequency and c is the speed of light in free space. Thus for a cavity radius of 5.08 cm, the corresponding cavity length turns out to be equal to 15.2 cm, as shown in figure 1. It has been demonstrated empirically that a slight increase in the cavity length (~15.87 cm) can improve the coupling between the microwave probe and the plasma generated in the cavity20. For these cavity dimensions, equations 1 and 2 were solved to obtain the time-averaged value of the normalized axial and radial electric fields. Figure 2 shows the time averaged, normalized, axial electric field in the cavity. The maximum value of unity for the normalized axial field occurs on the centerline in two locations, at x=0 and x=15.87 cm, corresponding to the end of walls of the cavity. It is also evident that at the mid plane of the cavity the axial
2

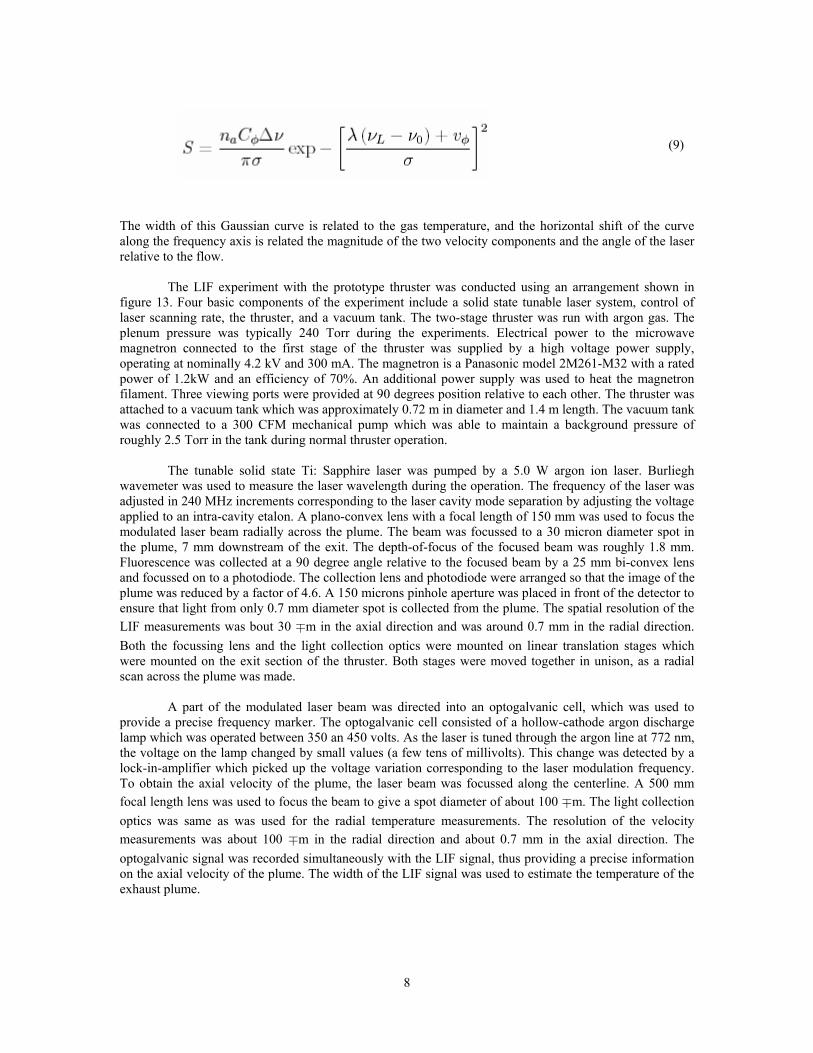
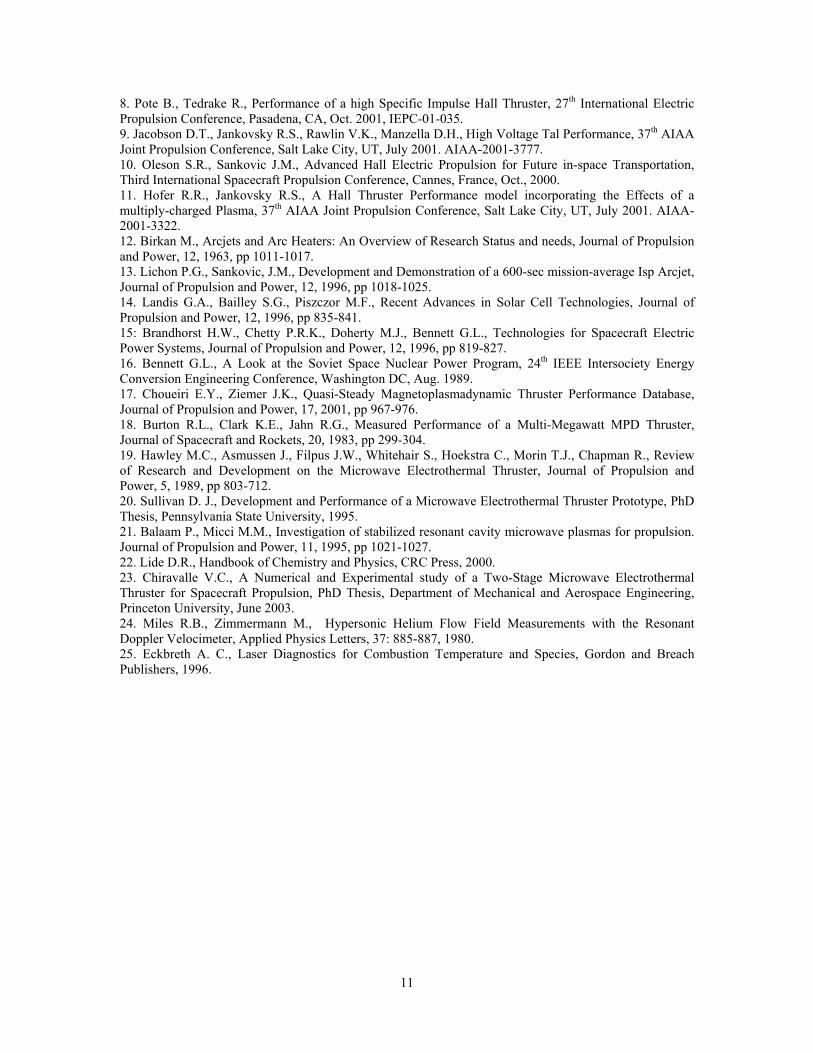
field drops off to zero, and the field pattern is symmetrical about the mid plane. The corresponding contour plot for time-averaged, normalized radial electric field is shown in figure 3. The radial field is zero along the centerline and its maximum value occurs in the mid plane. The radial field maximum is smaller than axial field maximum, and unlike the axial field the radial field drops off to zero at the ends of the cavity. The microwave thruster was designed to incorporate this feature with the assumption that this electric field pattern would confine the plasma close to the centerline of the cavity near the exit orifice. 2. The Thruster Design The design of the thruster was based on the design developed by Micci21 with the added provision of providing a microwave field in the super sonic section of nozzle. The TM011 cavity has been divided into two cylindrical sections of similar lengths, separated by a boron nitride plate, as shown in figure 4. The top section forms a plenum where the propellant gas is injected and the plasma forms. The bottom section is pressurized to well above the breakdown threshold, and the coupling probe is located in this section. The flow has been injected tangentially through three injection ports to create a flow swirl, which is thought to help with plasma confinement and stability. Unlike the conventional thrusters, the subsonic stage of this thruster does not utilize a conventional coupling probe, but instead the antenna of the microwave magnetron (~ 1.0 kw) itself is placed in the cavity to cause a direct coupling. This design eliminates the need of building a microwave circuit for impedance matching. The subsonic stage utilizes a stainless steel nozzle with a 30 degree conical converging section which mates directly to a straight throat section about 1.25 cm long. As this thruster was designed to operate at a higher flow rates (~600 mg/s), the throat diameter of the thruster is 3.18 mm, larger than the one in the standard thruster used in previous studies21. The exhaust gas moves from the stainless steel converging nozzle into the diverging, dielectric nozzle in the supersonic stage. The supersonic stage consists of three parts, an aluminum cavity, a ceramic nozzle insert, which fits inside the cavity, and a coaxial transmission line, through which microwave energy is transmitted into the stage from a regular wave guide. The supersonic cavity has been designed to support the TM011 modes. The cavity has a radius of 7.62 cm with a corresponding length of 2.08 cm, which is considerably shorter than the resonant length of the subsonic stage. Part of this is due of the radius of the supersonic stage being larger and other part of due to the dielectric constant of the ceramic insert. The ceramic insert is made from alumina, with a dielectric constant of 9.022. The dielectric nozzle insert is a cylindrical piece, which has a conical nozzle at the center with a half angle of 7.5 degrees. The throat diameter of the insert is 3.18 mm, matching the corresponding throat diameter of the subsonic section. A square hole, 2.54 cm in length, was fashioned into the alumina piece, to provide space for the microwave loop antenna inside the supersonic cavity. Figure 5 shows an overall arrangement for different elements of the two-stage thruster used in this experiment.
C. Modeling and Theoretical Predictions A physical model has been developed to understand the plasma properties and the heating process which sustain the plasma in the microwave thruster used in this study. The model uses standard numerical techniques and consists of four parts: a gas dynamic model, a plasma model, a transport model and a microwave field model. All of these components interact with each other to capture the highly non-linear nature of the microwave heating process. The model details can be found in reference [23]. 1. Gas Dynamics Model
The gas dynamics model incorporates the unsteady, axisymmetric, Navier-Stokes equations for a two-temperature gas with reacting species. A conservative, finite-volume, cell-centered formulation, incorporating flux-limited scalar dissipation, was used to numerically solve these equations. Because of the cell-centered scheme used by the Navier-Stokes solver it was necessary to specify the values of the flux vectors at the physical boundaries of the domain. Along all the boundaries the numerical dissipation was set equal to zero. Along the wall and centerline boundaries the convective fluxes were specified so that there
3

were no mass, momentum, or energy fluxes through these respective boundaries. The only contribution to the flux vector from a face on either side of these boundaries was from the gas pressure. In addition, no slip conditions were applied at the wall boundaries. Heat transfer to the wall by the heavy particles was handled by either setting the heat flux terms at the wall equal to zero (adiabatic wall assumption) or by specifying the temperature at the wall. At the gas inlet the fluid properties were prescribed, so that the required mass flux enters the thruster, in most cases at a temperature of 300 K. The convective fluxes for the cell immediately adjacent to the exit plane were calculated in one of the two ways, depending upon whether the flow was entering or leaving the domain. If the flow was exiting the domain then the properties were calculated by extrapolation from the interior of the domain. In case when the flow was entering the domain, which occurs when a re-circulation zone was established around the expanding thruster plume, the exit temperature and pressure were specified and the flow velocity was extrapolated from the interior of the domain. 2. Plasma Model The energy addition process in microwave thrusters is influenced strongly by the properties of the microwave sustained-plasma in the thruster. The conditions of interest span the full range of pressure near atmospheric conditions in the plenum down to few Torr in the supersonic stage of the prototype thruster. A comprehensive model was required to describe the concentrations of different ionized and electronically excited species. The plasma model developed in this work was applied to study a purely argon plasma. The relevant species considered include electron, neutral atoms, atomic ions, and molecular ions. For such plasmas the relevant volumetric electron process have been taken into account. It was shown that under typical conditions in the plenum of the MET thruster molecular ions were the dominant ionic species, and dissociative recombination is the dominant electron loss mechanism. The electron energy distribution function (EEDF) influences the plasma properties through its role in determining the various rates of excitation and ionization. For the current work it was assumed that electron energy distribution function was Maxwellian. The validity of using a Maxwellian electron energy distribution function (EEFD) for determining the rate coefficients of ionization and excitation was then explored. Further discussion on EEDF, rate coefficients for electron excitation, heavy particles and electron transport processes can be found in reference [23]. 3. Microwave Field Model The spatial distribution of the microwave field inside the thruster influences the plasma properties and the joule heating profile, and therefore any model that accurately represents a microwave thruster must include a detailed description of the microwave field. As mentioned in the above sections, for a TM011 mode in a cylindrical waveguide there are three components of the electromagnetic filed, Er (radial component), Ez (axial component), and H (azimuthal magnetic field component). When considering the heating of a plasma by microwaves, only the electric field components are important. It can be shown that the complex amplitude of each of the components of the electromagnetic field obeys the Helmholtz wave equation. In cylindrical coordinates the Helmhotz equation for the complex amplitude of the axial electric field component, Ez, was solved using a finite element technique. In order to define appropriate boundary conditions, all waveguide surfaces, shorting plates and the stainless steel nozzle in the subsonic stage, were assumed to be perfect conductors. It is important to note that at microwave frequencies the skin depth is such that the microwave field only penetrates a few microns into the metal. Along the waveguide boundary, Ez was set to zero. The corresponding boundary condition for the radial electric field, when r = a (waveguide radius), is ∂rEr/∂r = 0, directly comes from the Maxwell’s equations and the fact that Ez = 0. At the subsonic nozzle exit plane, where the flow exits the subsonic part of the thruster and the enters the supersonic part, the electric field is evanescent, since the nozzle throat diameter is much smaller than the waveguide radius. Along the nozzle throat boundary, dz = 0, an expression to specify the normal derivatives of both Ez and Er, was employed. The evanescent field was calculated for the subsonic part of the thruster only.
4

The supersonic cavity was formed in the two-stage thruster by shorting a section of waveguide at the throat where the flow exits from the subsonic part of the thruster. It was assumed that the waveguide was completely closed by the shorting plate. The evanescent part of the field caused by the hole in the shorting plate due to the nozzle throat was neglected because it decays to zero in a relatively short distance. The supersonic waveguide section was filled completely with the dielectric nozzle for the supersonic expansion. Along the shorting plate boundary the following conditions hold true, Er = 0 and ∂Ez/∂z = 0. At the waveguide centerline, for both the subsonic and supersonic sections, the cylindrical symmetry of the problem implies that Er = 0 and ∂Ez/∂z = 0. At the microwave inlet port for both the subsonic and supersonic section, the classical solution for waves propagation in a cylindrical waveguide was used to specify the values of Er and Ez. The classical solution takes the from
(4)
where A+ is the complex amplitude coefficient and X is the reflection coefficient. The axial component of the field, Ez, at the inlet boundary was specified assuming a normalized electric field. 4. Model Predictions Detailed simulations of the two-stage thruster with subsonic and supersonic energy addition were performed to explore the plasma properties inside the plenum. The structure of the filamentary plasma was also investigated. For the fluid simulation, plenum chamber and energy addition processes were ignored and the temperature and pressure were specified at the inlet of the nozzle section. At the inlet a single component of velocity in the axial direction was considered. Based on the specified stagnation conditions and the nozzle geometry, the code predicted the final mass flow rate. The pressure at the inlet was fixed at 240 Torr, the measured operating pressure of the two-stage thruster. At the exit, the inflow boundary condition was specified such that the pressure was 2.5 Torr and the temperature was fixed at 300 K. The structured grid used for the fluid flow simulation consisted of two distinct regions, the nozzle section and the vacuum expansion region. The nozzle region was composed of 300 axial cells and 70 radial cells whereas the expansion region was consisted of 100 axial cells and 100 radial cells. At the throat the radial distribution of cells was such that there were 16 cells within 0.1 mm of the nozzle wall. The critical issues involving the modeling of the plenum boundaries included the treatment of the mass injection into the thruster and the treatment of the plenum wall temperature. The thruster had three injection ports in the plenum section. These ports were oriented so that both axial and azimuthal components of flow velocity were induced. In the model, it was assumed that the mass injection occurs in an annular ring, 16 cells wide, in the upper left-corner of the plenum. The azimuthal component of velocity was ignored in simulation calculations. The boundary conditions for this annular injection region were such that the temperature was fixed at the plenum walls and the pressure was extrapolated from the neighboring cells. In addition the total mass flow rate entering the thruster was fixed, with the velocity and density at the inlet being adjusted based on the instantaneous pressure. In these calculations, the operating conditions of the thruster were incorporated. The two-stage thruster operates with approximately 900 W of microwave energy addition in the plenum section and encompass a mass flow rate of about 570 mg/sec with a plenum pressure of 240 Torr. For these operating conditions, the plenum temperature of 500 K was calculated using the following equation,
5

(5) where m is the mass flow rate and A is the area of the orifice. P0 is the stagnation pressure and R is the universal gas constant. The fluid simulation was started from a plenum temperature of 500 K. This value of temperature was used at the inlet, along with 240 Torr plenum pressure, to simulate the fluid flow through the nozzle using the simplified grid. Microwave energy addition and the heat transfer rate through the nozzle wall were neglected for simplicity. It was assumed that the temperature in the plenum would be equal to the inlet temperature.
A detailed calculation was performed for the plenum section of the two-stage thruster with only subsonic energy addition. The simulation code described above was used to explore the plasma properties and the structure of the plasma filament inside the plenum. Again in this case, wall temperature in the plenum was assumed as 500 K. Simulations were performed by assuming that the two-stage thruster operates with approximately 500 W of microwave energy absorbed by the subsonic plasma. Figure 6 shows the gas temperature contours indicating that the plenum temperature is about 660 K which is higher than the stagnation temperature (~500 K) determined from equation 4. Figure 7 presents the simulation results for electron number density in the plenum. It seems that peak electron number density in the discharge region is about 5 1012 cm-3, which occurs near the top left corner of the plenum. Away from the top left corner the electron number density drops to about 1011cm-3. The contours of electron joule heating rate are shown in figure 8. The model predicts that the joule heating occurs predominantly in a thin discharge region near the left hand boundary of the plenum, and the electric field pattern is highly distorted because of this. However the real observation during the experiment does not support this prediction as the filament discharge is seen on the centerline. Although model includes the most dominant volumetric recombination processes, dissociative recombination, one possible reason for the difference between observation and model prediction arises from the fact that the model does not consider wall effects including electrostatic sheaths and recombination at the wall. It is worth mentioning that while performing the experiment, about 80 W of microwave power was added to the flow in the supersonic stage of the thruster. Therefore for the supersonic energy addition simulations, 80 W of energy addition was taken intoaccount. In the simulation the microwave field components in the supersonic stage were determined, and the argon plasma kinetic model was used to predict the number densities of electrons and excited state species. All other aspects of calculation involving the conditions at the subsonic inlet, the plenum wall temperature and the numerical dissipation coefficients were the same as used in the calculations for the subsonic stage. The contours for temperature and joule heating corresponding to the plume profile for supersonic energy addition are presented in figures 9 and 10. Figure 9 clearly indicates that most of the temperature increase occurs in the boundary layer of the expanding flow. The temperature near the nozzle wall approaches a maximum value of 3040 K. In the real thruster the expanding nozzle section is made from alumina ceramic, which could possibly sustain such high temperatures momentarily. More likely there is sufficient heat loss through the ceramic walls, which has been ignored in this simulation. Adiabatic conditions were assumed at the nozzle wall to represent the ideal case where all the supersonic energy addition was imparted to the flow. It is important to note that with the supersonic energy addition, the temperature at the nozzle exit increases by about 14 degrees Kelvin. Figure 10, showing the joule heating, suggests that the region of significant electron heating is fairly well confined to the nozzle wall and exit plane. The electron number density which corresponds to this heating rate is shown in figure 11. A maximum electron number density of 3.8 1015cm-3 occurs at the nozzle wall near the throat. Figure 12 shows the Mach number contours. The flow is under expanded at the exit and continues to expand after leaving the nozzle. The supersonic energy addition causes a reduction in the Mach number from 3.7 to 3.2.
6

LIF Technique and Experimental Setup
The laser-induced fluorescence (LIF) technique was first used by Miles et al. [24] to study supersonic flows in a wind tunnel. Laser-induced fluorescence is best viewed as an absorption, followed after some finite period of time, by spontaneous emission from the excited states [25]. In order to perform quantitative fluorescence measurements on a given atom, it must have an absorption wavelength which is accessible to an tunable laser source. The transition of interest in the current work is the argon transition (Ar I) at a vacuum wavelength of 772.589 nm, from the 4s[3/2]2 metastable level to the 4p[3/2]1 level. The fluorescence from the 4p[3/2]1 level consists of four different transitions whose wavelengths are displayed in Table 1 together with the lower and upper levels for each transition and corresponding spontaneous emission rate coefficients (Amn). As the spontaneous rate coefficient corresponding to the fluorescence at 810 nm is an order of magnitude larger than the value for other transitions in table 1, light at 810 nm is the dominant component of the fluorescence light. As the fluorescence light appeared at a frequency (810.592) which is different from the transition frequency (772.589 nm), it was possible to achieve a good signal-to-noise ratio by filtering out various sources of scattered laser light from the windows and other surfaces. A suitable bandpass filter centered at 810 nm with a width of approximately 10 nm was placed in front of the detector for this purpose. While using the LIF technique to measure the velocity and temperature of the thruster plume, it was assumed that the lineshape of the LIF signal in the plume reflects a Doppler-broadened transition. Other contributions to the linewidth such as those due to pressure broadening effects were neglected. The argon plume of the thruster can have two components of velocities, an axial component directed along the plume, and a radial component directed perpendicular to it. At a given temperature the velocity distribution of the argon atoms is Maxwellian, according to the following relation
(6) where NA is the number density of atoms, and z and r are the average values of axial and radial velocity,
is related to the gas temperature, according to kT=1/2m 2. For a laser beam propagating at an angle with
respect to the center line of the plume illuminating an atom moving with velocity components, z and r,
the observed frequency shift will be (vzcosφ +vrsinφ )/ where is the laser wavelength. The total LIF signal, S, is proportional to the integral of the velocity distribution function,
(7) Cφ is a constant which depends on the geometry of the optics and the laser power. The band of integration, A, comprises the region in velocity space where the following inequality hold, with ν∆ being the laser linewidth (in sec-1) and Lν , the laser frequency. The final result for the LIF signal, S, is
a Gaussian curve which depends on the difference between the laser frequency and the frequency of the transition:
(8)
7
(9) The width of this Gaussian curve is related to the gas temperature, and the horizontal shift of the curve along the frequency axis is related the magnitude of the two velocity components and the angle of the laser relative to the flow. The LIF experiment with the prototype thruster was conducted using an arrangement shown in figure 13. Four basic components of the experiment include a solid state tunable laser system, control of laser scanning rate, the thruster, and a vacuum tank. The two-stage thruster was run with argon gas. The plenum pressure was typically 240 Torr during the experiments. Electrical power to the microwave magnetron connected to the first stage of the thruster was supplied by a high voltage power supply, operating at nominally 4.2 kV and 300 mA. The magnetron is a Panasonic model 2M261-M32 with a rated power of 1.2kW and an efficiency of 70%. An additional power supply was used to heat the magnetron filament. Three viewing ports were provided at 90 degrees position relative to each other. The thruster was attached to a vacuum tank which was approximately 0.72 m in diameter and 1.4 m length. The vacuum tank was connected to a 300 CFM mechanical pump which was able to maintain a background pressure of roughly 2.5 Torr in the tank during normal thruster operation. The tunable solid state Ti: Sapphire laser was pumped by a 5.0 W argon ion laser. Burliegh wavemeter was used to measure the laser wavelength during the operation. The frequency of the laser was adjusted in 240 MHz increments corresponding to the laser cavity mode separation by adjusting the voltage applied to an intra-cavity etalon. A plano-convex lens with a focal length of 150 mm was used to focus the modulated laser beam radially across the plume. The beam was focussed to a 30 micron diameter spot in the plume, 7 mm downstream of the exit. The depth-of-focus of the focused beam was roughly 1.8 mm. Fluorescence was collected at a 90 degree angle relative to the focused beam by a 25 mm bi-convex lens and focussed on to a photodiode. The collection lens and photodiode were arranged so that the image of the plume was reduced by a factor of 4.6. A 150 microns pinhole aperture was placed in front of the detector to ensure that light from only 0.7 mm diameter spot is collected from the plume. The spatial resolution of the LIF measurements was bout 30 ∓m in the axial direction and was around 0.7 mm in the radial direction. Both the focussing lens and the light collection optics were mounted on linear translation stages which were mounted on the exit section of the thruster. Both stages were moved together in unison, as a radial scan across the plume was made. A part of the modulated laser beam was directed into an optogalvanic cell, which was used to provide a precise frequency marker. The optogalvanic cell consisted of a hollow-cathode argon discharge lamp which was operated between 350 an 450 volts. As the laser is tuned through the argon line at 772 nm, the voltage on the lamp changed by small values (a few tens of millivolts). This change was detected by a lock-in-amplifier which picked up the voltage variation corresponding to the laser modulation frequency. To obtain the axial velocity of the plume, the laser beam was focussed along the centerline. A 500 mm focal length lens was used to focus the beam to give a spot diameter of about 100 ∓m. The light collection optics was same as was used for the radial temperature measurements. The resolution of the velocity measurements was about 100 ∓m in the radial direction and about 0.7 mm in the axial direction. The optogalvanic signal was recorded simultaneously with the LIF signal, thus providing a precise information on the axial velocity of the plume. The width of the LIF signal was used to estimate the temperature of the exhaust plume.
8

Experimental Results and Discussion LIF measurements in the exhaust plume were taken with subsonic and supersonic energy additions. As previously explained, for temperature measurements the laser beam was focused and scanned radially across the plume at about 7.0 mm downstream the plume exit from the thruster. Experimental results are shown in figure 14. A temperature of about 220 20 K was measured at a point about 4.0 mm
from the centerline. The temperature gradually increases to 330 20 K at about 6.1 mm from the centerline. Both of these values agree reasonably well with the predicted values from the fluid simulation, which are 210 and 340 K at these locations respectively. These simulated values were obtained by taking into account the measured operating conditions of the thruster which included the argon mass flow rate (~570 mg/sec) and the plenum pressure (~240 Torr). It must be noted that while predicting the plume temperatures, assumptions were made about the microwave power absorbed by the plasma. No experimental effort was made to measure the heat loss to the thruster walls. For the ideal case when there is no heat loss to the thruster walls and for 900 W of subsonic energy addition to an argon flow of 570 mg/sec, the maximum temperature in the plenum would be 3350 K and the plenum pressure would be around 620 Torr. With these values of temperature and pressure, the code predicts that the temperature where LIF measurement was made, about 4.0 mm from the centerline, is about 1200 K. Near the centerline the temperature is predicted to be 575 K. The fact that the measured temperature is much lower, at both locations, implies that a sizeable fraction of the microwave power is being absorbed by the walls of the thruster. The LIF signal corresponding to the 4.0 mm point is shown in figure 15. There are thirty points, total, in a single laser scan, about ten of which occur inside the LIF peak. The remaining points are averaged to determine the background noise level. The background noise level is subtracted from the data, and the result normalized by the peak signal to generate the final LIF signal, as exemplified by figure 15. The standard deviation of the background noise, normalized by the peak signal, is used as an estimate for the error bars. A Gaussian curve is then fit to the LIF signal. A separate experiment was performed to measure the flow velocity. An optgalvanic cell was used to generate a frequency marker. The LIF signal was measured at a point 7.0 mm in front of the nozzle exit and 1.0 mm away from the centerline. For the axial velocity measurements the laser beam was directed from the nozzle exit towards the throat, parallel to the centerline. Figure 16 shows the experimental results. The measured value of the velocity is 500 20 m/sec, which is about 25% smaller than the computed value of about 670 m/sec with a 500 K plenum. For the measurements with the supersonic stage the subsonic stage of the thruster was operated in exactly the same manner as before, with a mass flow rate of about 570 mg/sec and a plenum pressure of 240 Torr. About 80 W of power was added in the supersonic stage of the thruster. This value of absorbed power was inferred from measurements of forward and reflected power in the microwave guide. Before the supersonic stage was activated the discharge in the subsonic stage was initiated. Without the subsonic discharge present in the thruster it was not possible to breakdown the gas in the supersonic stage. While adding supersonic energy, a three-stub tuner was used to optimize the power coupling to the plume. As the optimum tuning condition was approached the measured reflected power dropped off sharply and the light intensity of the plume increased significantly. There was a bright red plume which expended about 10.0 cm from the exit of the nozzle. The plume appeared much wider than in the previous case with no supersonic energy addition. LIF measurements were repeated in the same locations where previous LIF experiment was performed with subsonic energy addition. The results are shown in figure 17 with the previously collected data for the case without supersonic energy addition. A temperature of 210 30 K is measured 4.0 mm away from the centerline. This value is the same to within experimental error as the measurement made for the case without supersonic energy addition. The measured temperature increases to 410 40 K at a distance 5.3 mm away from the centerline. The peak temperature at 5.3 mm is less than the value predicted by the code, 550 K, by 33%. Experimental values suggest that the temperature in the plume decreases at 3.5 mm position away from the centerline decreases from 190 K to 150 K when supersonic energy addition takes place. The temperature decrease in this location has also been predicted by the
9

simulation code. It seems that the temperature reduction at this location is due to the fact that energy addition in the boundary layer gives rise to a stronger expansion region outside the thruster. As with the case of no supersonic energy addition a velocity measurement was made near the centerline of the thruster plume. To get the axial component of velocity the laser beam was focussed 7.0 mm away from the thruster exhaust along the centerline of the plume. Figure 18 gives the results from the thruster plume and the optogalvanic cell. The velocity was measured to be 440 20 m/s which is lower than 500 m/sec as measured in the case without supersonic energy addition. The numerical code also predicts the velocity decrease from 670 m/s to 660 m/s when supersonic energy is added. It seems that the over prediction of the velocity is the influence of the turbulent shear layer on the expanding free jet which is not included in the model. The presence of such a turbulent layer may limit the expansion of the free jet thus accounting for the lower velocities that were measured in the experiment.
Conclusions A two-stage microwave thruster has been developed and supersonic energy addition has been demonstrated. Beside verifying experimentally that microwave energy could be added to an expanding supersonic flow in a thruster geometry, LIF measurements of temperature and velocity have been performed in the exhaust plume to characterize the nature of the physical processes occurring inside the thruster. A numerical code was developed and applied to each stage of the thruster separately, so that a description of the microwave-sustained discharge inside each stage could be obtained. LIF measurements revealed much lower than expected temperatures in the plume, suggesting that heat transfer to the thruster walls is much more significant and can not be ignored. A change in temperature and plume velocity was observed with supersonic energy addition which was also predicted by the simulation code. However, predicted values of temperature and velocity both for with and without supersonic energy is higher than the measured values. It seems that the difference between the experimental and the predicted values is due the exclusion of the turbulent shear layer, present in the real expanding free jet, from the model. For a high performance MET with a specific impulse greater than 400 sec, it would be necessary to redesign the plenum chamber with a ceramic material to avoid the heat loss from the plenum. Future research should also incorporate an effective method to add energy to the core of the flux in the supersonic stage of the thruster.
References 1. Nakanishi S., Pawlik E.V., Experimental Investigation of a 1.5 m diameter Kaufman Thruster, Journal of Spacecraft and Rockets, 5: 801, 1968. 2. Curran F.M., Electric Propulsion Activities in US Industry, 26th International Electric Propulsion Conference, Kitakyushu, Japan, Oct. 1999, IEPC-99-001. 3. Polk J.E., Brinza D., Kakuda R.Y., Brophy J.R., Katz I., Anderson J.R., Rawlin V.K., Patterson M.J., Sovey J., Hamley J., Demonstration of the NSTAR Ion Propulsion System on the Deep Space One Mission, 27th International Electric Propulsion Conference, Pasadena, CA, Oct. 2001, IEPC-01-075. 4. Rawlin V.K., Pinero L.R., Williams G.J., Roman R.F, Status of the Ion Engine Development for High Power, High Specific Impulse Missions, 27th International Electric Propulsion Conference, Pasadena, CA, Oct. 2001, IEPC-01-096. 5. Manzella D., Sarmiento C., Sankovic J., Haag T., Performance Evaluation of the SPT-140, 25th International Electric Propulsion Conference , Cleveland, OH, Aug. 1997, IEPC-97-059. 6. Fisher J., Wilson A., King D., Meyer S., Engelbrecht C., Grys K. de, Werthman L., The Development and Qualification of a 4.5 kw Hall Thruster Propulsion System for Geo Satellite Applications, 27th International Electric Propulsion Conference, Pasadena, CA, Oct. 2001, IEPC-01-010. 7. Grys de K., Meckel N., Callis G., Greisen D., Hoskins A., Kings D., Wilson F., Werthman L., Khayms V., The Development and Testing of a 4500 watt Flight Type Hall Thruster and Cathode, 27th International Electric Propulsion Conference, Pasadena, CA, Oct. 2001, IEPC-01-011.
10
8. Pote B., Tedrake R., Performance of a high Specific Impulse Hall Thruster, 27th International Electric Propulsion Conference, Pasadena, CA, Oct. 2001, IEPC-01-035. 9. Jacobson D.T., Jankovsky R.S., Rawlin V.K., Manzella D.H., High Voltage Tal Performance, 37th AIAA Joint Propulsion Conference, Salt Lake City, UT, July 2001. AIAA-2001-3777. 10. Oleson S.R., Sankovic J.M., Advanced Hall Electric Propulsion for Future in-space Transportation, Third International Spacecraft Propulsion Conference, Cannes, France, Oct., 2000. 11. Hofer R.R., Jankovsky R.S., A Hall Thruster Performance model incorporating the Effects of a multiply-charged Plasma, 37th AIAA Joint Propulsion Conference, Salt Lake City, UT, July 2001. AIAA-2001-3322. 12. Birkan M., Arcjets and Arc Heaters: An Overview of Research Status and needs, Journal of Propulsion and Power, 12, 1963, pp 1011-1017. 13. Lichon P.G., Sankovic, J.M., Development and Demonstration of a 600-sec mission-average Isp Arcjet, Journal of Propulsion and Power, 12, 1996, pp 1018-1025. 14. Landis G.A., Bailley S.G., Piszczor M.F., Recent Advances in Solar Cell Technologies, Journal of Propulsion and Power, 12, 1996, pp 835-841. 15: Brandhorst H.W., Chetty P.R.K., Doherty M.J., Bennett G.L., Technologies for Spacecraft Electric Power Systems, Journal of Propulsion and Power, 12, 1996, pp 819-827. 16. Bennett G.L., A Look at the Soviet Space Nuclear Power Program, 24th IEEE Intersociety Energy Conversion Engineering Conference, Washington DC, Aug. 1989. 17. Choueiri E.Y., Ziemer J.K., Quasi-Steady Magnetoplasmadynamic Thruster Performance Database, Journal of Propulsion and Power, 17, 2001, pp 967-976. 18. Burton R.L., Clark K.E., Jahn R.G., Measured Performance of a Multi-Megawatt MPD Thruster, Journal of Spacecraft and Rockets, 20, 1983, pp 299-304. 19. Hawley M.C., Asmussen J., Filpus J.W., Whitehair S., Hoekstra C., Morin T.J., Chapman R., Review of Research and Development on the Microwave Electrothermal Thruster, Journal of Propulsion and Power, 5, 1989, pp 803-712. 20. Sullivan D. J., Development and Performance of a Microwave Electrothermal Thruster Prototype, PhD Thesis, Pennsylvania State University, 1995. 21. Balaam P., Micci M.M., Investigation of stabilized resonant cavity microwave plasmas for propulsion. Journal of Propulsion and Power, 11, 1995, pp 1021-1027. 22. Lide D.R., Handbook of Chemistry and Physics, CRC Press, 2000. 23. Chiravalle V.C., A Numerical and Experimental study of a Two-Stage Microwave Electrothermal Thruster for Spacecraft Propulsion, PhD Thesis, Department of Mechanical and Aerospace Engineering, Princeton University, June 2003. 24. Miles R.B., Zimmermann M., Hypersonic Helium Flow Field Measurements with the Resonant Doppler Velocimeter, Applied Physics Letters, 37: 885-887, 1980. 25. Eckbreth A. C., Laser Diagnostics for Combustion Temperature and Species, Gordon and Breach Publishers, 1996.
11

Table 1: Fluorescence Transitions from the 4p[3/2]1 Level
Vacuum Wavelength Lower Level Upper Level Amn
(nm) (nm) (nm) (sec-1)
772.589 4s[3/2]2 4p[3/2]1 5.2 106
810.592 4s[3/2]1 4p[3/2]1 2.5 107
867.032 4s [1/2]0 4p[3/2]1
2.4 106
935.679 4s [1/2]1 4p[3/2]1 1.1 106
12

5
10
15
20
4 6 8 10 12 14 16 18 20
Cavity radius (cm)
Cav
ity L
engt
h (c
m)
Figure 1: TM011 resonant cavity length as a function of its radius
Figure 2: Time-averaged, normalized, axial electric field in non-dimensional units
13
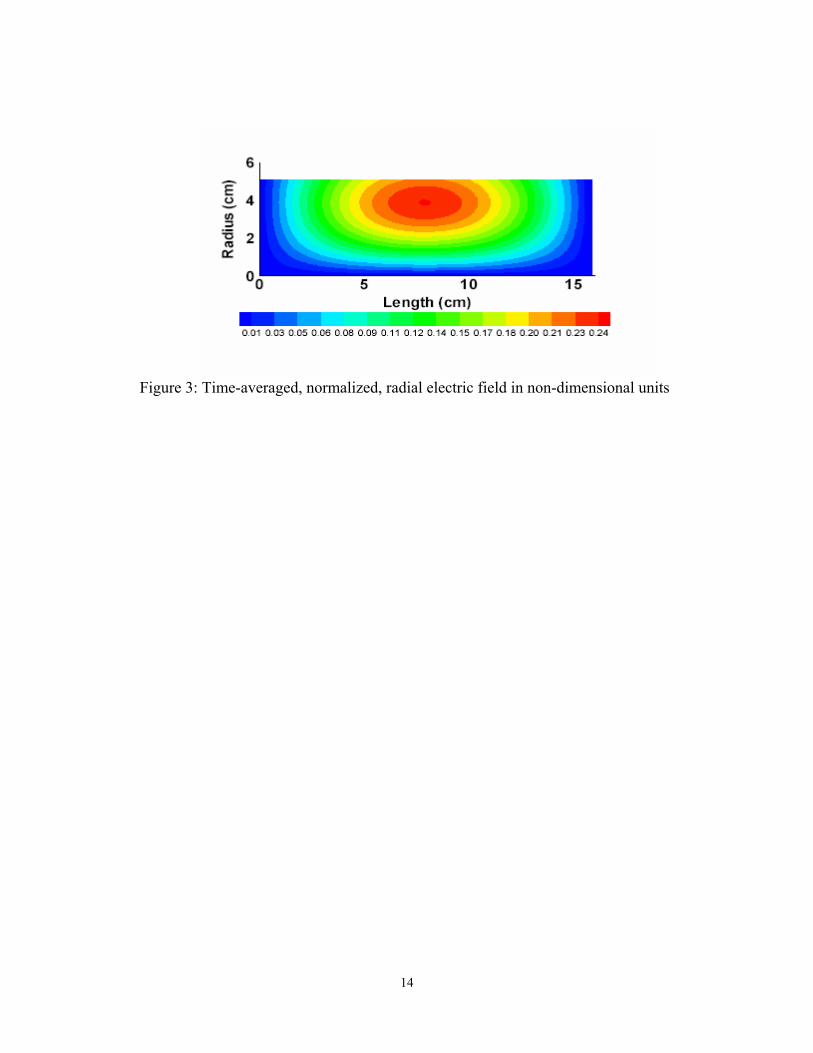
Figure 3: Time-averaged, normalized, radial electric field in non-dimensional units
14
Figure 4: Diagram of a microwave electrothermal thruster (MET)
Figure 5: Elements of the prototype two-stage MET thruster
15
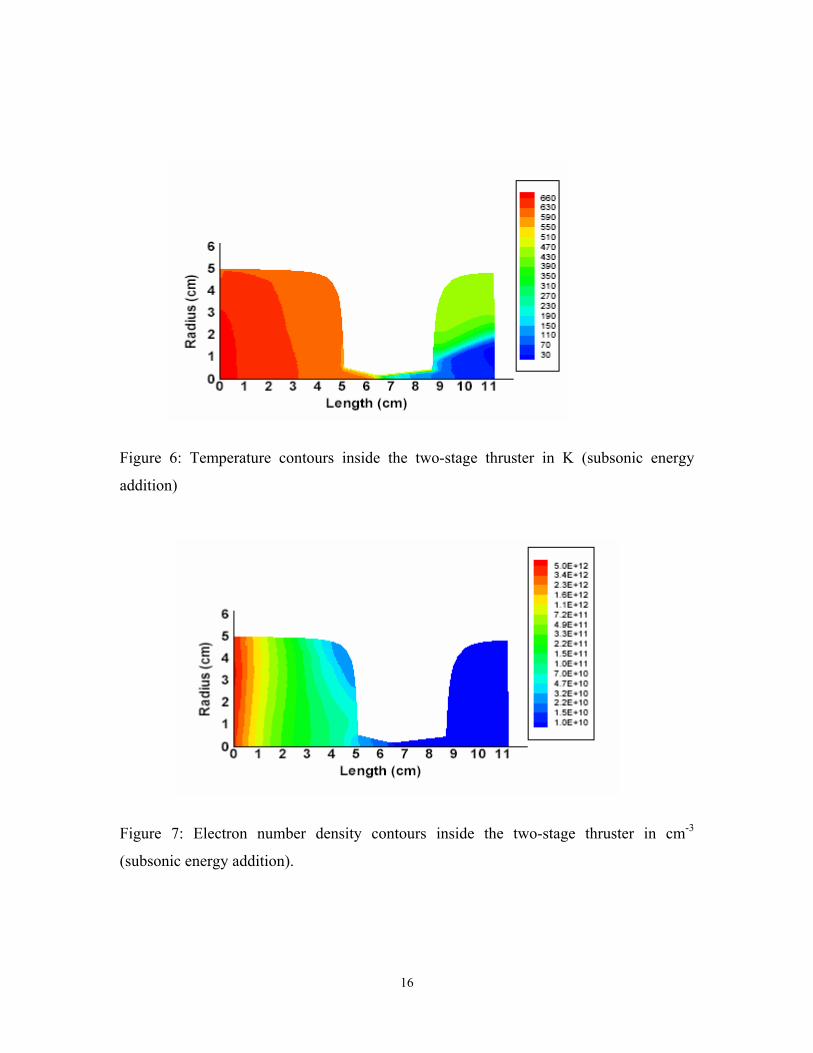
Figure 6: Temperature contours inside the two-stage thruster in K (subsonic energy
addition)
Figure 7: Electron number density contours inside the two-stage thruster in cm-3
(subsonic energy addition).
16

Figure 8: Joule heating rate of electrons inside the two-stage thruster in kW/cm3 (subsonic
energy addition).
Figure 9: Temperature contours for the case of 80 W supersonic energy addition in K.
17

Figure 10: Joule heating for the case of 80 W supersonic energy addition in kW/cm3.
Figure 11: Electron number density contours for the case of 80 W supersonic energy
addition in cm-3.
18

Figure 12: Mach number contours for the case of 80 W supersonic energy addition. The
nozzle exit is at approximately 4 cm.
Figure 13: Experiment setup for the LIF measurements in the thruster.
19

Figure 14: Measured temperature in the exhaust plume with subsonic energy addition.
The solid line indicates the model prediction with a stagnation temperature of 500 K in
the plenum.
Figure 15: LIF data used to determine the temperature at 4.0 mm from the centerline of
the plume. The solid line is a Gaussian fit to the measured data.
20
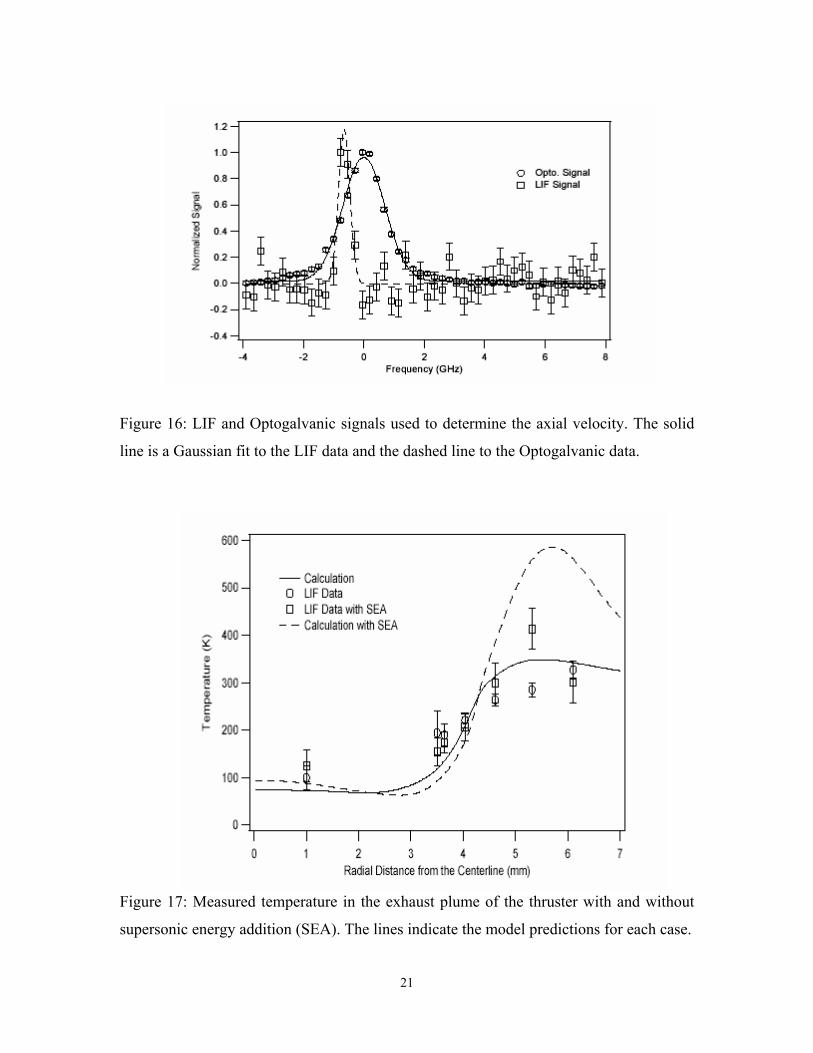
Figure 16: LIF and Optogalvanic signals used to determine the axial velocity. The solid
line is a Gaussian fit to the LIF data and the dashed line to the Optogalvanic data.
Figure 17: Measured temperature in the exhaust plume of the thruster with and without
supersonic energy addition (SEA). The lines indicate the model predictions for each case.
21

Figure 18: LIF data to determine the axial velocity along the centerline of the plume for
the case of supersonic energy addition.
22