las vegas valley executive summary · pdf filelas vegas valley executive summary commercial...
TRANSCRIPT
Las Vegas Valley Executive SummaryCommercial Real Estate Markets - 1st Quarter 2016
INDUSTRIAL OFFICE RETAIL
RCG Economics3900 Paradise Road, Suite 209Las Vegas, NV 89169T: (702) 967-3188F: (702) 967-3196W: www.rcg1.com
University of Nevada, Las VegasLied Institute for Real Estate StudiesLee Business School4505 Maryland ParkwayBox 456001Las Vegas, NV 89154-6001T: (702) 895-3362F: (702) 895-4090W: business.unlv.edu/lied
ContributorsJohn Restrepo - Co-Editor (RCG)[email protected] Coulson, Ph.D. - Co-Editor (UNLV)[email protected] Hensen - Real Estate Economist (RCG)[email protected] Fonseca - Researcher (UNLV)[email protected] Counts - Data Analyst (UNLV)[email protected]
Photos Courtesy of:Colliers: www.colliers.com/en-us/lasvegasCBRE: www.cbre.us/o/lasvegas/
CONTENTSINTRODUCTION
INDUSTRIAL SURVEY Total Industrial Market Industrial Employment Vacancy & Rental Rates Glossary Industrial Matrix Submarket Map
SPECULATIVE OFFICE SURVEY TotalOfficeMarket OfficeEmployment Vacancy & Rental Rates Glossary OfficeMatrix Submarket Map
ANCHORED RETAIL SURVEY Total Retail Market Retail Employment Vacancy & Rental Rates Glossary Retail Matrix Submarket Map
INDUSTRIAL OFFICE RETAIL
FIRST QUARTER 2016 2
3
4555
111214
15161617212224
25262627323334
May 20, 2016
Re: Commercial Real Estate Survey: 1st Quarter, 2016
Dear Reader,
RCG Economics and the UNLV Lied Institute for Real Estate Studies are excited to produce the Lied-RCG Commercial Real Estate Survey (“the Survey”) containing the most compre-hensive, timely and accurate data and analysis on the Las Vegas Valley’s industrial, specula-tive office and anchored retail markets.
RCG Economics has partnered with the Lied Institute to produce objective and independent quarterly surveys on the health and state of the commercial real estate market. RCG is a leader in real estate market research and analysis, including commercial real estate and economic forecasting. The Lied Institute seeks to advance real estate knowledge through research, student scholarship, certificate programs and community outreach activities.
The Survey is born of our commitment to excellence in serving those organizations requir-ing superior up-to-date market analysis and data to make key decisions. Developing this Private-Public Partnership to collect, analyze and release unbiased information is further proof of this commitment. Equally important, the data herein are collected as close as pos-sible to the end of each quarter.
This survey documents historical and current market conditions at the Valley and submar-ket levels. The data contained within are organized and tracked by our in-house research analysts and economists to provide the best analysis of Las Vegas’ commercial real estate markets. The survey contains a variety of meaningful market indicators, including:
Total existing inventory• New and planned construction activity• Vacancy and occupancy levels• Net Absorption• “Coupon” or quoted monthly rents•
Further, our three commercial (industrial, office and retail) databases contain benchmark building data, by submarket, dating back to 1996. This information allows us to develop “custom” studies for our readers and clients. It is through this survey and our other services and products, that we remain the “Source for Decision Makers.”
Regards,
John Restrepo Edward Coulson, Ph.DRCG Economics Lied Institute for Real Estate Studies-UNLV
4505 South Maryland ParkwayBEH 530BLas Vegas, Nevada 89154www.liedinstitute.com
3900 Paradise Road, Suite 209Las Vegas, Nevada 89169www.rcg1.com
MEDCO HEALTH BUILDING
WARM SPRINGS CROSSING
Las Vegas Industrial Survey1st Quarter 2016
FIRST QUARTER 2016 5
LAS VEGAS INDUSTRIAL SURVEYSUMMARYThe Las Vegas Valley’s (“the Valley”) Industrial market1 closed the first quarter (“Q1”) of 2016 with an market-wide inventory of 111.3 million square feet (“sf”), including completions of 190,000 sf for the quarter. Net absorption (net demand) during Q1 was -182,609 sf, marking an increase in the Valley’s Industrial vacancy rate of 0.3 points to 5.0% from 4.7% in Q4, 2015, but declining from 6.1% in Q1, 2015. At $0.77 per square foot (“psf”) NNN2, tthe average monthly asking rent was $0.07 psf higher than Q4 ($0.70 psf), and $0.19 above Q1, 2015 ($0.58 psf). At the close of Q1, Industrial forward-supply3 saw 3.4 million sf under construction with another 5.1 million sf in the planning stages. All under-construction space (100%) was in Warehouse/Distribution buildings. Performance metrics for the Valley’s Industrial market indicate that the Industrial market has now generally recovered and is again beginning to demonstrate consistent growth.
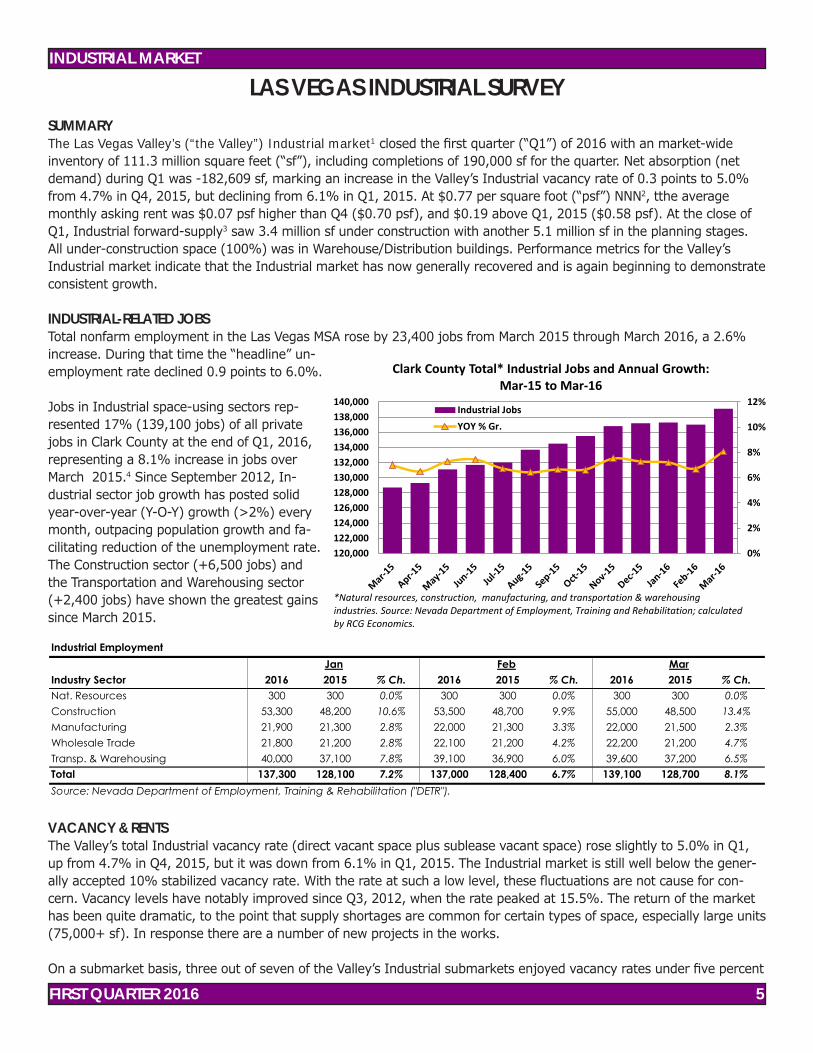
INDUSTRIAL-RELATED JOBSTotal nonfarm employment in the Las Vegas MSA rose by 23,400 jobs from March 2015 through March 2016, a 2.6% increase. During that time the “headline” un-employment rate declined 0.9 points to 6.0%.
Jobs in Industrial space-using sectors rep-resented 17% (139,100 jobs) of all private jobs in Clark County at the end of Q1, 2016, representing a 8.1% increase in jobs over March 2015.4 Since September 2012, In-dustrial sector job growth has posted solid year-over-year (Y-O-Y) growth (>2%) every month, outpacing population growth and fa-cilitating reduction of the unemployment rate. The Construction sector (+6,500 jobs) and the Transportation and Warehousing sector (+2,400 jobs) have shown the greatest gains since March 2015.
VACANCY & RENTSThe Valley’s total Industrial vacancy rate (direct vacant space plus sublease vacant space) rose slightly to 5.0% in Q1, up from 4.7% in Q4, 2015, but it was down from 6.1% in Q1, 2015. The Industrial market is still well below the gener-ally accepted 10% stabilized vacancy rate. With the rate at such a low level, these fluctuations are not cause for con-cern. Vacancy levels have notably improved since Q3, 2012, when the rate peaked at 15.5%. The return of the market has been quite dramatic, to the point that supply shortages are common for certain types of space, especially large units (75,000+ sf). In response there are a number of new projects in the works.
On a submarket basis, three out of seven of the Valley’s Industrial submarkets enjoyed vacancy rates under five percent
0%
2%
4%
6%
8%
10%
12%
120,000122,000124,000126,000128,000130,000132,000134,000136,000138,000140,000
Clark County Total* Industrial Jobs and Annual Growth:Mar-15 to Mar-16
Industrial JobsYOY % Gr.
*Natural resources, construction, manufacturing, and transportation & warehousing industries. Source: Nevada Department of Employment, Training and Rehabilitation; calculated by RCG Economics.
Industrial Employment
Industry Sector 2016 2015 % Ch. 2016 2015 % Ch. 2016 2015 % Ch.Nat. Resources 300 300 0.0% 300 300 0.0% 300 300 0.0%Construction 53,300 48,200 10.6% 53,500 48,700 9.9% 55,000 48,500 13.4%Manufacturing 21,900 21,300 2.8% 22,000 21,300 3.3% 22,000 21,500 2.3%Wholesale Trade 21,800 21,200 2.8% 22,100 21,200 4.2% 22,200 21,200 4.7%Transp. & Warehousing 40,000 37,100 7.8% 39,100 36,900 6.0% 39,600 37,200 6.5%Total 137,300 128,100 7.2% 137,000 128,400 6.7% 139,100 128,700 8.1%Source: Nevada Department of Employment, Training & Rehabilitation ("DETR").
Jan Feb Mar
INDUSTRIAL MARKET

at the end of Q1, with six of seven submarkets under 10%. On a quarter-over-quarter basis, only two submarkets post-ed declines in their vacancy rates. The North Las Vegas submarket again led the pack at 2.4%, down from 3.2%, and had the lowest vacancy rate of all seven submarkets. The East Las Vegas submarket’s vacancy rate also declined in Q1, dropping a percentage-point from 7.3% to 6.3%. Both the West Central and Henderson submarkets increased this quarter to 4.9%. The West Central increased 0.5 percentage-points to 4.9% in Q1, while Henderson’s rate ticked up 0.2 percentage-points this quarter. The Northwest submarket rate increased significantly, jump-ing 6.2 percentage-points from 4.5% in Q4, 2015 to 10.7% in Q1, 2016 and posting the highest vacancy rate of all the submarkets. This is not a troubling change, however. The large percentage-point change is attrib-uted to the fact that this submarket is very small and that a single new mid-sized availability can significantly alter the vacancy rate, which is exactly what happened in this case. The Airport submarket rate increased to 9.1% from 8.2%. The Southwest submarket also gained 1 point from 4.5% in Q4 to 5.5%.
On a Y-O-Y basis, the East and North Las Vegas submarkets saw the biggest drops in vacancy. The East Las Vegas sub-market vacancy rate was the most improved with a 4.5 percentage-point decline (10.8% in Q1, 2015), followed by the North Las Vegas submarket at 2.2 percentage-points. The Southwest submarket’s vacancy dropped by 1.2 percentage-points from 6.7% in Q1, 2015, followed by West Central (-0.9% from 5.8% in Q1, 2015) and Airport (-0.4% from 9.5% in Q1, 2015). Two Industrial submarkets experienced increases in vacancies: Henderson increased 1.2 percent-age-points from the Q1, 2015 vacancy rate of 3.7% and the Northwest submarket jumped 5.4 points.
On a product basis, all five types saw modest vacancy increases from Q4, 2015 to Q1, 2016. Light Distribution space vacancies increased the most, from 4.9% to 5.7%. Both Warehouse and Light Industrial vacancies increased to 3.9%, from 3.7% and 3.6%, respectively. Incuba-tor ticked up slightly from 8.7% to 8.9% and R&D/Flex increased from 12.2% to 12.7%.
On a Y-O-Y basis, every product’s vacancy rate improved except for Incubator, which posted a 0.3% increase from Q1, 2015. Light Distribution improved the most posting a 2.1-point drop between Q1, 2015 and Q1, 2016. R&D/Flex and Warehouse/Distribution followed with decreases of 1.1 and 1 percentage-point, respectively. Light Industrial rounded out the group with 0.8 percentage-point improve-ment.
As noted above, the overall Industrial market has recov-ered from the Great Recession. Some submarkets and subtypes are doing better than others, such as Ware-house/Distribution on the strong end and R&D/Flex on the weaker end, but now the conversation has shifted away
0%
2%
4%
6%
8%
10%
12%
14%
16%
Las Vegas Valley Industrial MarketVacancy Trends: Q1, 2015 v. Q1, 2016
Q1 '15Q1 '16
% Vacant, by Product
0%
2%
4%
6%
8%
10%
12%Q1 '15Q1 '16
% Vacant, by Submarket
$0.5
4
$0.5
8
$0.6
0
$0.5
9
$0.5
8
$0.6
6
$0.6
3
$0.7
0
$0.7
7
9.9%8.6%
7.7%6.5% 6.1% 5.4%
4.4% 4.7% 5.0%
$0.40
$0.50
$0.60
$0.70
$0.80
0%
2%
4%
6%
8%
10%
12%
14%
16%
$ PS
F Pe
r Mon
th (N
NN
)
% V
acan
t
Las Vegas Valley Industrial MarketHistorical Vacancy vs. Monthly Asking Rent:
Q1, 2014 - Q1, 2016
Asking Rental Rate Vacancy
FIRST QUARTER 2016 6
INDUSTRIAL MARKET

from which product types will recover faster to which ones are ready to expand and how the industry will deal with looming shortages.
Average monthly Industrial asking rents for all product types (calculated on a NNN basis, not accounting for any operating expenses and based on quoted asking rents, not negotiated rents between owners and tenants) increased in Q1 by $0.07 to $0.77 per sf, up from $0.70 in Q4, 2015. On average, Industrial rents are up $0.19 since Q1, 2015.
DEMANDDemand (defined as total net absorption) in the Valley’s Industrial market was negative (-182,609 sf) after 13 straight quarters of positive absorption.
On a Y-O-Y basis, Q1 saw a notable decrease with 4.1 million sf of absorption compared to 4.8 million sf during the four quarters ending in Q1, 2015. This is to be expected, however, because there is less space available to absorb. Further-more, in various segments of the market, shortages are occurring. New space will have to regularly come to market to keep absorp-tion as high as it has been with so little unoc-cupied space remaining in the market. The shortage of space could be blunting economic growth.
Five of seven submarkets had negative ab-sorption in Q1, 2016. The North Las Vegas submarket saw the highest net absorption with +249,294 sf, with East Las Vegas ab-sorbing +32,780 sf. Henderson had modest negative absorption of -23,992, with the Northwest and West Central submarkets showing negative absorption of -83,339 sf and -64,392 sf, respectively. The Airport (-133,991 sf) and Southwest (-158,969 sf) submarkets came in last with the highest negative absorption for Q1.
The top submarkets, on a Y-O-Y basis, were North Las Vegas (+2.2 million sf) and Southwest (+1.2 million sf). The East Las Vegas submarket also had a good year at +486,566 sf, with the Airport submarket trailing behind with less than half that at +229,543 sf. The West Central submarket remained positive at +110,133 sf, while the Northwest (-71,547 sf) and Henderson (-124,569 sf) submarkets both failed to show positive demand for the year.
Demand in Q1 for the different product types was positive only in Light Industrial with +96,725 sf absorbed. Incubator (-13,463 sf), R&D/Flex (-27,397 sf), Warehouse/Distribution (-107,258 sf) and Light Distribution (-131,216 sf) all saw negative absorption this quarter.
Despite the negative absorption in the latest quarter, over the past year the Valley’s Industrial market has seen strong demand. Warehouse/Distribution space has driven the market, accounting for 3.2 million of approximately 4.1 million sf of absorbed Industrial space in the last four quarters.
4,66
6,44
7
4,91
1,55
0
4,48
5,45
2
5,13
2,98
1
4,83
4,40
6
4,39
3,50
5
5,65
3,74
1
4,79
3,80
3
4,07
2,79
3
773,
473
920,
000
607,
490
607,
490
586,
992
583,
195 1,
975,
405
2,93
4,08
9
3,07
2,58
7
0
1,000,000
2,000,000
3,000,000
4,000,000
5,000,000
6,000,000
SF
Las Vegas Valley Industrial MarketHistorical YOY Net Absorption vs. Completions:
Q1, 2014 - Q1, 2016
Net Absorption Completions
FIRST QUARTER 2016 7
INDUSTRIAL MARKET
0.0%
0.5%
1.0%
1.5%
2.0%
2.5%
Las Vegas Valley Industrial MarketCompletions as a % of Inventory:
Q1, 2003 - Q1, 2016
SUPPLYThere was one completion in Q1, totaling 190,000 sf of space, increasing the total Industrial inventory to 111.3 million sf. The last three years have demonstrated hesitant optimism from a complete absence of Industrial space comple-tions in 2012 to 801,500 sf of Industrial space completed in 2013, followed by a more conservative 609,400 sf of space debuting in 2014. In 2015, the market added 2.9 million sf of space. The new space – which plays such a critical role in Southern Nevada’s continued economic growth and development—offers a welcome respite for a market that is has become severely supply-constrained in certain market segments.
The Q1, 2016 completion was the Ainsworth Americas Headquarters, 190,000 sf of Light Industrial space in the South-west submarket. Completions for 2016 are currently estimated to be 7.7 million square feet, which would be a large increase over 2015.
There are currently ten projects under construction at the end of Q1, which supports the ongoing trend of new Ware-house/Distribution development:
On top of all the ongoing construction, there are 14 additional projects in the planning stages. They are:
These projects continue to help power Southern Nevada’s economic recovery and its positioning as a mid-size distribu-tion hub. Additionally, as the chart below demonstrates, the critical shortage of available Industrial space over 100,000 sf has affected the region’s rate of economic recovery and growth during the last few years. However, as we’ve noted several times, relief is on the way; with 10 projects currently under construction and 14 more in the planning stages,
FIRST QUARTER 2016 8
INDUSTRIAL MARKET
Under ConstructionProject SF Subtype Submarket Exp. Comp.Black Mountain Distribution Center #3 232,826 Warehouse/Distribution Henderson Q216Blue Diamond Business Center #3 167,280 Warehouse/Distribution Southwest Q216Cheyenne Distribution Center #3 163,790 Warehouse/Distribution North Las Vegas Q216Henderson Commerce Center 240,000 Warehouse/Distribution Henderson Q416Henderson Freeway Crossing 452,170 Warehouse/Distribution Henderson Q316Jones Corporate Park 416,000 Warehouse/Distribution Southwest Q216North 15 Freeway Distribution Center 1-2 410,640 Warehouse/Distribution North Las Vegas Q316Northgate Distribution Center, Bdlg. 1-2 806,040 Warehouse/Distribution North Las Vegas Q316Parc Post 165,234 Warehouse/Distribution Southwest Q216Sunpoint Business Center 311,246 Warehouse/Distribution East Las Vegas Q216Total 3,365,000
PlannedProject SF Subtype Submarket Exp. Comp.Beltway Distribution Center 211,188 Warehouse/Distribution Southwest Q416Blue Diamond Business Center #10 495,000 Warehouse/Distribution Southwest 2016Blue Diamond Business Center #6 430,000 Warehouse/Distribution Southwest Q316Desert Inn Distribution Center 153,320 Warehouse/Distribution West Central Q317Lone Mountain Corporate Center-Phase 2 243,760 Warehouse/Distribution North Las Vegas 2016Northern Beltway Industrial Center 540,320 Warehouse/Distribution North Las Vegas 2016South 15 Airport Center 479,440 Warehouse/Distribution Henderson Q316Speedway Commerce Center West 737,000 Warehouse/Distribution North Las Vegas 2016Sunrise Industrial Park #9-10 787,760 Warehouse/Distribution East Las Vegas Q416Sunset Development Partners 54,000 Light Industrial Airport Q416Supernap 10 (SWITCH) 343,436 Warehouse/Distribution Southwest 2016Supernap 11 (SWITCH) 343,436 Warehouse/Distribution Southwest 2017Supernap 12 (SWITCH) 168,040 Warehouse/Distribution Southwest 2017Torrey Park 73,000 Warehouse/Distribution Southwest 2017Total 5,060,000
Southern Nevada can expect to see significant additions in the Industrial market. These new projects should ease the existing shortage is-sues.
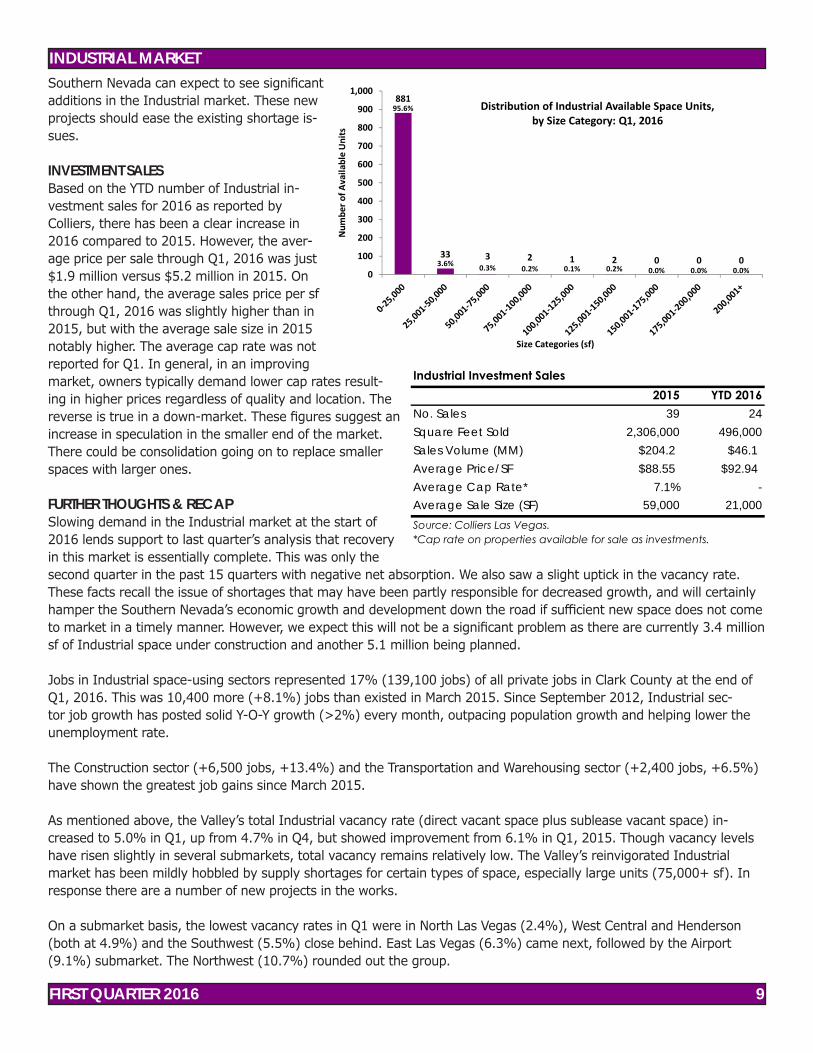
INVESTMENT SALESBased on the YTD number of Industrial in-vestment sales for 2016 as reported by Colliers, there has been a clear increase in 2016 compared to 2015. However, the aver-age price per sale through Q1, 2016 was just $1.9 million versus $5.2 million in 2015. On the other hand, the average sales price per sf through Q1, 2016 was slightly higher than in 2015, but with the average sale size in 2015 notably higher. The average cap rate was not reported for Q1. In general, in an improving market, owners typically demand lower cap rates result-ing in higher prices regardless of quality and location. The reverse is true in a down-market. These figures suggest an increase in speculation in the smaller end of the market. There could be consolidation going on to replace smaller spaces with larger ones.
FURTHER THOUGHTS & RECAPSlowing demand in the Industrial market at the start of 2016 lends support to last quarter’s analysis that recovery in this market is essentially complete. This was only the second quarter in the past 15 quarters with negative net absorption. We also saw a slight uptick in the vacancy rate. These facts recall the issue of shortages that may have been partly responsible for decreased growth, and will certainly hamper the Southern Nevada’s economic growth and development down the road if sufficient new space does not come to market in a timely manner. However, we expect this will not be a significant problem as there are currently 3.4 million sf of Industrial space under construction and another 5.1 million being planned.
Jobs in Industrial space-using sectors represented 17% (139,100 jobs) of all private jobs in Clark County at the end of Q1, 2016. This was 10,400 more (+8.1%) jobs than existed in March 2015. Since September 2012, Industrial sec-tor job growth has posted solid Y-O-Y growth (>2%) every month, outpacing population growth and helping lower the unemployment rate.
The Construction sector (+6,500 jobs, +13.4%) and the Transportation and Warehousing sector (+2,400 jobs, +6.5%) have shown the greatest job gains since March 2015.
As mentioned above, the Valley’s total Industrial vacancy rate (direct vacant space plus sublease vacant space) in-creased to 5.0% in Q1, up from 4.7% in Q4, but showed improvement from 6.1% in Q1, 2015. Though vacancy levels have risen slightly in several submarkets, total vacancy remains relatively low. The Valley’s reinvigorated Industrial market has been mildly hobbled by supply shortages for certain types of space, especially large units (75,000+ sf). In response there are a number of new projects in the works.
On a submarket basis, the lowest vacancy rates in Q1 were in North Las Vegas (2.4%), West Central and Henderson (both at 4.9%) and the Southwest (5.5%) close behind. East Las Vegas (6.3%) came next, followed by the Airport (9.1%) submarket. The Northwest (10.7%) rounded out the group.
881
33 3 2 1 2 0 0 0
95.6%
3.6% 0.3% 0.2% 0.1% 0.2% 0.0% 0.0% 0.0%0
100
200
300
400
500
600
700
800
900
1,000
Num
bero
fAvailableUnits
Size Categories (sf)
Distribution of Industrial Available Space Units,by Size Category: Q1, 2016
FIRST QUARTER 2016 9
INDUSTRIAL MARKET
Industrial Investment Sales2015 YTD 2016
No. Sales 39 24Square Feet Sold 2,306,000 496,000Sales Volume (MM) $204.2 $46.1Average Price/SF $88.55 $92.94Average Cap Rate* 7.1% -Average Sale Size (SF) 59,000 21,000Source: Colliers Las Vegas.*Cap rate on properties available for sale as investments.
INDUSTRIAL MARKET
FIRST QUARTER 2016 10
The growth of e-commerce along with multi-channel (Internet, mobile, bricks-and-mortar) selling by traditional and non-traditional retailers is unquestionably the long-term driver of the demand for Industrial space in Southern Nevada, as it has been in other parts of the U.S. Southern Nevada’s location, adjacent to Southern California, will make it an im-portant regional warehouse-distribution-fulfillment enclave. Southern Nevada appears to be on the verge of establishing an advanced manufacturing cluster with the December 2015 announcement of the Faraday Future electric car company establishing a plant in North Las Vegas. ___________________________
1 Includes all single and multi-tenant for-lease and owner-occupied industrial Warehouse/Distribution, Light Distribution, Light Industrial, Incubator and R&D Flex properties with roll-up doors in the Las Vegas Valley.
2 All industrial rents in this report are quoted on a monthly triple net (NNN) per square foot basis and does not include additional expenses such as taxes, insurance, maintenance, janitorial and utilities. Rents are based on the direct vacant space in projects, not the average of leases in projects.
3 Forward-supply is a combination of space presently under construction in a quarter and space planned to begin construc-tion within the next 4 quarters.
4 Includes the following industries: Natural Resources, Construction, Manufacturing, and Transportation & Warehousing and Wholesale Trade from the Nevada Department of Employment, Training and Rehabilitation’s latest employment statistics.

INDUSTRIAL MARKET GLOSSARYProperties tracked have loading dock-grade-level doors. Building characteristics were used to define the appropriate sub-type classification. These characteristics can include a building’s primary use, size, type of loading doors, clear heights and parking ratios. A property must exhibit one or more of the typical building characteristics to be classified into subtypes.
Warehouse/DistributionThese buildings are the largest among the subtypes and are used for warehousing and distributing materials and mer-chandise. Warehouse facilities are primarily used for storage and distribution buildings are warehouse facilities designed to accommodate the freight and movement of products/goods.
•Multi- or single-tenant,•Building/park size of at least 10,000 sf,•Dock-high doors (or grade-level doors) and clear heights of at least 16 feet, and•Parking ratios of: 1-2/1,000 sf - traditional warehouse/distribution 3-4/1,000 sf - high velocity warehouse/distribution.
Light DistributionThese buildings are primarily used as a distribution transfer center for the transshipment of products/goods (usually to change the mode of transport or for consolidation or deconsolidation of goods before shipment).
•Multi- or single-tenant,•Building/park size of at least 5,000 sf, usually characterized by long narrow buildings,•Cross-dock doors (or several dock high doors) with 12-16 feet clear height to accommodatetransfer to/from multiple trucks, and•Parking ratios of: 1-2/1,000 sf - traditional warehouse/distribution 3-4/1,000 sf - high velocity warehouse/distribution.
Light IndustrialThese buildings are primarily used for light industrial manufacturing (rather than heavy industrial manufacturing that uses large amounts of raw materials, power and space) to produce and/or assemble products/goods for consumers as end-users.
•Multi- or single-tenant,•Building/park size of at least 7,000 sf,•Grade-level doors (or dock-high doors) and clear heights usually between 13 feet and 18 feet, and•Parking ratio of 4+/1,000 sf.
IncubatorBuildings or portions of buildings that accommodate companies in the early phase of growth. The typical user generally needs 1,000 to 3,000 sf of warehouse space plus 5% to 20% earmarked for office space with the remaining being the warehouse space. Because of its lower space needs, an incubator tenant is usually a low-volume business needing more less frequent packing and unpacking activity and smaller shipment sizes.
•Multi-tenant,•Building/park size of at least 5,000 sf,•Grade-level doors with clear heights less than 15 feet, and•Parking ratio: Less than 3/1,000 sf.
R&D/FlexThese buildings are the smallest among the subtypes and are designed to allow its occupants to easily alternate uses as industrial space or office space. This may include:
•Industrial space generally as light industrial or incubator; and•Office space generally as research and development (R&D) parks.•Multi- or single-tenant,•Building/park size of at least 2,000 sf,•Grade-level doors with clear heights less than 15 feet, and•Parking ratio of 3-4/1,000 sf.
FIRST QUARTER 2016 11
INDUSTRIAL MARKET
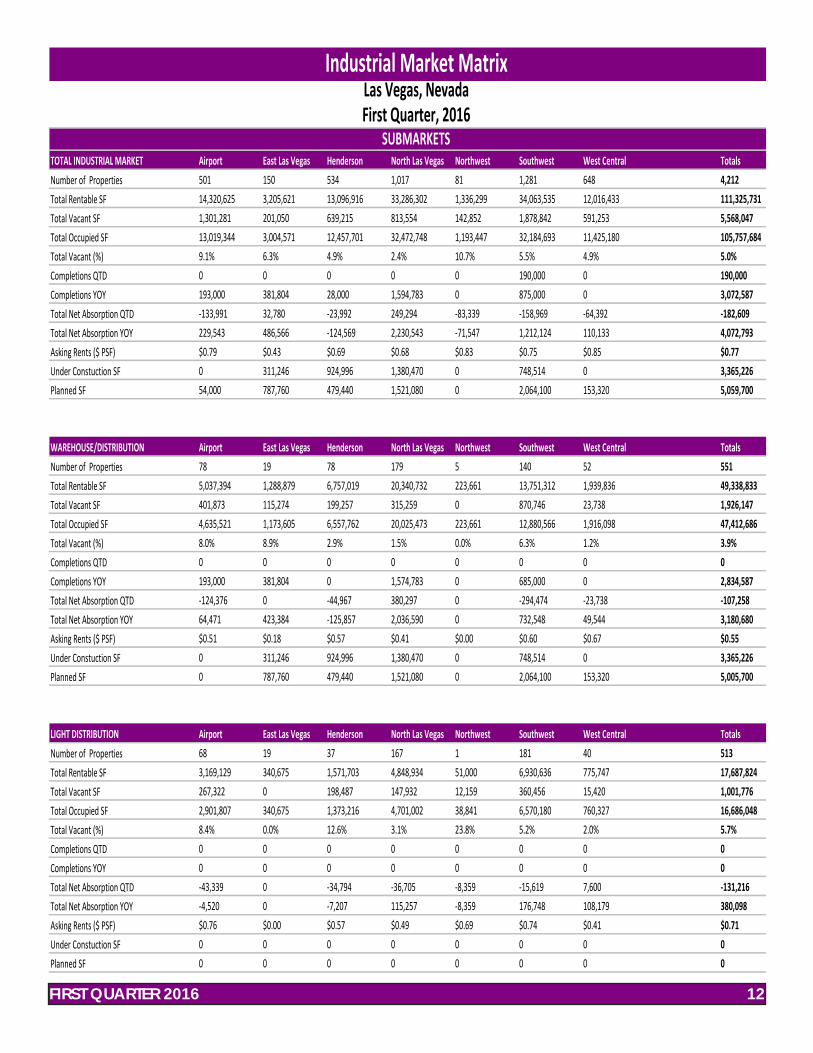
TOTAL INDUSTRIAL MARKET Airport East Las Vegas Henderson North Las Vegas Northwest Southwest West Central TotalsNumber of Properties 501 150 534 1,017 81 1,281 648 4,212Total Rentable SF 14,320,625 3,205,621 13,096,916 33,286,302 1,336,299 34,063,535 12,016,433 111,325,731Total Vacant SF 1,301,281 201,050 639,215 813,554 142,852 1,878,842 591,253 5,568,047Total Occupied SF 13,019,344 3,004,571 12,457,701 32,472,748 1,193,447 32,184,693 11,425,180 105,757,684Total Vacant (%) 9.1% 6.3% 4.9% 2.4% 10.7% 5.5% 4.9% 5.0%Completions QTD 0 0 0 0 0 190,000 0 190,000Completions YOY 193,000 381,804 28,000 1,594,783 0 875,000 0 3,072,587Total Net Absorption QTD -133,991 32,780 -23,992 249,294 -83,339 -158,969 -64,392 -182,609Total Net Absorption YOY 229,543 486,566 -124,569 2,230,543 -71,547 1,212,124 110,133 4,072,793Asking Rents ($ PSF) $0.79 $0.43 $0.69 $0.68 $0.83 $0.75 $0.85 $0.77Under Constuction SF 0 311,246 924,996 1,380,470 0 748,514 0 3,365,226Planned SF 54,000 787,760 479,440 1,521,080 0 2,064,100 153,320 5,059,700
WAREHOUSE/DISTRIBUTION Airport East Las Vegas Henderson North Las Vegas Northwest Southwest West Central TotalsNumber of Properties 78 19 78 179 5 140 52 551Total Rentable SF 5,037,394 1,288,879 6,757,019 20,340,732 223,661 13,751,312 1,939,836 49,338,833Total Vacant SF 401,873 115,274 199,257 315,259 0 870,746 23,738 1,926,147Total Occupied SF 4,635,521 1,173,605 6,557,762 20,025,473 223,661 12,880,566 1,916,098 47,412,686Total Vacant (%) 8.0% 8.9% 2.9% 1.5% 0.0% 6.3% 1.2% 3.9%Completions QTD 0 0 0 0 0 0 0 0Completions YOY 193,000 381,804 0 1,574,783 0 685,000 0 2,834,587Total Net Absorption QTD -124,376 0 -44,967 380,297 0 -294,474 -23,738 -107,258Total Net Absorption YOY 64,471 423,384 -125,857 2,036,590 0 732,548 49,544 3,180,680Asking Rents ($ PSF) $0.51 $0.18 $0.57 $0.41 $0.00 $0.60 $0.67 $0.55Under Constuction SF 0 311,246 924,996 1,380,470 0 748,514 0 3,365,226Planned SF 0 787,760 479,440 1,521,080 0 2,064,100 153,320 5,005,700
LIGHT DISTRIBUTION Airport East Las Vegas Henderson North Las Vegas Northwest Southwest West Central TotalsNumber of Properties 68 19 37 167 1 181 40 513Total Rentable SF 3,169,129 340,675 1,571,703 4,848,934 51,000 6,930,636 775,747 17,687,824Total Vacant SF 267,322 0 198,487 147,932 12,159 360,456 15,420 1,001,776Total Occupied SF 2,901,807 340,675 1,373,216 4,701,002 38,841 6,570,180 760,327 16,686,048Total Vacant (%) 8.4% 0.0% 12.6% 3.1% 23.8% 5.2% 2.0% 5.7%Completions QTD 0 0 0 0 0 0 0 0Completions YOY 0 0 0 0 0 0 0 0Total Net Absorption QTD -43,339 0 -34,794 -36,705 -8,359 -15,619 7,600 -131,216Total Net Absorption YOY -4,520 0 -7,207 115,257 -8,359 176,748 108,179 380,098Asking Rents ($ PSF) $0.76 $0.00 $0.57 $0.49 $0.69 $0.74 $0.41 $0.71Under Constuction SF 0 0 0 0 0 0 0 0Planned SF 0 0 0 0 0 0 0 0
Industrial Market MatrixLas Vegas, NevadaFirst Quarter, 2016
SUBMARKETS
FIRST QUARTER 2016 12
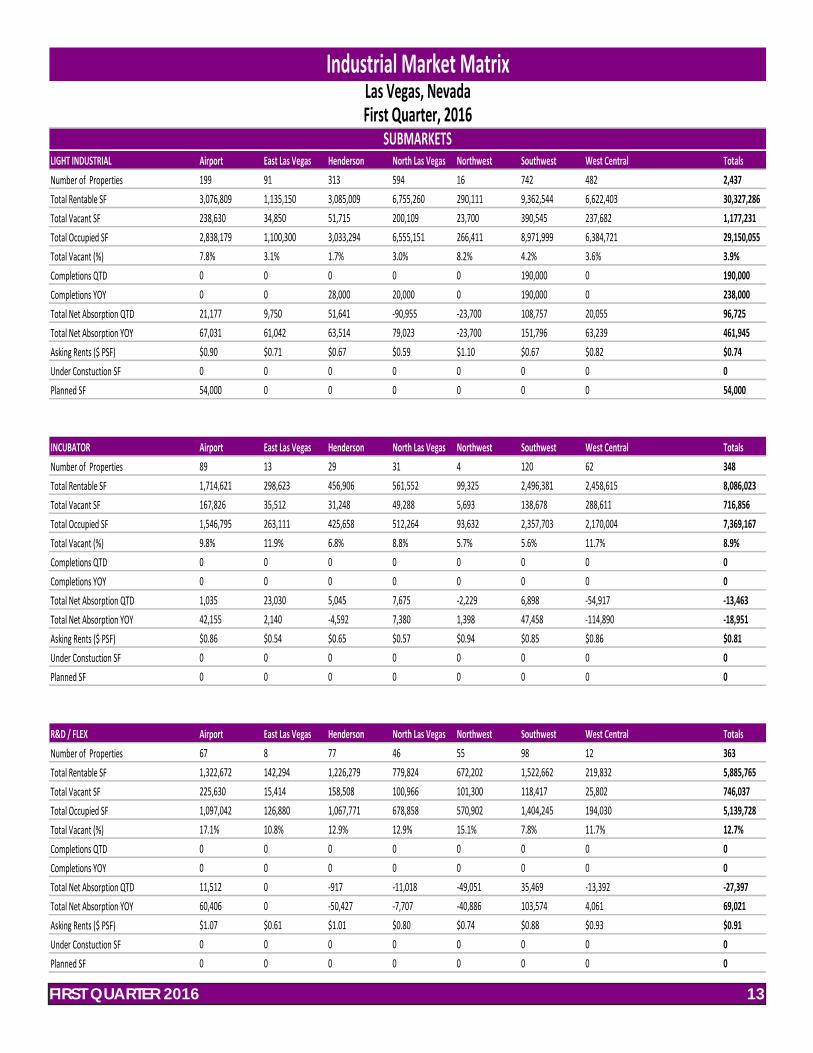
LIGHT INDUSTRIAL Airport East Las Vegas Henderson North Las Vegas Northwest Southwest West Central TotalsNumber of Properties 199 91 313 594 16 742 482 2,437Total Rentable SF 3,076,809 1,135,150 3,085,009 6,755,260 290,111 9,362,544 6,622,403 30,327,286Total Vacant SF 238,630 34,850 51,715 200,109 23,700 390,545 237,682 1,177,231Total Occupied SF 2,838,179 1,100,300 3,033,294 6,555,151 266,411 8,971,999 6,384,721 29,150,055Total Vacant (%) 7.8% 3.1% 1.7% 3.0% 8.2% 4.2% 3.6% 3.9%Completions QTD 0 0 0 0 0 190,000 0 190,000Completions YOY 0 0 28,000 20,000 0 190,000 0 238,000Total Net Absorption QTD 21,177 9,750 51,641 -90,955 -23,700 108,757 20,055 96,725Total Net Absorption YOY 67,031 61,042 63,514 79,023 -23,700 151,796 63,239 461,945Asking Rents ($ PSF) $0.90 $0.71 $0.67 $0.59 $1.10 $0.67 $0.82 $0.74Under Constuction SF 0 0 0 0 0 0 0 0Planned SF 54,000 0 0 0 0 0 0 54,000
INCUBATOR Airport East Las Vegas Henderson North Las Vegas Northwest Southwest West Central TotalsNumber of Properties 89 13 29 31 4 120 62 348Total Rentable SF 1,714,621 298,623 456,906 561,552 99,325 2,496,381 2,458,615 8,086,023Total Vacant SF 167,826 35,512 31,248 49,288 5,693 138,678 288,611 716,856Total Occupied SF 1,546,795 263,111 425,658 512,264 93,632 2,357,703 2,170,004 7,369,167Total Vacant (%) 9.8% 11.9% 6.8% 8.8% 5.7% 5.6% 11.7% 8.9%Completions QTD 0 0 0 0 0 0 0 0Completions YOY 0 0 0 0 0 0 0 0Total Net Absorption QTD 1,035 23,030 5,045 7,675 -2,229 6,898 -54,917 -13,463Total Net Absorption YOY 42,155 2,140 -4,592 7,380 1,398 47,458 -114,890 -18,951Asking Rents ($ PSF) $0.86 $0.54 $0.65 $0.57 $0.94 $0.85 $0.86 $0.81Under Constuction SF 0 0 0 0 0 0 0 0Planned SF 0 0 0 0 0 0 0 0
R&D / FLEX Airport East Las Vegas Henderson North Las Vegas Northwest Southwest West Central TotalsNumber of Properties 67 8 77 46 55 98 12 363Total Rentable SF 1,322,672 142,294 1,226,279 779,824 672,202 1,522,662 219,832 5,885,765Total Vacant SF 225,630 15,414 158,508 100,966 101,300 118,417 25,802 746,037Total Occupied SF 1,097,042 126,880 1,067,771 678,858 570,902 1,404,245 194,030 5,139,728Total Vacant (%) 17.1% 10.8% 12.9% 12.9% 15.1% 7.8% 11.7% 12.7%Completions QTD 0 0 0 0 0 0 0 0Completions YOY 0 0 0 0 0 0 0 0Total Net Absorption QTD 11,512 0 -917 -11,018 -49,051 35,469 -13,392 -27,397Total Net Absorption YOY 60,406 0 -50,427 -7,707 -40,886 103,574 4,061 69,021Asking Rents ($ PSF) $1.07 $0.61 $1.01 $0.80 $0.74 $0.88 $0.93 $0.91Under Constuction SF 0 0 0 0 0 0 0 0Planned SF 0 0 0 0 0 0 0 0
Industrial Market MatrixLas Vegas, NevadaFirst Quarter, 2016
SUBMARKETS
FIRST QUARTER 2016 13
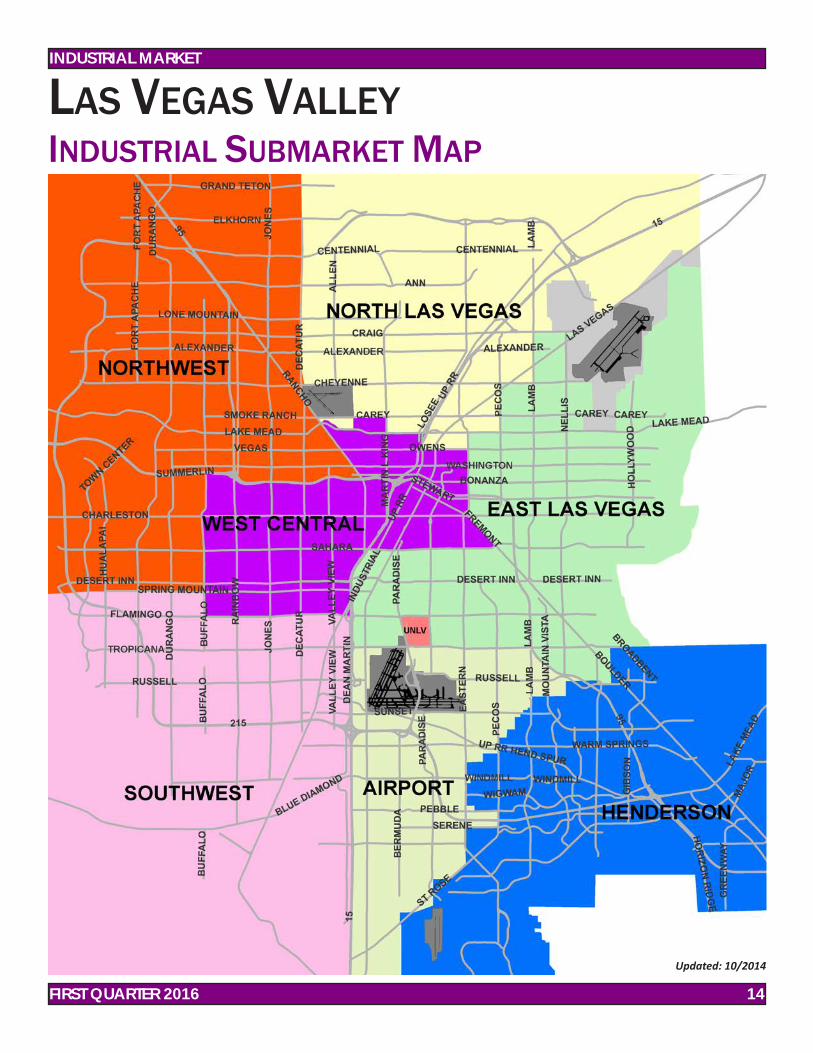
LAS VEGAS VALLEYINDUSTRIAL SUBMARKET MAP
FIRST QUARTER 2016 14
INDUSTRIAL MARKET
Updated: 10/2014

CORPORATE CENTER, Ph. 3
UNITED HEALTH CARE BUILDING
Las Vegas Speculative Office Survey1st Quarter 2016

LAS VEGAS SPECULATIVE OFFICE SURVEYSUMMARYThe Las Vegas Valley’s (“the Valley”) multi-tenant, Speculative Office market1 saw 15,788 square feet (“sf”) of new space come to market during the first quarter (“Q1”) of 2016, raising the total inventory to 43.1 million sf. Falling demand for new space in the first quarter 2016 was substantiated with both an increase in vacancy, from 18.4% in Q4, 2015 to 18.7% in Q1, 2016 and a slight decrease in average monthly asking rents, which fell to $1.89 per square foot (“psf”) FSG2, from $1.97 psf in Q4, 2015. There was also net negative absorption (-130,802 sf) in Q1 serving to corroborate a decrease in demand after positive absorption and sustained demand in 10 out of the 11 previous quarters.
OFFICE-RELATED JOBSTotal nonfarm employment in the Las Vegas MSA rose by 23,400 jobs from March 2015 through March 2016, a 2.6% increase. During that time the “headline” unemployment rate declined 0.9 points to 6.0%.
Employment in the Office-using sector, a critical indicator of the health of the lo-cal economy and the region’s population growth, comprised 32% (262,300 jobs) of all private payroll jobs in Clark County at the end of Q1 (March 2016). This was 6,700 jobs more (+2.6%) than existed in March 2015.3
A February bump in Office employment of 3.3%, balanced by January and March growth of 2.2% and 2.6%, respectively, brings the Q1, 2016 average to 2.7%, a decline from the Q4, 2015 growth of 4.9%. A year-over-year (‘Y-O-Y”) in-crease of 6,700 Office jobs indicates posi-tive growth for the year, with most of the total jobs supplied by the the Health Care and Social Assistance sector (6,100). The Professional & Business and the Financial Activities sectors netted much smaller gains of 700 and 300 jobs, with the Infor-mation sector seeing a reduction of -400 jobs for the year.
0%
1%
2%
3%
4%
5%
6%
7%
8%
248,000250,000252,000254,000256,000258,000260,000262,000264,000266,000268,000
Clark County Total* Office Jobs and Annual Growth:Mar-15 to Mar-16
Office JobsYOY % Gr.
*Information, financial activities, professional & business and health care & social assistance. Source: Nevada Department of Employment, Training and Rehabilitation; calculated by RCG Economics.
$1.7
8
$1.8
0
$1.8
8
$1.9
1
$1.8
9
$1.9
4
$1.9
1
$1.9
7
$1.8
9
20.4%19.9%
18.9%18.9% 19.0% 18.9%18.5% 18.4%
18.7%
$1.70
$1.75
$1.80
$1.85
$1.90
$1.95
$2.00
16%
17%
18%
19%
20%
21%
22%$
PSF
Per M
onth
(FSG
)
% V
acan
t
Las Vegas Valley Office MarketHistorical Vacancy vs. Monthly Asking Rent:
Q1, 2014- Q1, 2016
Asking Rental Rate Vacancy
Office Employment
Industry Sector 2016 2015 % Ch. 2016 2015 % Ch. 2016 2015 % Ch.Information 10,100 10,300 -1.9% 10,300 10,700 -3.7% 10,200 10,600 -3.8%Financial Activities 43,600 44,300 -1.6% 44,200 44,800 -1.3% 45,300 45,000 0.7%Prof. & Business 125,700 124,700 0.8% 125,600 123,100 2.0% 125,000 124,300 0.6%Health Care & Social Assist. 80,100 74,700 7.2% 82,000 75,200 9.0% 81,800 75,700 8.1%Total 259,500 254,000 2.2% 262,100 253,800 3.3% 262,300 255,600 2.6%Source: Nevada Department of Employment, Training & Rehabilitation ("DETR").
Jan Feb Mar
FIRST QUARTER 2016 16
SPECULATIVE OFFICE MARKET
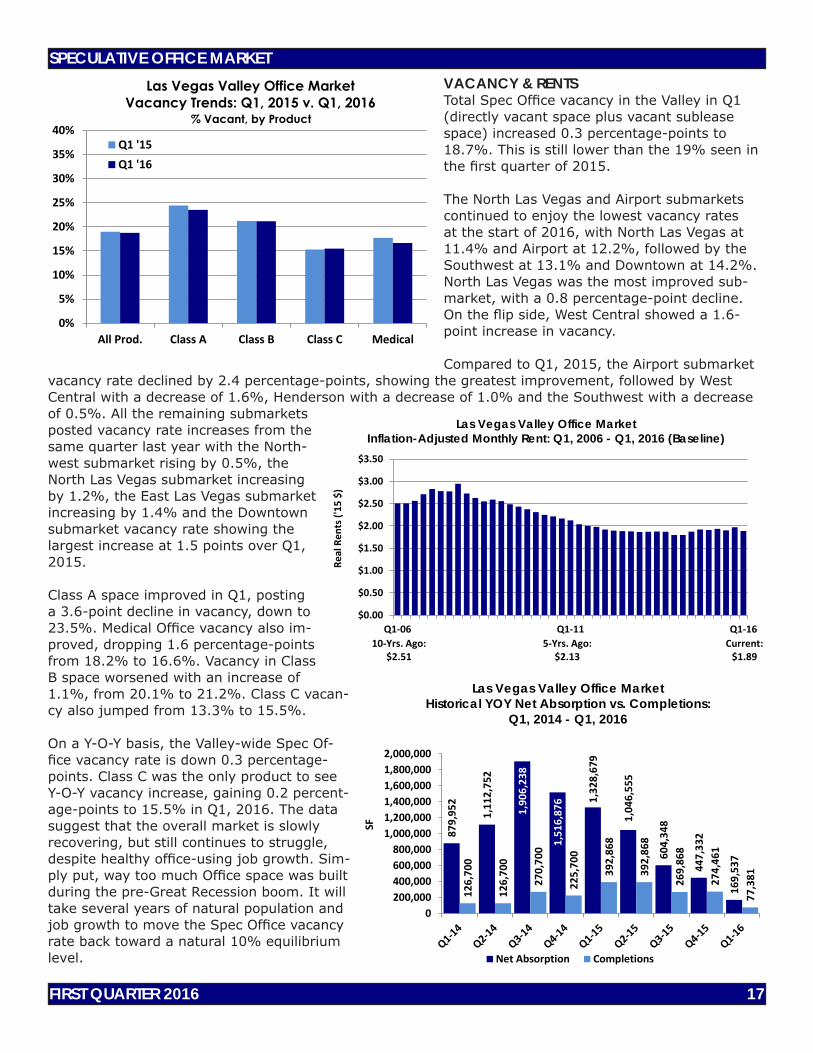
VACANCY & RENTSTotal Spec Office vacancy in the Valley in Q1 (directly vacant space plus vacant sublease space) increased 0.3 percentage-points to 18.7%. This is still lower than the 19% seen in the first quarter of 2015.
The North Las Vegas and Airport submarkets continued to enjoy the lowest vacancy rates at the start of 2016, with North Las Vegas at 11.4% and Airport at 12.2%, followed by the Southwest at 13.1% and Downtown at 14.2%. North Las Vegas was the most improved sub-market, with a 0.8 percentage-point decline. On the flip side, West Central showed a 1.6-point increase in vacancy.
Compared to Q1, 2015, the Airport submarket vacancy rate declined by 2.4 percentage-points, showing the greatest improvement, followed by West Central with a decrease of 1.6%, Henderson with a decrease of 1.0% and the Southwest with a decrease of 0.5%. All the remaining submarkets posted vacancy rate increases from the same quarter last year with the North-west submarket rising by 0.5%, the North Las Vegas submarket increasing by 1.2%, the East Las Vegas submarket increasing by 1.4% and the Downtown submarket vacancy rate showing the largest increase at 1.5 points over Q1, 2015.
Class A space improved in Q1, posting a 3.6-point decline in vacancy, down to 23.5%. Medical Office vacancy also im-proved, dropping 1.6 percentage-points from 18.2% to 16.6%. Vacancy in Class B space worsened with an increase of 1.1%, from 20.1% to 21.2%. Class C vacan-cy also jumped from 13.3% to 15.5%.
On a Y-O-Y basis, the Valley-wide Spec Of-fice vacancy rate is down 0.3 percentage-points. Class C was the only product to see Y-O-Y vacancy increase, gaining 0.2 percent-age-points to 15.5% in Q1, 2016. The data suggest that the overall market is slowly recovering, but still continues to struggle, despite healthy office-using job growth. Sim-ply put, way too much Office space was built during the pre-Great Recession boom. It will take several years of natural population and job growth to move the Spec Office vacancy rate back toward a natural 10% equilibrium level.
0%
5%
10%
15%
20%
25%
30%
35%
40%
All Prod. Class A Class B Class C Medical
Las Vegas Valley Office MarketVacancy Trends: Q1, 2015 v. Q1, 2016
Q1 '15Q1 '16
% Vacant, by Product
10-Yrs. Ago: $2.51
5-Yrs. Ago:$2.13
Current: $1.89
$0.00
$0.50
$1.00
$1.50
$2.00
$2.50
$3.00
$3.50
Q1-06 Q1-11 Q1-16
Real
Ren
ts ('
15 $
)
Las Vegas Valley Office MarketInflation-Adjusted Monthly Rent: Q1, 2006 - Q1, 2016 (Baseline)
879,
952
1,11
2,75
2
1,90
6,23
8
1,51
6,87
6 1,32
8,67
9
1,04
6,55
5
604,
348
447,
332
169,
537
126,
700
126,
700
270,
700
225,
700
392,
868
392,
868
269,
868
274,
461
77,3
81
0200,000400,000600,000800,000
1,000,0001,200,0001,400,0001,600,0001,800,0002,000,000
SF
Las Vegas Valley Office MarketHistorical YOY Net Absorption vs. Completions:
Q1, 2014 - Q1, 2016
Net Absorption Completions
FIRST QUARTER 2016 17
SPECULATIVE OFFICE MARKET
The overall average monthly Spec Office rent (calculated on a full-service gross basis—accounting for all operating expenses) was $1.89 per square foot (“psf”) in Q1, $0.08 less than the $1.97 psf asking rent in the previous quarter. Remember, the rents herein are based on quoted asking rents, not negotiated rents between owners and tenants.
DEMANDValley-wide Spec Office net absorption in Q1 was negative at -130,802 sf. On a Y-O-Y basis, net absorption totaled +169,537 sf – a sizable decline from the 1.3 million recorded for the same period in 2015. Y-O-Y absorption has now been trending down for six quarters after peaking in Q3, 2014. There is reason to be-lieve that this is at least partially due to the quality of the remaining available space in the market. How-ever, taken in conjunction with other data points, we may be seeing an overall decline in market demand.
Only three of the eight submarkets in the Valley saw improvement in Q1, and the gains were small. The Henderson (+44,312 sf) submarket led in growth for Q1. Two other submarkets also remained in positive territory: Airport (+13,178 sf) and North Las Vegas (+5,655). Negative absorption this quarter was more substantial: the Southwest (-2,081 sf), Northwest (-17,526 sf), Downtown (-22,235 sf), East Las Vegas (-65,874 sf) and West Central (-86,231 sf) submarkets all saw decreasing demand.
On a product-basis for the quarter the roles were reversed from Q4 with Class A (+228,299 sf) and Medi-cal (+112,976 sf) showing substantial gains. Class B and Class C were hit this time around (-142,641 sf and -329,436 sf respectively), bringing total net absorption below zero for the first quarter of 2016.
Y-O-Y net absorption was positive for all products: Medical (+73,800 sf) led the way, followed by Class A (+57,688 sf) and Class B (+38,039). Class C (+10 sf) remained essentially unchanged.
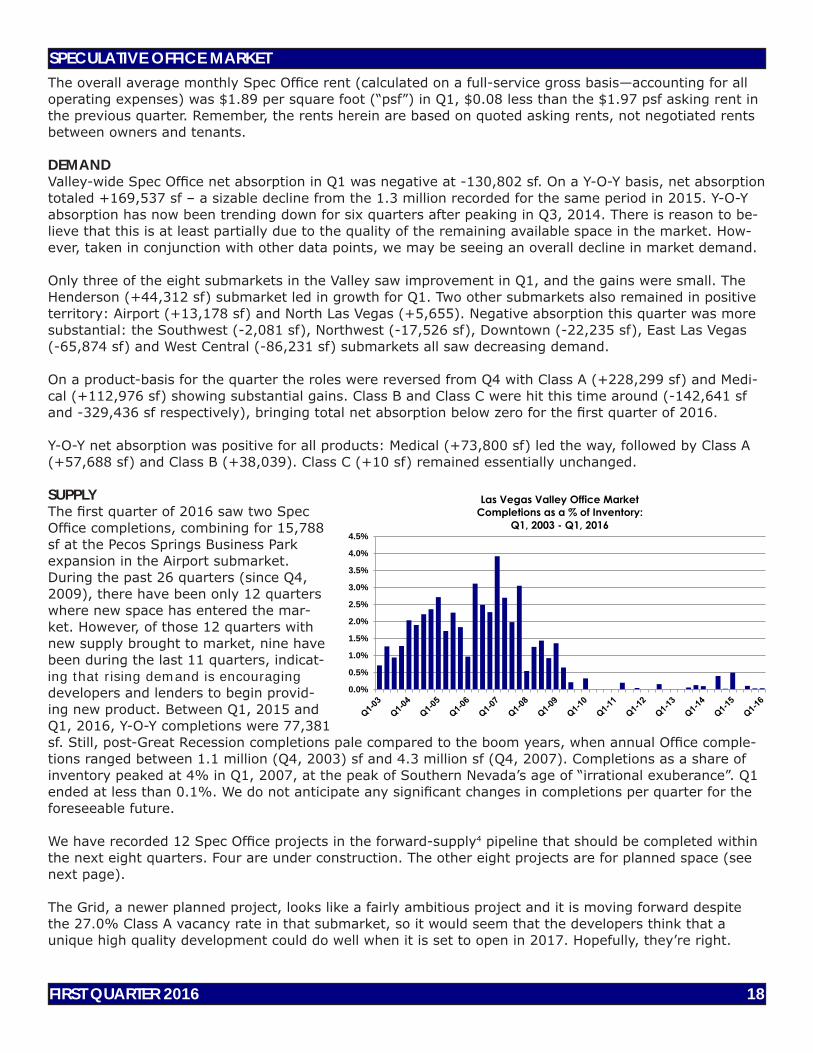
SUPPLYThe first quarter of 2016 saw two Spec Office completions, combining for 15,788 sf at the Pecos Springs Business Park expansion in the Airport submarket. During the past 26 quarters (since Q4, 2009), there have been only 12 quarters where new space has entered the mar-ket. However, of those 12 quarters with new supply brought to market, nine have been during the last 11 quarters, indicat-ing that rising demand is encouraging developers and lenders to begin provid-ing new product. Between Q1, 2015 and Q1, 2016, Y-O-Y completions were 77,381 sf. Still, post-Great Recession completions pale compared to the boom years, when annual Office comple-tions ranged between 1.1 million (Q4, 2003) sf and 4.3 million sf (Q4, 2007). Completions as a share of inventory peaked at 4% in Q1, 2007, at the peak of Southern Nevada’s age of “irrational exuberance”. Q1 ended at less than 0.1%. We do not anticipate any significant changes in completions per quarter for the foreseeable future.
We have recorded 12 Spec Office projects in the forward-supply4 pipeline that should be completed within the next eight quarters. Four are under construction. The other eight projects are for planned space (see next page).
The Grid, a newer planned project, looks like a fairly ambitious project and it is moving forward despite the 27.0% Class A vacancy rate in that submarket, so it would seem that the developers think that a unique high quality development could do well when it is set to open in 2017. Hopefully, they’re right.
FIRST QUARTER 2016 18
SPECULATIVE OFFICE MARKET
0.0%
0.5%
1.0%
1.5%
2.0%
2.5%
3.0%
3.5%
4.0%
4.5%
Las Vegas Valley Office MarketCompletions as a % of Inventory:
Q1, 2003 - Q1, 2016
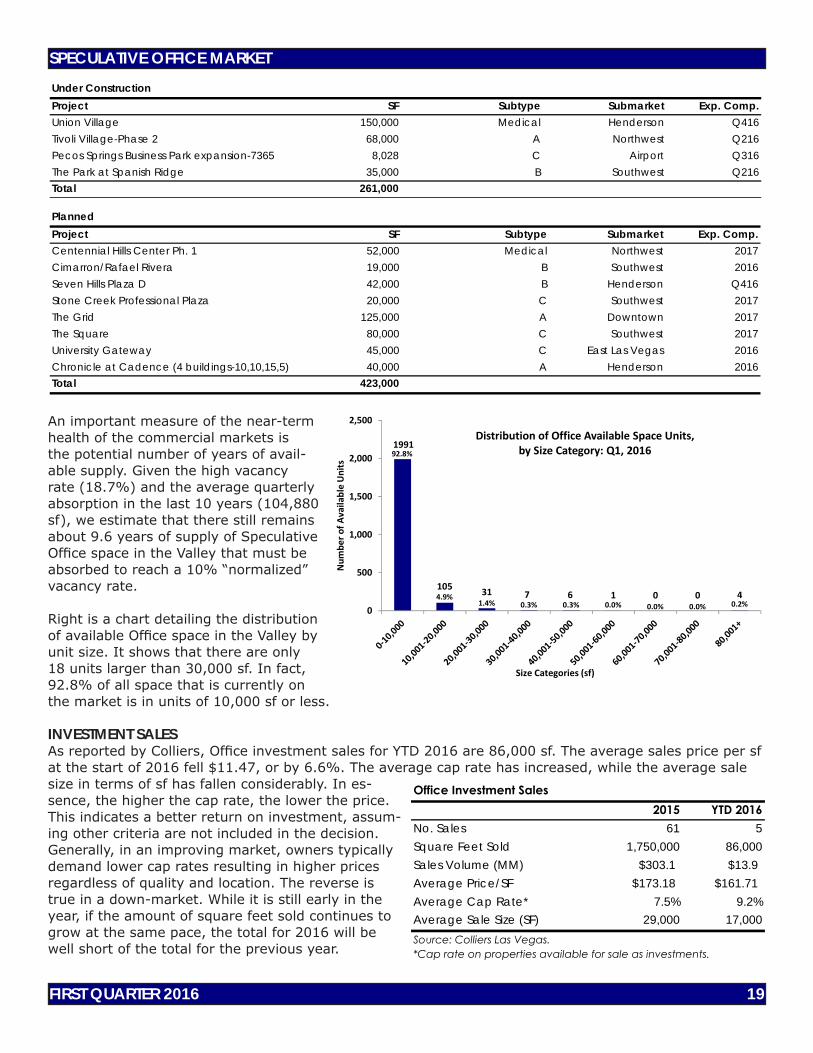
An important measure of the near-term health of the commercial markets is the potential number of years of avail-able supply. Given the high vacancy rate (18.7%) and the average quarterly absorption in the last 10 years (104,880 sf), we estimate that there still remains about 9.6 years of supply of Speculative Office space in the Valley that must be absorbed to reach a 10% “normalized” vacancy rate.
Right is a chart detailing the distribution of available Office space in the Valley by unit size. It shows that there are only 18 units larger than 30,000 sf. In fact, 92.8% of all space that is currently on the market is in units of 10,000 sf or less.
INVESTMENT SALESAs reported by Colliers, Office investment sales for YTD 2016 are 86,000 sf. The average sales price per sf at the start of 2016 fell $11.47, or by 6.6%. The average cap rate has increased, while the average sale size in terms of sf has fallen considerably. In es-sence, the higher the cap rate, the lower the price. This indicates a better return on investment, assum-ing other criteria are not included in the decision. Generally, in an improving market, owners typically demand lower cap rates resulting in higher prices regardless of quality and location. The reverse is true in a down-market. While it is still early in the year, if the amount of square feet sold continues to grow at the same pace, the total for 2016 will be well short of the total for the previous year.
FIRST QUARTER 2016 19
SPECULATIVE OFFICE MARKET
1991
105 31 7 6 1 0 0 4
92.8%
4.9%1.4% 0.3% 0.3% 0.0% 0.0% 0.0% 0.2%
0
500
1,000
1,500
2,000
2,500
Num
bero
fAvailableUnits
Size Categories (sf)
Distribution of Office Available Space Units,by Size Category: Q1, 2016
Office Investment Sales2015 YTD 2016
No. Sales 61 5Square Feet Sold 1,750,000 86,000Sales Volume (MM) $303.1 $13.9Average Price/SF $173.18 $161.71Average Cap Rate* 7.5% 9.2%Average Sale Size (SF) 29,000 17,000Source: Colliers Las Vegas.*Cap rate on properties available for sale as investments.
Under ConstructionProject SF Subtype Submarket Exp. Comp.Union Village 150,000 Medical Henderson Q416Tivoli Village-Phase 2 68,000 A Northwest Q216Pecos Springs Business Park expansion-7365 8,028 C Airport Q316The Park at Spanish Ridge 35,000 B Southwest Q216Total 261,000
PlannedProject SF Subtype Submarket Exp. Comp.Centennial Hills Center Ph. 1 52,000 Medical Northwest 2017Cimarron/Rafael Rivera 19,000 B Southwest 2016Seven Hills Plaza D 42,000 B Henderson Q416Stone Creek Professional Plaza 20,000 C Southwest 2017The Grid 125,000 A Downtown 2017The Square 80,000 C Southwest 2017University Gateway 45,000 C East Las Vegas 2016Chronicle at Cadence (4 buildings-10,10,15,5) 40,000 A Henderson 2016Total 423,000

FURTHER THOUGHTS & RECAPThe Southern Nevada Office market’s recovery continues to lag behind that of the Industrial and Retail markets, and it appears the trend will continue as we kick off 2016 with negative net demand. Valley-wide Spec Office net absorption in Q1 was a discouraging -130,802 sf.
On a Y-O-Y basis, net absorption totaled +169,537 sf, much less than the 1.3 million sf recorded for the same period in 2015. Y-O-Y absorption has now been trending down for six quarters, after peaking in Q3, 2014. The quality of the remaining available space has likely contributed to the persistent decline.
Employment in the Office-using sector, a critical indicator of the health of the local economy, comprised 32% (262,300 jobs) of all private payroll jobs in Clark County at the end of Q1 (March 2016). This was 6,700 more (+2.6%) than existed in March 2015. Health Care and Social Assistance contributed the most new jobs, adding 6,100 for the year.
Total Spec Office vacancy in the Valley in Q1 (directly vacant space plus vacant sublease space) increased 0.3 percentage-points to 18.7%, back up after having reached the lowest vacancy in the Spec Office mar-ket since Q3, 2009.
The North Las Vegas submarket enjoys the lowest Spec Office market vacancy rate at 11.4%, down from 12.2% in Q4. Airport follows at 12.2%, remaining unchanged from the previous quarter. North Las Vegas has considerably less rentable sf with 783,529 sf (compared to a high of 9.0 million sf in the Northwest and an average of 6.2 million across the seven submarkets). Also, the North Las Vegas Market does not contain any Professional Class A Office space, which was the hardest hit in vacancies across all sub-types. Except for the East Las Vegas and West Central submarkets at 29.8% and 23.4% vacancy, respectively, the other six submarkets enjoyed vacancy rates below 20%.
Completions as a share of inventory peaked at 3.9% in Q1, 2007, at the height of Southern Nevada’s age of “irrational exuberance.” There were two completions in the Airport submarket in the first quarter of 2016 totaling 15,788 sf. There are also 261,028 sf currently under-construction and another 423,000 sf in the planning stages.
Southern Nevada’s Spec Office market has a long road to recovery ahead of it. Q1 saw net negative de-mand and a slight uptick in vacancy from Q4, but the Y-O-Y trend is one of steady, albeit meager improve-ment. Some submarkets and some Office products are doing better than others, however every single one is above the generally accepted 10% stabilized vacancy rate. The Spec Office job market continues to improve, but still has quite a ways to go.________________________________
1 Includes all for-lease (speculative only) professional office Class A, Class B, Class C and Medical office properties greater than or equal to 10,000 sf of gross leasable area. Does not include government build-ings.
2 All office rents in this report are quoted on a monthly full-service gross (FSG) psf basis inclusive of taxes, insurance, maintenance, janitorial and utilities.
3 Includes the following industries: Information, Financial Activities, Professional & Business and Health Care & Social Assistance from the Nevada Department of Employment, Training and Rehabilitation’s latest employment statistics.
4 Forward-supply is a combination of space presently under construction in a quarter and space planned to begin construction within the next 4 quarters.
SPECULATIVE OFFICE MARKET
FIRST QUARTER 2016 20
FIRST QUARTER 2016 21
SPECULATIVE OFFICE MARKETSPECULATIVE OFFICE MARKET GLOSSARY
Office property buildings or building parks tracked include speculative, multi-tenant properties with at least 10,000 sf of usable office space. Building characteristics were used to define the appropriate subtype classification (i.e., professional or medical). These characteristics can include rents, location, quality of building systems (e.g., mechanical, elevator and utility systems), finishes (e.g., lobby and hallway design/ materials), and amenities. A property must exhibit one or more of the typical building characteristics to be considered a specific classification.
Class AClass A properties are the highest quality buildings in the market with steel frame construction, typically mid-rise (3 - 4 stories) or high-rise (5 stories or more).
•High asking gross rent (FSG) with a typical premium of 20-30% of office rents in the local market,•Location within a central business area,•Capacity to meet current tenant requirements and anticipated future tenant needs,•Building finishes that are of high quality and competitive with new construction, and•Maintenance, management and upkeep amenities above average.
Class BClass B properties have buildings with steel frame, reinforced concrete or concrete tilt-up construction - usually low-rise (1 - 2 stories) or mid-rise (3 - 4 stories).
•Asking gross rent (FSG) typically in a specified range between asking gross rents for Class A and Class C buildings,•Average to good location,•Adequate capacity to deliver services currently required by tenants,•Building finishes with average to good design and materials, and•Maintenance, management and upkeep amenities that are considered average.
Class CClass C properties have buildings with wood construction and are usually low-rise (1 - 2 stories).
•Asking gross rent (FSG) typically in the bottom 10-20% of office rents in the marketplace,•Depends primarily on lower prices rather than desirable locations to attract occupants,•Capacities that may not meet current tenant needs,•Building finishes that show a dated appearance, and•Maintenance, management and upkeep amenities that are below average.
MedicalAn office building in which 50% or more of its available space under the various building classifications above consists of medical office use.
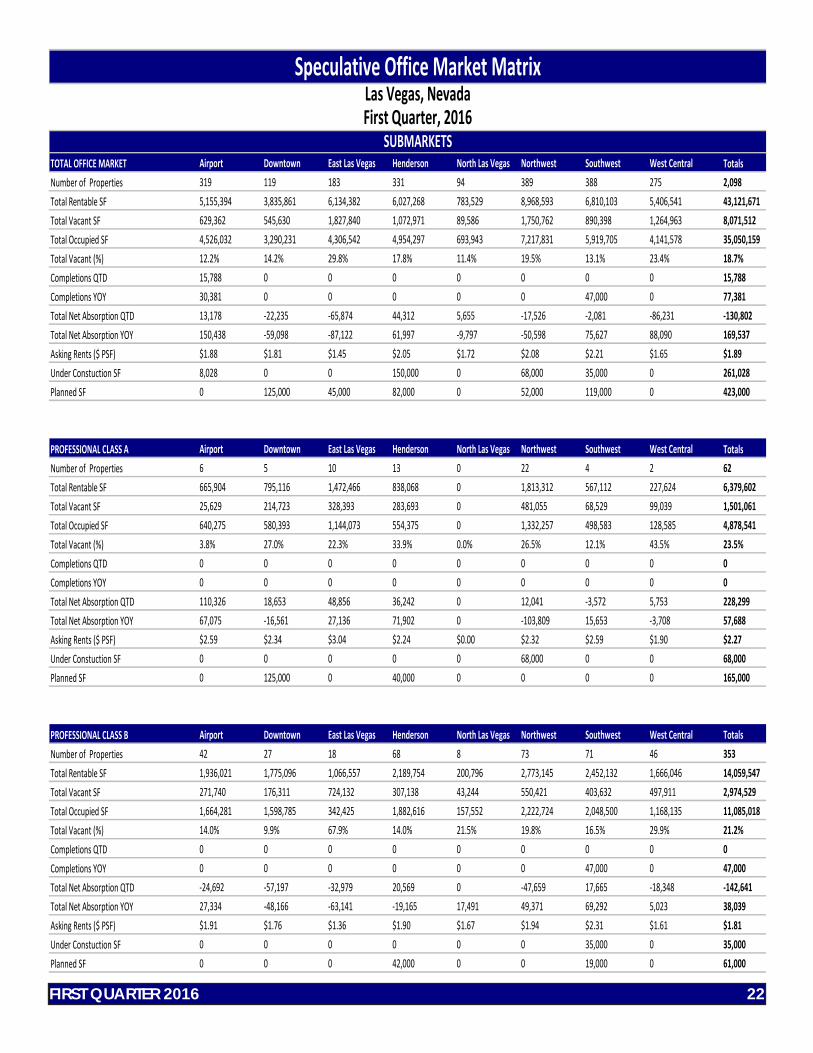
TOTAL OFFICE MARKET Airport Downtown East Las Vegas Henderson North Las Vegas Northwest Southwest West Central TotalsNumber of Properties 319 119 183 331 94 389 388 275 2,098Total Rentable SF 5,155,394 3,835,861 6,134,382 6,027,268 783,529 8,968,593 6,810,103 5,406,541 43,121,671Total Vacant SF 629,362 545,630 1,827,840 1,072,971 89,586 1,750,762 890,398 1,264,963 8,071,512Total Occupied SF 4,526,032 3,290,231 4,306,542 4,954,297 693,943 7,217,831 5,919,705 4,141,578 35,050,159Total Vacant (%) 12.2% 14.2% 29.8% 17.8% 11.4% 19.5% 13.1% 23.4% 18.7%Completions QTD 15,788 0 0 0 0 0 0 0 15,788Completions YOY 30,381 0 0 0 0 0 47,000 0 77,381Total Net Absorption QTD 13,178 -22,235 -65,874 44,312 5,655 -17,526 -2,081 -86,231 -130,802Total Net Absorption YOY 150,438 -59,098 -87,122 61,997 -9,797 -50,598 75,627 88,090 169,537Asking Rents ($ PSF) $1.88 $1.81 $1.45 $2.05 $1.72 $2.08 $2.21 $1.65 $1.89Under Constuction SF 8,028 0 0 150,000 0 68,000 35,000 0 261,028Planned SF 0 125,000 45,000 82,000 0 52,000 119,000 0 423,000
PROFESSIONAL CLASS A Airport Downtown East Las Vegas Henderson North Las Vegas Northwest Southwest West Central TotalsNumber of Properties 6 5 10 13 0 22 4 2 62Total Rentable SF 665,904 795,116 1,472,466 838,068 0 1,813,312 567,112 227,624 6,379,602Total Vacant SF 25,629 214,723 328,393 283,693 0 481,055 68,529 99,039 1,501,061Total Occupied SF 640,275 580,393 1,144,073 554,375 0 1,332,257 498,583 128,585 4,878,541Total Vacant (%) 3.8% 27.0% 22.3% 33.9% 0.0% 26.5% 12.1% 43.5% 23.5%Completions QTD 0 0 0 0 0 0 0 0 0Completions YOY 0 0 0 0 0 0 0 0 0Total Net Absorption QTD 110,326 18,653 48,856 36,242 0 12,041 -3,572 5,753 228,299Total Net Absorption YOY 67,075 -16,561 27,136 71,902 0 -103,809 15,653 -3,708 57,688Asking Rents ($ PSF) $2.59 $2.34 $3.04 $2.24 $0.00 $2.32 $2.59 $1.90 $2.27Under Constuction SF 0 0 0 0 0 68,000 0 0 68,000Planned SF 0 125,000 0 40,000 0 0 0 0 165,000
PROFESSIONAL CLASS B Airport Downtown East Las Vegas Henderson North Las Vegas Northwest Southwest West Central TotalsNumber of Properties 42 27 18 68 8 73 71 46 353Total Rentable SF 1,936,021 1,775,096 1,066,557 2,189,754 200,796 2,773,145 2,452,132 1,666,046 14,059,547Total Vacant SF 271,740 176,311 724,132 307,138 43,244 550,421 403,632 497,911 2,974,529Total Occupied SF 1,664,281 1,598,785 342,425 1,882,616 157,552 2,222,724 2,048,500 1,168,135 11,085,018Total Vacant (%) 14.0% 9.9% 67.9% 14.0% 21.5% 19.8% 16.5% 29.9% 21.2%Completions QTD 0 0 0 0 0 0 0 0 0Completions YOY 0 0 0 0 0 0 47,000 0 47,000Total Net Absorption QTD -24,692 -57,197 -32,979 20,569 0 -47,659 17,665 -18,348 -142,641Total Net Absorption YOY 27,334 -48,166 -63,141 -19,165 17,491 49,371 69,292 5,023 38,039Asking Rents ($ PSF) $1.91 $1.76 $1.36 $1.90 $1.67 $1.94 $2.31 $1.61 $1.81Under Constuction SF 0 0 0 0 0 0 35,000 0 35,000Planned SF 0 0 0 42,000 0 0 19,000 0 61,000
SUBMARKETS
Speculative Office Market MatrixLas Vegas, NevadaFirst Quarter, 2016
FIRST QUARTER 2016 22
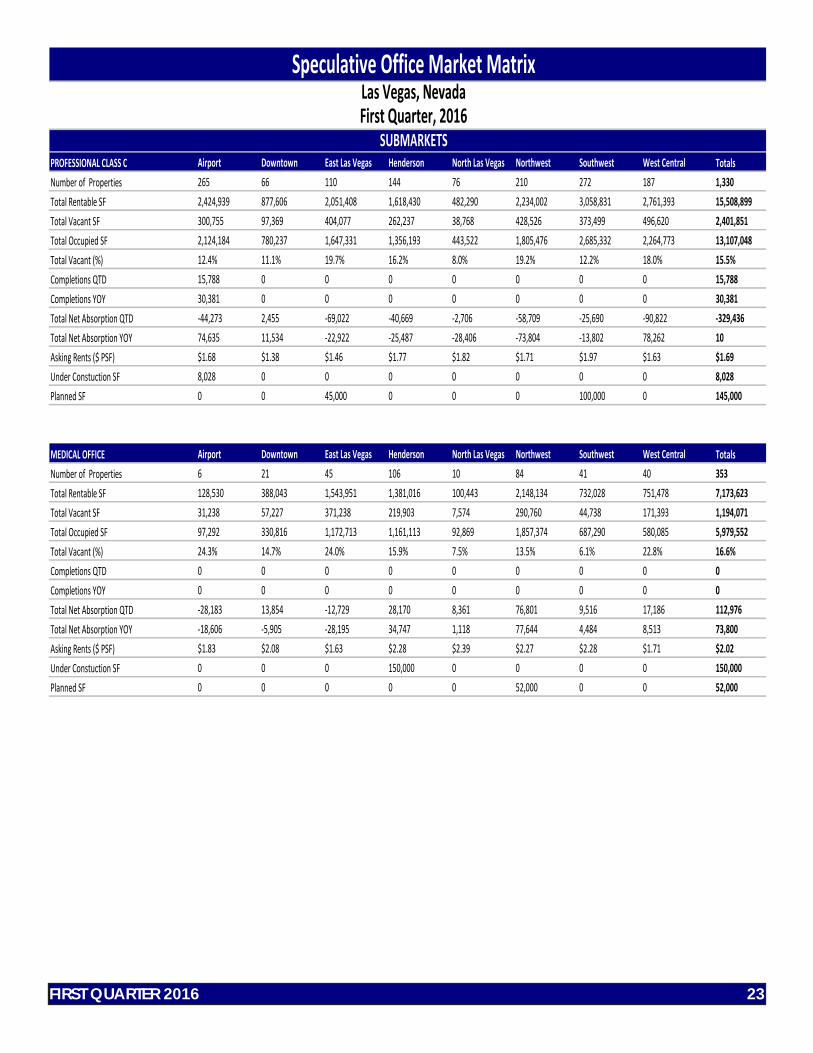
PROFESSIONAL CLASS C Airport Downtown East Las Vegas Henderson North Las Vegas Northwest Southwest West Central TotalsNumber of Properties 265 66 110 144 76 210 272 187 1,330Total Rentable SF 2,424,939 877,606 2,051,408 1,618,430 482,290 2,234,002 3,058,831 2,761,393 15,508,899Total Vacant SF 300,755 97,369 404,077 262,237 38,768 428,526 373,499 496,620 2,401,851Total Occupied SF 2,124,184 780,237 1,647,331 1,356,193 443,522 1,805,476 2,685,332 2,264,773 13,107,048Total Vacant (%) 12.4% 11.1% 19.7% 16.2% 8.0% 19.2% 12.2% 18.0% 15.5%Completions QTD 15,788 0 0 0 0 0 0 0 15,788Completions YOY 30,381 0 0 0 0 0 0 0 30,381Total Net Absorption QTD -44,273 2,455 -69,022 -40,669 -2,706 -58,709 -25,690 -90,822 -329,436Total Net Absorption YOY 74,635 11,534 -22,922 -25,487 -28,406 -73,804 -13,802 78,262 10Asking Rents ($ PSF) $1.68 $1.38 $1.46 $1.77 $1.82 $1.71 $1.97 $1.63 $1.69Under Constuction SF 8,028 0 0 0 0 0 0 0 8,028Planned SF 0 0 45,000 0 0 0 100,000 0 145,000
MEDICAL OFFICE Airport Downtown East Las Vegas Henderson North Las Vegas Northwest Southwest West Central TotalsNumber of Properties 6 21 45 106 10 84 41 40 353Total Rentable SF 128,530 388,043 1,543,951 1,381,016 100,443 2,148,134 732,028 751,478 7,173,623Total Vacant SF 31,238 57,227 371,238 219,903 7,574 290,760 44,738 171,393 1,194,071Total Occupied SF 97,292 330,816 1,172,713 1,161,113 92,869 1,857,374 687,290 580,085 5,979,552Total Vacant (%) 24.3% 14.7% 24.0% 15.9% 7.5% 13.5% 6.1% 22.8% 16.6%Completions QTD 0 0 0 0 0 0 0 0 0Completions YOY 0 0 0 0 0 0 0 0 0Total Net Absorption QTD -28,183 13,854 -12,729 28,170 8,361 76,801 9,516 17,186 112,976Total Net Absorption YOY -18,606 -5,905 -28,195 34,747 1,118 77,644 4,484 8,513 73,800Asking Rents ($ PSF) $1.83 $2.08 $1.63 $2.28 $2.39 $2.27 $2.28 $1.71 $2.02Under Constuction SF 0 0 0 150,000 0 0 0 0 150,000Planned SF 0 0 0 0 0 52,000 0 0 52,000
Speculative Office Market MatrixLas Vegas, NevadaFirst Quarter, 2016
SUBMARKETS
FIRST QUARTER 2016 23
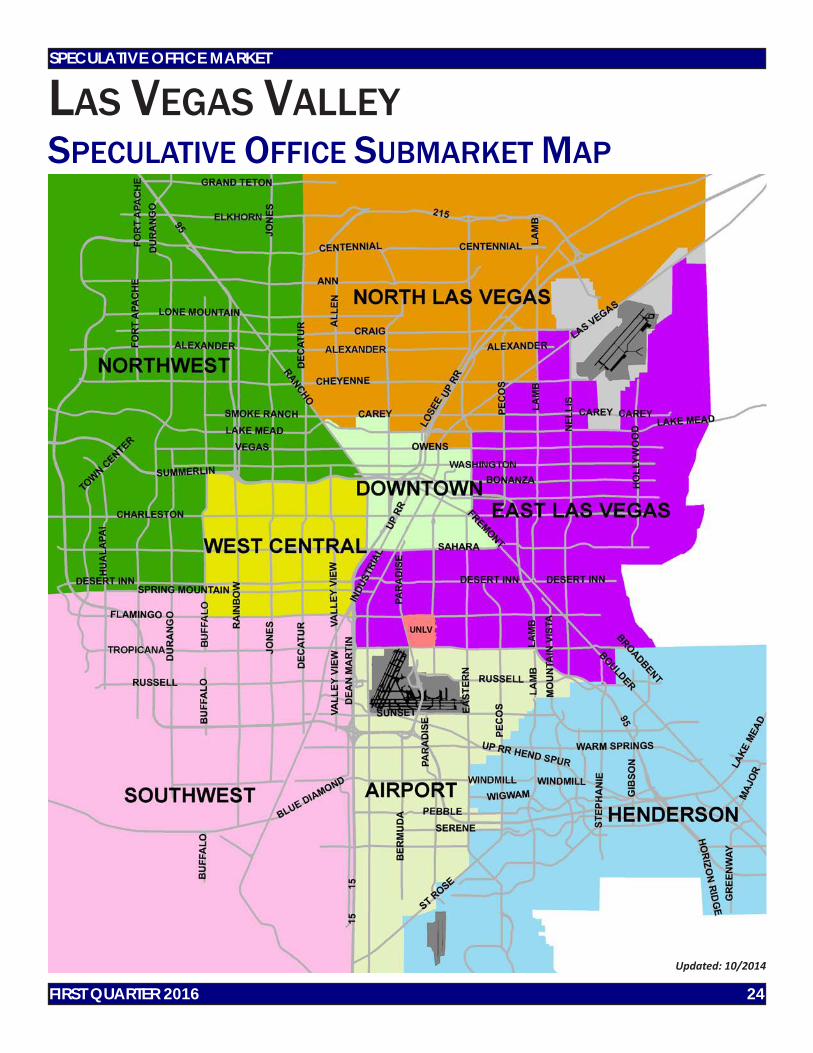
LAS VEGAS VALLEYSPECULATIVE OFFICE SUBMARKET MAP
FIRST QUARTER 2016 24
SPECULATIVE OFFICE MARKET
Updated: 10/2014

ARROYO MARKET SQUARE
THE DISTRICT AT GREEN VALLEY RANCH
Las Vegas Anchored Retail Survey1st Quarter 2016
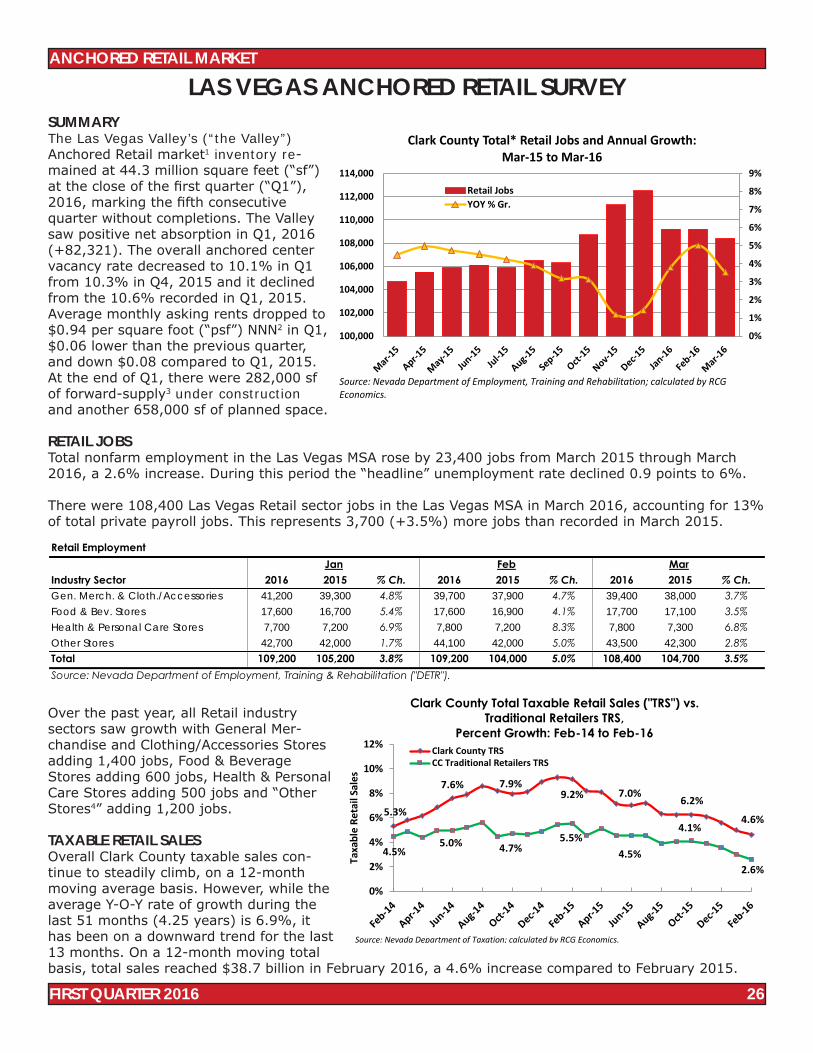
LAS VEGAS ANCHORED RETAIL SURVEYSUMMARYThe Las Vegas Valley’s (“the Valley”) Anchored Retail market1 inventory re-mained at 44.3 million square feet (“sf”) at the close of the first quarter (“Q1”), 2016, marking the fifth consecutive quarter without completions. The Valley saw positive net absorption in Q1, 2016 (+82,321). The overall anchored center vacancy rate decreased to 10.1% in Q1 from 10.3% in Q4, 2015 and it declined from the 10.6% recorded in Q1, 2015. Average monthly asking rents dropped to $0.94 per square foot (“psf”) NNN2 in Q1, $0.06 lower than the previous quarter, and down $0.08 compared to Q1, 2015. At the end of Q1, there were 282,000 sf of forward-supply3 under construction and another 658,000 sf of planned space.
RETAIL JOBSTotal nonfarm employment in the Las Vegas MSA rose by 23,400 jobs from March 2015 through March 2016, a 2.6% increase. During this period the “headline” unemployment rate declined 0.9 points to 6%.
There were 108,400 Las Vegas Retail sector jobs in the Las Vegas MSA in March 2016, accounting for 13% of total private payroll jobs. This represents 3,700 (+3.5%) more jobs than recorded in March 2015.
Over the past year, all Retail industry sectors saw growth with General Mer-chandise and Clothing/Accessories Stores adding 1,400 jobs, Food & Beverage Stores adding 600 jobs, Health & Personal Care Stores adding 500 jobs and “Other Stores4” adding 1,200 jobs.
TAXABLE RETAIL SALESOverall Clark County taxable sales con-tinue to steadily climb, on a 12-month moving average basis. However, while the average Y-O-Y rate of growth during the last 51 months (4.25 years) is 6.9%, it has been on a downward trend for the last 13 months. On a 12-month moving total basis, total sales reached $38.7 billion in February 2016, a 4.6% increase compared to February 2015.
0%
1%
2%
3%
4%
5%
6%
7%
8%
9%
100,000
102,000
104,000
106,000
108,000
110,000
112,000
114,000
Clark County Total* Retail Jobs and Annual Growth:Mar-15 to Mar-16
Retail JobsYOY % Gr.
Source: Nevada Department of Employment, Training and Rehabilitation; calculated by RCG Economics.
5.3%
7.6% 7.9%9.2% 7.0%
6.2%
4.6%
4.5%5.0% 4.7%
5.5%4.5%
4.1%
2.6%
0%
2%
4%
6%
8%
10%
12%
Taxa
ble
Reta
il Sa
les
Clark County Total Taxable Retail Sales ("TRS") vs.Traditional Retailers TRS,
Percent Growth: Feb-14 to Feb-16Clark County TRSCC Traditional Retailers TRS
Source: Nevada Department of Taxation; calculated by RCG Economics.
Retail Employment
Industry Sector 2016 2015 % Ch. 2016 2015 % Ch. 2016 2015 % Ch.Gen. Merch. & Cloth./Accessories 41,200 39,300 4.8% 39,700 37,900 4.7% 39,400 38,000 3.7%Food & Bev. Stores 17,600 16,700 5.4% 17,600 16,900 4.1% 17,700 17,100 3.5%Health & Personal Care Stores 7,700 7,200 6.9% 7,800 7,200 8.3% 7,800 7,300 6.8%Other Stores 42,700 42,000 1.7% 44,100 42,000 5.0% 43,500 42,300 2.8%Total 109,200 105,200 3.8% 109,200 104,000 5.0% 108,400 104,700 3.5%Source: Nevada Department of Employment, Training & Rehabilitation ("DETR").
Jan Feb Mar
FIRST QUARTER 2016 26
ANCHORED RETAIL MARKET
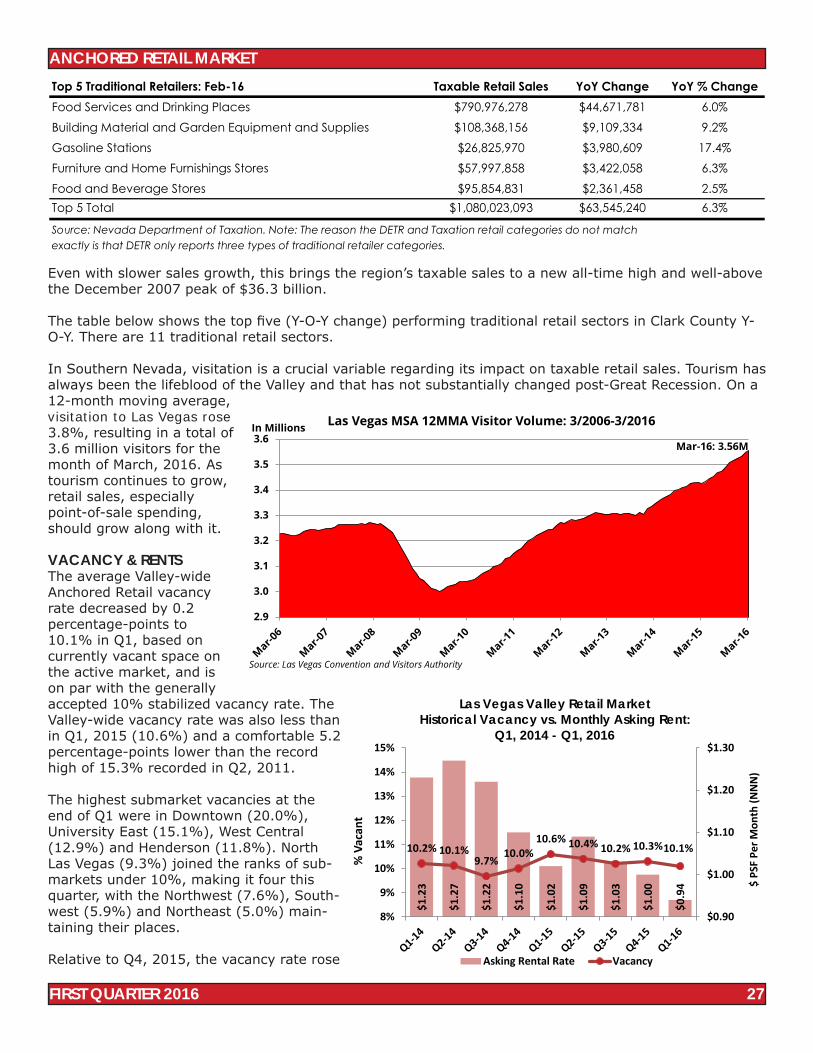
Even with slower sales growth, this brings the region’s taxable sales to a new all-time high and well-above the December 2007 peak of $36.3 billion.
The table below shows the top five (Y-O-Y change) performing traditional retail sectors in Clark County Y-O-Y. There are 11 traditional retail sectors.
In Southern Nevada, visitation is a crucial variable regarding its impact on taxable retail sales. Tourism has always been the lifeblood of the Valley and that has not substantially changed post-Great Recession. On a 12-month moving average, visitation to Las Vegas rose 3.8%, resulting in a total of 3.6 million visitors for the month of March, 2016. As tourism continues to grow, retail sales, especially point-of-sale spending, should grow along with it.
VACANCY & RENTSThe average Valley-wide Anchored Retail vacancy rate decreased by 0.2 percentage-points to 10.1% in Q1, based on currently vacant space on the active market, and is on par with the generally accepted 10% stabilized vacancy rate. The Valley-wide vacancy rate was also less than in Q1, 2015 (10.6%) and a comfortable 5.2 percentage-points lower than the record high of 15.3% recorded in Q2, 2011.
The highest submarket vacancies at the end of Q1 were in Downtown (20.0%), University East (15.1%), West Central (12.9%) and Henderson (11.8%). North Las Vegas (9.3%) joined the ranks of sub-markets under 10%, making it four this quarter, with the Northwest (7.6%), South-west (5.9%) and Northeast (5.0%) main-taining their places.
Relative to Q4, 2015, the vacancy rate rose
$1.2
3
$1.2
7
$1.2
2
$1.1
0
$1.0
2
$1.0
9
$1.0
3
$1.0
0
$0.9
4
10.2% 10.1%9.7%
10.0%10.6% 10.4% 10.2% 10.3%10.1%
$0.90
$1.00
$1.10
$1.20
$1.30
8%
9%
10%
11%
12%
13%
14%
15%$
PSF
Per M
onth
(NN
N)
% V
acan
t
Las Vegas Valley Retail MarketHistorical Vacancy vs. Monthly Asking Rent:
Q1, 2014 - Q1, 2016
Asking Rental Rate Vacancy
FIRST QUARTER 2016 27
Top 5 Traditional Retailers: Feb-16 Taxable Retail Sales YoY Change YoY % ChangeFood Services and Drinking Places $790,976,278 $44,671,781 6.0%Building Material and Garden Equipment and Supplies $108,368,156 $9,109,334 9.2%Gasoline Stations $26,825,970 $3,980,609 17.4%Furniture and Home Furnishings Stores $57,997,858 $3,422,058 6.3%Food and Beverage Stores $95,854,831 $2,361,458 2.5%Top 5 Total $1,080,023,093 $63,545,240 6.3%
Source: Nevada Department of Taxation. Note: The reason the DETR and Taxation retail categories do not matchexactly is that DETR only reports three types of traditional retailer categories.
ANCHORED RETAIL MARKET
2.9
3.0
3.1
3.2
3.3
3.4
3.5
3.6In Millions Las Vegas MSA 12MMA Visitor Volume: 3/2006-3/2016
Source: Las Vegas Convention and Visitors Authority
Mar-16: 3.56M

in only two submarkets, decreased in five and remained the same for the Downtown submarket, hold-ing at 20.0%. Henderson saw the largest increase in vacancy, gaining 1.6 percentage-points and reaching 11.8%. The Northeast saw a 0.2 percentage-point rise from 4.8% to 5.0% in Q1, 2016. Submarkets showing improved Retail vacancy rates were: North Las Vegas, which dropped from 11.4% to 9.3%; West Central, declining from 13.6% to 12.9%; University East and the Northwest submarkets, which both decreased by 0.5 percentage-points to 15.1% and 7.6%, respectively; and the Southwest, which declined 0.2 points to 5.9%.
On a Y-O-Y basis, four of the eight submarkets saw improved vacancy rates. The Downtown submarket did not change at all Y-O-Y, maintaining 20% vacancy. West Central saw the largest increase with a 2.3 per-centage-point gain. Henderson was close behind with a 1.8-point increase to 11.8%. The biggest improve-ment from Q1, 2015 was in the North Las Vegas submarket, improving 2.9 percentage-points to 9.3% in Q1, 2016. Across the product spectrum, Community and Neighborhood Centers both showed Y-O-Y improvement (by 1 and 0.5 percentage-points, respectively), while Power Centers noted a 0.4-point increase in vacancy.
The Valley’s overall Anchored Retail monthly rent declined $0.06 to $0.94 psf in Q1 (calculated on a NNN basis; not accounting for any operating expenses and noted as asking rents).
The Anchored Retail market continues to do well in certain submarkets, while struggling in others. We don’t expect vacancy rates in the market to change dramatically in the foreseeable future. Anchored Retail persistently hovers around 10% vacancy, because of the success of the Industrial Warehouse/Distribution market. The rise of Warehouse/Distribution is in large part due to the success of online retailers, such as Amazon, that are stifling the growth of bricks and mortar stores. Fulfillment centers are replacing large swathes of the Retail market, especially middle-income retail facilities.
DEMANDTotal net Anchored Retail absorption in Q1, 2016 reflected positive growth at +82,321 sf, compared to -35,432 sf during Q4, 2015. On a Y-O-Y basis, Valley-wide net absorption was 213,968 sf.
For the quarter, net absorption was positive in five of eight submarkets: North Las Ve-gas (+103,125 sf), Northwest (+54,993 sf), West Central (+30,858 sf), University East (+28,599 sf) and Southwest (+11,406 sf). Two submarkets showed negative growth: Henderson at -141,567 sf and Northeast at -5,093 sf. Downtown has zero net absorp-tion for the quarter.
10-Yrs. Ago: $1.82
5-Yrs. Ago:$1.59
Current: $1.02
$0.00
$0.50
$1.00
$1.50
$2.00
$2.50
$3.00
Q1-06 Q1-11 Q1-16Re
al R
ents
('15
$)
Las Vegas Valley Retail MarketInflation-Adjusted Asking Rent: Q1, 2006 - Q1, 2016 (Baseline)
FIRST QUARTER 2016 28
318,
251
232,
123
475,
674
202,
137
-67,
232
-6,7
39
-80,
431
-124
,771
213,
968
0 0 0
222,
000
222,
000
222,
000
222,
000
0 0
-400,000-300,000-200,000-100,000
0100,000200,000300,000400,000500,000600,000
SF
Las Vegas Valley Retail MarketHistorical YOY Net Absorption vs. Completions
Q1, 2014 - Q1, 2016
Net Absorption Completions
ANCHORED RETAIL MARKET
Year-over-year, six Anchored Retail submarkets showed improvement: North Las Vegas (+141,504 sf), University East (+134,989 sf), Southwest (+43,446 sf), Northwest (+38,379 sf) and West Central (+12,609 sf). The Henderson submarket again demonstrated the largest negative absorption at -154,844 sf. The Northeast at -1,825 sf and Downtown at -290 sf had much smaller negative absorption.
For the year, net absorption was positive in Community Centers (+184,473 sf) and Neighborhood Centers (+67,547 sf) and negative in Power Centers (-38,052 sf).
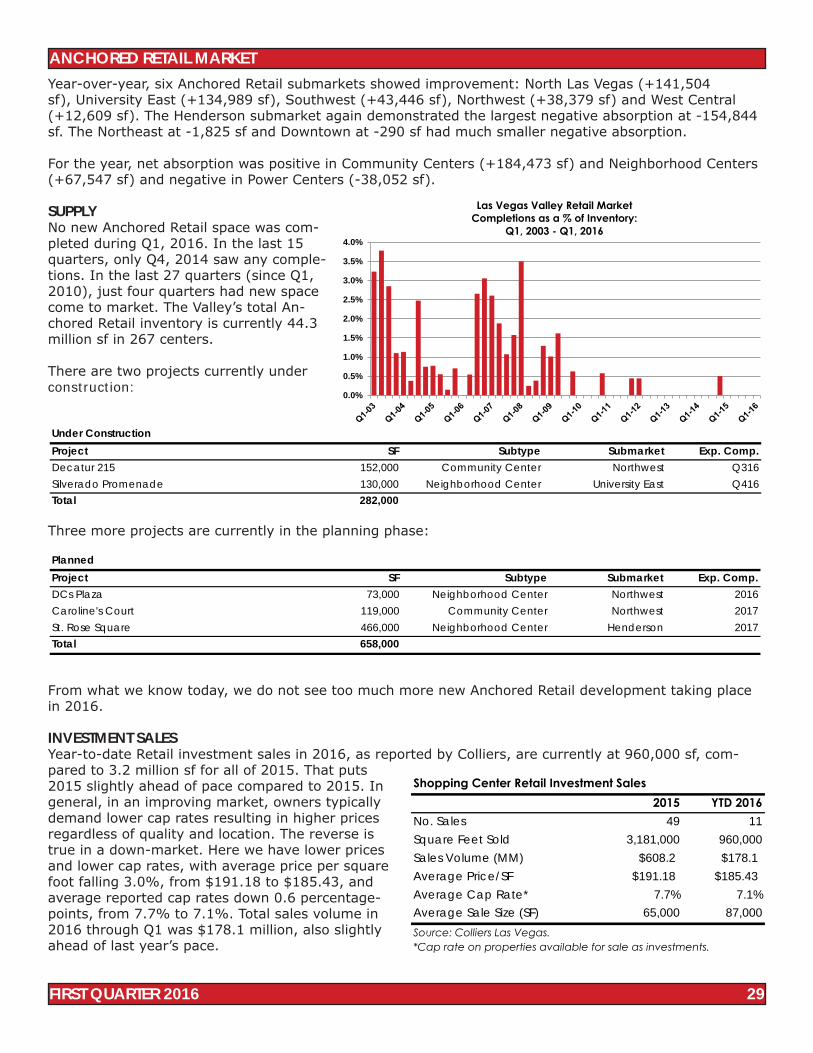
SUPPLYNo new Anchored Retail space was com-pleted during Q1, 2016. In the last 15 quarters, only Q4, 2014 saw any comple-tions. In the last 27 quarters (since Q1, 2010), just four quarters had new space come to market. The Valley’s total An-chored Retail inventory is currently 44.3 million sf in 267 centers.
There are two projects currently under construction:
Three more projects are currently in the planning phase:
From what we know today, we do not see too much more new Anchored Retail development taking place in 2016.
INVESTMENT SALESYear-to-date Retail investment sales in 2016, as reported by Colliers, are currently at 960,000 sf, com-pared to 3.2 million sf for all of 2015. That puts 2015 slightly ahead of pace compared to 2015. In general, in an improving market, owners typically demand lower cap rates resulting in higher prices regardless of quality and location. The reverse is true in a down-market. Here we have lower prices and lower cap rates, with average price per square foot falling 3.0%, from $191.18 to $185.43, and average reported cap rates down 0.6 percentage-points, from 7.7% to 7.1%. Total sales volume in 2016 through Q1 was $178.1 million, also slightly ahead of last year’s pace.
0.0%
0.5%
1.0%
1.5%
2.0%
2.5%
3.0%
3.5%
4.0%
Las Vegas Valley Retail MarketCompletions as a % of Inventory:
Q1, 2003 - Q1, 2016
FIRST QUARTER 2016 29
ANCHORED RETAIL MARKET
Shopping Center Retail Investment Sales2015 YTD 2016
No. Sales 49 11Square Feet Sold 3,181,000 960,000Sales Volume (MM) $608.2 $178.1Average Price/SF $191.18 $185.43Average Cap Rate* 7.7% 7.1%Average Sale Size (SF) 65,000 87,000Source: Colliers Las Vegas.*Cap rate on properties available for sale as investments.
Under ConstructionProject SF Subtype Submarket Exp. Comp.Decatur 215 152,000 Community Center Northwest Q316Silverado Promenade 130,000 Neighborhood Center University East Q416Total 282,000
PlannedProject SF Subtype Submarket Exp. Comp.DCs Plaza 73,000 Neighborhood Center Northwest 2016Caroline's Court 119,000 Community Center Northwest 2017St. Rose Square 466,000 Neighborhood Center Henderson 2017Total 658,000
FURTHER THOUGHTS & RECAPThere were 108,400 jobs in the Las Vegas Retail sector at the end of March 2016, accounting for 13% of total private payroll jobs. This represents 3,700 (3.5%) more jobs than were recorded in March 2015.
In the last four quarters, all Retail employment industry sectors grew: General Merchandise and Clothing/Accessories gained 1,400 jobs; “Other Stores” gained 1,200 jobs; Food and Beverage Stores gained 600 jobs; and Health & Personal Care Stores gained 500 jobs. On a Y-O-Y basis employment in the Retail sec-tor has been growing since May of 2010.
Clark County taxable sales continue to steadily climb. On a 12-month moving total basis, these sales reached $38.7 billion in February, a 4.6% jump compared to February 2015. This brings the region’s sales to a new all-time high, well-above the December 2007 peak of $36.3 billion. Also, the average Y-O-Y growth during the last 51 months is a healthy 6.9%.
The average Valley-wide Anchored Retail vacancy rate decreased to 10.1% in Q1, 2016. This is down from 10.3% in Q4 and a 0.5 percentage-point decrease from Q1, 2015 (10.6%).
The highest submarket vacancies at the end of Q1 were Downtown (20.0%), University East (15.1%), West Central (12.9%) and Henderson (11.8%). Four submarkets had vacancy rates below 10%: North Las Vegas (9.3%), Northwest (7.6%), Southwest (5.9%) and Northeast (5.0%).
Vacancy rates improved in all three product types with Power Centers (7.2%) showing a 0.3% decline, Neighborhood Centers (10.9%) with a 0.3% decline and Community Centers (11.0%) with a 0.1% de-cline.
There was a total of +82,321 sf of total net absorption in Q1, 2016, a considerable improvement when compared to net negative absorption of -256,418 sf during Q1, 2015. On a Y-O-Y basis, Valley net An-chored Retail absorption was positive at +213,968 sf.
No new Anchored Retail space was completed during Q1, 2016. In the last 15 quarters, only Q4, 2014 had any completions, which was 222,000 sf in the Northwest submarket, bringing its total to 10.8 million square feet, representing 24.4% of the total Valley rentable anchored inventory. Prior to that, there were only three quarters in 21 (since Q1, 2010) that saw new Anchored Retail space brought to market. The Valley’s total inventory is currently 44.3 million sf in 267 shopping centers.
According to AAA, the price of gasoline in March 2016, compared to the month prior when regular un-leaded was at the shockingly low price of $1.95, increased by $0.50. However, gas prices were still down relative to last year, from $2.80 to $2.45. Low gasoline prices have essentially given Southern Nevadans a “raise” and a subsequent increase in spending power. We expect gas prices to stay relatively stable and less expensive compared to one year prior for the remainder of the year, which will give energy to Ne-vada’s convalescing economy.
Increasing taxable sales are helping the Valley recover, as well. Increased visitation is a driving factor in increased taxable retail sales. Tourism has always been the lifeblood of the Valley and that remains true even after the Great Recession. As visitation has climbed, so have retail sales. On a 12-month moving average, visitation to Las Vegas rose 3.8% in March with the Valley receiving 3.6 million visitors. As long as tourism continues to grow there will be more people spending money and retail sales should grow in concordance.
Wages and incomes continue to see modest improvement when adjusted for inflation. Clark County’s 12-month moving average (“12-MMA”) weekly earnings were up 3.2% in March 2016 compared to March 2015, reaching $644 in 2007 dollars after 21 months of Y-O-Y improvement.
Average number of hours worked per week in Clark County, on a 12-MMA basis, was 33.2 hours in March for the 10th straight month and was even with the 33.2 hours recorded in March 2015. As we’ve noted, stagnant, and even dropping average hours worked, have accompanied a dropping headline unemploy-
ANCHORED RETAIL MARKET
FIRST QUARTER 2016 30
FIRST QUARTER 2016 31
ment rate. Implication: companies continue to depend heavily on part-time workers. For this reason, the U-6 unemployment rate (includes discouraged and part-time workers) in Nevada remains the nation’s highest at 13.4% (Q1, 2016).___________________________
1 Includes all anchored retail Power Center, Community Center and Neighborhood Center properties with 40,000 or more of gross leasable area in the Las Vegas Valley.
2 All retail rents in this report are quoted on a monthly triple net (NNN) per square foot basis and does not include additional expenses such as taxes, insurance, maintenance, janitorial and utilities.
3 Forward-supply is a combination of space presently under construction in a quarter and space planned to begin construction within the next 4 quarters.
4 “Other stores” is made up of total retail less general merchandise/clothing, food & beverage stores and health & personal care stores.
ANCHORED RETAIL MARKET
FIRST QUARTER 2016 32
RETAIL MARKET GLOSSARYRetail properties tracked include shopping centers with at least 10,000 sf of usable space. These centers have several different stores or tenants and are anchored by one or more large, national tenant (i.e., Best Buy, Target, and Smith’s). Characteristics of buildings were used to define the appropriate classification of properties into subtypes, such as tenant mix, size and trade area. A property must exhibit one or more of the typical building characteristics to be considered a specific classification.
Power CenterCenters with a minimum of three, but usually five or more, anchor tenants that dominant in their catego-ries
•Size typically more than 250,000 sf, but can be as small as 125,000 sf; almost all units designedfor large tenants•Customer-base is typically drawn from within a 15-mile trade area
Community CenterCenters with stores that sell consumer goods, in addition to convenience goods and personal services.
•Typical anchor tenants include junior department stores and off-price/discount stores, and store that sell goods requiring comparison such as apparel and appliances; other tenants include drug stores and home improvement centers•Size typically between 100,000 and 300,000 sf, but can be over 500,000 sf•Customer-base is primarily within a five-mile trade area
Neighborhood CenterCenter with stores that sell convenience goods (e.g., food, sundries and takeout food) and provide person-al services (e.g., dry cleaning and hair/nail care) that meet the day-to-day living needs to the immediate area.
•Typical anchor tenant is a supermarket•Size tends to be smaller than 100,000 sf, but can range from 30,000 to 150,000 sf•Customer-base is within a two- to three-mile trade area
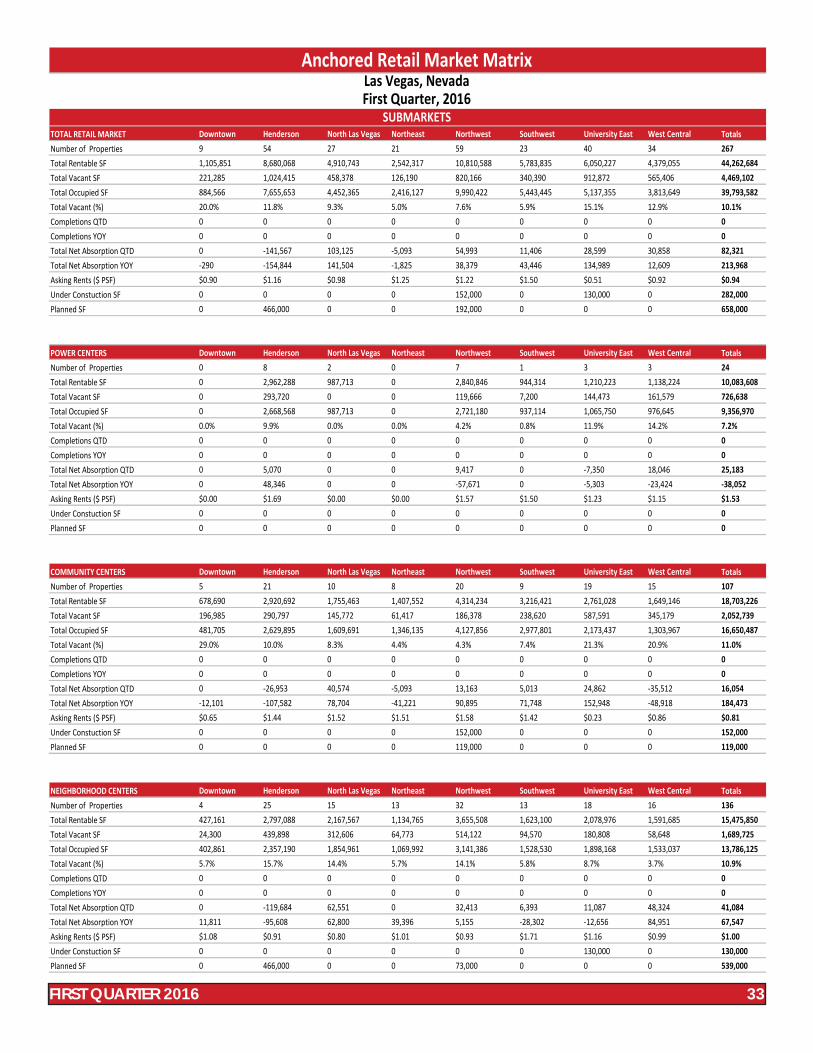
TOTAL RETAIL MARKET Downtown Henderson North Las Vegas Northeast Northwest Southwest University East West Central TotalsNumber of Properties 9 54 27 21 59 23 40 34 267Total Rentable SF 1,105,851 8,680,068 4,910,743 2,542,317 10,810,588 5,783,835 6,050,227 4,379,055 44,262,684Total Vacant SF 221,285 1,024,415 458,378 126,190 820,166 340,390 912,872 565,406 4,469,102Total Occupied SF 884,566 7,655,653 4,452,365 2,416,127 9,990,422 5,443,445 5,137,355 3,813,649 39,793,582Total Vacant (%) 20.0% 11.8% 9.3% 5.0% 7.6% 5.9% 15.1% 12.9% 10.1%Completions QTD 0 0 0 0 0 0 0 0 0Completions YOY 0 0 0 0 0 0 0 0 0Total Net Absorption QTD 0 -141,567 103,125 -5,093 54,993 11,406 28,599 30,858 82,321Total Net Absorption YOY -290 -154,844 141,504 -1,825 38,379 43,446 134,989 12,609 213,968Asking Rents ($ PSF) $0.90 $1.16 $0.98 $1.25 $1.22 $1.50 $0.51 $0.92 $0.94Under Constuction SF 0 0 0 0 152,000 0 130,000 0 282,000Planned SF 0 466,000 0 0 192,000 0 0 0 658,000
POWER CENTERS Downtown Henderson North Las Vegas Northeast Northwest Southwest University East West Central TotalsNumber of Properties 0 8 2 0 7 1 3 3 24Total Rentable SF 0 2,962,288 987,713 0 2,840,846 944,314 1,210,223 1,138,224 10,083,608Total Vacant SF 0 293,720 0 0 119,666 7,200 144,473 161,579 726,638Total Occupied SF 0 2,668,568 987,713 0 2,721,180 937,114 1,065,750 976,645 9,356,970Total Vacant (%) 0.0% 9.9% 0.0% 0.0% 4.2% 0.8% 11.9% 14.2% 7.2%Completions QTD 0 0 0 0 0 0 0 0 0Completions YOY 0 0 0 0 0 0 0 0 0Total Net Absorption QTD 0 5,070 0 0 9,417 0 -7,350 18,046 25,183Total Net Absorption YOY 0 48,346 0 0 -57,671 0 -5,303 -23,424 -38,052Asking Rents ($ PSF) $0.00 $1.69 $0.00 $0.00 $1.57 $1.50 $1.23 $1.15 $1.53Under Constuction SF 0 0 0 0 0 0 0 0 0Planned SF 0 0 0 0 0 0 0 0 0
COMMUNITY CENTERS Downtown Henderson North Las Vegas Northeast Northwest Southwest University East West Central TotalsNumber of Properties 5 21 10 8 20 9 19 15 107Total Rentable SF 678,690 2,920,692 1,755,463 1,407,552 4,314,234 3,216,421 2,761,028 1,649,146 18,703,226Total Vacant SF 196,985 290,797 145,772 61,417 186,378 238,620 587,591 345,179 2,052,739Total Occupied SF 481,705 2,629,895 1,609,691 1,346,135 4,127,856 2,977,801 2,173,437 1,303,967 16,650,487Total Vacant (%) 29.0% 10.0% 8.3% 4.4% 4.3% 7.4% 21.3% 20.9% 11.0%Completions QTD 0 0 0 0 0 0 0 0 0Completions YOY 0 0 0 0 0 0 0 0 0Total Net Absorption QTD 0 -26,953 40,574 -5,093 13,163 5,013 24,862 -35,512 16,054Total Net Absorption YOY -12,101 -107,582 78,704 -41,221 90,895 71,748 152,948 -48,918 184,473Asking Rents ($ PSF) $0.65 $1.44 $1.52 $1.51 $1.58 $1.42 $0.23 $0.86 $0.81Under Constuction SF 0 0 0 0 152,000 0 0 0 152,000Planned SF 0 0 0 0 119,000 0 0 0 119,000
NEIGHBORHOOD CENTERS Downtown Henderson North Las Vegas Northeast Northwest Southwest University East West Central TotalsNumber of Properties 4 25 15 13 32 13 18 16 136Total Rentable SF 427,161 2,797,088 2,167,567 1,134,765 3,655,508 1,623,100 2,078,976 1,591,685 15,475,850Total Vacant SF 24,300 439,898 312,606 64,773 514,122 94,570 180,808 58,648 1,689,725Total Occupied SF 402,861 2,357,190 1,854,961 1,069,992 3,141,386 1,528,530 1,898,168 1,533,037 13,786,125Total Vacant (%) 5.7% 15.7% 14.4% 5.7% 14.1% 5.8% 8.7% 3.7% 10.9%Completions QTD 0 0 0 0 0 0 0 0 0Completions YOY 0 0 0 0 0 0 0 0 0Total Net Absorption QTD 0 -119,684 62,551 0 32,413 6,393 11,087 48,324 41,084Total Net Absorption YOY 11,811 -95,608 62,800 39,396 5,155 -28,302 -12,656 84,951 67,547Asking Rents ($ PSF) $1.08 $0.91 $0.80 $1.01 $0.93 $1.71 $1.16 $0.99 $1.00Under Constuction SF 0 0 0 0 0 0 130,000 0 130,000Planned SF 0 466,000 0 0 73,000 0 0 0 539,000
First Quarter, 2016SUBMARKETS
Anchored Retail Market MatrixLas Vegas, Nevada
FIRST QUARTER 2016 33
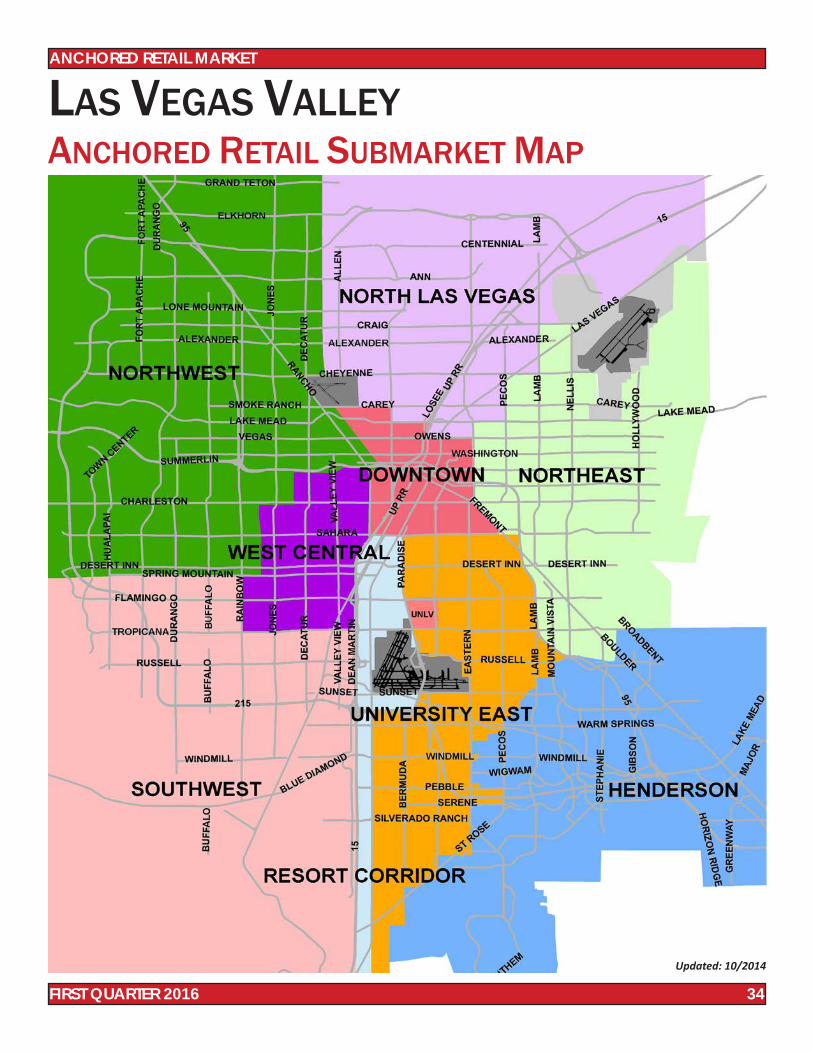
LAS VEGAS VALLEYANCHORED RETAIL SUBMARKET MAP
FIRST QUARTER 2016 34
ANCHORED RETAIL MARKET
Updated: 10/2014