large-scale biodiversity research in the southern taiga
TRANSCRIPT

93For. Snow Landsc. Res. 78, 1/2: 93–118 (2004)
Large-scale biodiversity research in the southern taiga,Northern Mongolia
Michael Mühlenberg1, Hermann Hondong1, Choimaa Dulamsuren1 and Klaus von Gadow2
1 Centre for Nature Conservation, University of Göttingen, von-Siebold-Str. 2, D-37075 Gö[email protected]
2 Institute of Forest Management, University of Göttingen, Büsgenweg 5, D-37077 Gö[email protected]
AbstractThe Khentii Mountains of Northern Mongolia, where the Siberian forest belt borders the steppe,represent a unique and greatly untouched ecosystem. Altogether 15 000 km2 of primeval forestand grassland are completely protected by law (Mongolian Ministry for nature and environment1996). Timber exploitation and use of non-timber forest products are permitted in a buffer zonearound the core area. Field research is being conducted since 1996 on an established field stationin the western Khentii. The aim of the research is to understand the structure of the spatiotempo-ral heterogeneous forest, its dynamics and the impact of utilisation on the ecology and biodiversi-ty of the forest. To deal with the large map scales, the forest was stratified into different typesusing a range of vegetation attributes. The types were mapped using a 4 km2 grid within an area ofabout 150 km2. In order to describe the structure, sample plots were distributed at random withineach of the strata. The natural regeneration was studied separately.
Keywords: Mongolia, Siberian taiga, biodiversity, forest structure, forest regeneration, forest man-agement
1 Introduction
This paper describes some results of the Khonin Nuga Large Scale Ecological ResearchProject in Northern Mongolia. Various research teams representing a variety of scientificdisciplines from different countries, operate from the Khonin Nuga research station whichhas been established in the West-Khentii region by the Centre for Nature Conservation of theUniversity of Goettingen in co-operation with the Faculty of Biology of the NationalUniversity of Mongolia. The general objective of the Khonin Nuga research project is tounderstand the spatiotemporal mosaic of the ecosystem, its dynamics and the impact of util-isation on the ecology and biodiversity of the forest. Scientists from many countries, rep-resenting a great variety of disciplines, have been conducting research in the Khonin Nugaproject. The project objectives require interdisciplinary and longterm commitment by smallgroups including one senior scientist and at least one (usually German or Mongolian) juniorscientist. Several such teams have been conducting surveys of plants, insects, small mammals,birds and fish. These surveys and the associated scientific work have been continued bysome groups for up to three years. Experts with long-term experience in Siberia have visitedthe Khonin Nuga research station over the years. To become independent from short-termproject money and thus ensure long-term survival and continuance the station is run withrelatively low cost.
94 Michael Mühlenberg et al.
An important basis for coordinating the different botanical and zoological research activi-ties is a common site classification system. Soil samples were analysed in order to correlatethe vegetation types with soil types. Profiles through river valleys were taken byDULAMSUREN (2003) at five different places. These profiles were analysed to understandthe natural mosaic of habitats in relation to different forest characteristics. The vegetationclassification provided the foundation for a definition of habitat types for the Khentii(MÜHLENBERG et al. 2000). The habitat types allow a more comprehensive description andecological interpretation than the common plant community types, by creating compatibilitybetween botanical and zoological studies.
For the first few years of investigation it was not our goal to analyse ecosystem functions(e.g. KREBS et al. 2001, reporting about the Kluane Project). Instead, since about half of theflora and fauna of Central Europe is encountered in the region, there is a challenge to simply learn about the ecology of different species by contrasting and comparing the environmental conditions in which they occur. Consequently, the main objectives of theKhonin Nuga research project are:
– To address some fundamental questions of ecology, using reference studies in an environ-ment largely untouched by civilization, including characteristics of natural forests, thebiodiversity of different habitats, landscape heterogeneity, issues of biogeography,phenology, and population biology of selected species. Key hypotheses are:• Low human impact and naturalness are better predictors of species richness than
biogeographical factors such as latitude, size of area or regional climate1.• A natural landscape is less fragmented than a cultural landscape and thus facilitates
greater mobility and greater niche overlap of the different species.• Habitat selection by species in a natural landscape differs from those found in a land-
scape modified by humans, as is the case in Central Europe for example.• The population density of a particular species is often higher in a human-dominated
landscape than in a natural landscape2.– To evaluate the conservation value of the region including presence of a near-pristine
landscape, occurrence of species which are threatened elsewhere, analysis of communitiesin primeval habitats as reference for the assessment of anthropogenic impact on speciescommunities in Europe.
– To conduct impact assessments in areas where timber has been harvested previously(comparison of faunas between undisturbed and managed taiga, composition of speciesand dominance of species).
– To conduct impact assessments of open-cast gold mining in stream valleys includinganalysis of water quality, sediment load, and animal communities, up- and downstream ofthe mining (fish communities and benthos).
– To develop ecologically sound natural resource management strategies (forest manage-ment, non-timber-forest-products3).
1 related to the habitat diversity hypothesis presented by GASTON and BLACKBURN (2000)2 due to the buffer effect (aggregation on few optimal patches), SUTHERLAND (1998)3 examples are nuts of Pinus sibirica, berries, medicinal plants; deer antlers, …
95For. Snow Landsc. Res. 78, 1/2 (2004)
2 Project area
Mongolia is a country characterized by a rather distinct zonation of vegetation types. TheKhentii Mountains of Northern Mongolia, where the Siberian forest belt borders the steppe,represent a unique and greatly untouched ecosystem. The Khentii Mountains have beensubdivided in two subprovinces, the Western and Eastern Khentii (SAVIN et al. 1988). In theWestern Khentii the tree line and the permafrost starts at a lower altitude than in the East-Khentii (Geokriologicheskie usloviya MNR 1974), resulting in different mountain foresttypes with different typological structures.
The study site is situated in the buffer zone of the Strictly Protected Area of Khan Khentii,in the “forest steppe” which forms the southern extension of the Siberian taiga forest.Natural forest growing on permafrost soils is found on the northern slopes, while the southernslopes receiving greater amounts of solar radiation, are naturally covered with steppe vegetation due to the relatively dry conditions. In this transition zone elements of the borealconifer forests meet the floristic elements of the Central-Asiatic steppe. That particularregion in Mongolia is very much exposed to future development because of its valuable timber, water, and productive pasture resources. A greater number of mesophilic elementsare found in the Western Khentii. For example, the Siberian Fir (Abies sibirica) occurs onlyin the Western Khentii and the Siberian Spruce (Picea obovata) forms forest communitiesonly in the Western Khentii. The herbaceous flora exhibits similar differences in the two subprovinces. According to TSEDENDASCH (1995) and TRETER (1997) the most importantfactor influencing the formation of closed forest communities in the Khentii is the topo-graphy (slope and exposition). This hypothesis is supported by our observations and ourpreliminary vegetation assessments. However, important additional factors are precipi-tation, radiation, soil depth and permafrost. The main tree species occurring in the WesternKhentii mountains are Siberian Larch (Larix sibirica), Siberian Pine (Pinus cembra sibirica),Scots Pine (Pinus sylvestris), Birch species (Betula patyphylla most common, also Betulagmelinii and Betula fruticosa), Siberian Spruce (Picea sibirica). Also found are Poplars(Populus tremula most common, also Populus diversifolia) and Elm (Ulmus pumila). Themain vegetation types in the core area of the protected Western Khentii are boreal virginforest, bog and alpine Tundra.The vegetation classification is given in MÜHLENBERG et al.(2000). Initially, more or less in line with HILBIG and KNAPP (1983), eight vegetation typeswere identified. However, we found it more useful to develop a hierarchical classification(Table 1).
It was not possible to classify forest sites based on the herbaceous flora. Significant differ-ences of the coverage in different habitats (Kruskal-Wallis-Test, P < 0.05) showed only threecharacteristic plant species for the Pine forest and five species for the Betula–Larix forest,while 108 plant species were indifferent. This result appears to be typical of a heterogenousnatural landscape. It would be difficult, if not impossible to develop such a classificationusing satellite imagery.

96 Michael Mühlenberg et al.
Table 1. The hierarchical classification system of the different habitats around the research station.
Grasslands (with seven subdivisions)
Mountain dry steppe (G1a) and meadow steppe (G1b) G1
Herb meadow on the terrace in the river valley G2
Meadow on the river terrace with shrubs of Padus asiatica, Salix sp. G3
Wet meadow with Salix sp. and Betula fusca shrubs G4
Wet grassland dominated by Carex sp. G5
Peat meadow G6
River bank with Carex sp., Equisetum fluviatile and Calamagrostis purpurea G7Riparian woodland (with five subdivisions)
Dense Betula fusca shrub and Salix sp. in the river valley R1
Salix sp. shrubs on the river bank (R2a) and Salix sp. shrub thickets with Pinus sylvestris, R2Larix sibirica, Padus asiatica (R2b)
Open riparian forest with Larix sibirica and Betula platyphylla with shrub layer R3
Picea obovata–riparian forest R4
Populus laurifolia–riparian forest, mixed with Padus asiatica, Crataegus sanguinea, R5Cornus alba, Salix sp.Mountain forest (with five subdivisions)
Larix sibirica–Betula platyphylla forest with different successional stages F1
Mixed forest with dominant conifers (Pinus sylvestris, Abies sibirica, Picea obovata, F2Larix sibirica, Pinus sibirica, Betula platyphylla)
Pinus sylvestris forest and Populus tremula–stands F3
Picea obovata–Abies sibirica forest F4
Pinus sibirica forest (“dark taiga”) F5
3 Assessment methods
3.1 Biodiversity
Biodiversity is investigated in different taxa: higher plants, birds, small mammals, somegroups of insects, and fish. Biodiversity research requires assessment of organisms includingtheir occurrence, abundance and distribution. Even for selected taxa it is obviously impossibleto assess all the species within such a big area. Therefore one needs to use sampling techniques adapted to the different kinds of species. Appropriate sampling techniques wereused for all groups (Table 2).

97For. Snow Landsc. Res. 78, 1/2 (2004)
Table 2. Sampling methods used at the Khonin Nuga research station.1 Sherman traps; 2 IMS, it is a joint programme of the three German ornithological research stationsWilhelmshaven, Radolfzell, and Hiddensee using standardised methods (Constant Effort Sites) in orderto pool the data from different study sites in Eurasia. 3 Angle count method for assessing basal area/haafter BITTERLICH (1948, using the Dendrometer of KRAMER and AKÇA 1995)
Field of research Methods used in Khonin Nuga Botanical surveys Mapping of plant communities in 10 x 10 m2 plots according to a matrix of
different ecological factors (variables: slope exposition, canopy closure, soildepth), applying the Braun-Blanquet method.
Entomological Standardised catch of butterflies with the same effort (one hour netting alongsurveys transects in one study plot of 0.5 ha within the chosen habitat, late morning with
sunshine and no wind) in 6 different habitats, twice per month for the whole season (May–September). Two habitat types each with 4 replicates in 2002.
Small mammal Standardised catch with live traps1 arranged both in a trapping web of 148 trapssurveys in three habitats and in a grid of 100 x 100 m each with 121 traps, operating each
for a four-days period monthly. In addition 20 m-ditches with two pitfalls each were established in nine habitats especially to collect shrews (Sorex-species).
Ornithological Mistnetting in two habitats (108 m each) according to the integrated monitoringsurveys of songbird populations2 for the whole season (May till August); mapping along
transects in different habitats in spring time (May until July). Hole-nesting birds were surveyed along transects each 1200 m in length in four forest types, the census was conducted twice in each habitat in May and June.
Stream ecological Electro-fishing in the Eröö-river and its tributaries, sample stations of 3–30 msurveys length corresponding to three most typical fish habitats were marked out in
advance in the river and fished each 3–5 times. Qualitative samples were taken in addition with gill nets by 12–50 mesh sizes and cast nets; fishing with lines occasionally; measurements of the fishes, investigations of the ectoparasites;survey of benthos-community (assessment of relative abundances, with particular interest in stoneflies); standard measurements of physical and chemical parameters including turbidity by photometer.
Forest surveys Stratified random sampling: in four forest types 40–60 points were scattered randomly at which variables of forest structure, including the description of dead wood were evaluated. At each point trees were sampled by plot less method with the help of a dendrometer3. The survey of the variables was prepared by working sheets. In addition dead wood was estimated with methods described by KIRBY
et al. (1998).
An assortment of sampling methods are available which allow an estimate of the speciesrichness with affordable sampling effort (COLWELL and CODDINGTON 1994). Cumulativespecies curves may be used to compare different habitats.The method is known as rarefaction(see COLWELL 1997).
To deal with the large map scales, the forest was stratified into different types using arange of vegetation attributes. The types were mapped using a 4 km2 (2 x 2 km) grid4 withinan area of about 140 km2. The mapped area covers 35 grid cells. The areas of the differentvegetation types are shown in Figure 1.
4 following the 1:50 000 universal transverse mercator (UTM) grid

98 Michael Mühlenberg et al.
Each grid cell was sampled using two parallel transects 500 m apart. The vegetation formation was mapped on the spot and located using a global positioning system (GPS). Thenatural regeneration was separately assessed.
3.2 Sampling and monitoring forests
Forest composition and structure was investigated at large scales, using stratified randomsampling.The forest types were classified according to the dominant tree species, resulting in4 different strata: Larix–Betula forest with different successional stages (F1), Picea–Abiesforest (F4), Pinus sibirica forest (F5), and Populus laurifolia riparian forest (R5). In order todescribe the structure, 40 to 60 sample plots were distributed at random within each of thestrata. In each plot variables of forest structure were assessed, including the dead wood. Intotal 184 points were sampled.
The dynamics of a forest ecosystem is influenced by tree growth which in turn is a reactionto the specific environmental conditions existing on the site. Tree growth data, obtained in avariety of ways, are essential for predicting the consequences of harvesting decisions. Thelimited availability of research funds and the increasing complexity of the questions that arebeing addressed by research, necessitate a continuous evaluation of the optimum design ofgrowth trials. Forest management objectives are continually changing. This requires datathat permit prediction of forest growth for any set of site conditions and management objec-tives.
Three types of growth trials were established. Permanent plots are established for col-lecting data for a particular silvicultural program. The plots are remeasured, usually at regular intervals, until harvesting. Temporary plots, measured only once, provide age-basedinformation about relevant state variables which is used to construct a yield table, again
0
100
200
300
400
500
600
ha o
n 14
0 km
2 re
sear
ch a
rea
700
800
vegetations typesa b c d e f g h
a Mountain steppe/meadow steppe (G1)b Peat meadow/wet grassland with Salix
(G4–6)c Betula fusca + Salix shrub (R1, R2)d Riparian forest types (R3, R4, R5)e Pinus sylvestris forest with Larix sibirica,
Betula platyphylla, Populus tremula,Abies, Picea, Pinus sibirica (F2, F3)
f Larix sibirica–Betula platyphylla forest (F1)
g Picea–Abies forest (F4)h Pinus sibirica forest (F5)
Fig. 1. Areas of different vegetation types in the 35 grid cells of the study site of the Khonin Nugaregion. The dominant vegetation is the Larix–Betula forest with its different successional stages.

99For. Snow Landsc. Res. 78, 1/2 (2004)
assuming normal or representative silviculture. Interval plots are remeasured at least once,thus providing an average rate of change in response to a given set of initial conditions.After each remeasurement, a decision was taken whether to abandon the trial or maintain itfor another growth interval.
3.2.1 Permanent plotsOne of the advantages of a database derived from permanent plots is the potential todescribe polymorphic growth patterns by evaluating the data of each plot separately and byexpressing the parameters of a growth model as a function of specific site variables. In thisway, it is possible to develop non-disjoint polymorphic growth models (CLUTTER et al. 1983;KAHN 1994) and disjoint polymorphic site index equations, which depict the site-specificdevelopment of certain forest variables over age. A recent example of a polymorphic heightmodel is presented by JANSEN et al. (1996). Many of the existing yield tables are based onpermanent plots (SCHOBER 1987; JANSEN et al. 1996; ROJO and MONTERO 1996).
A disadvantage of the permanent plot design is the high maintenance cost of the researchinfrastructure and the long wait for data. The object of the trial is not always achieved, asplots may be destroyed prematurely by wind or fire, or by unauthorized cutting.
3.2.2 Temporary plotsTemporary plots may provide a quick solution in a situation were nothing is known aboutforest growth. They are measured only once, but cover a wide range of ages and growingsites. Thus, the sequence of remeasurements in time is substituted by simultaneous pointmeasurements in space. This method has been used extensively during the 19th century(KRAMER 1988, p. 97; ASSMANN 1953; WENK et al. 1990, p. 116)5. Temporary plots are stillbeing used today for constructing growth models in situations where empirical data are notavailable (BIBER 1996).
For this purpose, increment cores may be taken from a reference tree (usually the lastfive years are evaluated).To explain variations in diameter growth, it is necessary to evaluatethe neighbourhood constellation in the immediate vicinity of the tree. The reference treeshould be positioned in the centre of a competition area, the size of which depends on thetree density. Temporary plots are often useful for establishing relationships between variables. The main limitation of temporary plots, when increment cores are not used, is thefact that they cannot provide information about the rate of change of a known state variable, thus preventing the use of some contemporary techniques of growth modelling(GARCÍA 1988).
5 During the 19th century, the “Weiserverfahren” and the “Streifenverfahren” were the most popularmethods for obtaining growth information rapidly (KRAMER 1988, p. 97). In the approach known as“Weiserverfahren” the growth of single trees was reconstructed using stem analysis techniques.Another method known as the Streifenverfahren was used to gather data in numerous normallystocked temporary plots of different ages and site qualities for developing yield tables (BAUR 1877).

3.2.3 Interval plotsA compromise may be achieved by using a system of growth trials which maintains theadvantages of permanent plots, i.e. obtaining rates of change of known initial states, as wellas temporary plots, i.e. broad coverage of initial states and minimum wait for data.
Interval plots are measured at least twice, the interval between the measurements beingsufficiently long to absorb the short-term effects of abnormal climatic extremes. The intervalis a period of undisturbed growth. Measurements should coincide with a thinning operation,to obtain data not only about tree growth, but at the same time about the change of statevariables resulting from a silvicultural operation. The thinning effects may be assessed at theinitial (t1) or at the final (t2) measurement, or at both occasions. The concept is illustrated inFigure 2.
GARCÍA (1988) proposed a multi-dimensional system of differential equations, in whichthe future development of a forest depends solely on the present state.To be able to developsuch a model, it is necessary to have data describing initial states as well as the associatedchanges of the state variables.
3.3 Forest regeneration
Natural regeneration is an important element of forest dynamics.Accordingly, the distributionof the density, height and browse damage is often assessed in forest ecological surveys. Themethod employed in Khonin Nuga involves 10 m2 circular sample plots (KIRCHHOFF 2003).The sapling representing the sample plot with its height and species is the one nearest to thecenter of the sample plot. The illustration in Figure 3 shows the representative sapling(Abies with a height of 58 cm) plus two saplings within the circular plot which are used todetermine the sapling density, which is equal to 3000 plants per ha.
The class frequencies derived from the representative trees represent area proportions(STAUPENDAHL 1997). A disadvantage of this otherwise effective method is the difficulty,due to the small plot size, to capture rare species.
100 Michael Mühlenberg et al.
Fig. 2. Two successive measurements for obtaining the change of a state variable W resulting from a) athinning and b) natural growth.
∆W
W
W2
W1
t1 t2 t
∆t
a b
a
*
*
*
*

101For. Snow Landsc. Res. 78, 1/2 (2004)
4 Preliminary results
4.1 Species diversity
More than 1150 plant species characteristic of the steppe ecosystem, 253 bird and more than50 ungulate species were identified in the protected area of the Khentii. Prominent largemammals are the Maral (Cervus elaphus maral), Moose (Alces alces), Siberian Roe Deer(Capreolus pygargus), Musk Deer (Moschus moschiferus), Wild Boar (Sus scrofa), BrownBear (Ursos arctos), Wolf (Canis lupus), Lynx (Lynx lynx), Wolverine (Gulo gulo), Sable(Martes zibellina) (READING et al. 1994). Except for the Musk Deer all other mentionedspecies may occur in Europe.Thus the area under study can serve in some way as a referencearea representing natural conditions in Europe. Considering the entire fauna about half ofthe species encountered in the study area are palearctic. Table 3 presents an overview of thebiodiversity found in Khonin Nuga and a comparison with findings from other areas inEurope. 50 percent of the butterfly species and 51 percent of the bird species found inKhonin Nuga are palaearctic and occur also in Central Europe (Fig. 4).
The analysis of cumulative species curves for butterflies shows that, in order to evaluatethe species diversity in different habitats, it is necessary to capture at least 2000 individuals.
Rarefaction curves are suitable for describing differences between habitats. They com-pare species numbers at the same sample size, in our case with the same amount of capturedindividuals. Figure 5 shows the rarefaction curve of the butterfly community in two habitats.
Sample point
Circular plot (r = 1.78 m).Number of saplings in plotdefines sapling density.
“Representative” saplingnearest to sample point;used to determine speciesand height.
Abies/58
Fig. 3. Schematic representation of a regeneration sample plot showing the tree species and saplingheight in cm. The representative sapling in this example is Abies, with a height of 58 cm; the sapling density is 3000 plants/ha.

Table 3. Comparison of known species numbers in different regions.1 KARSHOLT and RAZOWSKI 1996, Lepidoptera of Europe; 2 JONSSON 1992, Vögel Europas; 3 HAGE-MEIJER and BLAIR 1997, EBCC Atlas of European Breeding Birds; 4 BfN Rote Liste Deutschlands,1998; 5 bird species number in Germany inclusive guests: 515 species; 6 DENNIS 1992; 7 GREENWOOD
et al. 1993; 8 MÖCHBAYAR 1999; 9 Redkie Zivotnye Mongolii (pozvonocnye), Moskva 1996; 10 DAWAA
et al. 1994: Kommentierte Checkliste der Vögel und Säuger der Mongolei; 11 ULZIJCHUTAG 1989; 12 owndata 1998–2002. BV = Brutvögel = Breeding bird species.
Region Number of known Number of known Known species Total landbutterfly species bird species number of higher area (km2)
plants
Europe 4681 4692, 500 BV3 12 500 10 531 000 Germany 1854 2883, 260 BV5 2691 357 042 Great Britain 626 215 BV7 1494 241 752Mongolia (207)8 415 (322 BV)9, 440 282311 1 565 000
(360 BV)10
Khonin Nuga12 146 162, 123BV 553 140
102 Michael Mühlenberg et al.
Fig. 4. Species richness and distribution of butterflies. Left: the black part of the columns indicates thenumber of species shared with Mongolia (only the butterfly assemblage of Khonin Nuga is presentedfor Mongolia); right: cumulative curve for butterfly species in West Khentei, species pooled from thecatch of 2000 and 2001. Broken lines indicate the 95%-confidence limit.
Finl
and
0
100
200
300
400
500
600
Num
ber
of s
peci
es
Mon
golia
Eur
ope
Russi
a
Swed
en
Bri
tain
Ger
man
y
Chi
na 0
20
40
60
80
100
120
140
Num
ber
of s
peci
es
Species cumulative curve of butterflies in West Khentei
Number of individuals10000 2000 3000 4000 5000 6000 7000

103For. Snow Landsc. Res. 78, 1/2 (2004)
Altogether 2114 individuals in 111 species were found in the Herb Meadow (G2) typeand 913 individuals in 95 species in the Mountain Dry Steppe (G1), in the sample of the year2002. Habitat G2 has a higher species richness than habitat G1.
The butterfly population was used to test the faunistic similarity between different habitats. As an example the butterfly community of two habitats which appear particularlydifferent is compared: a moist herb meadow with tall grass (G2, G3) and a mountain drysteppe with short grass (G1). Twice per month, between May and August 2002, the butterfly
Fig. 5. Rarefaction curves showing the species richness of herb meadow (habitat G2) and mountain drysteppe (habitat G1). Data are pooled from 4 replicates of each habitat in 2002.
20
40
60
80
100
120
0 500 1000 1500 20000
Mountain Dry Steppe
Herb MeadowE
xpec
ted
num
ber
of s
peci
es
Fig. 6. Cluster diagram of the dissimilarity indices (1 – Morisita Horn) for the butterfly assemblages ofthe 4 herb meadow plots (HM) and of the 4 mountain dry steppe plots (MDS).
HM4
HM3
HM2
MDS4
MDS3
MDS1
MDS2
HM1
Single Linkage ClusterDistance = 1 – Morisita Horn
Cluster Diagramm Butterflies 2002 (n = 3027)
0.10 0.15 0.20 0.25 0.30 0.35
Distance

104 Michael Mühlenberg et al.
assemblages were assessed on four sampling areas on each vegetation type using the standardsampling method. The result is presented using a cluster diagram (Fig. 6). The cluster diagram shows the dissimilarity indices (1 – Morisita Horn) for the butterfly assemblages ofthe four herb meadow plots (HM) and of the four mountain dry steppe plots (MDS). TheANOVA test reveals no overall differences between the plots (R = 4.07, p = 0.089). Thesepreliminary results confirm a high similarity between different habitats in the studied naturallandscape.
The similarity indices of the small mammal communities between different habitats aresurprisingly high as well, indicating the same large overlapping of species in the habitats.These findings support the hypothesis of greater mobility and greater niche overlap in a natural landscape (refer to the Chapter 1).
4.2 Forest spatial structure and diversity
The old-growth forest (Pinus sibirica – taiga, F5) exceeds all other forest types in basal areaof living and dead wood, but for cavity-nesting birds the holes in Betula trees are mostimportant. Different forest types (e.g. successional stages of Larix–Betula and Picea–Pinus)can be grouped together due to fire disturbances considering the tree species composition.Riparian woodland (R2, R3, R5) sustains the highest biodiversity but is most restricted inarea.
4.2.1 Habitat treesThe types of damage investigated were fire, wind and rot.Wind caused breakages, rot hollowtrees. Most of fire damages and most of the hollow trees are found in the Betula–Larix foreststands (F1). Most of the tree hollows are provided by Betula platyphylla trees (BAI et al.2003). Betula is therefore a key species for cavity nesting birds. The Pinus sibirica forestexceeds the other forest types, both in total basal area and number of big-diameter trees.
Clustering these samples according to the basal area of the tree species confirms thestratification by methods of vegetation analysis (Fig. 7a, cluster 1). Pinus sibirica forest ismost clearly separated from other forest types. The mixture of Betula–Larix forest standswith Picea–Pinus and Populus riparian forest at right hand in the cluster documents the highinfluence of fire, in all stands Betula platyphylla as a pioneer tree is represented with a ratherhigh basal area. Some plots of Picea–Abies–Pinus forest (green colour) are grouped togetherlike a low disturbed conifer forest (in the cluster 1 right of the Pinus sibirica block). If clustering is done with variables of structure, the picture changes (Fig. 7b, cluster 2): the sample plots are now not grouped in the vegetation formations (the classified 4 foresttypes). The mixture reflects more the high dynamics in the natural landscape.
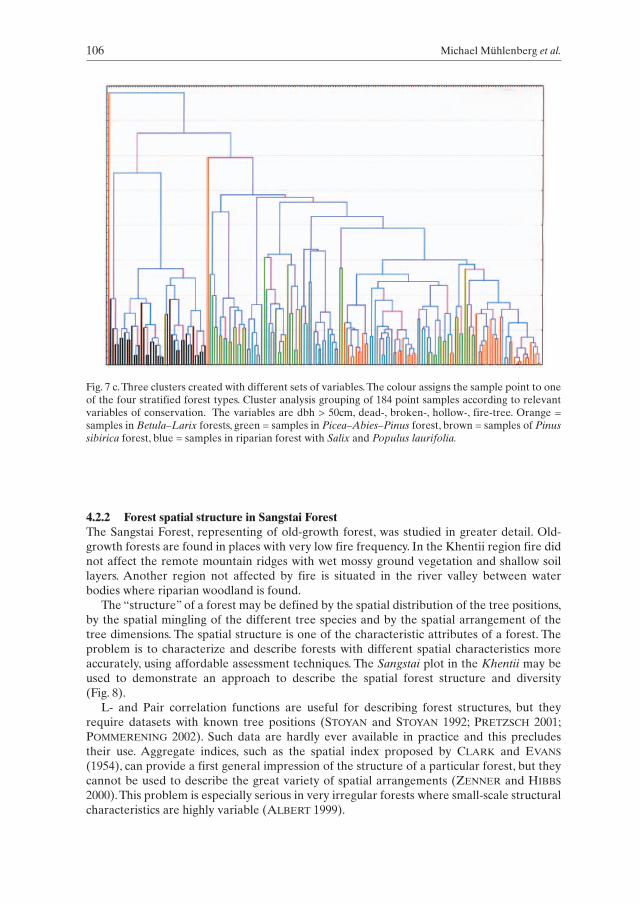
A relevant feature of interest to biologists is the occurrence of “wildlife trees”, rep-resenting particularly big trees, dead or broken trees, trees with hollows and fire damage.Clustering with these variables leads to the cluster 3 (Fig. 7c). Consider the significant dif-ferent picture of the cluster 3 in comparison with cluster 1. One conclusion is that mappingof vegetation or interpretation of satellite photos according to vegetation classificationmethods (e.g. dominant tree species) does not necessarily delineate important stands for conservation purposes. It may be concluded that for evaluating conservation values,terrestrial assessment is also needed.

105For. Snow Landsc. Res. 78, 1/2 (2004)
Fig. 7 a.Three clusters created with different sets of variables.The colour assigns the sample point to oneof the four stratified forest types. Cluster analysis grouping of 184 point samples according to the basalarea of the tree species. Orange = samples in Betula–Larix forests, green = samples in Picea–Abies–Pinus forest, brown = samples of Pinus sibirica forest, blue = samples in riparian forest with Salix andPopulus laurifolia.
Fig. 7 b.Three clusters created with different sets of variables.The colour assigns the sample point to oneof the four stratified forest types. Cluster analysis grouping of 184 point samples according to the diam-eter classes of the trees. Orange = samples in Betula–Larix forests, green = samples in Picea–Abies–Pinus forest, brown = samples of Pinus sibirica forest, blue = samples in riparian forest with Salix andPopulus laurifolia.
106 Michael Mühlenberg et al.
Fig. 7 c.Three clusters created with different sets of variables.The colour assigns the sample point to oneof the four stratified forest types. Cluster analysis grouping of 184 point samples according to relevantvariables of conservation. The variables are dbh > 50cm, dead-, broken-, hollow-, fire-tree. Orange =samples in Betula–Larix forests, green = samples in Picea–Abies–Pinus forest, brown = samples of Pinussibirica forest, blue = samples in riparian forest with Salix and Populus laurifolia.
4.2.2 Forest spatial structure in Sangstai Forest The Sangstai Forest, representing of old-growth forest, was studied in greater detail. Old-growth forests are found in places with very low fire frequency. In the Khentii region fire didnot affect the remote mountain ridges with wet mossy ground vegetation and shallow soillayers. Another region not affected by fire is situated in the river valley between water bodies where riparian woodland is found.
The “structure” of a forest may be defined by the spatial distribution of the tree positions,by the spatial mingling of the different tree species and by the spatial arrangement of thetree dimensions. The spatial structure is one of the characteristic attributes of a forest. Theproblem is to characterize and describe forests with different spatial characteristics moreaccurately, using affordable assessment techniques. The Sangstai plot in the Khentii may beused to demonstrate an approach to describe the spatial forest structure and diversity (Fig. 8).
L- and Pair correlation functions are useful for describing forest structures, but theyrequire datasets with known tree positions (STOYAN and STOYAN 1992; PRETZSCH 2001;POMMERENING 2002). Such data are hardly ever available in practice and this precludestheir use. Aggregate indices, such as the spatial index proposed by CLARK and EVANS
(1954), can provide a first general impression of the structure of a particular forest, but theycannot be used to describe the great variety of spatial arrangements (ZENNER and HIBBS
2000).This problem is especially serious in very irregular forests where small-scale structuralcharacteristics are highly variable (ALBERT 1999).

For this reason, three types of neighbourhood-based parameters are used, which areknown as Contagion, Mingling and Differentiation. The parameters can be used to provide acomprehensive description of the spatial structure of a forest. Assessment and descriptionmay be tree-based or point-based. In the tree-based approach a sample tree closest to a sample point is chosen as reference tree and the attributes of its immediate neighbours (size,species) and the regularity of their positions are related to the reference tree. In the point-based approach, the structural attributes of a neighbourhood group of trees (variationof tree species and sizes; regularity of tree positions) is assessed at each sample point.
ContagionThe variable contagion Wi describes the degree of regularity of the spatial distribution of thefour trees nearest to a reference tree i6. Wi is based on the classification of the angles αj
between these four neighbours. A reference quantity is the standard angle α0, which isexpected in a regular point distribution. The binary random variable vj is determined bycomparing each αj with the standard angle α0. The Contagion is then defined as the pro-portion of angles αj between the four neighbouring trees which are smaller than the standardangle α0:
(1)
107For. Snow Landsc. Res. 78, 1/2 (2004)
Species Trees per ha Basal area per ha
Abies sibirica 280 4.22
Larix sibirica 8 1.64
Picea obovata 40 0.64
Pinus sibirica 212 34.69
Total 540 41.20
Fig. 8. Sangstai plot with buffer showing tree positions (left) and the corresponding plot data with trees(N/ha) and basal areas (G/ha) per hectare listed for the four species occurring in the plot (right).Red = samples in Betula–Larix forests, green = samples in Picea–Abies forests, spotted = samples ofPinus sibirica forests, blue = samples in riparian forests with Salix and Populus Laurifolia.
Wi = 1
4v j
j=1
4
∑⎩⎨⎧
=<
otherwise ,0
,1 0ααv j
jwith and 10 ≤≤ iW
6 For details refer to GADOW et al. (1998). Four neighbours have proved to be most suitable based onpractical considerations in connection with the field assessment methods (ALBERT 1999; HUI andHU 2001).

108 Michael Mühlenberg et al.
Wi = 0 indicates that the trees in the vicinity of the reference tree are positioned in a regularmanner, whereas Wi = 1 points to an irregular or clumped distribution. With four neighbours, there are five possible values that Wi can assume. The estimator for theContagion of a given forest is W the arithmetic mean of all Wi-values. Although theContagion mean value W is quite informative for characterizing a point distribution, it isoften advisable to study the distribution of the Wi -values which reveals the structural variability in a given forest (Table 4).
Table 4. Distribution of the variable “contagion” which describes the degree of regularity of the spatialdistribution of the four trees nearest to a reference tree i. The spatial distribution is random with a smallproportion of very clumped neighborhoods.
W All species Abies sibirica Larix sibirica Picea obovata Pinus sibirica0.00 0.00 0.00 0.00 0.00 0.000.25 0.21 0.16 0.50 0.50 0.230.50 0.54 0.57 0.50 0.40 0.530.75 0.22 0.24 0.00 0.10 0.231.00 0.02 0.01 0.00 0.00 0.02
Based on the work by HUI and GADOW (2002), the spatial distribution may be characterizedas random, although about two percent of the trees are situated in a neighbourhood with avery clumped distribution (W = 1.0). Neighbourhoods with a very regular distribution(W = 0) are not encountered.
Species minglingSpecies diversity has become a very important aspect of forest management and conservationand a number of parameters are available to describe it.An example is the Shannon-Weaverindex which has been used in ecological applications by PIELOU (1977, p. 293). We proposeto evaluate the species diversity in the vicinity of a reference tree and define mingling as the proportion of the n nearest neighbours that do not belong to the same species as the reference tree (GADOW and FÜLDNER 1992), specifically:
(2)
with
∑=
=4
1j
ji v4
1M
⎩⎨⎧
=otherwise 0,
i tree reference as species samethe to belongsj neighbour 1,v j
10 ≤≤ iMand

109For. Snow Landsc. Res. 78, 1/2 (2004)
With four neighbours, the mingling attribute Mi can assume five values. Table 5 presents themingling distributions for all trees and for each of the four tree species in the Sangstai plot.
Table 5. Distribution of the variable “mingling” which describes the degree of regularity of the spatialdistribution of the four trees nearest to a reference tree i.
M All species Abies sibirica Larix sibirica Picea obovata Pinus sibirica0.00 0.13 0.23 0.00 0.00 0.040.25 0.22 0.23 0.00 0.00 0.260.50 0.22 0.26 0.00 0.00 0.230.75 0.26 0.21 0.00 0.40 0.301.00 0.16 0.07 1.00 0.60 0.17
The mingling distribution for all species shows a variety of mingling constellations. 13% ofthe trees, for example, occur in pure groups and 22% in groups where half of the trees are ofthe same species. As expected, the rare species (Larix and Picea) have the highest minglingvalues.The most frequent species Abies and Pinus occur in all the different mingling constel-lations. Abies sibirica is frequently found in pure groups.
Size differentiation and dominanceThe tree attribute “dominance” of neighbours was proposed by HUI et al. (1998) to relatethe relative dominance of a given tree species to the immediate neighbourhood. We definedominance as the proportion of the n nearest neighbours of a given reference tree which aresmaller than the reference tree, which is calculated in the same way as the previous tree-based structural parameters:
(3)
With four neighbours, Ui can assume five values. Low U-values indicate dominance. Thedominance criterion is useful if we wish to describe the relative dominance of a particulartree species. The highest value of 1 means that the tree is the smallest one in its immediateneighbourhood. Figure 9 shows the results for the two most common species, Pinus sibiricaand Abies sibirica.
The high dominance values of Pinus sibirica can be expected as this species is representedwith a basal area of almost 35 m2/ha and less trees per ha than Abies sibirica which is rep-resented by a basal area of only 4.22 m2/ha. Pinus sibirica and Larix sibirica are mostly dominant while Abies sibirica and Picea are more subdominant or suppressed.
∑=
=4
1j
ji v4
1U
⎩⎨⎧=
otherwise 0,
i tree reference than smalleris j neighbour 1,v jwith
and 10 ≤≤ iU

110 Michael Mühlenberg et al.
4.3 Forest regeneration
Sustainable development of a natural or managed forest ecosystem depends on the ability ofthe system to regenerate itself. The recruitment potential is a key factor in the SouthernTaiga forests which are regularly affected by sometimes very destructive and large scalewildfires. To evaluate this potential, KIRCHHOFF (2003) made an assessment of the naturalregeneration in three different forest environments. Figure 10 presents an impression ofthree assessment sites and a graph of the terrain features and occurrence of the differenttree species.The corresponding distributions of regeneration density classes for the differenttree species are also shown.
Sample sites were chosen with three specific questions in mind:1) What is the capability of the forest to recolonize burnt areas? 2) What is the regeneration potential in the managed forests, which were heavily exploited
towards the end of the 20th century and where mostly Larix sibirica was cut? 3) What is the regeneration potential in the virgin dark taiga forests, a very sensitive eco-
system which is dominated by Pinus sibirica and Abies sibirica?
This first assessment done by KIRCHHOFF (2003) suggests that forest regeneration is notendangered in any of these three problem sites.
Fig. 9. Distribution of dominance values. Pinus sibirica (shaded columns) occurs mostly as a dominanttree while Abies sibirica (white columns) is mostly subdominant.
0.0
0.1
0.2
0.3
0.4
0.5
U
0.00 0.25 0.50 0.75 1.00
P

111For. Snow Landsc. Res. 78, 1/2 (2004)
East West
Pinus sylvestris
Larix sibirica
Populus tremula
Betula platyphylla
perc
ent
0
10
20
40
50
60
no regen. Betulaplatyphylla
Populus Pinussylvestris
Larixsibirica
30
no regeneration 1000–5000 per ha
5000–10000 per ha 10000–50000 per ha
Fig. 10 a. Burnt forest SharlangAltitude 1000–1100 m, slope 20–30°; regeneration in strips parallel with slope; two regeneration ageclasses are found.
South North
Betula platyphylla
Larix sibirica
perc
ent
0
10
20
30
40
50
no regen. Betulaplatyphylla
Abiessibirica
Pinussylvestris
Larixsibirica
no regeneration 1000–5000 per ha
5000–10000 per ha 10000–50000 per ha
Fig. 10 b. Managed forest HausbergAltitude 900 m, moderate slope; regeneration inclumps; regeneration of Abies sibirica.

5 Discussion
Biological diversity describes the variety of life at different levels of biological organisation(SPELLERBERG and SAWYER 1999). Inventorying biodiversity involves the surveying, sorting,cataloguing, quantifying and mapping of entities such as genes, individuals, populations,species, habitats, biotopes, ecosystems and landscapes or their components, and the synthesisof the resulting information for the analysis of processes (HEYWOOD 1995)7. Based on practical considerations, assessment and analysis are usually concentrated on the specieslevel. We selected in our study sites some taxa from which we have some knowledge forcomparison and the experts available to work in the field. It is not our aim, to approach an“All Taxa Biodiversity Inventory” (JANZEN and HALLWACHS 1994).
Half of the species found in our project area are palearctic, i.e. the area under studyserves in some way as a reference area with natural conditions for Europe, e.g. the still existingcoexistence of all big mammals (top carnivores and big herbivores) in an unchanged land-scape. Our study of biodiversity aims to find answers to the following questions:
112 Michael Mühlenberg et al.
perc
ent
0
10
20
30
40
50
no regen. Abiessibirica
Pinussibirica
no regeneration 1000–5000 per ha
5000–10000 per ha 10000–50000 per ha
60
Fig. 10 a–c. Three examples of areas where natural regeneration was assessed (KIRCHHOFF 2003).
West East
Pinus sibirica Abies sibirica Picea obovata
Fig. 10 c. Virgin taiga forest SangstaiAltitude 1500 m, flat; dense forest with few gaps;regeneration in clumps.
7 Global Biodiversity Assessment, (GBA; HEYWOOD 1995)

113For. Snow Landsc. Res. 78, 1/2 (2004)
1) What are the relationships between certain attributes of forest structure and the variablesdescribing biodiversity? Can forest structure attributes be used to predict biodiversity?
2) What is the biogeographic significance of the Khentii region in the international context? 3) What is the conservation value of the Khentii region in the national and international
context?4) Is it possible to use biodiversity indicators to describe human impacts in the region?
Clearly, the answers to these questions may turn out to be dependent on the spatial scale ofour work. Until now, research in Khonin Nuga has concentrated on the vascular plants, birds,small mammals, butterflies, grasshoppers, fish and stoneflies. To be able to deal with thequestions (1) and (2), it was necessary to develop a classification and description of the vegetation and habitat types. Concerning question (1), relationships have been establishedbetween the structural variety of the vegetation and the number of species richness (e.g.KARR and ROTH 1971; WILLSON 1974; MÜHLENBERG 1980; ARNOLD 1983; NILSSON et al.1988; JEDRZEJEWSKA et al. 1994; KUJAWA 1997; SULLIVAN et al. 2001; LOHR et al. 2002).Animal groups that exploit the environment in three dimensions are most sensitive to plantcommunity structure, which has been shown in the classical study by MACARTHUR andMACARTHUR (1961); MACARTHUR (1964) who found a correlation between foliage heightdiversity and bird species richness.
In our area the Larix–Betula forest (F1) as the most extended forest harbours the richestbreeding bird community (41 out of 109 species), followed from the riparian woodland (R5)with 20 species out of 109. 18 breeding bird species are recorded in the Pinus sibirica forest(F5) (WICHMANN 2001). In the successional series of F1 the bird species richness increasesfrom burned area to young forest to old forest, indicating an increase in biodiversity withincreasing structure (WICHMANN 2001). BOURSKI (1996) confirmed a highest richness in thebreeding bird assemblage for the flood-plain (corresponding to our riparian woodlands),decreasing to the taiga forest and last to the burned areas.
The three modes of clustering our sample points of forest structure show us, that basalarea of tree species or simple variables like diameter are not useful to predict biodiversity.For that approach a set of specific variables has to be measured on a large scale.
The Khentii mountains are part of the “Transbaikal region” (for bird studies seeKOZLOVA 1930; GLADKOV and SELIVONIN 1963; BOLD 1984; VASILCHENKO 1987). Thespecies richness of birds and trees is known to be higher in the eastern Palearctic than in thewestern part due to different histories in the two biogeographical regions (MÖNKKÖNEN
1994; MÖNKKÖNEN and VIRO 1997). Our botanical survey shows that the forested northernslopes are home to more western Eurosiberian and Uralosiberian flora elements whereas onthe steppe of the southern slopes East-Asian elements from the Mandshurian-Altaian-Dahurian area are dominating (DULAMSUREN and MÜHLENBERG 2003).
The national conservation value of the Khentii region (question 3) is highlighted by map-ping of the plant species out of the Red Data Book of Mongolia (MÜHLENBERG et al. 2000).The international conservation value is documented by the presence of many palearcticspecies of which the populations in Europe are threatened (MÜHLENBERG et al. 2000;WOYCIECHOWSKI et al. 2001). About three quarters of the palearctic butterflies, half of thepalearctic species of birds and a third of the palearctic plant species found in Khonin Nugahave some threat status in Central Europe (BfN 1996, 1998). The overall conservation valueof the region exists because of the huge natural landscape itself (>> 20 000 km2) which is notyet altered by humans. The unmanaged forests provide fallen timber and a great amount ofwoody debris what is generally seen as being of conservation value (JONSELL et al. 1998;KLAUSNITZER 1999; IRMLER et al. 1996; JONSSON and KRUYS 2001; MACNALLY et al. 2002;GÖTMARK and THORELL 2003).

114 Michael Mühlenberg et al.
Question (4) relating to the use of biodiversity indicators to describe human impacts isstill under investigation. The importance and potential effects of many proposals for foresthabitats has to be ascertained for the Khentii region (e.g. LANDRES et al. 1988; PEARSON
and CASSOLA 1992; WEAVER 1995; NILSSON et al. 1995; STORK et al. 1997; DUFRÊNE andLEGENDRE 1997; NIEMELÄ 1997; JONSSON and JONSELL 1999; LINDENMAYER et al. 1999;KERR et al. 2000; MIKUSINSKI et al. 2001; TAYLOR and DORAN 2001; RAINIO and NIEMELÄ
2003). This goes beyond ecological considerations and implies political ones as well. Onlylarge samples can help to understand the correlation between forest structure and biodiver-sity. One of the future challenges is the development of a sustainable management systemfor the forest resources which does not yet exist in Mongolia. Concerning mature foresthabitat and the maintenance of coarse woody debris for biodiversity, European guidelinesfor sustainable management cannot easily be adapted. Alternative guidelines need to bedeveloped and evaluated for this very unique ecosystem.
AcknowledgementsWe acknowledge the generous support of the Mongolian project partners, especially the Facultyof Biology of the National University of Mongolia and the German Technical Service (GTZ) inMongolia. The field data were collected by students from Mongolia, Taiwan and Germany; regen-eration data were collected by B. Kirchhoff; tree structure data by A. Gradel. H. Heydecke helpedwith data processing using the software developed by Chen BoWang. We are grateful for usefulcomments received from two anonymous referees.
6 References
ALBERT, M., 1999: Analyse der eingriffsbedingten Strukturveränderung und Durchforstungs-modellierung in Mischbeständen. PhD Diss., Faculty of Forest Sciences, Universität Göttingen,Germany. Hainholz Verlag. 63–68.
ARNOLD, G.W., 1983: The influence of ditch and hedgerow structure, length of hedgerows, andarea of woodland and garden on bird numbers on farmland. J. Appl. Ecol. 20: 731–750.
ASSMANN, E., 1953: Zur Bonitierung süddeutscher Fichtenbestände. Allg. Forst Z. Waldwirtsch.Umweltvorsorge 10: 61–64.
BAI, M.-L.; WICHMANN, F.; MÜHLENBERG, M., 2003: Hole abundance and nest-site preference ofhole-nesting birds in a primeval boreal forest of Mongolia. Acta Ornithol. 38: 95–102.
BAUR, F., 1877: Die Fichte in Bezug auf Ertrag, Zuwachs und Form. Berlin. 103 pp.BIBER, P., 1996: Konstruktion eines einzelbaumorientierten Wachstumssimulators für Fichten-
Buchen-Mischbestände im Solling. Diss. Forstwissenschaftliche Fakultät der Ludwig-Maximilians-Universität München. 239 pp.
BITTERLICH, W., 1948: Die Winkelzählprobe. Allg. Forstztg. [Wien]. 4–5.BOLD, A., 1984: Die Vögel des Chentej und ihre praktische Bedeutung. Wissenschaftliche
Beiträge Universität Halle-Wittenberg 4: 132–151.BOURSKI, O., 1996: Bird population dynamics in relation to habitat quality. In: SETTELE, J.;
MARGULES, C.R.; POSCHLOD, P.; HENLE, K. (eds) Species Survival in Fragmented Landscapes,Kluwer Academic Publishers. 52–60.
BfN (Bundesamt für Naturschutz), 1996: Rote Liste gefährdeter Pflanzen Deutschlands. Bonn-Bad Godesberg, Schriftenreihe für Vegetationskunde 28: 744 pp.
BfN (Bundesamt für Naturschutz), 1998: Rote Liste gefährdeter Tiere Deutschlands. Bonn-BadGodesberg, Schriftenreihe für Landschaftspflege und Naturschutz 55: 434 pp.

115For. Snow Landsc. Res. 78, 1/2 (2004)
CLARK, P.J.; EVANS, F.C., 1954: Distance to nearest neighbor as a measure of spatial relationshipsin populations. Ecology 35, 4: 445–453.
CLUTTER, J.L.; FORTSON, J.C.; PIENAAR, L.V.; BRISTER, G.H.; BAILEY, R.L., 1983: Timber man-agement – a quantitative approach. John Wiley: 333 pp.
COLWELL, R.K., 1997: EstimateS 5. Statistical Estimation of Species Richness and Shared Speciesfrom Samples. Version 5.0.1. [Published online] Available from internet <http://www.viceroy.eeb.uconn.edu/estimateS>. Department of Ecology and Evolutionary Biology, University ofConneticut Storrs, CT 06269-3042, USA.
COLWELL, R.K.; CODDINGTON, J.A., 1994: Estimating terrestrial biodiversity through extra-polation. Philos. Trans. R. Soc. Lond. (Series B) 345: 101–118.
DAWAA, N.; BUSCHING, W.-D.; SUMIYAA, D.; BOLD, A.; SAMJAA, R., 1994: KommentierteCheckliste der Vögel und Säuger der Mongolei (Köthen), Bd. 1, Vögel.
DENNIS, R.L.H., 1992: The Ecology of Butterflies in Britain. Oxford University Press. 354 p.DUFRÊNE, M.; LEGENDRE, P., 1997: Species assemblages and individual species: the need for a
flexible assymetrical approach. Ecol. Monogr. 67, 3: 345–366.DULAMSUREN, C.; MÜHLENBERG, M., 2003: Additions to the flora of the Khentii, Mongolia.
Willdenowia 33: 149–158.DULAMSUREN, C., 2003: Floristische Diversität, Vegetation und Standortbedingungen in der
Gebirgstaiga West-Khentii, Mongolia. PhD thesis Georg-August-Universität, Göttingen.DULAMSUREN, C.; SOLONGO, B; MÜHLENBERG, M., submitted: Comment on the red data book of
endangered plant species of Mongolia. J. Biol. Sci. Mongolia 1.GADOW, K.V.; FÜLDNER, K., 1992: Bestandesbeschreibung in der Forsteinrichtung. Proc. of the
working group Forsteinrichtung. Klieken near Dessau 15.10.92.GADOW, K.V.; HUI, G.Y.; ALBERT, M., 1998: Das Winkelmass – ein Strukturparameter zur Be-
schreibung der Individualverteilung in Waldbeständen. Cent.bl. gesamte Forstwes. 115, 1: 1–9.GARCÍA, O., 1988: Experience with an advanced growth modelling methodology. In: EK, A.R.;
SHIFLEY, S.R.; BURKE, T.E. (eds) Forest growth modelling and prediction. USDA For. Serv.Gen. Tech. Rep. NC-120: 668–675.
GASTON, K.J.; BLACKBURN, T.M., 2000: Pattern and Process in Macroecology. Oxford, BlackwellScience. 376 pp.
Geokriologicheskie usloviya MVR, 1974, Moskau.GLADKOV, N.A.; SELIVONIN, J.A., 1963: Die Ornithogeographischen Unterschiede des Östlichen
und Westlichen Teiles der Taigazone. Proc. XIII Intern. Ornithol. Congr. 1109–1116.GÖTMARK, F.; M. THORELL, 2003: Size of nature reserves: densities of large trees and dead wood
indicate high value of small conservation forests in southern Sweden. Biodiver. Conserv. 12:1271–1285.
GREENWOOD, J.J.D.; BAILLIE, S.R.; CRICK, H.Q.P.; MARCHANT, J.H.; PEACH W.F., 1993:Integrating population monitoring: detecting the effect of diverse changes. In: FURNESS, R.W.;GREENWOOD, J.J.D. (eds) Birds as Monitors of Environmental Changes. London, Chapmanand Hall. 293–315.
HAGEMEIJER, W.J.M.; BLAIR, M.J., 1997: EBCC Atlas of European Breeding Birds. London, T &A. D. Poyser. 903 pp.
HEYWOOD, V.H.H. (ed), 1995: Global biodiversity assessment. Cambridge University Press.1140 pp.
HILBIG, W.; KNAPP, H.D., 1983: Vegetationsmosaik und Florenelemente an der WaldsteppenGrenze im Chentej Gebirge (Mongolei). Flora 174: 1–89.
HUI, G.H.; HU, Y.B., 2001: Measuring species spatial segregation in mixed forest. For. Res. 14, 1:23–27.
HUI, G.Y.U.; GADOW, K.V., 2002: Das Winkelmass – Herleitung des optimalen Standardwinkels.Allg. Forst- Jagdztg. 173: 10.
HUI, G.Y.; ALBERT, M.; GADOW, K.V., 1998: Das Umgebungsmass als Parameter zur Nachbildungvon Bestandsstrukturen. Forstwiss. Cent.bl. 117: 1: 258–266.
IRMLER, U.; HELLER, K.; WARNING, J., 1996: Age and tree species as factors influencing the popu-lation of insects living in dead wood (Coleoptera, Diptera: Sciaridae, Mycetophilidae).Pedobiologia 40: 134–148.

116 Michael Mühlenberg et al.
JANSEN, J.J.; SEVENSTER, J.U.; FABER, P.J., 1996: Opbrengsttabellen voor belangrijke boomsoortenin Nederland. Hinkeloord Report Nr. 17, Landbouwuniversiteit, Wageningen. 202 pp.
JANZEN, D.H.; HALLWACHS, W., 1994: All Taxa Biodiversity Inventory (ATBI) of TerrestrialSystems. A generic protocol for preparing wildland biodiversity for non-damaging use. DraftReport of National Science Foundation Workshop, April 1993, Philadelphia Pa. 16–18.
JEDRZEJEWSKA, B.; OKARMA, H.; JEDRZEJEWSKI, W.; MILKOSKI, L., 1994: Effects of exploitationand protection on forest structure, ungulate density and wolf predation in Bialowieza primevalforest, Poland. J. Appl. Ecol. 31: 664–676.
JONSELL, M.; WESHIN, J.; EHNSTRÖM, B., 1998: Substrate requirements of red-listed saproxylicinvertebrates in Sweden. Biodiv. Cons. 7, 6: 749–764.
JONSSON, B.G.; KRUYS, N. (eds) 2001: Ecology of woody debris in boreal forests. Lund, Sweden,Ecol. Bull. 49: 281 pp.
JONSSON, B.G.; JONSELL, M., 1999: Exploring potential biodiversity indicators in boreal forests.Biodiv. Cons. 8: 1417–1433.
JONSSON, L., 1992: Die Vögel Europas und des Mittelmeerraumes. Stuttgart, Franckh KosmosVerlag. 559 pp.
KAHN, M., 1994: Modellierung der Höhenentwicklung ausgewählter Baumarten in Abhängigkeitvom Standort. Forstliche Forschungsberichte München, Nr. 141: 204 pp.
KARR, J.R.; ROTH, R.R., 1971: Vegetation structure and avian diverstiy in several new worldareas. Am. Nat. 105: 423–435.
KARSHOLT, O.; RAZOWSKI, J., 1996: Lepidoptera of Europe. A distributional checklist. ApolloBooks, Stenstrup, DK. 380 pp.
KERR, J.F.; SUGAR, A.; PACKER, L., 2000: Indicator Taxa, rapid biodiversity assessment and nestedness in an endangered ecosystem. Conserv. Biol. 14, 6: 1726–1734.
KIRBY, K.J.; REID, C.H.; THOMAS, R.C.; GOLDSMITH, F.B., 1998: Preliminary estimates of fallendead wood and standing dead trees in managed and unmanaged forests in Britain. J. Appl.Ecol. 35, 1: 148–155.
KIRCHHOFF, B., 2003: Erfassung und Beschreibung ausgewählter Waldflächen der Nordmongolei.Master thesis, University of Göttingen. 84 pp.
KLAUSNITZER, B., 1999: Wollen wir wirklich Land mit einer reichen Tierwelt, und denken wirdabei auch an die Kleinen, besonders die Insekten? Natur- und Kulturlandschaft 3: 118–131.
KOZLOVA, E.V., 1930: Birds of south-east Transbaikalia, North Mongolia and Central Gobi.Materialy Komisii AN SSSR po issledovaniu Mongolskoi I Tuvinskoi Narodnyh Respublik IBuriat-Mongolskoi ASSR, 12: 1–396.
KRAMER, H.; AKÇA, A., 1995: Leitfaden zur Waldmesslehre. Frankfurt, J. D. Sauerländer´s Verlag.266 pp.
KRAMER, H., 1988: Waldwachstumslehre. Hamburg und Berlin, Verlag Paul Parey.KREBS, C.J.; BOUTIN, S.; BOONSTRA, R. (eds), 2001: Ecosystem Dynamics of the Boreal Forest.
The Kluane Project. Oxford University Press. 511 pp.KUJAWA, K., 1997: Relationships between the structure of mid-field woods and their breeding
bird communities. Acta Ornithol. 32, 2: 175–184.LANDRES, P.B.; VERNER, J.; THOMAS, J.W., 1988: Ecological uses of vertebrate indicator species: a
critique. Conserv. Biol. 2: 316–328LEE, W.K.U.; GADOW, K.V., 1996: Iterative Bestimmung der Konkurrenzbäume in Pinus densi-
flora Beständen. Allg. Forst- Jagdztg. 168, 3–4: 41–45.LINDENMAYER, D.B.; INCOLL, R.D.; CUNNINGHAM, R.B.; DONELLY, C.F., 1999: Attributes of logs
on the floor of Australian Mountain Ash (Eucalyptus regans) forests of different ages. For.Ecol. Manage. 123: 195–203.
LOHR, S.M.; GAUTHREAUX, S.A.; KILGO, J.C., 2002: Importance of Coarse Woody Debris toAvian Communities in Loblolly Pine Forests. Conserv. Biol. 16, 3: 767–777.
MAC NALLY, R.; HORROCKS, G.; PETTIFER, L., 2002: Experimental evidence for potential beneficaleffects of fallen timber in forests. Ecol. Appl. 12, 6: 1588–1594.
MACARTHUR, R.H.; MACARTHUR, J., 1961: On bird species diversity. Ecology 42: 594–598.MACARTHUR, R.H., 1964: Environmental factors affecting bird species diversity. Am. Nat. 98:
387–397.

117For. Snow Landsc. Res. 78, 1/2 (2004)
MIKUSINSKI, G.; GROMADZKI, M.; CHYLARECKI, P., 2001: Woodpeckers as indicators of forestbird diversity. Conserv. Biol. 15, 1: 208–217.
MÖNCHBAYAR, H., 1999: Some results of the species composition and ecology of Lepidopterous(Rhopalocera) of the Bogd Khan Uul. Magisterarbeit, Ulan Bator, Mongolei.
Mongolian Ministry for nature and environment, 1996: United Nations development program,Global environment facility, World wide fund for nature: Mongolias Wild Heritage, Ulaan-baatar.
MÖNKKÖNEN, M., 1994: Diversity pattern in palearctic and nearctic forest bird assemblages. J.Biogeogr. 21: 183–195.
MÖNKKÖNEN, M.; VIRO, P., 1997: Taxonomic diversity of the terrestrial bird and mammal fauna intemperate and boreal biomes of the northern hemisphere. J. Biogeogr. 24: 603–612.
MÜHLENBERG, M., 1980: Kann man mit Hilfe von Vegetationsstrukturmessungen Veränderungenvon Tiergemeinschaften bestimmen? Vaduz, Bericht des Internationalen Symposiums derInternationalen Vereinigung für Vegetationskunde, Rinteln 1979, J. Kramer. 309–327.
MÜHLENBERG, M.; SLOWIK, J.; SAMIYA, R.; DULAMSUREN, C.; GANTIGMAA, C.; WOYCIE-CHOSWKI, M., 2000: The Conservation Value of West-Khentii, North Mongolia: Evaluation ofPlant and Butterfly Communities. Fragm. Flor. Geobot. 45, 1–2: 63–90.
National Atlas of the Mongolian People’s Rebublik, Ulan Bator 1990: Mongol Ulsyn UndesniiAtlas. Edited in Ulan Bator and Moscow, printed in Minsk, cartography (in mongolian).
NIEMELÄ, J., 1997: Invertebrates and Boreal Forest Management. Conserv. Biol. 11, 3: 601–610.NILSSON, C.; GRELSSON, G.; JOHANSSON, M.; SPERENS U., 1988: Can rarity and diversity be
predicted along river banks? Biol. Conserv. 44: 201–212.NILSSON, S.G.; ARUP, U.; BARANOWSKI, R.; EKMAN, S., 1995: Tree dependent lichens and beetles
as indicators in conservation forests. Conserv. Biol. 9, 5: 1208–1215.PEARSON, D.L.; CASSOLA, F., 1992: World wide species richness patterns of Tiger Beetles
(Coleoptera: Cincidelidae): Indicator taxon for biodiversity and conservation studies. Conserv.Biol. 6, 3: 376–391.
PIELOU, E.C., 1977: Mathematical Ecology. New York, John Wiley & Sons. 384 pp.POMMERENING, A., 2002: Approaches to quantifying forest structures. Forestry 75, 3: 305–324.PRETZSCH, H., 2001: Modellierung des Waldwachstums. Berlin, Parey. 341 pp.RAINIO, J.; NIEMELÄ, J., 2003: Ground beetles (Coleoptera: Carabidae) as bioindicators. Biodiv.
Conserv. 12: 487–506.Redkie Zivotnye Mongolii (pozvonocnye), 1996: Moskva, 182 pp.ROJO, A.U.; MONTERO, G., 1996: El Pino Silvestre en la Sierra de Guadarrama. Ministerio de
Agriculture, Madrid, Pesca y Alimentacion. 293 pp.SAVIN, E.N.; MILYITIN, L.I.; KRASNOSCEKOV, Y.N.; KOROTKOV, I.A.; SUNLOV, A.V.; DUGARZZAV,
C.; DASZEVEG, T.S.; COGOO, Z.; DORJSUREN, C.; ZHAM’JANSUREN, S.; GOMBO SUREN, N.,1988: Wald der Mongolei (Lärchenwälder im Ostchentej). Moskva “Nauka” 176.
SCHOBER, R., 1987: Ertragstafeln wichtiger Baumarten. Frankfurt a. M., J.D. Sauerländer´s Verlag.154 pp.
SPELLERBERG, I.F.; SAWYER, W. D., 1999: An introduction to applied biogeography. CambridgeUniversity Press. 243 pp.
STAUPENDAHL, K., 1997: Ein neues Stichprobenverfahren zur Erfassung und Beschreibung vonNaturverjüngung. In: Jahrestagung der Sektion Forstliche Biometrie und Informatik desDeutschen Verbandes Forstlicher Forschungsanstalten in Freiburg i. Br., 24.–26.9. 1997: 32–49.
STORK, N.E.; BOYLE, T.J.B.; DALE, V.; EELEY, H.; FINEGAN, B.; LAWES, M.; MANOKARAN, N.;PRABHU, R.; SOBERON, J., 1997: Criteria and indicators for assessing the sustainability of forestmanagement: Conservation of Biodiversity. CIFOR Working Paper 17:1–29.
STOYAN, D.; STOYAN, H., 1992: Fraktale Formen Punktfelder. Methoden der Geometrie-Statistik.Berlin, Akademie-Verlag. 394 pp.
SULLIVAN, T.P.; SULLIVAN, P.S.; LINDGREN, P.M., 2001: Stand structure and small mammals inyoung lodgepole pine forest: 10-year research after thinning. Ecol. Appl. 11, 4: 1151–1173.
SUTHERLAND, W.J., 1998: The importance of behavioural studies in conservation biology. Anim.Behav. 56: 801–809.

118 Michael Mühlenberg et al.
TAYLOR, R.J.; DORAN, N., 2001: Use of terrestrial invertebrates as indicators of the ecological sustainability of forest management under the Montreal Process. J. Ins. Conserv. 5: 221–231.
TRETER, U., 1997: Gebirgs-Waldsteppe in der Mongolei. Geogr. Rundsch. 5: 655–661.TSEDENDASCH, G., 1995: Khentejn huruuny oj – urgamalschil (Forest Vegetation of the Khentii
Mountains) PhD thesis National University of Mongolia, Ulan Bator (in mongolian).ULZIJCHUTAG, N., 1989: Mongol ornj urgamljn aimgijn tojm, Ulan Bator.VASILCHENKO, A.A., 1987: Birds of Khamar-Daban. Novosibirsk, Nauka Press, Siberian dep.,
103 pp. (in russian).WEAVER, J.C., 1995: Indicator Species and Scale of Observation. Conserv. Biol. 9, 4: 939–942.WENK, G.; ANTANAITIS, V.U.; SMELKO, S., 1990: Waldertragslehre. Berlin, Deutscher Landwirt-
schaftsverlag. 448 pp.WICHMANN, F., 2001: Analyse der Vogelgemeinschaft im Habitatmosaik einer Naturlandschaft
im Norden der Mongolei, Westchentie. Diplomarbeit Univeristät Göttingen.WILLSON, M.F., 1974: Avian Community organization and habitat structure. Ecology 55:
1017–1029.WOYCIECHOWSKI, M.; SLOWIK, J.; MÜHLENBERG, M., 2001: Red listed species beyond the
European border: Maculinea species of Mongolia. Poster at the International Symposium forEuropean Butterflies, ANL Laufen, December 2001.
ZENNER, E.K.; HIBBS, D.E., 2000: A new method for modeling the heterogeneity of forest struc-ture. For. Ecol. Manage 129, 1: 75–87.
Accepted April 9, 2004