larc vs sarc free pmc
TRANSCRIPT
RESEARCH Open Access
Retrospective analysis of the impact ofincreasing access to long acting reversiblecontraceptives in a commercially insuredpopulationAmy Law1, Dominic Pilon2*, Richard Lynen1, François Laliberté2, Laurence Gozalo2, Patrick Lefebvre2
and Mei Sheng Duh3
Abstract
Background: Unintended pregnancies have been shown to be associated with high costs for the healthcaresystem, among other adverse impacts, but could still account for up to 51 % of pregnancies in the US.Improvements in contraception among women are needed. Long acting reversible contraceptives (LARCs),which have proved their safety and efficacy, have been found to significantly decrease the risk of unintendedpregnancy. Yet they are still marginally employed. This study aims at investigating the evolution of LARC useover 15 years and at assessing the impact of the introduction of newer LARCs on LARC use relative to allcontraceptive use.
Methods: This retrospective study identified women with LARC or short acting reversible contraceptive (SARC)claims from a US insurance claims database (01/1999-03/2014). Yearly proportions of LARC users relative to allcontraceptive users were reported. Generalized estimating equation models were used to assess the impact ofuser characteristics, such as age group (15–17, 18–24, 25–34, and 35–44), and of time periods related to theintroduction of new LARCs (01/2001: Mirena, 07/2006: Implanon, 01/2013: Skyla) on LARC use.
Results: A total of 1,040,978 women were selected. LARC use increased yearly from 0.6 % (1999) to 16.6 % (2013)among contraceptive users. Time periods associated with the introduction of a newer LARC were significant predictorsof LARC use; women in 2006-2012 and 2013-2014 were respectively 3.7-fold (95 % CI:3.57–3.74) and 6.6-fold (95 %CI:6.43–6.80) more likely to use LARCs over SARCs relative to women in 2001-2006. The increase in LARC use wasespecially pronounced in young women. Compared to women aged 18–24 in 2001-2006, women aged 18–24 in2006-2012 and 2013-2014 were respectively 6.4-fold (95 % CI:5.91–6.86) and 14.7-fold (95 % CI:13.59–15.89) morelikely to use LARCs over SARCs.
Conclusions: This broadly representative commercial claim-based study showed that the proportion of privatelyinsured women of childbearing age using LARCs increased over time and that the introduction of newer LARCscorresponded with significant increases in overall LARC use. Future research is needed to assess LARC usein uninsured or publicly-insured populations.
Keywords: LARC, SARC, Contraception
* Correspondence: [email protected] d’analyse, Ltée, 1000 De La Gauchetière West, Bureau 1200,Montreal, QC H3B 4W5, CanadaFull list of author information is available at the end of the article
© 2016 The Author(s). Open Access This article is distributed under the terms of the Creative Commons Attribution 4.0International License (http://creativecommons.org/licenses/by/4.0/), which permits unrestricted use, distribution, andreproduction in any medium, provided you give appropriate credit to the original author(s) and the source, provide a link tothe Creative Commons license, and indicate if changes were made. The Creative Commons Public Domain Dedication waiver(http://creativecommons.org/publicdomain/zero/1.0/) applies to the data made available in this article, unless otherwise stated.
Law et al. Reproductive Health (2016) 13:96 DOI 10.1186/s12978-016-0211-3
BackgroundAbout half of the pregnancies in the United States (US)are currently unintended [1, 2]. Unintended pregnancieshave been shown to have adverse social, economic, andhealth outcomes for the mother, and for the child incases where the pregnancy turned into live birth [3].Furthermore, their burden on the healthcare systemcould be as high as $4.5 billion [4]. Decreasing the rateof unintended pregnancies has therefore become a na-tional public health goal [5]. In the US, according to a2009 study, it was estimated that 43 % of unintendedpregnancies were due to inconsistent contraceptive use[6]. Hence long acting reversible contraception (LARC)methods, which solve issues related to adherence andincorrect use, could significantly help in reducing unin-tended pregnancies and their associated burdens [7, 8].Despite the above, LARC methods are still largely
under-utilized among women [9–12]. Notably, in ananalysis of national surveys, Darroch et al. [12] reportedthat the proportion of women using LARC methods in-creased between 2003 and 2012 in developing countries(from 6 to 9 %) but that it remained stable at 4 % inhigher income countries. Furthermore, recent studiesof the US National Survey of Family Growth (NSFG)have reported an increase in the use of LARC amongwomen 15–44 years old from 2002 to the 2011–2013time period [9, 11].The main reasons identified for under-utilization of
LARC methods have been misconceptions about LARC(such as safety concerns and non-eligibility of nulliparouswomen) at the user and provider levels, over-estimation ofthe efficiency of other contraceptive methods and theability of users to optimally use them, and perceivedhigher costs [13]. With regards to higher costs, insur-ance providers play an important role in determiningthe consumer costs attributable to LARC use. It hasbeen demonstrated that women with low out-of-pocketcosts had a higher likelihood of choosing LARC com-pared to women with high out-of-pocket costs [14],and that providing complete insurance for LARC wouldincrease its use [13].Most of these barriers can be addressed through im-
proved education of women and providers on LARCand contraception in general [13]. By raising awareness,providing opportunities to discuss the benefits and suit-ability of LARC methods, and fulfilling women’s unmetcontraceptive needs by broadening the range of devicesand their duration, it can be assumed that the arrivalon the market of new LARC methods could contributeto this effort.The purpose of this study was to describe the evolu-
tion of LARC use over the period 1999–2014 and toassess through the same time period the impact ofintroducing new LARC methods on LARC use relative
to all contraceptive users in a large population of pri-vately insured women using contraceptives.
MethodsData sourceThis analysis was conducted using healthcare commercialclaims from the Optum Health Reporting and Insightsdatabase encompassing the time period between January1999 and March 2014. This database includes administra-tive claims for over 18.5 million privately insured individ-uals (17.1 million under age 65) covered by 84 self-insuredFortune 500 companies with locations in all areas of theUnited States. It contains eligibility information, somedemographic characteristics such as gender, region, andsalary for employees, along with complete medical andpharmaceutical claims for all of the 84 companies’ benefi-ciaries (i.e., employees, spouses, dependents, and retirees)nationwide. The data are de-identified and comply withthe Health Insurance Portability and Accountability Act(HIPAA) of 1996 to preserve patient anonymity andconfidentiality.
Study design and patient selectionA retrospective longitudinal observational study designwas used. Women aged 15 to 44 years old at the time oftheir SARC or LARC claim were selected. The studyperiod spanning from January 1999 through March 2014was broken down into six and 12 month intervals forthe evaluation of the study endpoints. Some of theanalyses conducted required women having at least12 months of continuous health plan eligibility before aLARC or SARC claim. The Statistical Analysis Sectiondescribes the analyses for which this selection criterionwas applied.
Study endpointsThe study endpoints were the use of SARC or LARC ina given semester (semesters are herein defined as half-years, running either from January 1 of a given year upuntil June 30 of the same year, or from July 1 of a yearup until December 31 of the same year) or in a givenyear. Women were classified as SARC users in a semes-ter if they had at least 60 days of supply of SARC in thatsemester, unless they initiated a LARC episode in thesame semester, in which case they were classified asLARC users. LARC episodes were defined as the periodstarting with a claim for a LARC device and endingwith the earliest of a removal, a pregnancy, an abortion,the use of another contraceptive (SARC with more than60 days of supply in the semester or permanentsterilization), up to 5 years (Mirena users), up to 3 years(Implanon/Nexplanon and Skyla users), up to 10 years(ParaGard users), a procedure that led to sterilization(i.e., hysterectomy, oophorectomy, salpingectomy), end
Law et al. Reproductive Health (2016) 13:96 Page 2 of 12
of age eligibility criterion, end of health plan eligibility,or the end of the data. Women were classified as LARCusers in a given semester if that semester overlapped aLARC episode, unless the episode ended with SARCuse, in which case they were classified as SARC users.For the assessment of the evolution of the proportionof LARC users over time, LARC and SARC use wasevaluated yearly using the same definition.A sensitivity analysis was also conducted using a 30 days
of supply threshold to identify SARC users (instead of60 days of supply).
Statistical analysisBaseline characteristicsDescriptive statistics were used to summarize the patientcharacteristics assessed during the baseline periods for thepopulation having at least 12 months of continuous healthplan eligibility before a LARC or SARC claim. Mean,standard deviation, and median were reported for descrip-tive statistics of continuous variables, and absolute andrelative frequency counts were reported for categoricalvariables.
Evolution of the proportion of LARC users over timeThe proportion of women using LARC over womenusing LARC or SARC was reported on a yearly basisduring the period 1999–2013. Proportions of LARC overLARC and SARC use were reported each year by agecategory (i.e., 15–17 years, 18–24 years, 25–34 years,and 35–44 years). Statistical significance between con-secutive years was assessed using a Pearson chi-squaredtest. Of note, this analysis was conducted on a largersample size because it did not require a populationhaving at least 12 months of continuous health planeligibility for the assessment of characteristics prior tothe use of a SARC or LARC.
Predictors of LARC use over timeGeneralized estimating equations (GEE) with logit linkfor binary outcomes and adjusting for repeated meas-urement every semester in patients who had at least12 months of continuous eligibility before a SARC orLARC claim were conducted to obtain odds ratios(ORs) and 95 % confidence intervals (CIs). The GEEapproach was chosen to account for the longitudinaland correlated nature of repeated semi-annual mea-surements, particularly relevant in the case of LARCsthat lasted from 6 semesters for the shortest durationdevices (Implanon, Nexplanon and Skyla) up to 20 forthe longest (ParaGard). Patient characteristics evaluatedduring the previous semester and used as predictors wereage group, region, insurance plan type, medical comorbid-ities, nulliparous status, and gynecologic history. Dichot-omous variables identifying the time periods associated
with the introduction of newer LARC methods (i.e.,1999Q1-2000Q4, 2001Q1-2006Q2, 2006Q3-2012Q4,and 2013Q1-2014Q1) were also used as predictors inorder to identify the impact of the introduction ofnewer LARC methods (i.e., Mirena in 2001, Implanon/Nexplanon in 2006, and Skyla in 2013) on LARC use.Because the information on the type of industry and onwages is only available for the primary plan holders(i.e., employees) in the Optum Health Reporting andInsights database, a sensitivity analysis was also conductedon the subset of women employees to allow for the use ofthe industry of employment and wages to be added ascovariates in the GEE model.Finally, a GEE including interaction terms between age
groups (i.e., 15–17 years, 18–24 years, 25–34 years, and35–44 years) and the time periods related to introduc-tion of new LARCs were conducted to identify theevolution in LARC use after introduction of new LARCmethods among the different age groups.
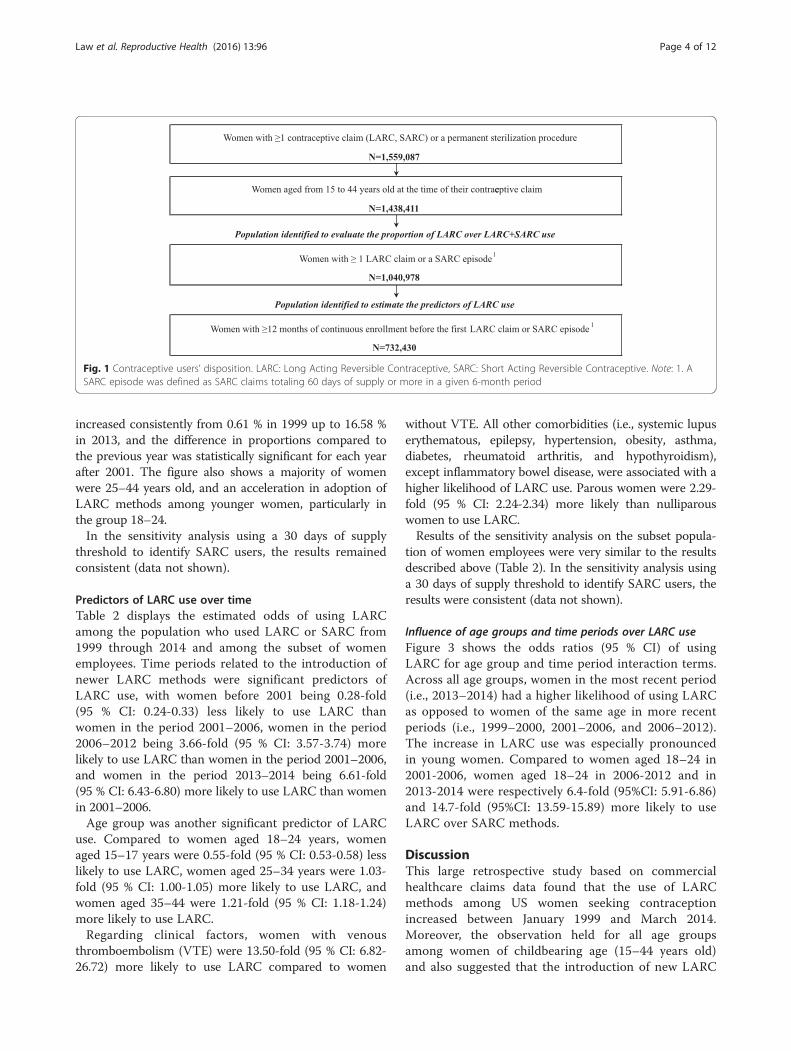
ResultsPopulation baseline characteristicsA total of 1,040,978 women were identified to assess theevolution of proportion of LARC use over time (Fig. 1),while 732,430 women were selected for analyses thatused information collected prior to contraceptive claims(12 months of continuous health plan eligibility before aLARC or SARC claim).Table 1 presents the characteristics of the latter popula-
tion at the time of a first SARC or LARC claim precededwith more than 12 months of continuous eligibility, ineach period corresponding to the introduction of a newerLARC method (i.e., 1999Q1-2000Q4, 2001Q1-2006Q2,2006Q3-2012Q4, and 2013Q1-2014Q1). Across periods,women opting for LARC were on average older by a fewyears than those choosing SARC (32.5 vs 30.0 for womenin 1999–2000, 32.8 vs 28.8 in 2001–2006, 31.4 vs 27.4 in2006–2012, and 30.3 vs 27.2 in 2013–2014). Also, a largemajority of women using LARC already had children(as per the number of dependents identified under thesame insurance plan). However, the proportion of nul-liparous LARC users increased since 2001 (14.2 % in2001–2006, 29.2 % in 2006–2012, and 44.6 % in 2013–2014). Moreover, the plan type increased over time inthe proportion of women covered by a point of service(POS) plan (from ~35 % in 1999–2000 to ~63 % in 2013–2014) and decreased in the proportion of women coveredby a preferred provider organization (PPO) plan (from~34 % in 1999–2000 to ~15 % in 2013–2014).
Evolution of the proportion of LARC users over timeFigure 2 shows the evolution of the proportion of womenusing LARC among women using LARC or SARC overthe time period encompassing 1999–2013. The proportion
Law et al. Reproductive Health (2016) 13:96 Page 3 of 12
increased consistently from 0.61 % in 1999 up to 16.58 %in 2013, and the difference in proportions compared tothe previous year was statistically significant for each yearafter 2001. The figure also shows a majority of womenwere 25–44 years old, and an acceleration in adoption ofLARC methods among younger women, particularly inthe group 18–24.In the sensitivity analysis using a 30 days of supply
threshold to identify SARC users, the results remainedconsistent (data not shown).
Predictors of LARC use over timeTable 2 displays the estimated odds of using LARCamong the population who used LARC or SARC from1999 through 2014 and among the subset of womenemployees. Time periods related to the introduction ofnewer LARC methods were significant predictors ofLARC use, with women before 2001 being 0.28-fold(95 % CI: 0.24-0.33) less likely to use LARC thanwomen in the period 2001–2006, women in the period2006–2012 being 3.66-fold (95 % CI: 3.57-3.74) morelikely to use LARC than women in the period 2001–2006,and women in the period 2013–2014 being 6.61-fold(95 % CI: 6.43-6.80) more likely to use LARC than womenin 2001–2006.Age group was another significant predictor of LARC
use. Compared to women aged 18–24 years, womenaged 15–17 years were 0.55-fold (95 % CI: 0.53-0.58) lesslikely to use LARC, women aged 25–34 years were 1.03-fold (95 % CI: 1.00-1.05) more likely to use LARC, andwomen aged 35–44 were 1.21-fold (95 % CI: 1.18-1.24)more likely to use LARC.Regarding clinical factors, women with venous
thromboembolism (VTE) were 13.50-fold (95 % CI: 6.82-26.72) more likely to use LARC compared to women
without VTE. All other comorbidities (i.e., systemic lupuserythematous, epilepsy, hypertension, obesity, asthma,diabetes, rheumatoid arthritis, and hypothyroidism),except inflammatory bowel disease, were associated with ahigher likelihood of LARC use. Parous women were 2.29-fold (95 % CI: 2.24-2.34) more likely than nulliparouswomen to use LARC.Results of the sensitivity analysis on the subset popula-
tion of women employees were very similar to the resultsdescribed above (Table 2). In the sensitivity analysis usinga 30 days of supply threshold to identify SARC users, theresults were consistent (data not shown).
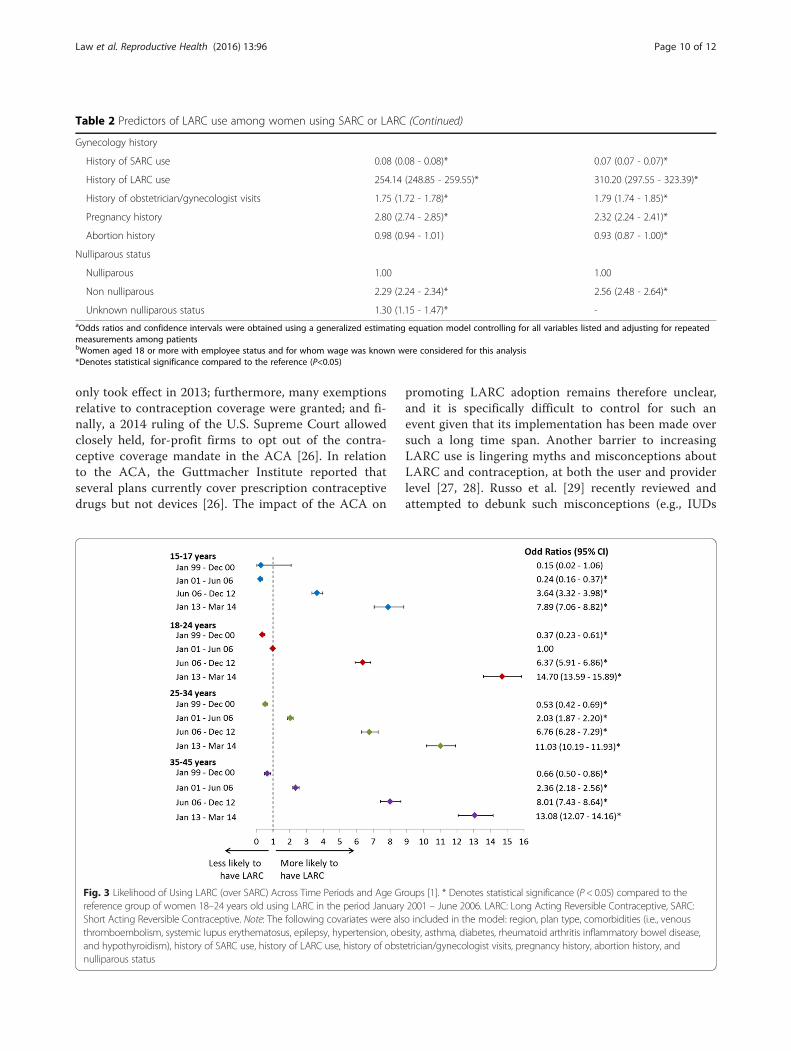
Influence of age groups and time periods over LARC useFigure 3 shows the odds ratios (95 % CI) of usingLARC for age group and time period interaction terms.Across all age groups, women in the most recent period(i.e., 2013–2014) had a higher likelihood of using LARCas opposed to women of the same age in more recentperiods (i.e., 1999–2000, 2001–2006, and 2006–2012).The increase in LARC use was especially pronouncedin young women. Compared to women aged 18–24 in2001-2006, women aged 18–24 in 2006-2012 and in2013-2014 were respectively 6.4-fold (95%CI: 5.91-6.86)and 14.7-fold (95%CI: 13.59-15.89) more likely to useLARC over SARC methods.
DiscussionThis large retrospective study based on commercialhealthcare claims data found that the use of LARCmethods among US women seeking contraceptionincreased between January 1999 and March 2014.Moreover, the observation held for all age groupsamong women of childbearing age (15–44 years old)and also suggested that the introduction of new LARC
Fig. 1 Contraceptive users’ disposition. LARC: Long Acting Reversible Contraceptive, SARC: Short Acting Reversible Contraceptive. Note: 1. ASARC episode was defined as SARC claims totaling 60 days of supply or more in a given 6-month period
Law et al. Reproductive Health (2016) 13:96 Page 4 of 12
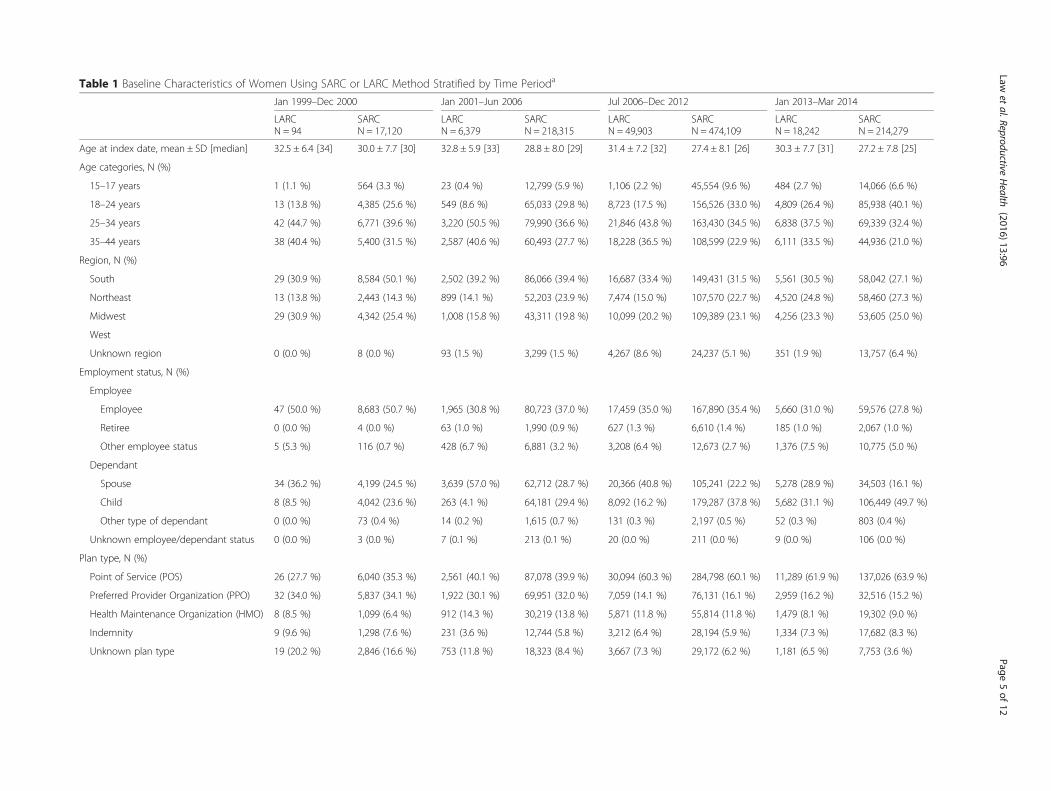
Table 1 Baseline Characteristics of Women Using SARC or LARC Method Stratified by Time Perioda
Jan 1999–Dec 2000 Jan 2001–Jun 2006 Jul 2006–Dec 2012 Jan 2013–Mar 2014
LARCN = 94
SARCN = 17,120
LARCN = 6,379
SARCN = 218,315
LARCN = 49,903
SARCN = 474,109
LARCN = 18,242
SARCN = 214,279
Age at index date, mean ± SD [median] 32.5 ± 6.4 [34] 30.0 ± 7.7 [30] 32.8 ± 5.9 [33] 28.8 ± 8.0 [29] 31.4 ± 7.2 [32] 27.4 ± 8.1 [26] 30.3 ± 7.7 [31] 27.2 ± 7.8 [25]
Age categories, N (%)
15–17 years 1 (1.1 %) 564 (3.3 %) 23 (0.4 %) 12,799 (5.9 %) 1,106 (2.2 %) 45,554 (9.6 %) 484 (2.7 %) 14,066 (6.6 %)
18–24 years 13 (13.8 %) 4,385 (25.6 %) 549 (8.6 %) 65,033 (29.8 %) 8,723 (17.5 %) 156,526 (33.0 %) 4,809 (26.4 %) 85,938 (40.1 %)
25–34 years 42 (44.7 %) 6,771 (39.6 %) 3,220 (50.5 %) 79,990 (36.6 %) 21,846 (43.8 %) 163,430 (34.5 %) 6,838 (37.5 %) 69,339 (32.4 %)
35–44 years 38 (40.4 %) 5,400 (31.5 %) 2,587 (40.6 %) 60,493 (27.7 %) 18,228 (36.5 %) 108,599 (22.9 %) 6,111 (33.5 %) 44,936 (21.0 %)
Region, N (%)
South 29 (30.9 %) 8,584 (50.1 %) 2,502 (39.2 %) 86,066 (39.4 %) 16,687 (33.4 %) 149,431 (31.5 %) 5,561 (30.5 %) 58,042 (27.1 %)
Northeast 13 (13.8 %) 2,443 (14.3 %) 899 (14.1 %) 52,203 (23.9 %) 7,474 (15.0 %) 107,570 (22.7 %) 4,520 (24.8 %) 58,460 (27.3 %)
Midwest 29 (30.9 %) 4,342 (25.4 %) 1,008 (15.8 %) 43,311 (19.8 %) 10,099 (20.2 %) 109,389 (23.1 %) 4,256 (23.3 %) 53,605 (25.0 %)
West
Unknown region 0 (0.0 %) 8 (0.0 %) 93 (1.5 %) 3,299 (1.5 %) 4,267 (8.6 %) 24,237 (5.1 %) 351 (1.9 %) 13,757 (6.4 %)
Employment status, N (%)
Employee
Employee 47 (50.0 %) 8,683 (50.7 %) 1,965 (30.8 %) 80,723 (37.0 %) 17,459 (35.0 %) 167,890 (35.4 %) 5,660 (31.0 %) 59,576 (27.8 %)
Retiree 0 (0.0 %) 4 (0.0 %) 63 (1.0 %) 1,990 (0.9 %) 627 (1.3 %) 6,610 (1.4 %) 185 (1.0 %) 2,067 (1.0 %)
Other employee status 5 (5.3 %) 116 (0.7 %) 428 (6.7 %) 6,881 (3.2 %) 3,208 (6.4 %) 12,673 (2.7 %) 1,376 (7.5 %) 10,775 (5.0 %)
Dependant
Spouse 34 (36.2 %) 4,199 (24.5 %) 3,639 (57.0 %) 62,712 (28.7 %) 20,366 (40.8 %) 105,241 (22.2 %) 5,278 (28.9 %) 34,503 (16.1 %)
Child 8 (8.5 %) 4,042 (23.6 %) 263 (4.1 %) 64,181 (29.4 %) 8,092 (16.2 %) 179,287 (37.8 %) 5,682 (31.1 %) 106,449 (49.7 %)
Other type of dependant 0 (0.0 %) 73 (0.4 %) 14 (0.2 %) 1,615 (0.7 %) 131 (0.3 %) 2,197 (0.5 %) 52 (0.3 %) 803 (0.4 %)
Unknown employee/dependant status 0 (0.0 %) 3 (0.0 %) 7 (0.1 %) 213 (0.1 %) 20 (0.0 %) 211 (0.0 %) 9 (0.0 %) 106 (0.0 %)
Plan type, N (%)
Point of Service (POS) 26 (27.7 %) 6,040 (35.3 %) 2,561 (40.1 %) 87,078 (39.9 %) 30,094 (60.3 %) 284,798 (60.1 %) 11,289 (61.9 %) 137,026 (63.9 %)
Preferred Provider Organization (PPO) 32 (34.0 %) 5,837 (34.1 %) 1,922 (30.1 %) 69,951 (32.0 %) 7,059 (14.1 %) 76,131 (16.1 %) 2,959 (16.2 %) 32,516 (15.2 %)
Health Maintenance Organization (HMO) 8 (8.5 %) 1,099 (6.4 %) 912 (14.3 %) 30,219 (13.8 %) 5,871 (11.8 %) 55,814 (11.8 %) 1,479 (8.1 %) 19,302 (9.0 %)
Indemnity 9 (9.6 %) 1,298 (7.6 %) 231 (3.6 %) 12,744 (5.8 %) 3,212 (6.4 %) 28,194 (5.9 %) 1,334 (7.3 %) 17,682 (8.3 %)
Unknown plan type 19 (20.2 %) 2,846 (16.6 %) 753 (11.8 %) 18,323 (8.4 %) 3,667 (7.3 %) 29,172 (6.2 %) 1,181 (6.5 %) 7,753 (3.6 %)
Lawet
al.ReproductiveHealth
(2016) 13:96 Page
5of
12

Table 1 Baseline Characteristics of Women Using SARC or LARC Method Stratified by Time Perioda (Continued)
Available information on wage and type ofindustry, N (%)
33 (35.1 %) 6,534 (38.2 %) 2,108 (33.0 %) 78,405 (35.9 %) 18,990 (38.1 %) 170,724 (36.0 %) 6,731 (36.9 %) 65,991 (30.8 %)
Wage at index date, 2014 US$, mean ±SD [median]
59,772 ± 22,281[57,801]
64,295 ± 42,416[56,216]
68,794 ± 45,956[55,170]
60,502 ± 35,707[51,780]
51,134 ± 38,273[40,809]
51,730 ± 35,979[42,714]
47,033 ± 36,759[34,083]
48,186 ± 34,453[36,162]
Type of industry, N (%)
Technology 5 (15.2 %) 2,290 (35.0 %) 218 (10.3 %) 25,574 (32.6 %) 2,774 (14.6 %) 27,472 (16.1 %) 612 (9.1 %) 5,872 (8.9 %)
Transportation 3 (9.1 %) 544 (8.3 %) 270 (12.8 %) 7,753 (9.9 %) 2,975 (15.7 %) 16,368 (9.6 %) 812 (12.1 %) 6,161 (9.3 %)
Financial 9 (27.3 %) 1,835 (28.1 %) 188 (8.9 %) 17,789 (22.7 %) 2,009 (10.6 %) 25,725 (15.1 %) 1,558 (23.1 %) 14,605 (22.1 %)
Manufacture 10 (30.3 %) 1,480 (22.7 %) 141 (6.7 %) 6,238 (8.0 %) 1,169 (6.2 %) 10,319 (6.0 %) 389 (5.8 %) 4,179 (6.3 %)
Consumer 6 (18.2 %) 385 (5.9 %) 62 (2.9 %) 6,181 (7.9 %) 2,689 (14.2 %) 28,510 (16.7 %) 572 (8.5 %) 9,661 (14.6 %)
Government 0 (0.0 %) 0 (0.0 %) 193 (9.2 %) 3,216 (4.1 %) 2,941 (15.5 %) 18,085 (10.6 %) 952 (14.1 %) 8,362 (12.7 %)
Healthcare 0 (0.0 %) 0 (0.0 %) 143 (6.8 %) 5,729 (7.3 %) 829 (4.4 %) 9,502 (5.6 %) 253 (3.8 %) 2,315 (3.5 %)
Other 0 (0.0 %) 0 (0.0 %) 893 (42.4 %) 5,925 (7.6 %) 3,604 (19.0 %) 34,743 (20.4 %) 1,583 (23.5 %) 14,836 (22.5 %)
Comorbidities, N (%)
Asthma 1 (1.1 %) 498 (2.9 %) 271 (4.2 %) 7,726 (3.5 %) 2,399 (4.8 %) 20,858 (4.4 %) 924 (5.1 %) 10,684 (5.0 %)
Hypothyroidism 1 (1.1 %) 362 (2.1 %) 339 (5.3 %) 6,491 (3.0 %) 2,633 (5.3 %) 16,640 (3.5 %) 917 (5.0 %) 8,616 (4.0 %)
Hypertension 4 (4.3 %) 309 (1.8 %) 341 (5.3 %) 4,663 (2.1 %) 2,568 (5.1 %) 12,099 (2.6 %) 850 (4.7 %) 5,515 (2.6 %)
Diabetes 3 (3.2 %) 136 (0.8 %) 113 (1.8 %) 2,283 (1.0 %) 936 (1.9 %) 5,775 (1.2 %) 323 (1.8 %) 2,609 (1.2 %)
Obesity 0 (0.0 %) 132 (0.8 %) 120 (1.9 %) 2,511 (1.2 %) 1,899 (3.8 %) 8,900 (1.9 %) 921 (5.0 %) 5,445 (2.5 %)
Inflammatory bowel disease 0 (0.0 %) 59 (0.3 %) 22 (0.3 %) 882 (0.4 %) 257 (0.5 %) 2,129 (0.4 %) 124 (0.7 %) 1,217 (0.6 %)
Epilepsy 1 (1.1 %) 57 (0.3 %) 66 (1.0 %) 857 (0.4 %) 533 (1.1 %) 2,538 (0.5 %) 220 (1.2 %) 1,446 (0.7 %)
Rheumatoid arthritis 0 (0.0 %) 47 (0.3 %) 30 (0.5 %) 659 (0.3 %) 218 (0.4 %) 1,741 (0.4 %) 107 (0.6 %) 954 (0.4 %)
Venous thromboembolism 1 (1.1 %) 20 (0.1 %) 58 (0.9 %) 293 (0.1 %) 411 (0.8 %) 681 (0.1 %) 142 (0.8 %) 300 (0.1 %)
Systemic lupus erythematosus 0 (0.0 %) 19 (0.1 %) 18 (0.3 %) 297 (0.1 %) 174 (0.3 %) 704 (0.1 %) 43 (0.2 %) 326 (0.2 %)
Patients switching contraception methodb,N (%)
3 (3.2 %) 13 (0.1 %) 532 (8.3 %) 2,357 (1.1 %) 5,404 (10.8 %) 17,501 (3.7 %) 1,284 (7.0 %) 3,948 (1.8)
Gynaecology historyc, N (%)
History of SARC use 23 (24.5 %) 11,542 (67.4 %) 2,225 (34.9 %) 138,290 (63.3 %) 15,857 (31.8 %) 309,903 (65.4 %) 5,753 (31.5 %) 172,756 (80.6 %)
History of LARC use 1 (1.1 %) 15 (0.1 %) 187 (2.9 %) 541 (0.2 %) 2,355 (4.7 %) 4,006 (0.8 %) 1,472 (8.1 %) 2,760 (1.3 %)
History of obstetrician/gynaecologistvisits
80 (85.1 %) 9,339 (54.6 %) 5,875 (92.1 %) 138,829 (63.6 %) 44,833 (89.8 %) 303,585 (64.0 %) 15,684 (86.0 %) 140,701 (65.7 %)
Pregnancy history 44 (46.8 %) 1,671 (9.8 %) 3,182 (49.9 %) 25,803 (11.8 %) 21,556 (43.2 %) 49,069 (10.3 %) 5,895 (32.3 %) 16,885 (7.9 %)
Abortion history 6 (6.4 %) 145 (0.8 %) 267 (4.2 %) 2,194 (1.0 %) 1,577 (3.2 %) 4,906 (1.0 %) 505 (2.8 %) 1,587 (0.7 %)
Lawet
al.ReproductiveHealth
(2016) 13:96 Page
6of
12

Table 1 Baseline Characteristics of Women Using SARC or LARC Method Stratified by Time Perioda (Continued)
Nulliparous status, N (%)
Nulliparous 21 (22.3 %) 10,116 (59.1 %) 903 (14.2 %) 131,780 (60.4 %) 14,571 (29.2 %) 319,441 (67.4 %) 8,136 (44.6 %) 158,741 (74.1 %)
Non-nulliparous 73 (77.7 %) 6,928 (40.5 %) 5,455 (85.5 %) 84,707 (38.8 %) 35,181 (70.5 %) 152,260 (32.1 %) 10,045 (55.1 %) 54,629 (25.5 %)
Unknown nulliparous status 0 (0.0 %) 76 (0.4 %) 21 (0.3 %) 1,828 (0.8 %) 151 (0.3 %) 2,408 (0.5 %) 61 (0.3 %) 909 (0.4 %)aBaseline characteristics of patients with either a LARC claim or claims totaling 60 days of supply of SARC. The 12-month period before the first SARC or LARC claims for each patient in each time period was used tocalculate the characteristicsbPatients switching from a SARC to a LARC or from a LARC to a SARC during the time period where the characteristics were evaluatedcEvaluated during the 12-month baseline period
Lawet
al.ReproductiveHealth
(2016) 13:96 Page
7of
12

products and consequently the potential fulfillment ofwomen’s unmet contraceptive needs, could be animportant driver of LARC use. The current study hasthe advantage of relying on a large sample of womeninsured through their employer. These employers, partof the Fortune 500 ranking, are likely to offer advanta-geous health plan coverage and to cover most contra-ceptives including LARCs. This study thus suggeststhat maintaining an open-access to all products andproviding more options within the LARC categorycould enable more women to choose a LARC over aSARC method.The statistically significant increase in LARC use since
2002 reported in this study concurs with the results ofthe recent US National Survey of Family Growth (NSFG)that reported that LARC use among all women 15–44years old had increased from 1.5 % in 2002 to 7.2 % inthe period 2011–2013 [9]. Another analysis of the 2002and 2006–2010 NSFG data previously demonstrated thatthe proportion of LARC users among all contraceptiveusers had grown from 2.4 % in 2002 up to 8.5 % in 2009[11]. One of the reasons for this evolution may be a shiftin reproductive health expert opinions and recommen-dations regarding LARCs. IUDs in particular were trad-itionally seen as appropriate for parous women only, inpart owing to label recommendations to that effectwhich were initially present for ParaGard and Mirena,the only two IUDs on the market in the US for quitesome time following the Dalkon shield debacle. Therecommendation remains for Mirena but was removedfrom ParaGard labeling in 2005 [15]. Skyla and Liletta,approved by the US food and drug administration (FDA)
in 2013 and 2015, respectively, included nulliparous sub-jects in the registration clinical trials and consequentlydo not contain such a recommendation; rather, the la-beling specifies that they are indicated for prevention ofpregnancy without reference to any particular popula-tion [16, 17]. The former is included in the time frameof this study while the latter is not due to its very re-cent approval.Contrary to the past perceptions and opinions, LARC
methods are safe for nulliparous young women, do notcause tubal infertility, and studies report a rapid returnto fertility after removal [18–20]. Consequently, expertshave been increasingly advocating for use of LARCmethods prior to childbearing [21–23]. Hence the Ameri-can Congress of Obstetricians and Gynecologists recom-mended IUDs as first-line contraception as early as 2005,for users including teenagers and younger women, andthe American Academy of Pediatrics has recently promul-gated the same recommendation [21, 22]. More recently,the Centers for Disease Control and prevention reportedthat IUDs were safe and effective in nulliparous women[23].However, there are still several obstacles hindering
LARC use. One of them is perceived high costs [13, 14],although it has been proven that LARC methods arehighly cost-effective when used for as little as theshortest available duration of three years [24, 25]. TheAffordable Care Act (ACA) of 2010 that imposes onmost healthcare plans to cover the full range of contra-ceptive methods as of August 2012, including LARC,with no patient cost-sharing, could weaken this barrier[11]. Unfortunately, for many plans, the requirement
Fig. 2 Progression of LARC use over time among LARC and SARC users. * Denotes statistical significance (P < 0.05) compared to the previous yearusing a Pearson chi-squared test. LARC: Long Acting Reversible Contraceptive, SARC: Short Acting Reversible Contraceptive
Law et al. Reproductive Health (2016) 13:96 Page 8 of 12

Table 2 Predictors of LARC use among women using SARC or LARC
Odds Ratioa (95 % CI)
All Women (N = 732,430) All Employeesb (N = 249,021)
Time Period
Jan 1999–Dec 2000 0.28 (0.24 - 0.33)* 0.24 (0.18 - 0.33)*
Jan 2001–Jun 2006 1.00 1.00
Jul 2006–Dec 2012 3.66 (3.57 - 3.74)* 3.63 (3.47 - 3.80)*
Jan 2013–Mar 2014 6.61 (6.43 - 6.80)* 6.73 (6.37 - 7.10)*
Age group
15–17 year old 0.55 (0.53 - 0.58)* -
18–24 year old 1.00 1.00
25–34 year old 1.03 (1.00 - 1.05)* 1.29 (1.22 - 1.37)*
35–44 year old 1.21 (1.18 - 1.24)* 1.63 (1.54 - 1.73)*
Region
South 1.00 1.00
Northeast 0.80 (0.79 - 0.82)* 0.88 (0.84 - 0.92)*
Midwest 0.90 (0.88 - 0.92)* 0.97 (0.93 - 1.00)
West 1.27 (1.24 - 1.30)* 1.29 (1.24 - 1.34)*
Unknown region 1.39 (1.35 - 1.44)* 1.20 (1.12 - 1.29)*
Plan type
Point of Service (POS) 1.00 1.00
Preferred Provider Organization (PPO) 0.98 (0.95 - 1.01) 0.89 (0.85 - 0.94)*
Health Maintenance Organization (HMO) 1.05 (1.03 - 1.08)* 0.93 (0.90 - 0.97)*
Indemnity 1.14 (1.10 - 1.18)* 1.04 (0.98 - 1.12)
Unknown plan type 1.21 (1.17 - 1.25)* 1.31 (1.23 - 1.38)*
Type of industry
Technology - 1.00
Transportation - 1.44 (1.36 - 1.52)*
Financial - 0.93 (0.88 - 0.98)*
Manufacture - 1.07 (1.00 - 1.14)*
Consumer - 1.07 (1.01 - 1.13)*
Government - 1.57 (1.47 - 1.67)*
Healthcare - 0.81 (0.75 - 0.87)*
Other - 1.07 (1.02 - 1.12)*
Wage (per 100,000 2014 US$) - 0.94 (0.90 - 0.98)*
Comorbidities
Venous thromboembolism 13.50 (6.82 - 26.72)* 22.12 (7.77 - 62.93)*
Systemic lupus erythematosus 1.90 (1.58 - 2.28)* 1.92 (1.42 - 2.59)*
Epilepsy 1.92 (1.02 - 3.60)* 1.39 (0.45 - 4.31)
Hypertension 1.55 (1.48 - 1.63)* 1.63 (1.51 - 1.75)*
Obesity 1.54 (1.46 - 1.64)* 1.64 (1.50 - 1.79)*
Asthma 1.25 (1.19 - 1.31)* 1.30 (1.19 - 1.41)*
Diabetes 1.17 (1.09 - 1.26)* 1.21 (1.08 - 1.36)*
Rheumatoid arthritis 1.19 (1.04 - 1.35)* 1.22 (0.97 - 1.54)
Inflammatory bowel disease 1.09 (0.95 - 1.24) 1.17 (0.94 - 1.45)
Hypothyroidism 1.05 (1.00 - 1.10)* 1.12 (1.04 - 1.21)*
Law et al. Reproductive Health (2016) 13:96 Page 9 of 12
only took effect in 2013; furthermore, many exemptionsrelative to contraception coverage were granted; and fi-nally, a 2014 ruling of the U.S. Supreme Court allowedclosely held, for-profit firms to opt out of the contra-ceptive coverage mandate in the ACA [26]. In relationto the ACA, the Guttmacher Institute reported thatseveral plans currently cover prescription contraceptivedrugs but not devices [26]. The impact of the ACA on
promoting LARC adoption remains therefore unclear,and it is specifically difficult to control for such anevent given that its implementation has been made oversuch a long time span. Another barrier to increasingLARC use is lingering myths and misconceptions aboutLARC and contraception, at both the user and providerlevel [27, 28]. Russo et al. [29] recently reviewed andattempted to debunk such misconceptions (e.g., IUDs
Table 2 Predictors of LARC use among women using SARC or LARC (Continued)
Gynecology history
History of SARC use 0.08 (0.08 - 0.08)* 0.07 (0.07 - 0.07)*
History of LARC use 254.14 (248.85 - 259.55)* 310.20 (297.55 - 323.39)*
History of obstetrician/gynecologist visits 1.75 (1.72 - 1.78)* 1.79 (1.74 - 1.85)*
Pregnancy history 2.80 (2.74 - 2.85)* 2.32 (2.24 - 2.41)*
Abortion history 0.98 (0.94 - 1.01) 0.93 (0.87 - 1.00)*
Nulliparous status
Nulliparous 1.00 1.00
Non nulliparous 2.29 (2.24 - 2.34)* 2.56 (2.48 - 2.64)*
Unknown nulliparous status 1.30 (1.15 - 1.47)* -aOdds ratios and confidence intervals were obtained using a generalized estimating equation model controlling for all variables listed and adjusting for repeatedmeasurements among patientsbWomen aged 18 or more with employee status and for whom wage was known were considered for this analysis*Denotes statistical significance compared to the reference (P<0.05)
Fig. 3 Likelihood of Using LARC (over SARC) Across Time Periods and Age Groups [1]. * Denotes statistical significance (P < 0.05) compared to thereference group of women 18–24 years old using LARC in the period January 2001 – June 2006. LARC: Long Acting Reversible Contraceptive, SARC:Short Acting Reversible Contraceptive. Note: The following covariates were also included in the model: region, plan type, comorbidities (i.e., venousthromboembolism, systemic lupus erythematosus, epilepsy, hypertension, obesity, asthma, diabetes, rheumatoid arthritis inflammatory bowel disease,and hypothyroidism), history of SARC use, history of LARC use, history of obstetrician/gynecologist visits, pregnancy history, abortion history, andnulliparous status
Law et al. Reproductive Health (2016) 13:96 Page 10 of 12

cause pelvic inflammatory disease) in their 2013 stud.Meanwhile, it was also found in a 2012 study that patientsoverestimated SARC method efficacy [30]. Therefore,there is still a need to better educate women and providerson contraception methods and LARC in particular.Broadening the choice of LARC methods could also
help increase LARC use, and potentially contribute tochanging the perceptions of women and healthcareproviders about them. Indeed, bringing to market newdevices could help increase the visibility of LARCmethods by generating promotional activity from themanufacturer which in turn can raise awarenessamong both consumers and providers, and by increasingthe research interest for LARC, further contributing to anincreased knowledge around that class of contraceptives.Diversifying LARC options could also help address thevariety of needs of women seeking mid-to-long termreversible contraception [31]. This is supported by theresults of the present study, which showed that periodsfollowing introduction of newer LARC methods were oneof the main drivers of LARC use.The present study also showed an acceleration of
LARC adoption among younger women since availabilityof Skyla in 2013. Notably, women from the 18–24 agegroup were 14.7-fold more likely to use a LARC methodcompared to women of the same age group in 2001-2006. In addtition, that likelihood was also higher thanthat of women from the 25–34 and 35–44 age groupscompared to the same 18–24 age group in 2001–2006(respectively 11.03 and 13.08). This could be related tothe change in reproductive health specialists’ opinionsand recommendations regarding the suitability ofLARCs for younger women already discussed previously[22, 32, 33], but also, as pointed above, to the availabilityof new LARC products that better address the needs ofyounger and nulliparous women.Results of the present study also showed that among
common comorbidities associated with childbearingage, VTE history was a strong predictor of LARC use(estimated likelihood of LARC use after a VTE episodewas 13.5). As oral contraceptives, are associated withan increased risk of VTE [34], and as some LARCmethods, such as Mirena, decrease or can stop men-strual bleeding, they can be a safer option for VTE pa-tients who have to be treated with blood thinningmedication, and for whom pregnancy is a risk factor forVTE (VTE being the leading cause of maternal death inthe US) [35]. More generally, LARC methods increase andenhance the spectrum of contraceptive options in womenwith medical conditions (e.g., systemic lupus erythemato-sus), either to more efficiently prevent pregnancy or be-cause the condition treatment would interfere withtraditional contraception (e.g., epileptic treatment interfer-ing with hormonal pills) [36].
LimitationsThis study is subject to certain limitations. First, eventhough an algorithm was developed to capture the endof a LARC episode, all removal of LARC methods maynot have been captured. Second, claims databases maycontain inaccuracies or omissions in procedures, diag-noses, or costs, and no information was provided as towhether or not medication was taken as prescribed.Third, contraceptives purchased over-the-counter werenot available in the database, which may have resultedin an underestimation of SARC use. Fourth, eventhough the Optum Health Reporting and Insights data-base can be generalized to the large subgroup of theemployed US population, our study population con-sisted of privately-insured individuals, and, therefore,our results might not be generalizable to the entirepopulation of contraceptive users of which an import-ant proportion is uninsured or publicly-insured. Fifth, itis difficult to ignore the influence of the growing famil-iarity of the public with LARC on LARC adoption, orassess whether this growth would have happened at allwithout the introduction of new LARC methods thatfulfills women’s unmet contraceptive needs. Nonethe-less, we think both factors played an important role inthe increasing popularity of the use of LARC. Finally,public discussions of benefits and risks of the differentcontraceptives (or other events such as changes inhealth insurance coverage and re-imbursement rules orin perception of the suitability of IUDs for nulliparousor younger women) may influence the prescription ofLARC and SARC methods; however, time periods asso-ciated with these discussions and events were not con-sidered as specific covariates in the statistical modelsused in this study. These factors may have been cap-tured nonetheless in the time trend that was includedas a covariate in the study.
ConclusionsThis study found that privately insured women of child-bearing age seeking contraception increasingly turned to-wards LARC methods over SARC methods from 1999 to2014. It also found that one of the main associations ofthis trend was the availability of newer, more diversified,LARC methods, and that the rising trend in LARC usewas particularly pronounced among younger women.With the still preoccupyingly high rate of unintendedpregnancies in the US, the high costs associated withunintended pregnancies, and the difficulties often faced bywomen seeking abortion, this study supports the possibil-ity that a sustained effort in broadening the range of avail-able LARC methods may facilitate their adoption. Futureresearch is needed to assess LARC use in uninsured orpublicly-insured populations.
Law et al. Reproductive Health (2016) 13:96 Page 11 of 12

AbbreviationsACA, affordable care act; CI, confidence interval; FDAl, US Food and DrugAdministration; GEE, generalized estimating equation; IUD, intrauterinedevice; LARC, long acting reversible contraceptive; NSFG, national survey offamily growth; OR, odds ratio; SARC, short acting reversible contraceptive;US, United States; VTE, venous thromboembolism
AcknowledgementsThere is no acknowledgment.
Authors’ contributionsAll authors participated to the study concept and design and datainterpretation. Pilon D and Gozalo L performed the data collection andstatistical analyses. Writing of the manuscript was shared by Duh MS,Lefebvre P, Laliberté F, Pilon D, and Gozalo L. Revision of the manuscriptwas shared by Law A and Lynen R. All authors read and approved thefinal manuscript.
Competing interestsThis research was funded by Bayer Healthcare Pharmaceuticals Inc., Whippany,NJ, USA.Laliberté F, Pilon D, Gozalo L, Lefebvre P, and Duh MS are employees ofAnalysis Group, Inc. Analysis Group, Inc. has provided paid consulting servicesto Bayer HealthCare Pharmaceuticals Inc. that funded the development andconduct of this study and manuscript as stated above. Law A and Lynen R areemployees of Bayer HealthCare Pharmaceuticals.Parts of this manuscript were accepted for a poster presentation at the NorthAmerican Forum on Family Planning 2015: Chicago, IL, November 14–16, 2015.
Author details1Bayer HealthCare Pharmaceuticals Inc, 100 Bayer Blvd, Whippany, NJ 07981,USA. 2Groupe d’analyse, Ltée, 1000 De La Gauchetière West, Bureau 1200,Montreal, QC H3B 4W5, Canada. 3Analysis Group, Inc., 10th Floor, 111Huntington Ave, Boston, MA 02199, USA.
Received: 6 November 2015 Accepted: 10 August 2016
References1. Guttmacher Institute. Unintended Pregnancy in the United States.
http://www.guttmacher.org/pubs/FB-Unintended-Pregnancy-US.html.Accessed 15 Apr 2015.
2. Finer LB, Zolna MR. Shifts in intended and unintended pregnancies in theUnited States, 2001–2008. Am J Public Health. 2014;104 Suppl 1:S43–8.
3. Mosher WD, Jones J, Abma JC. Intended and unintended births in theUnited States: 1982–2010. Natl Health Stat Rep. 2012;55:1–28.
4. Trussell J, Henry N, Hassan F, Prezioso A, et al. Burden of unintendedpregnancy in the United States: potential savings with increased use oflong-acting reversible contraception. Contraception. 2013;87(2):154–61.
5. Office of Disease Prevention and Health Promotion. Family Planning |Healthy People 2020. http://www.healthypeople.gov/2020/topics-objectives/topic/family-planning. Accessed 16 Apr 2016.
6. Gold R, Sonfield A, Richards C, Frost J. Next Steps for America’s Family PlanningProgram, Leveraging the Potential of Medicaid and Title X in an EvolvingHealth Care System. 2009.
7. American College of Obstetricians and Gynecologists Committee onGynecologic Practice; Long-Acting Reversible Contraception WorkingGroup. ACOG committee opinion no. 450: increasing use of contraceptiveimplants and intrauterine devices to reduce unintend. Obstet Gynecol.2009;114(6):1434–8.
8. Secura G. Long-acting reversible contraception: a practical solution toreduce unintended pregnancy. Minerva Ginecol. 2013;65(3):271–7.
9. Branum A, Jones J. Trends in Long-acting Reversible Contraception UseAmong U.S. Women Aged 15–44. NCHS data brief. 2015;(188):1–8.
10. Finer LB, Zolna MR. Unintended pregnancy in the United States: incidenceand disparities, 2006. Contraception. 2011;84(5):478–85.
11. Finer LB, Jerman J, Kavanaugh ML. Changes in use of long-actingcontraceptive methods in the United States, 2007–2009. Fertil Steril.2012;98(4):893–7.
12. Darroch JE, Singh S. Trends in contraceptive need and use in developingcountries in 2003, 2008, and 2012: an analysis of national surveys. Lancet.2013;381(9879):1756–62.
13. Secura GM, Allsworth JE, Madden T, Mullersman JL, et al. The ContraceptiveCHOICE Project: reducing barriers to long-acting reversible contraception.Am J Obstet Gynecol. 2010;203(2):115. e1–7.
14. Eisenberg D, McNicholas C, Peipert JF. Cost as a barrier to long-actingreversible contraceptive (LARC) use in adolescents. J Adolesc Health.2013;52(4 Suppl):S59–63.
15. Anon. PROPOSED PRESCRIBING INFORMATION - ParaGard® T 380AIntrauterine Copper Contraceptive. http://www.accessdata.fda.gov/drugsatfda_docs/label/2005/018680s060lbl.pdf. Accessed 28 Oct 2015.
16. Bayer HealthCare Pharmaceuticals Inc. Skyla (levonorgestrel-releasingintrauterine system) [Prescribing Information]. 2013.
17. Actavis Pharma Inc. Liletta (levonorgestrel-releasing intrauterine system)[Prescribing Information]. 2015.
18. Hubacher D, Lara-Ricalde R, Taylor DJ, Guerra-Infante F, et al. Use of copperintrauterine devices and the risk of tubal infertility among nulligravidwomen. N Engl J Med. 2001;345(8):561–7.
19. Hov GG, Skjeldestad FE, Hilstad T. Use of IUD and subsequentfertility—follow-up after participation in a randomized clinical trial.Contraception. 2007;75(2):88–92.
20. Penney G, Brechin S, De Souza A, Bankowska U, et al. FFPRHC Guidance(January 2004). The copper intrauterine device as long-term contraception. JFam Plann Reprod Health Care. 2004;30(1):29–41.
21. Committee ACOG. on Practice Bulletins-Gynecology. ACOG practice bulletin.Clinical management guidelines for obstetrician-gynecologists. Number 59,January 2005. Intrauterine device. Obstet Gynecol. 2005;105(1):223–32.
22. Committee on Adolescence. Contraception for adolescents. Pediatrics.2014;134(4):e1244–56.
23. Blackwell DL, Lucas JW, Clarke TC. Summary health statistics for U.S. adults:national health interview survey, 2012. Data from the National HealthSurvey. Vital Health stat. 2014;10(260):1–161.
24. Trussell J, Hassan F, Henry N, Pocoski J, et al. Cost-effectiveness analysis oflevonorgestrel-releasing intrauterine system (LNG-IUS) 13.5 mg incontraception. Contraception. 2014;89(5):451–9.
25. Trussell J, Hassan F, Lowin J, Law A, et al. Achieving cost-neutrality with long-acting reversible contraceptive methods. Contraception. 2015;91(1):49–56.
26. Guttmacher Institute. Insurance Coverage of Contraceptives.; 2015.27. Kavanaugh ML, Frohwirth L, Jerman J, Popkin R, et al. Long-acting reversible
contraception for adolescents and young adults: patient and providerperspectives. J Pediatr Adolesc Gynecol. 2013;26(2):86–95.
28. Prescott GM, Matthews CM. Long-acting reversible contraception: a reviewin special populations. Pharmacotherapy. 2014;34(1):46–59.
29. Russo JA, Miller E, Gold MA. Myths and misconceptions about long-actingreversible contraception (LARC). J Adolesc Health. 2013;52(4 Suppl):S14–21.
30. Eisenberg DL, Secura GM, Madden TE, Allsworth JE, et al. Knowledge ofcontraceptive effectiveness. Am J Obstet Gynecol. 2012;206(6):479. e1–9.
31. Aiken ARA, Trussell J. Recent advances in contraception. F1000prime Rep.2014;6:113.
32. ACOG. ACOG practice bulletin. Clinical management guidelines forobstetrician-gynecologists. Number 59, January 2005. Intrauterine device.Obstet Gynecol. 2005;105(1):223–32.
33. Blackwell D, Lucas J, Clarke T. Summary Health Statistics for US Adults:National Health Interview Survey 2012.; 2014.
34. De Bastos M, Stegeman BH, Rosendaal FR, Van Hylckama VA, et al.Combined oral contraceptives: venous thrombosis. Cochrane DatabaseSyst Rev. 2014;3:CD010813.
35. Dresang LT, Fontaine P, Leeman L, King VJ. Venous thromboembolismduring pregnancy. Am Fam Physician. 2008;77(12):1709–16.
36. Bonnema RA, McNamara MC, Spencer AL. Contraception choices in womenwith underlying medical conditions. Am Fam Physician. 2010;82(6):621–8.
Law et al. Reproductive Health (2016) 13:96 Page 12 of 12