language version prevails. - técnicas reunidas · 2011-12-02 · consolidated balance sheet ......
TRANSCRIPT


2
Free translation of the consolidated annual accounts originally issued in Spanish and prepared in accordance with International Reporting Standards as adopted by the European Union. In the event of a discrepancy, the Spanish language version prevails. Contents of the Consolidated Annual Accounts of Técnicas Reunidas, S.A. and subsidiaries Note
Letter from the Chairman Auditor’s Report Consolidated balance sheet Consolidated income statement Consolidated statement of changes in equity Consolidated cash flow statement Notes to the consolidated annual accounts
1 General information 2 Summary of the main accounting policies
2.1. Basis of presentation 2.2. Consolidation principles 2.3. Segment reporting 2.4. Foreign currency transactions 2.5. Property, plant and equipment 2.6. Intangible assets 2.7. Impairment of non-financial assets 2.8. Financial assets 2.9. Inventories 2.10. Trade receivables 2.11. Cash and cash equivalents 2.12. Share capital 2.13. Government grants 2.14. Suppliers 2.15. Borrowings 2.16. Deferred taxes 2.17. Employee benefits 2.18. Provisions 2.19. Revenue recognition 2.20. Derivative financial instruments and hedge transactions 2.21. Fair value 2.22. Leases 2.23. Dividend payment 2.24. Environment
3 Financial risk management 3.1. Financial risk factors
4 Accounting estimates and judgements 5 Segment reporting 6 Property, plant and equipment 7 Goodwill and other intangible assets 8 Investments in associates 9 Available-for-sale financial assets
10 Derivative financial instruments 11 Trade and other receivables 12 Inventories 13 Receivables and other assets 14 Financial assets at fair value through profit or loss 15 Cash and cash equivalents 16 Share capital 17 Other reserves 18 Cumulative translation difference

3
19 Retained earnings and minority interests 20 Trade and other payables 21 Borrowings 22 Employee benefits 23 Provisions for liabilities and charges 24 Ordinary revenues 25 Other operating expenses and revenues 26 Employee benefit expenses 27 Operating leases 28 Financial results 29 Income tax 30 Earnings per share 31 Dividends per share 32 Contingencies and guarantees furnished 33 Commitments 34 Related-party transactions 35 Joint ventures 36 Temporary joint ventures (UTEs) 37 Environment 38 Events after the balance sheet date 39 Other information
Exhibit I Exhibit II Exhibit III Exhibit IV

4
Financial year 2007 was an important and successful year for Técnicas Reunidas Group, both qualitatively and quantitatively, as far as profits and new contracts were concerned, with growth for the Group that reflects how it has taken advantage of the opportunities available in the sector. TR competed successfully with the leading international contractors on large, complex projects, positioning itself among the European leaders in the sector. TR reported net profits of €108 million, a 51% increase over 2006. Ordinary income rose by 62%, exceeding €2,000 million, and the capacity to generate net cash of €422 million. This significant growth was possible by expanding the customer base as a result of the intensified sales efforts by the Group last year which enabled it to gain five new clients and to get a foothold in new markets. Only 18.1% of the incomes came from Spain. Organic growth is one of our priority objectives because it allows us to demonstrate that TR is capable of growing its business and credibility by taking advantage of current investment and demand cycles. TR was awarded a number of important contracts in 2007, including three large refining projects, two petrochemical projects, one regassification project and four combine cycle projects. Consequently, the figures in all business areas demonstrate the consolidation and diversification of the Group's activities in all business areas, placing it in a good position to continue growing in the years to come. In 2007, TR proceeded with the transformation needed to make the company a sector leader in the future with the necessary resources. The Group's staff grew to 4,412 employees, more than 80% of whom are technical personnel. Since the year 2004, TR has experienced strong personnel growth which has enabled it to efficiently manage the expansion of its portfolio. In addition, TR has a network of satellite offices in other countries which means that it can assign the appropriate resources to the projects in the geographical areas of each office. Also, the Group’s relations with other engineering companies have been reinforced for subcontracting purposes to give the organisation greater flexibility. The end of the year marked a year and a half since the TR’s stock began trading on the stock exchange, during which time its stock appreciated by 157%. Along with the positive results achieved, this has translated into a considerable increase in value for shareholders, with the profit per share increasing 47% to €1.87/share. The evolution of TR’s different lines of business was as follows: Oil and Gas In 2007, TR consolidated its position in the sector, winning contract awards for highly complex projects with high economic values. TR continued to compete successfully for the same projects as the larger multinational contractors, improving its credentials and recognition world-wide. TR benefitted from the investment needs existing in the sector due to the shortage of production capacity brought about by a considerable increase in demand and from the strategic decisions of the largest producing companies to invest in the gas and oil value chain. Global oil consumption has increased significantly in recent years and will continue to do so beyond 2008, creating favourable market conditions for international contractors like TR. More specifically, it is estimated that over the next 25 years €5,114 million will be invested in oil, a figure that was revised upward by 27% in the last year. It is expected that some €4,147 million will be invested in gas over the next 25 years (source: IEA World Energy Outlook 2007). In addition, more stringent environmental regulations will require changes to the quality of refinery products. Therefore, there will be a need for refineries to adapt their existing plants or to build new ones that meet these requirements. In 2007, the company intensified its presence in areas with high strategic value and a promising outlook, such as the Gulf, Spain and Europe, and with clients that will generate future business incorporating high potential and guaranteeing the profitable and sustained growth of the company. TR has reinforced its position in the Gulf with two new strategic clients, SABIC and ADNOC, and is opening new doors in the European markets with new references in countries, as was the case with Russia, and types of products that will generate important synergies for the business. Sales in this area rose by 78% to €1,647 million and represented 82% of total sales.

5
Refining and Petrochemicals
- In the first quarter TR was chosen by Saudi Kayan Petrochemical Company to build a phenol plant at the Jubail petrochemical complex in Saudi Arabia. Kayan is a subsidiary of SABIC, the largest public company in the Middle East in terms of stock market capitalisation and one of the world's largest petrochemical producers. The plant includes units for the production of 290,000 t/y of cumene, 220,000 t/y of phenol, 240,000 t/y of bisphenol-A and 71,000 t/y of acetone. - In April 2007, Abu Dhabi Polymers Company Limited, BOROUGE, a joint venture between Abu Dhabi National Oil Company (ADNOC) and Borealis, awarded TR a contract to provide the auxiliary systems and interconnections for the enlargement of its petrochemical complex in Ruwais, Abu Dhabi, in the United Arab Emirates. ADNOC is one of the largest oil companies in the world with a daily output of two million barrels. The enlargement of this complex will triple the annual production capacity of polyolefins, bringing it to two million tonnes. - In the month of August, the company was chosen by GALP to enlarge its refinery in Sines, Portugal. Galp Energía is the leading oil company in Portugal and Sines is the country's largest refinery. The project includes a hydrocraker and new hydrogen, LPG and acid water units along with extensive modifications to the crude, vacuum and visbreaker units, FCC, sulphur recovery, auxiliary services and offsites. These changes will substantially increase the conversion and efficiency rates, making this one of the largest and most highly advanced petrochemical complexes in Europe. - In the fourth quarter of the year Oil Company Alliance (OC Alliance) awarded TR a contract to build a new “hydrocraking” complex at the Khabarovsk refinery in the Russian Federation. OC Alliance is a vertically integrated oil company (hydrocarbon production, refining and distribution) and one of the leading producers of oil products in the Russian market. The addition of this complex will increase the refinery's total production capacity from 3.2 to 3.5 million tonnes per year and increase the annual production capacity of low sulphur content diesel and kerosene by 1.6 million tonnes. The project includes engineering and the supply and construction of all processing units: hydrocracking, hydrotreatment, hydrogen, amine regeneration, acid water, sulphur recovery as well as auxiliary systems.
The Group continued to make progress during the year on the projects awarded previously, including: The Dung Quat refinery in Vietnam for Petrovietnam, the coking unit for ENAP in Chile and the refinery units for PEMEX in Minatitlán (Mexico). In addition, the company continued to work on the enlargement and remodelling of the Tüpras refineries in Kirikkale and Izmit (Turkey) and the cumene unit for CEPSA in Huelva, which is in the final stages and is slated for delivery in 2008. The company also completed its work on the feed for the Guanxi refinery in China for Petrochina, successfully meeting all execution objectives and deadlines. Natural Gas and Upstream In 2007, the company was very successful in this line of business. In the third quarter, TR signed a contract to build a Liquid Natural Gas regassification terminal in the city of Mejillones in northern Chile with GNL Mejillones, a joint venture composed of SUEZ and CODELCO. This contract is a continuation of the one signed by the parties last February which covered the development of the plant engineering (FEED), the purchase of the main equipment and the investment estimate. The initial agreement was converted into a “turnkey” project that included the engineering, equipment and material supplies and the construction of a regassification plant with a capacity of 235,000 Nm3/hour. This project will benefit from the strategic agreement signed in 2006 with Kawasaki Heavy Industries to complement TR’s technology in the development of LNG regassification terminals. The plant will supply natural gas for the generation of electricity used primarily for mining processes. Codelco is the world's largest copper producer. Also in 2007, TR continued to work on the contracts awarded previously, such as the projects of the Kuwait Oil Company GC-28 and Telemetry in Kuwait, the gas treatment contracts for Saudi Aramco in Saudi Arabia, in Ju’aymah and Hawiyah, the RKF compression project for the Cepsa and Sonatrach consortium in Algeria and the TFT gas processing and transport contract for the Sonatrach-Total-Repsol consortium. All of these projects are in the final stages and are progressing satisfactorily. TR also continued to work on the Saih Rawl project for its important client, PDO, in Oman, which includes four compression trains of 30 MW each, input gas separators, other facilities at the processing plant and expansion of the gas collection system. The company also moved forward with the Medgaz project in Algeria, which is slated for delivery in the year 2009.

6
Power In 2007, the activity in this line of business occupied a more prominent role in the Group's portfolio. Combined Cycles Previously, this division tended to be primarily focused on domestic projects. However, in 2007, TR marked the beginning of a new era for the Energy Division with new combined cycle projects beyond our borders. The most relevant contract awards were as follows: In the month of July, TR was awarded four CCGT contracts in a joint venture with General Electric:
GAS NATURAL awarded TR a contact to build an 800 MW combined cycle plant at the Port of Barcelona.
Endesa awarded the company a contract for an 800 MW plant in San Adrian de Besós, Barcelona, and another 230MW plant in Granadilla, Canary Islands.
TR also won its first combined cycle contract in another European country with a 400 MW project in Montoir de Bretagne, in France, for Gaz de France. This contract broadened the scope of the company's collaboration with General Electric, generating new opportunities for the future in this area.
Sales in this line of business increased by 26%, with particularly intense activity this was due to the fact that the third phase of the 220 MW project in Barranco de Tirajana (Gran Canaria) awarded by Endesa, coincided with the development of the energy plant (with a generation capacity of 120 MW) associated with the compression facilities of the Saih Rawl project and the second phase of the Escatrón plant for Global 3. This plant includes the installation of four steam generation boilers and two steam turbines associated with the four gas turbines from the first phase. The project will enable Global, with whom TR has been working since 2003, to increase its generation capacity at this plant by 90 MW. Nuclear In nuclear power, TR, with more than 400 professionals specifically devoted to this area of activity, continues to render engineering services to nuclear power plants operating in Spain and also worked on the following projects in 2007:
Project engineering for the nuclear power plant in Lungmen (Taiwan) for the Taiwan Power Corporation (TPC), consisting of two APWR “Advanced Boiling Water Reactor” type units with 1,360 MW of power each, also in association with General Electric Nuclear Energy.
Development of the new generation III+ passive type “Economical Simplified Boiler Water Reactor” (ESBWR), with 1,550 MW of power, in association with General Electric Nuclear Energy. The services included providing support to GE for the acquisition of the ESBWR Design Certification by the “Nuclear Regulatory Commission” (NRC) in the US and the COL application for power plant projects in the United States with this reactor.
Development of the 150 MW “Pebble Bed Modular Reactor” (PBMR) in South Africa for a consortium led by the electricity company Eskom.
Participation in various R+D projects included in the 6th and 7th Framework Programmes of the European Union related to the development of future nuclear power plants as part of an international programme for advanced 4th generation reactors which would be operational within 30 years.
Work also commenced on:
A viability study for the construction of a new nuclear power plant with light water technology in the Czech Republic for the electricity company Čez.
Training courses for the Lithuanian electricity company Lietuvos Energija, on the current state of nuclear technology in the market; preparation of documentation for an RFP for a new power plant; technical and economic evaluation methodologies of bids and pre-construction activities, all in relation to plans for the construction of a new power plant in Lithuania with the participation of public electric companies from Estonia, Latvia and Lithuania.
7
Preparation of safety studies for the ITER fusion reactor to be built in Cadarache, France. TR also made progress on the national biodiesel projects awarded in 2005, on which delivery will be complete in 2007, including a biodiesel plant with an annual capacity of 40,000 tonnes for Biocombustibles de Cuenca, S.A., in Cuenca and the biodiesel plant in Ocaña, Toledo, for Biocarburantes Castilla La Mancha, S.A. In 2007, TR was awarded a contract for a new biodiesel plant in Extremadura for the Green Fuel Consortium, in which Técnicas Reunidas is also a partner. Infrastructures This division continued to grow thanks to multiple projects in diverse fields such as airports, industrial facilities and desalination and water treatment plants in general, as well as the projects carried out for government organisations such as parking lots, cultural spaces or sports complexes. Some of the most noteworthy projects included:
Desalination plant for ACUAMED (Ministry of the Environment) in Oropesa, Castellón.
Project to remodel the Port of Vigo for the Vigo Port Authority, with the architects Jean Nouvell and Xerardo Estévez.
Silicon obelisk manufacturing plant in Puertollano, Ciudad Real, for the company Silicio Solar. The income from Infrastructures and other totalled €106 million in 2007. The projects that contributed the most to this growth included the fibre plant for Hexcel Composites in Illescas, Toledo, the copper mine in Sevilla and the Santiago de Compostela airport project. José Lladó Juan Lladó Chairman Vice Chairman Chief Executive Officer
8

9
Free translation of the consolidated annual accounts originally issued in Spanish and prepared in accordance with International Reporting Standards as adopted by the European Union. In the event of a discrepancy, the Spanish language version prevails.
CONSOLIDATED ANNUAL ACCOUNTS OF TÉCNICAS REUNIDAS, S.A. AND SUBSIDIARIES AT 31 DECEMBER 2007
CONSOLIDATED BALANCE SHEET
(In thousands of euros)
At 31 December
Note
2007 2006 ASSETS Non-current assets Property, plant and equipment 6 22.949 19.572Goodwill 7 1.242 1.242Other intangible assets 7 22.035 13.816Investments in associates 8 6.856 6.044Deferred tax assets 29 19.578 18.384Available-for-sale financial assets 9 3.371 2.113Derivative financial instruments 10 797 426Receivables and other assets 13 3.147 2.031 79.975 63.628Current assets Inventories 12 16.349 17.851Trade and other receivables 11 911.876 718.434Receivables and other assets 13 12.317 2.338Derivative financial instruments 10 16.767 10.088Financial assets at fair value through profit or loss 14 17.736 21.556Cash and cash equivalents 15 462.047 346.584 1.437.092 1.116.851Total assets 1.517.067 1.180.479
Notes 1 to 39 and Exhibits I to IV form an integral part of these consolidated annual accounts.

10
CONSOLIDATED ANNUAL ACCOUNTS OF TÉCNICAS REUNIDAS, S.A. AND
SUBSIDIARIES AT 31 DECEMBER 2007
CONSOLIDATED BALANCE SHEET (In thousands of euros)
At 31 December
Note
2007 2006 EQUITY Capital and reserves attributable to the Company’s equity holders
Share capital 16 5.590 5.590 Share premium account 16 8.691 8.691 Other reserves 17 1.137 1.137 Hedging reserve 10 19.032 9.106 Cumulative translation difference 18 ( 2.905) 414 Retained earnings 19 220.295 151.389 Interim dividend 19 ( 25.153) ( 16.769) Minority interests 19 5.170 2.619 Total equity 231.857 162.177 LIABILITIES Non-current liabilities Borrowings 21 11.919 2.024 Derivative financial instruments 10 35 - Deferred tax liabilities 29 3.820 659 Other payables 20 2.015 1.070 Other liabilities 917 3.633 Employee benefit obligations 22 4.454 3.999 Provisions for liabilities and charges 23 25.131 23.126 48.291 34.511 Current liabilities Trade payables 20 1.134.593 883.260 Current tax liabilities 24.421 17.984 Borrowings 21 46.105 48.308 Derivative financial instruments 10 - 1.445 Other payables 20 27.732 22.548 Provisions for liabilities and charges 23 4.068 10.246 1.236.919 983.791 Total liabilities 1.285.210 1.018.302 Total equity and liabilities 1.517.067 1.180.479
Notes 1 to 39 and Exhibits I to IV form an integral part of these consolidated annual accounts.

11
CONSOLIDATED ANNUAL ACCOUNTS OF TÉCNICAS REUNIDAS, S.A. AND SUBSIDIARIES AT 31 DECEMBER 2007
CONSOLIDATED INCOME STATEMENT
(In thousands of euros)
Year ended 31 December
Note
2007 2006 Ordinary revenues 24 2.005.176 1.234.528Difference between opening and closing inventories ( 862) 13.987Own work capitalised 8.093 10.293Raw materials and consumables ( 1.386.996) ( 805.152)Employee benefit expense 26 ( 214.019) ( 165.880)Depreciation/amortisation and impairment loss charges 6 and 7 ( 5.315) ( 3.938)Lease and royalty expenses 27 ( 33.218) ( 21.113)Other operating expenses 25 ( 267.197) ( 205.187)Other operating revenues 25 2.324 2.355Operating profit 107.986 59.893Profit on divestment 34 - 13.034Financial results 28 6.041 5.195Share in profit/loss of associates 8 571 464Profit before taxes 114.598 78.586Income tax 29 6.724 6.968Profit for the year 107.874 71.618Attributable to: Company’s equity holders 19 104.680 71.233Minority interests 19 3.194 385 107.874 71.618Earnings per share (expressed in euro per share) - Basic and diluted 30 1,87 1,27
Notes 1 to 39 and Exhibits I to IV form an integral part of these consolidated annual accounts.

12
CONSOLIDATED ANNUAL ACCOUNTS OF TÉCNICAS REUNIDAS, S.A. AND SUBSIDIARIES AT 31 DECEMBER 2007
CONSOLIDATED STATEMENT OF CHANGES IN EQUITY
(In thousands of euros)
Attributable to the Company’s equity holders
Share capital
Share premium account
Other reserves
Hedging reserve
Cumulative translation difference
Retained earnings
Interim dividend
(Note 16)
(Note 16) (Note 17) (Note 10) (Note 18) (Note 19) (Note 19)
Minority interests (Note 19)
Total equity
Balance at 1 January 2006 5.590 8.691 1.137 ( 10.552) ( 545) 152.156 ( 12.000) 2.131 146.608 Distribution of 2005 profits - - - - - (24.000) 12.000 - (12.000) Distribution of prior-years profits - - - - - (48.000) - (48.000) Net effect on hedging reserves - - - 19.658 - - - - 19.658 Other movements - - - - 959 - - 103 1.062 Profit for 2006 - - - - - 71.233 - 385 71.618 Interim dividend for 2006 - - - - - - (16.769) - (16.769)
Balance at 31 December 2006 5.590 8.691 1.137 9.106 414 151.389 (16.769) 2.619 162.177
Notes 1 to 39 and Exhibits I to IV form an integral part of these consolidated annual accounts.

13
CONSOLIDATED ANNUAL ACCOUNTS OF TÉCNICAS REUNIDAS, S.A. AND SUBSIDIARIES AT 31 DECEMBER 2007
CONSOLIDATED STATEMENT OF CHANGES IN EQUITY (In thousands of euros)
Attributable to the Company’s equity holders
Share capital
Share premium account
Other reserves
Hedging reserve
Cumulative translation difference
Retained earnings
Interim dividend
(Note 16) (Note 16) (Note 17) (Note 10) (Note 18) (Note 19) (Note 19)
Minority interests (Note 19)
Total equity
Balance at 1 January 2007 5.590 8.691 1.137 9.106 414 151.389 ( 16.769) 2.619 162.177 Distribution of 2006 profits - - - - - ( 35.774) 16.769 - ( 19.005) Net effect on hedging reserves - - - 9.926 - - - - 9.926 Other movements - - - - ( 3.319) - - ( 643) ( 3.962) Profit for 2007 - - - - - 104.680 - 3.194 107.874 Interim dividend for 2007 - - - - - - ( 25.153) - ( 25.153) Balance at 31 December 2007 5.590 8.691 1.137 19.032 ( 2.905) 220.295 ( 25.153) 5.170 231.857
Notes 1 to 39 and Exhibits I to IV form an integral part of these consolidated annual accounts.

14
CONSOLIDATED CASH FLOW STATEMENT (In thousands of euros)
Year ended
31 December
Note 2007 2006
Cash flows from operating activities Profit for the year 107.874 71.618Adjustments: - Taxes 29 6.724 6.968- Depreciation/amortisation of PPE and intangible assets 6 and 7 5.315 3.938- Net movements in provisions for liabilities and charges 855 5.357- Share in profit/loss of associates 8 ( 571) ( 464) Changes in working capital: - Inventories 1.502 ( 11.975)- Trade and other receivables ( 193.862) ( 246.426)- Other receivables ( 9.979) 1.182- Financial assets at fair value through profit or loss 3.820 35.710- Trade payables 251.333 332.575- Current tax liabilities 1.680 ( 270)- Provisions for liabilities and charges and other payables ( 9.124) ( 20.708)Other changes ( 2.496) ( 124) Net cash generated from operating activities 163.071 177.381 Cash flows from investing activities Purchases of property, plant and equipment 6 ( 7.262) ( 4.671)Purchases of intangible assets 7 ( 9.682) ( 12.879)Acquisition of available-for-sale financial assets 9 ( 1.608) ( 1.426)Acquisition of associates 8 ( 561) ( 476)Acquisition of other non-current assets ( 1.116) ( 4)Disposal of non-current assets 703 6.402 Net cash applied in investment activities ( 19.526) ( 13.054) Cash flows from financing activities Proceeds from borrowings 7.692 ( 3.878)Dividends paid ( 35.774) ( 72.000)Net cash applied in financing activities ( 28.082) ( 75.878) Net change in cash and cash equivalents 115.463 88.449 Cash and cash equivalents at beginning of the year 346.584 258.135Cash and cash equivalents at end of the year 462.047 346.584
Notes 1 to 39 and Exhibits I to IV form an integral part of these consolidated annual accounts.
15
Free translation of the consolidated annual accounts originally issued in Spanish and prepared in accordance with International Reporting Standards as adopted by the European Union. In the event of a discrepancy, the Spanish
language version prevails.
NOTES TO THE CONSOLIDATED FINANCIAL STATEMENTS (In thousands of euros)
1. General information TÉCNICAS REUNIDAS, S.A. (the Company) is the Group’s parent company, having been incorporated on 6 July 1960 as a limited liability company (“sociedad anónima”). It is entered in the Madrid Mercantile Register, volume 1407, sheet 129, page 5692 of the companies book. The latest adaptation and amendment of its Articles of Association is registered in volume 22573, section 8, book 0, sheet 197, page M-72319, entry 157. The registered office of TECNICAS REUNIDAS, S.A. is located at Calle Arapiles 14, Madrid. Its head office is located at Calle Arapiles 13, Madrid. The Company’s corporate purpose consists of the performance of all classes of engineering services and the construction of industrial plants, ranging from viability or basic and conceptual engineering studies to turnkey engineering, design and construction of large, complex projects, management of supply, equipment and material deliveries and construction of plants and related or associated services, such as technical assistance, construction supervision, project management, technical management, launch and training. Within its engineering services business, the Group operates through a number of business lines, mainly in the refinery, gas and energy sectors. These consolidated annual accounts were prepared by the Board of Directors on 28 March 2008. The Directors will submit these consolidated annual accounts to the Annual General Meeting and they are expected to be approved without changes. At year-end 2007, TÉCNICAS REUNIDAS, S.A. is the parent of a group (the Group) formed by: TÉCNICAS REUNIDAS, S.A., the parent company, its subsidiaries and associates. The Group also has interests in joint ventures and UTEs. Exhibits I, II, III and IV to these notes contain additional information on the entities included in the scope of consolidation. Group companies hold interests of less than 20% in other companies in which they do not have significant influence. For the purposes of preparing the consolidated annual accounts, a group is understood to exist when the parent company has one or more subsidiaries, i.e. companies controlled directly or indirectly. The principles applied to prepare the Group’s consolidated annual accounts and the consolidation scope are described in Note 2.2. Exhibit I provides a breakdown of the identification details of the subsidiaries included in the scope of consolidation by means of the full consolidation method. Exhibit II provides the identification details of the associates included in the scope of consolidation using the equity method. Exhibit III provides the identification details of the joint ventures included in the scope of consolidation under the proportionate method. The parent company and certain subsidiaries also have interests in UTEs and consortiums and recognise the relevant assets, liabilities, revenues and expenses on a proportionate basis. Exhibit IV contains details of the Group’s UTEs and consortiums In 2006, the company Técnicas Reunidas Oman LLC was included in the consolidation scope, having been incorporated in 2006 to carry out a number of projects in the Middle East.

16
In 2007, the companies Green Fuel Aragón S.A., Green Fuel Internacional.S.A. and Técnicas Reunidas Ensol, S.A. were included in the scope of consolidation; these are newly created companies and their principal objectives are to supply engineering services and execute renewable energy and bio-fuel projects; and the SICAV PEGASIDES was removed. 2. Summary of the main accounting policies Set out below is a description of the main accounting policies applied to prepare these consolidated annual accounts. The policies have been applied on a uniform basis to all the financial years presented. 2.1. Basis of presentation The Group’s consolidated annual accounts at 31 December 2007 have been prepared in accordance with the International Financial Reporting Standards (IFRS) adopted for use in the European Union, approved by European Commissions Regulations and in force at 31 December 2007. The consolidated annual accounts have been prepared on a historical cost basis, with the exception of certain assets that must be carried at fair value under IFRS. The preparation of consolidated annual accounts under IFRS requires the use of certain critical accounting estimates. The use of IFRS also requires that management exercise judgement when applying the Company’s accounting policies. Note 4 discloses the areas that require a higher level of judgement or entail greater complexity or the areas where assumptions and estimates are significant for the consolidated annual accounts. a) Norms, modifications and interpretations effective in 2007 NIF 7, “Financial Instruments: Information to be revealed”, and additional modification to NIC 1,
“Presentation of Financial Statements – information to be revealed on capital”. NIF 7 introduces new breakdowns to improve the information on financial instruments, although it has no impact on the classification and valuation of the financial instruments of the group, or on the breakdowns related to taxes and suppliers and other accounts payable. The modification to NIC 1 requires the presentation of information on the objectives, policies and management procedures of capital needs (equity), quantitative information on what is considered capital, if any external requisites on capital have been met and the consequences of any non-compliance with these external requisites.
b) Norms, modifications and interpretations effective in 2007 but the application of which do not
affect the Group’s accounts The following norms, modifications and interpretations are obligatory for financial years beginning from 1 January 2007 onwards, although they have no effect on the Group’s obligations: NIF 4, “Insurance contracts”; CINIF 7, “Application of the restatement procedure in line with NIC 29 – Financial information in hyper -
inflationary economies”; CINIF 8; “Scope of NIF2”; CINIF 9; “Revaluation of implicit derivatives”; and CINIF 10, “Intermediate financial information and impairment losses”. c) Norms, modifications and interpretations of existing norms that have not yet become effective
and that the Group has not applied in advance On the date of finalising these accounts, IASB had published the following interpretations. Compliance with these interpretations is obligatory for all the financial years commencing from 1 January 2008 onwards, and all later years, although the Group has not adapted to these in advance: NIF 8, “Operating segments”, with obligatory compliance for financial years beginning from 1 January
2009 onwards. NIF 8 substitutes NIC 14 and homogenises the requirements on the presentation of financial statments by segments with the American SFAS 131 “Disclosures about segments of an enterprise and related information”. The new norm requires a management focus in which the information by segments is presented on the same basis that is used for internal purposes. The Group will apply NIF 8 from 1 January 2009 onwards, although it estimates that the impact of this is not relevant for its operations; and
17
CINIIF 11, “NIF 2 – Group transactions with own shares”. This interpretation sets out the principles for determining if a share transaction involving own shares or those of a group entity (for example, options on the dominant company shares) should be recognised as a transaction with payment in shares settled with equity instruments or settled in cash in the individual accounts of the dominant company and the group entities. The Group does not expect that this CINIIF will have any effect on the group accounts.
d) Norms, modifications and interpretations of existing norms pending adoption by the European
Union On the date of finalising these accounts, IASB had published the following interpretations and compliance with these is obligatory for all the financial years commencing from 1 January 2008 onwards, but they are still pending adoption by the European Union: NIC 23 (revised in March 2007), “Interest expenses”, compliance with which is obligatory for all the
financial years beginning from 1 January 2009 onwards. This norm requires entities to capitalise interest expenses that are directly attributable to the acquisition, construction or production of a qualified asset (that which requires, of necessity, a substantial period of time before it is ready for use or for sale) as part of the cost of the asset. The option of immediately recognising these interest expenses as costs for the period disappears. The Group is analysing the possible impacts of this norm if it is adopted by the European Union;
CINIIF 12, “Contract to render services”, compliance with which is obligatory for all the financial years beginning from 1 January 2008 onwards. CINIIF 12 applies to contracts in which a private operator participates in the development, financing and maintenance of an infrastructure for public sector services. The Group is analysing the possible impacts of this norm if it is adopted by The European Union;
NIC 1 (revised in Spetember 2007), “Presentation of financial statements” is aimed at improving the users abilities in the area of analysis and comparison of the information available in the financial statements. The Group is analysing the possible impacts of this norm if it is adopted by The European Union;
NIIF 2, “Share-based payment vesting conditions and cancellations”, compliance with which is obligatory for all the financial years beginning from 1 January 2009 onwards;
NIIF 3 (revised in January 2008), “Business combinations” compliance with which is obligatory for all the financial years beginning from 1 January 2009 onwards;
NIC 27 (revised in January 2008) “Consolidated and separated financial statements” compliance with which is obligatory for all the financial years beginning from 1 July 2009 onwards;
CINIIF 13, “Customer loyalty generating programmes”, compliance with which is obligatory for all the financial years beginning from 1 July 2008 onwards; and
CINIIF 14, “NIC 19 – Limit of the assets related to a defined benefits plan, minimum financing requirements and the relationship between both”, compliance with which is obligatory for all the financial years beginning from 1 July 2008 onwards.
2.2. Consolidation principles Subsidiaries Subsidiaries are all companies over which the Group has the authority to direct financial and operating policies. Control is presumed to exist when the shareholding exceeds 50% of the voting rights or, if less, when other reasons or events demonstrate the existence of control (for example, agreements between shareholders). When assessing whether the Group controls another company, the existence and effects of potential voting rights which may be currently exercised or converted are taken into account. Subsidiaries are consolidated as from the date on which control is transferred to the Group and are excluded from the consolidation on the date on which such control ceases. The Group accounts for the acquisition of subsidiaries under the purchase method. Acquisition cost is the fair value of the asset delivered, the equity instruments issued and the liabilities incurred or assumed at the date of exchange, plus the costs directly attributable to the acquisition. The identifiable assets acquired and identifiable contingencies assumed in a business combination are initially measured at fair value on the acquisition date, irrespective of minority interests. The excess of acquisition cost over the fair value of the Group’s interest in identifiable net assets acquired is recognised as goodwill. If the acquisition cost is less than the fair value of net assets in the subsidiary acquired, the difference is recognised directly in the income statement.

18
Intercompany transactions, balances and unrealised gains on transactions between Group companies are eliminated. Unrealised losses are also eliminated unless the transaction provides evidence of impairment losses on the asset transferred. When necessary to ensure consistency with Group policies, subsidiaries’ accounting policies are changed accordingly. Exhibit I provides the identification details of the subsidiaries included in the scope of consolidation under the full consolidation method. Associates Associates are all companies over which the Group exercises significant influence but not control. Significant influence is presumed to exist when the shareholding is between 20% and 50% of voting rights or, when the shareholding is lower, there are events and circumstances which demonstrate the exercise of significant influence. Investments in associates are recorded using the equity method and are initially recognised at cost. Group investments in associates include goodwill (net of any accumulated impairment loss) identified on the acquisition. The Group's share of losses or gains subsequent to the acquisition of associates is recognised in the income statement and its share of movements in reserves subsequent to the acquisition is recognised in reserves. Cumulative movements subsequent to the acquisition are adjusted against the carrying amount of the investment. Where the Group's share of the losses obtained by an associate is equal to or exceeds its shareholding, including any other unsecured receivables, the Group does not recognise any additional losses unless it has incurred obligations, or made payments, on behalf of the associate. Unrealised gains on transactions between the Group and its associates are eliminated in proportion to the Group’s shareholdings in the associates. Unrealised losses are also eliminated, except when the transaction provides evidence of impairment losses affecting the asset being transferred. When necessary to ensure consistency with Group policies, associates’ accounting policies are changed accordingly. Exhibit II provides the identification details of the associates included in the scope of consolidation under the equity method. Joint ventures Shareholdings is in combined businesses are consolidated using the proportionate method. The Group combines its share of the assets, liabilities, revenues, expenses and cash flows of the jointly controlled entities on a line-by-line basis, together with the items in its own accounts that are similar in nature. The Group recognises its share of the profit or loss deriving from the sale of Group assets to jointly controlled entities in its consolidated annual accounts in the proportion corresponding to other participants. The Group does not recognise its share of the profits or losses of a jointly controlled entity deriving from the purchase by the Group of assets from the jointly controlled entity until the assets are sold to an independent third party. A loss is recognised immediately on a transaction if it reveals a reduction in the net realizable value of current assets or an impairment loss. Exhibit III provides the identification details of the joint ventures included in the scope of consolidation under the proportionate method. UTEs A temporary joint venture or UTE is an arrangement between companies wishing to collaborate for a specified or unspecified period, during which a job, service or supply is performed or executed. The proportional part of the balance sheet and income statement items relating to the joint venture is incorporated into the balance sheet and income statement prepared by the participating company based on its interest in the UTE. Exhibit IV identifies the UTEs whose financial information is recognised by the companies included in the scope of consolidation.

19
2.3. Segment reporting A business segment is a group of assets and transactions the aim of which is to supply products or services subject to risks and returns which differ from those of other business segments. A geographical segment aims to supply products or services in a specific economic environment subject to risks and returns which differ from those of other segments operating in different economic environments. Transactions between different segments are carried out on an arm's length basis. Segment accounting policies are the same as the policies applied to prepare the consolidated annual accounts. 2.4. Foreign currency transactions Functional and presentation currency The items included in the annual accounts of each of the Group companies are measured using the currency of the principal economic environment in which the company operates (“functional currency”). The consolidated annual accounts are presented in euros, which is the parent company’s functional and presentation currency. Transactions and balances Transactions in foreign currency are translated to the functional currency using the exchange rates in force at the transaction dates. Foreign currency gains and losses resulting from the settlement of transactions and translation at the year- end exchange rates of monetary assets and liabilities denominated in foreign currency, are recognised in the income statement, unless they are deferred in equity as qualified cash flow hedges and qualified net investment hedges. Translation differences in respect of non-monetary items such as equity instruments held at fair value through profit or loss are presented as part of the fair value gain or loss. Group companies The results and financial situation of all the Group companies (none of which has the currency of a hyperinflationary economy) whose functional currency differs from the presentation currency are translated to the presentation currency as follows:
(i) The assets and liabilities on each balance sheet presented are translated at the closing exchange rate at the balance sheet date;
(ii) The revenues and expenses presented in each income statement are translated at the average exchange rates; and
(iii) All resulting exchange differences are recognised as a separate component of equity. On consolidation, any exchange differences resulting from the translation of a net investment in foreign entities, and loans and other instruments denominated in a foreign currency designated as hedges of those investments, are taken to equity. When sold, such exchange differences are recognised in the income statement as part of the profit or loss on the sale. 2.5. Property, plant and equipment Property, plant and equipment are recognised at cost less depreciation and cumulative impairment losses, except for land which is presented net of impairment losses. Historical cost includes expenses directly attributable to purchases of property, plant and equipment. Subsequent costs are included in the carrying amount of the asset or recognised as a separate asset only when it is probable that the future economic benefits associated with the asset will flow to the Group and the cost of the asset may be reliably determined. Other repair and maintenance expenses are charged to the income statement in the year in which they are incurred. No depreciation is charged on land. The depreciation of other assets is calculated on a straight-line basis based on their estimated useful lives and residual values. The estimated useful lives of each asset category are as follows:

20
Industrial structures and premises 25 - 50 Years Plant and machinery 5 - 10 Years Complex and general installations 12 - 17 Years Furnishings and office equipment 10 Years Computer processing equipment 4 Years Vehicles 7 Years Other PPE 7 - 10 Years
The residual values and useful lives of assets are reviewed and adjusted, if necessary, at each balance sheet date. When an asset’s carrying amount exceeds its estimated recoverable value, the carrying amount is written down immediately to the recoverable amount. Gains and losses on the sale of property, plant and equipment are calculated by comparing the revenue obtained with the carrying amount and are recognised in the income statement. Own work capitalised is stated at production cost and recognised as income in the income statement. The cost may also include gains or losses on qualified cash flow hedges relating to acquisitions of PPE denominated in foreign currency that have been transferred from equity. 2.6. Intangible assets Goodwill Goodwill is the excess of acquisition cost over the fair value of the Group’s shareholding in the identifiable net assets of the subsidiary or associate acquired, at the acquisition date. Goodwill relating to acquisitions of subsidiaries is included in intangible assets. Goodwill relating to acquisitions of associates is included in Investments in associates. Goodwill is subject annually to tests of impairment and is carried at cost less cumulative impairment losses. Gains and losses on the sale of a company include the carrying amount of goodwill related to the company sold. Goodwill is assigned to cash generating units (CGUs) in order to test for impairment losses. The recoverable amount of a CGU is the higher of its value in use and its fair value less selling expenses. These calculations use cash flow projections based on financial budgets approved by management that cover a five-year period. Cash flows beyond this five-year period are extrapolated using constant growth rates. Software Software licences acquired are capitalised on the basis of the costs incurred in their acquisition and preparation for the use of the specific program. These costs are amortised over the assets’ estimated useful lives (4 years). Expenses relating to software development or maintenance are recognised when incurred. Costs directly related to the production of single identifiable computer programs controlled by the Group and which will probably generate economic benefits in excess of costs for more than one year are recognised under intangible assets. Direct costs include costs relating to employees developing the software and an appropriate percentage of general expenses. Computer program development costs recognised as assets are amortised over the programs’ estimated useful lives. Research and development expenses Research expenses are recognised as an expense when incurred. Costs incurred in development projects are recognised as intangible assets where the following requirements are met: It is technically possible to complete the production of the intangible asset such that it may be available for use or sale;
Management intends to complete the intangible asset in question for use or sale; The entity has the capacity to use or sell the intangible asset;

21
It is possible to demonstrate the manner in which the intangible asset will generate probable future economic benefits;
Adequate technical, financial and other resources are available to complete the development and to use or sell the intangible asset; and
The outflow of funds attributable to the intangible asset during development may be reliably measured.
Development expenses are recognised as an expense when incurred. Development costs previously recognised as an expense are not recognised as an asset in subsequent years. Capitalised costs of a development having a finite useful life are amortised from the start of the product’s commercial production on a straight-line basis over the period in which it is expected to generate profits. Subsidies received for research and development projects are recorded in the income statement using the method applied to research and development expenses recognised in the income statement. Concessions Concessions under construction refer to the administrative authorisation granted by a number of municipal councils to build and operate car parks, sports facilities and other assets for the period of time stipulated in each contract. The accounting treatment of these assets is similar to the treatment described in CINIIF 12 (as regards classifying the concession assets as intangible assets valued at the fair value of these assets), although that standard is not yet mandatory in the European Union. Once the assets covered by the concession become operational, the concession receipts will be recognised as ordinary revenues, operating expenses will be recognised as an expense for the year and straight-line amortisation will be charged on the intangible assets over the term of the concession. Project returns will be reviewed at each account close to assess whether or not there is any indication of impairment of assets that are not recoverable through the revenues generated. Ceded assets are amortised over the period of the concession. 2.7. Impairment of non-finantial assets Assets with indefinite useful lives and goodwill are not subject to depreciation/amortisation and are tested annually for impairment. The Group did not record any intangible assets with an indefinite useful life in the balance sheet. The Group reviews the assets subject to depreciation at each account close to verify whether or not there are any events or changes in circumstances that indicate that the carrying amount may not be recoverable. An impairment loss is recognised when the carrying amount of the asset exceeds its recoverable amount. The recoverable amount is the higher of fair value of an asset, less selling costs, and value in use. Impairment losses assigned to goodwill are not reversed. For the purposes of evaluating impairment losses, assets are grouped into CGUs, i.e. the lowest level at which separate cash flows may be identified. The impairment loss is recognised in the income statement. The method used to carry out an impairment test at the CGU level is described in Note 7. 2.8. Financial assets The Group classifies investments into the following categories: financial assets at fair value through profit or loss, loans and accounts receivable, held-to-maturity investments and available-for-sale financial assets. The classification depends on the purpose for which the investments were acquired. Management establishes the classification of investments at the time of their initial recognition and reviews the classification at each reporting date. At 31 December 2007 the Group does not record any held-to-maturity investments. Acquisitions and disposals of investments are recognised at the trading date, i.e. on the date the Group undertakes to acquire or sell the asset. Investments are recognised initially at fair value plus transaction costs for all financial assets not carried at fair value through profit or loss Investments are written off when the rights to receive cash flows from them have expired or have been transferred and the Group has transferred substantially all the risks and rewards of ownership.

22
Financial assets at fair value through profit or loss This category has two subcategories: financial assets held for trading and financial assets designated as at fair value through profit or loss when initially recognised. A financial asset is classified in this category if it is mainly acquired for sale in the short term or when the asset is so designated by management. Derivatives are also classified as held for trading unless they are designated as hedging instruments. Assets in this category are classified as current assets if they are held for trading or are expected to be realised within 12 months as from the balance sheet date. These financial assets are subsequently recorded at their fair value. Realised and unrealised gains and losses resulting from changes in the fair value of financial assets at fair value through profit or loss are included in the income statement in the year in which they arise. Loans and other receivables Loans and other receivables are non-derivative financial assets subject to fixed or determinable payments that are not listed on an active market. They arise when the Group supplies money, goods or services directly to a debtor and does not intend to trade with the account receivable. They are included in current assets, except for assets maturing after more than 12 months from the balance sheet date, which are classified as non-current assets. This category includes deposits and guarantees furnished to third parties. Loans and accounts receivable are included in Trade and other receivables in the balance sheet. Loans and receivables are carried at amortised cost using the effective interest method. Available-for-sale financial assets This classification relates to non-derivative financial assets that are designated as available for sale or are not included in any other category. They are included in non-current assets unless management intends to dispose of the investment within 12 months as from the balance sheet date. These financial assets are subsequently recorded at their fair value. Unrealised gains and losses resulting from changes in the fair value of non-monetary instruments classified as available for sale are recognised in equity. When instruments classified as available for sale are sold or become impaired, the cumulative fair value adjustments are included in the income statement as losses or gains on the instruments in question. The fair values of listed investments are based on current bid prices. If the market for a financial asset is not active (as in the case of unlisted securities), the Group establishes fair value by using measurement techniques that include the method based on recent transactions between duly informed interested parties relating to other instruments which are substantially identical, and the discounted cash flow method. In the event that neither of the methods mentioned above may be used to estimate fair value, the investments are stated at acquisition cost less any impairment losses. At each balance sheet date, the Group assesses whether there is objective evidence of impairment losses with respect to a financial asset or group of financial assets. For equity instruments classified as available for sale, impairment is determined on the basis of the existence of a significant or protracted decline bringing the fair value of the instruments to below their cost. Should impairment of available-for-sale financial assets be identified, the cumulative loss in the amount of the difference between the acquisition cost and current fair value, less any impairment loss on the financial asset previously recognised in the income statement, is removed from equity and recognised in the income statement. Impairment losses recognised in the income statement on equity instruments are not reversed through the income statement. 2.9. Inventories Inventories include the cost of construction investment property held for sale and also the cost of certain materials yet to be allocated to projects. The costs incurred to submit bids are included in inventories when it is likely or certain that the contract will be secured or when it is known that the costs will be reimbursed or included in the revenues originating from the contract. Inventories are measured at the lower of cost and net realisable value. Cost is calculated as the acquisition price or direct production cost. The cost of inventories includes design costs, raw materials, direct labour, other direct costs and manufacturing overheads (based on the ordinary operating capacity), excluding interest expense. The net realisable value is the estimated selling price in the ordinary course of business, less applicable variable costs of sales.

23
2.10. Trade receivables Trade receivables are initially recognised at fair value and subsequently measured at amortised cost using the effective interest method, less the provision for impairment losses. A provision is recorded for impairment losses on trade receivables where there is objective evidence that the Group will be unable to collect all amounts receivable on the original terms agreed. Where the debtor is in serious financial difficulty, the probability of bankruptcy or financial reorganisation, together with default or delay in payment, are deemed to be indicators of impairment of the receivable. The amount of the provision is the difference between the carrying amount of the asset and the present value of forecast future cash flows, discounted at the effective interest rate. The amount of the provision is recognised in the income statement. 2.11. Cash and cash equivalents Cash and cash equivalents include cash, demand deposits at credit institutions, other short-term highly liquid investments with an original maturity of three months or less and bank overdrafts. In the balance sheet, bank overdrafts are classified as borrowings under current liabilities. 2.12. Share capital Share capital is represented entirely by ordinary shares carried in equity. Incremental costs directly attributable to the issue of new shares are presented in equity as a deduction, net of the relevant tax effect, from the revenues obtained. Where a Group company acquires shares in the parent company (treasury shares), the purchase consideration, including any incremental cost directly attributable (net of income tax), is deducted from equity attributable to the parent company’s equity holders, until the treasury shares are redeemed, reissued or sold. When treasury shares are sold or subsequently reissued, any amount received, net of directly attributable incremental transaction costs and income tax effects, is included in equity attributable to the parent company’s equity holders. 2.13. Government grants Government grants are recognised at fair value where there is reasonable assurance that the grant will be collected and the Group will comply with all stipulated terms and conditions. Government grants obtained to cover costs are deferred and recognised in the income statement over the necessary period to match them to the costs they are intended to cover. Government grants for the acquisition of property, plant and equipment or intangible assets are included in non-current liabilities as deferred government grants and released to the income statement on a straight-line basis over the estimated useful lives of the assets concerned. 2.14. Suppliers Suppliers are initially recognised at fair value and subsequently remeasured at amortised cost using the effective interest method. 2.15. Borrowings Borrowings are recognised initially at fair value, net of the direct transaction costs. Borrowings are subsequently measured at amortised cost. Any differences between the funds obtained (net of the necessary costs incurred in their obtainment) and the repayment value are recognised in the income statement over the life of the debt using the effective interest method. Borrowings are classified as current liabilities unless the Group has an unconditional right to defer settlement for at least 12 months as from the balance sheet date.

24
Interest and other expenses incurred to obtain borrowings are taken to the income statement for the year on an accrual basis. 2.16. Deferred taxes Deferred taxes are calculated using the liability method, based on temporary differences between the tax bases of assets and liabilities and their carrying amounts in the consolidated annual accounts. However, if the deferred taxes arise from the initial recognition of a liability or an asset on a transaction, other than a business combination, that at the transaction date has no effect on the reported or taxable profit or loss, the deferred taxes are not recognised. Deferred tax is determined using tax rates approved or about to be approved at the balance sheet date that are expected to be applied when the corresponding deferred tax asset or deferred tax liability is realised or settled. Deferred tax assets are recognised insofar as future taxable profits will probably arise against which to offset the temporary differences. 2.17. Employee benefits Pension and retirement obligations Some Group companies record obligations with employees in the form of defined contribution pension plans and other defined benefit retirement obligations. A defined contribution plan is a pension plan under which the Group makes fixed contributions to an independent entity and will not have any legal or implicit obligation to make additional contributions if the fund does not hold sufficient assets to pay all employees the benefits for current year and prior year services. A defined benefit plan is a pension plan under which the amount of the benefit that will be received by an employee at the time of retirement is defined, normally on the basis of one or more factors such as age, years of service or remuneration. The liability recognised in the balance sheet with respect to defined benefit pension plans is the present value of the defined benefit obligation at the balance sheet date less the fair value of the plan assets, together with adjustments for unrecognised actuarial gains and losses and past service costs. The defined benefit obligation is calculated annually by independent actuaries using the projected unit credit method. The present value of the obligation is determined by discounting future cash flows estimated at interest rates on applied to government bonds denominated in the currency in which the benefits will be paid with maturities similar to those of the relevant obligations. Actuarial gains and losses that arise from adjustments applied based on experience and changes in the actuarial assumptions are charged and credited, as appropriate, to the income statement for each year. Past service costs are recognised immediately in the income statement unless changes in the pension plan are conditional on the employees continuing in employment for a specified time period (vesting period). In this case, past service costs are amortised on a straight-line basis over the vesting period. Defined contributions made to plans are recognised as employee benefits when they accrue and are recorded as an expense for the year. Other non-current remuneration obligations Some Group companies record an implicit obligation to provide defined benefits that are treated as non-current remuneration. The right to receive this type of benefit is normally subject to the employee remaining at the company for a certain number of years. The forecast costs of these benefits accrue over the employment period of the employees using an accounting method similar to the one applied to defined benefit pension plans. Actuarial gains and losses that arise from adjustments applied based on experience and on changes in actuarial assumptions are charged and credited to the income statement for each year, as appropriate. These obligations are valued on an annual basis by qualified independent actuaries.

25
Severance indemnities Severance indemnities are paid to employees as a result of the Company’s decision to terminate employment contracts before the normal retirement age or when employees voluntarily agree to resign in return for such benefits. The Group recognises these benefits when it has demonstrably undertaken to make present workers redundant in accordance with a detailed formal plan which cannot be withdrawn or to provide severance indemnities as a result of an offer to encourage employees to take up voluntary redundancy. Benefits which will not to be paid within 12 months of the balance sheet date are discounted to their present value. 2.18. Provisions The Group recognises provisions when it has a present legal or implicit obligation as a result of past events, it is more likely than not that resources must be applied to settle the obligation and the amount may be reliably estimated. Provisions for future operating losses are not recognised. Provisions are recorded based on the best estimate of the liability payable by the Group, bearing in mind the effects of exchange rate fluctuations on amounts denominated in foreign currency and the value of money over time, if the effect is significant. 2.19. Revenue recognition Ordinary revenues include a fair value of purchase considerations received or receivable for the sale of goods and services in the ordinary course of the Group’s business. Ordinary revenue is recognised net of value added tax, returns, rebates and discounts, and after eliminating intra-Group sales. The Group recognises revenues when the amount may be reliably calculated, the future economic benefits are likely to flow to the company and the specific conditions applicable to each of the Group’s activities are fulfilled, as described below. The amount of revenues may not be reliably calculated until all contingencies affecting sales are resolved. The Group’s estimates are based on historical data, taking into account the type of customer and transaction, as well as the specific terms of each contract. Administration contracts Sales of services refer to administration contracts and are recognised in the financial year in which the services are rendered based on a percentage-of-completion basis with respect to the service actually provided. The price payable by the final customer consists of the direct costs incurred, to which a fixed margin is applied for indirect costs and company profit. Engineering contracts When the results of a contract may not be reliably estimated, the relevant revenues are recognised only up to the limit of the costs incurred under the contract that are likely to be recovered. Where the results of a contract may be reliably estimated and it is likely to be profitable, revenues are recognised over the term of the contract. The revenue recognition method for turnkey engineering contracts varies based on the estimated results. When the costs are likely to exceed the total revenues obtained, the expected loss is immediately recognised as an expense. The Group uses the percentage-of-completion method to calculate the adequate amount to be recognised in a given period. Percentage-of-completion is calculated by reference to the contractual costs incurred at the balance sheet date, expressed as a percentage of the total estimated cost of each contract. Costs incurred during the year with respect to future contractual activities are excluded from the contractual costs used to determine percentage of completion. Contractual revenues arising from claims made by the Group against customers or from changes in the scope of the project concerned are included in contractual revenues when they are approved by the final customer or when it is likely that the Group will receive an inflow of funds.

26
The Group presents as a receivable the gross amount owed by customers for all work performed under current contracts for which the costs incurred plus recognised profits (less recognised losses) exceed the amount of interim billings. Interim billings not yet paid by customers and withholdings are included in Trade and other receivables. The Group presents as a liability the gross amount owed by customers for all work performed under current contracts for which the interim billings exceed costs incurred plus recognised profits (less recognised losses). Costs incurred to make bids for construction contracts in Spain and abroad are expensed in the income statement when incurred, where it is not likely or certain at that date that the contract will be awarded to the Group. The cost of submitting bids is included in the cost of the contract when it is likely or certain that the contract will be obtained, or when it is known that these costs will be reimbursed or included in the revenues originating from the contract. 2.20. Derivative financial instruments and hedge transactions Derivative financial instruments are initially recognised at fair value at contract inception and are subsequently remeasured at their fair value. The recognition of gains or losses arising from changes in the fair value in each period depends on whether the derivative is designated as a hedging instrument and, if so, on the nature of the item hedged. The Group designates certain derivatives as hedges of a specific risk associated with a highly probable forecast transaction (cash flow hedge). Derivatives embedded in other non-financial instruments are recognised separately as derivatives only when their financial characteristics and inherent risks are not strictly related to the instruments in which they are embedded and whole item is not being recorded at fair value. Note 10 includes information on the fair value of the derivatives employed in hedge transactions. The consolidated statement of changes in equity shows movements in the hedging reserve in equity. Derivatives not qualifying for hedge accounting In the case of financial derivatives not designated as hedging instruments, or which do not qualify for hedge accounting, fluctuations in their fair value at each measurement date are recognised as financial result (revenue or expense) in the income statement. Cash flow hedges At hedge inception, the Group documents the relationship between hedging instruments and the hedged items, in addition to its risk management objective and the strategy to be employed in each hedge transaction. The Group also documents its evaluation, both at hedge inception on an ongoing basis, of whether or not the derivatives used in the hedge transaction are highly effective when offsetting changes in cash flows from the hedged assets. The effective portion of changes in the fair value of derivatives designated and qualifying as cash flow hedges is recognised in equity in a specific reserve. The gain or loss relating to the ineffective portion is recognised immediately in financial result in the income statement. Amounts accumulated in equity are transferred to the income statement in the year in which the hedged item affects results. However, when the forecast transaction which is hedged results in the recognition of a non-financial asset or liability, the gains or losses previously deferred in equity are transferred from equity and included in the initial cost measurement of the asset or liability involved. When the hedging instrument matures or is sold or when a hedge transaction ceases to comply with the requirements for the application of hedge accounting, the gains or losses accumulated in equity to that date will remain in equity and will be taken to the income statement when the forecast transaction is finally recognised in the income statement. However, if the transaction is no longer likely to take place, the gains or losses accumulated in equity are immediately taken to the income statement.

27
Fair value hedges Changes in the fair value of designated derivatives that qualify as fair value hedges are recognised in the income statement, together with any change in the fair value of the hedged asset or liability. 2.21. Fair value The fair value is the amount at which a financial instrument is exchanged between duly informed interested parties in an arm’s length transaction. The fair value of financial instruments listed on active markets is based on year-end market prices. The fair value of financial instruments that are not listed on an active market is calculated using valuation methods. The Group mainly uses valuation methods based on information from recent transactions carried out at arm’s length involving similar instruments and the discounting of forecast cash flows. 2.22. Leases Leases on property, plant and equipment in which the Group is the lessee and obtains substantially all the risks and rewards of ownership of the assets are classed as finance leases. Finance leases are recognised at the start of the contract at the lower of the fair value of the leased asset and the present value of the minimum lease payments. Each lease payment is allocated between the liability and finance charges so as to achieve a constant rate on the finance balance outstanding. The payment obligation derived from the lease, net of finance charges, is recognised in non-current payables, except for the portion falling due within 12 months. The interest element of the finance charges is taken to the income statement over the lease period so as to produce a constant periodic rate of interest on the remaining balance of the liability for each period. PPE acquired under finance leases are depreciated over the shorter of the useful life of the asset and the lease term. Leases in which a significant portion of the risks and rewards of ownership are retained by the lessor are classified as operating leases. Where the Group is the lessee, payments made under operating leases (net of any incentives received from the lessor) are charged to the income statement on a straight- line basis over the period of the lease. 2.23. Dividend payment The payment of dividends to the Company’s shareholders is recognised as a liability in the Group’s consolidated annual accounts in the year in which the dividends are approved by the Company’s shareholders. 2.24. Environment Given the activity in which the Group companies are involved, they have no environmental liabilities, expenses, assets, provisions or contingencies that could be significant with respect to its equity, financial situation and results. For this reason, no specific breakdowns are provided in these notes to the annual accounts regarding environmental information. 3. Financial risk management 3.1. Financial risk factors a) Market risk a.1) Foreign exchange risk The Group operates in the international area and therefore it is exposed to foreign exchange risks on transactions denominated in foreign currency, particularly the US dollar (USD) and, to a lesser extent, currencies tied to the USD. There are residual minor risks concerning suppliers in other currencies (principally in Japanese yen or sterling). Foreign exchange risk derives from future transactions, recognised assets and liabilities and net investments in foreign operations.

28
To control the Foreign exchange risk that derives from future transactions and recognised assets and liabilities, Group companies use forward contracts, in accordance with the hedging policy in place, negotiated through the Group’s Corporate Treasury Department. Foreign exchange risk arises when the future transactions and recognised assets and liabilities are denominated in a currency other than the Company’s functional currency. Group Treasury is responsible for managing the net position in each foreign currency using external foreign exchange forward contracts. In addition, the Group tries to cover itself against the exchange rate risk by reaching “multicurrency” agreements with the customers, separating the selling price of the various currencies from the foreseen expenses and maintaining the foreseen margin in euros. The Group’s risk management policy consists of hedging the majority of highly certain forecast transactions (mainly net cost of sales in other currencies than euros) in each of the main currencies and for all the forecast project months. In each new project covered by a foreign exchange hedge, the percentage of the risk to be hedged changes with respect to projected sales in each of the main currencies. These hedges are classified as highly probable forecast transactions for hedge accounting purposes. Because of the Group’s type of operations, it is very common to contract operations with customers in US dollars, while it is common that the corresponding costs are in various currencies, including principally US dollars. If on 31 December 2007, the euros had devalued/fallen in value by 10% compared to the US dollar and the rest of the variables remained constant, the consolidated result for the year before taxes would have been 6,513 thousand euros (2006: 6,577 thousand euros) higher/lower principally as a result of the gains/losses generated through the revaluation/devaluation of the positions held in US dollars. Equity, if the euro had devalued/increased by 10% against the US dollar, would have been lower/higher by 11,525/13,070 thousand euros (2006: 24,963/21,957 thousand euros); these effects on equity were estimated taking into account the variations in the results mentioned earlier, and the estimated variations in the hedging financial derivatives affecting the equity reserve (all without taking the tax effect into accounts). Additionally, the Group has various investments in foreign operations, in which the equity is exposed to foreign currency exchange rate risks. In general it is the Group’s policy that operations in each country are financed by debts taken in the functional currency of each country, so that the risk only affects the part corresponding to capital investments. As at 31 December 2007 there are no relevant foreign investments. The following chart shows the balances of the principal exposures in foreign currency, as a result of the capital investments made:
2007 2006
US dollars 3.322 2.953
Omani rials 666 689
Saudi rials 17.855 404
Others 1 1
Total 21.844 4.047 a.2) Price risk The Group is not exposed to price risk with respect to equity instruments as no significant investments are held by the Group. The Group is partially exposed to commodity price risks, basically metals and oil, to the extent that they affect the price of equipment and manufactured materials used in construction projects. In general these impacts are effectively passed on in selling prices by all similar contractors that operate in the same sector. The Group reduces and mitigates price risks with the policies established under the instructions issued by Management, which basically consist of accelerating or slowing the rate of placements and selecting the currencies and countries of origin. An additional mechanism used by the Group to mitigate this risk takes the form of contracting models that allow a part of the price to be applied to cover possible cost departures.

29
a.3) Cash flow and fair value interest rate risks The Group generally assures that the projects in which it participates are self-financing, establishing invoicing and collections targets with the customers that cover the payment period committed to with the suppliers. Because of this the net Treasury position (Borrowings less Cash and cash equivalents) is positive by a significant amount. As a result a significant exchange rate risk can hardly be considered. The following table shows the exposure to variable interest rate at the close of each year: 2007 2006 Referenced
to Euribor Other
references Total Referenced
to Euribor Other
references Total
Borrowings (25.201) (32.823) (58.024) (21.885) (28.447) (50.332) Cash and cash equivalents that incur interest 358.047 104.000 462.047 234.498 112.086 346.584 Net position 332.846 71.177 404.023 212.613 83.639 296.252 b) Credit risk Credit risk management is performed by the Group taking into account the following financial asset grouping: Assets related to derivatives financial instruments (see Note 10) and balances for various concepts
including Cash and cash equivalents (see Note 15). Trade and other receivables related balances (see Note 11). Financial instrument derivatives and operations with financial entities included as cash and cash equivalents are contracted with highly prestigious financial entities with high credit ratings. Investments in State Treasury Bonds and “repo” operations in these assets are also related to Governments with high credit ratings. In relation to customer balances and accounts receivable it should be noted that, due to the nature of the business, there is a high concentration based on the most important of the Group’s projects. The counterparties are generally state oil companies or multinationals, along with major Spanish groups dedicated to the energy business. Our principal customers represent some 73% of the total of the Trade receivables account (included in Trade and other receivables) at 31 December 2007 (2006: 69%), and are related to operations with the type of entities mentioned earlier, so the Group considers the credit risk is well controlled. In addition to the analysis performed before contracting, a follow-up is made regularly of the global position of Trade and other receivables, and also an individual analysis of the most important exposures (including of the type of entities mentioned earlier). c) Liquidity risk The prudent management of liquidity risk entails maintaining sufficient cash and negotiable instruments, available financing in the form of adequate credit facilities and the capacity to liquidate market positions. Given the dynamic nature of the underlying businesses, the Group's Treasury Department seeks to ensure flexible financing in the form of available credit facilities. A number of minor credit lines are obtained to finance working capital for specific projects, although in view of the liquidity position and the slightly positive or neutral cash flow of most of the Group's projects, liquidity risk is estimated to be insignificant. Management performs a follow-up of the provisions of liquidity reserves of the Group on the basis of the expected cash flows. Because of the objective of self-financing projects mentioned earlier, the net treasury positions are highly positive. Additionally, the Group has credit lines that offer additional support to the liquidity position. Because of this it is believed the liquidity risk of the Group is low. The following is a breakdown of the information referring to liquidity:

30
2007 2006 Borrowings (Note 21) (58.024) (50.332) Cash and cash equivalents (Note 15) 462.047 346.584 Net treasury position 404.023 296.252 Unused credit lines (Note 21) 166.237 113.977 Total liquidity reserves 570.260 410.229 The table shown below presents an analysis of the Group’s financial liabilities that will be settled by group netted by due date, in line with the pending terms on the balance sheet date until the maturity date stipulated in the contract. The amounts shown in the table correspond to the cash flows stipulated in the contract without discounting. The balances payable within 12 months are equivalent to the amounts in the books, since the discount effect is insignificant.
Less than one
year
Between 1
and 2 years
Between 2
and 5 years
More than 5
years
As at 31 December 2007
Borrowings 46.105 5.333 - 6.586
Derivative financial instruments - 35 - -
Trade payables 1.162.325 2.015 - -
Non-accrued interest payable 2.626 597 1.008 1.344
Total 1.211.056 7.980 1.008 7.930
As at 31 December 2006
Borrowings 48.308 952 - 1.072
Derivative financial instruments 1.445 - - -
Trade payables 905.808 1.070 - -
Non-accrued interest payable 2.025 92 151 202
Total 957.586 2.114 151 1.274 Group Treasury performs liquidity management in a joint manner and centrally. This includes both treasury management of the Group’s recurring operations (analysis and monitoring of due dates and credit collection, renewal and contracting credit policies, management of available credit lines, temporary placement of treasury surpluses) and also management of the funds needed to cover planned investments. 3.2. Management of capital risk The Group’s objectives in capital management are based upon guaranteeing trading operations and offering our customers and potential customers sufficient own funds to guarantee our capacity to handle the projects. In addition to achieving a yield for the shareholders, along with profits for other net equity instrument holders, who maintain an optimum capital structure, reducing the cost of this. To be able to maintain and adjust the capital structure, the Group can adjust the amount of dividend payable to the shareholders, reimburse capital to shareholders, issue new shares or sell assets to reduce debt. The Group monitors capital in line with the leverage index. This index is calculated as debt divided by net equity. Debt is calculated as the total of external resources. Capital is calculated as equity, as is shown in the consolidated accounts.

31
2007 2006
Borrowings – I (Note 21) (58.024) (50.332)
Net treasury position - II 404.023 296.252
Net Equity - III 231.857 162.177
% I / III 25,02 % 31,03 %
% II / III 174,25 % 182,67 % 4. Accounting estimates and judgements The preparation of the consolidated annual accounts in accordance with IFRS requires that management make estimates and judgments that may affect the accounting policies adopted and the amount of the assets, liabilities, revenues, income and breakdowns related to these policies. Estimates and assumptions are based, among other aspects, on past experience or other events deemed reasonable in view of the facts and circumstances analysed at the balance sheet date, the result of which forms the basis for estimating the carrying amounts of assets and liabilities that cannot be immediately calculated in any other manner. Actual results may differ from estimated results. Estimates and judgements are assessed continuously and are based on historical experience and other factors, including expectations of future events which may be considered reasonable in the circumstances. Accounting estimates are considered to be significant if the nature of the estimates and judgments is material and if their impact on the Group's financial position or operating returns is material. The main estimates applied by Group management are as follows: Goodwill impairment test The Group tests goodwill annually for impairment, in accordance with the accounting policy described in Note 2.7. The amounts recoverable by the cash generating units have been determined based on calculations of value in use. These calculations require the use of estimates. Income tax and deferred tax assets The calculation of income tax requires the interpretation of tax legislation applicable to the Group companies. There are also several factors related mainly, but not exclusively, to changes in tax laws and changes in the interpretation of tax laws already in force that require the use of estimates by Group management. In addition, the Group assesses the recoverability of deferred tax assets based on the existence of future taxable income against which these assets may be offset. Useful lives of PPE and intangible assets Group management determines the estimated useful lives and resulting depreciation and amortisation charges for PPE and intangible assets. The useful lives of non-current assets are estimated based on the period over which the asset will generate profits. At each account close, the Group reviews the useful lives of the assets. When changes are identified, the necessary adjustments are made on a prospective basis. Employee benefits The present value of employee benefit obligations depends on a number of factors that are determined using actuarial assumptions. The assumptions made to determine the cost and the employee benefit obligation include a discount rate and a growth rate for salaries and other benefits. Other key assumptions for pension obligations are based in part on current market conditions. Additional information is disclosed in Note 22. Any change in these assumptions will have an impact on the amount of the expense and liability in respect of obligations relating to employees.

32
Receivables and financial assets The Group makes estimates relating to the collectability of trade receivables for projects affected by disputes to be resolved or litigation in progress deriving from acceptance issues regarding executed work or the failure to comply with contractual clauses linked to the return on assets delivered to customers. In addition, the Group makes estimates to evaluate the recoverability of available-for-sale financial assets based mainly on the financial health and short-term business prospects of the investee company. Provisions Provisions are recognised when it is probable that a present obligation, resulting from past events, will require the application of resources and the amount of the obligation may be reliably estimated. Significant estimates are required to fulfil the requirements of accounting legislation. Group management makes estimates, evaluating all relevant information and events, of the probability of a contingency and the amount of the liability to be settled in the future. Revenue recognition The revenue recognition method applied by the Group is based on the percentage of completion. Percentage of completion is calculated as costs incurred under a contract as a percentage of the total estimated costs to be incurred to perform the contract. This revenue recognition method is applied only when the result of the contract may be reliably estimated and it is likely that the contract will generate profits. If the result of the contract may not be reliably estimated, revenues are recognised to the extent that costs are recovered. When it is likely that the costs of a contract will exceed the revenues, the loss is immediately recognised as an expense. When applying the percentage-of-completion method, the Group makes significant estimates relating to the total costs necessary to perform the contract. These estimates are reviewed and assessed regularly in order to verify whether or not they generated a loss and if it is possible to continue to apply the percentage-of-completion method, or to re-estimate the expected margin from the project. During the project, the Group also estimates probable contingencies related to the increase in the total estimated cost and adjusts revenue recognition accordingly. Fair value of unlisted financial instruments The Group calculates the fair value of financial instruments (financial assets and liabilities) that are not traded on an active market through estimates made using a number of methods and assumptions that are based mainly on market conditions at each balance sheet date. The Group has used discounted cash flow analyses for some available-for-sale financial assets not traded on active markets, or other objective evidence of the fair value of the instrument concerned, such as recent similar transactions or the value of purchase or sale options in force at the balance sheet date. Warranty claims The Group generally offers 24- or 36-month warranties on its work and services. Management estimates the relevant provision for future warranty claims based on past information regarding such claims, as well as recent trends that may suggest that past information regarding costs may differ from future claims.

33
5. Segment reporting Oil and Gas Energy Other Unallocated Group
2007 2006 2007 2006 2007 2006 2007 2006 2007 2006 Profit by segment Ordinary revenues 1.647.095 927.304 252.584 200.888 105.497 106.336 - - 2.005.176 1.234.528 Operating profit 127.907 73.056 14.443 11.413 7.420 7.722 ( 41.784) ( 32.298) 107.986 59.893
Profit on divestment (Note 34) - 13.034
Net financial result (Note 28) 6.041 5.195 Share in profit/loss of associates 437 407 234 125 ( 100) (68) - - 571 464
Profit before taxes 114.598 78.586
Income tax 6.724 6.968
Profit for the year 107.874 71.618
Assets and liabilities by segment Assets 1.132.386 818.822 128.445 64.086 181.958 120.128 67.422 171.399 1.510.211 1.174.435 Investments in associates 2.929 2.936 2.931 1.905 996 1.203 - - 6.856 6.044 Total assets 1.135.315 821.758 131.376 65.991 182.954 121.331 67.422 171.399 1.517.067 1.180.479 Liabilities 1.056.227 700.635 109.387 39.862 59.421 104.325 60.175 173.480 1.285.210 1.018.302 Investments in non-current assets (Notes 6 and 7) - 1.481 8 - 12.224 6.709 4.712 9.360 16.944 17.550 Other information by segment Depreciation of property, plant and equipment (Note 6) - - - - - - 3.852 1.383 3.852 1.383 Amortisation of intangible assets (Note 7) - - - - - - 1.463 2.555 1.463 2.555 Impairment of trade receivables (Note 11) - - - - - - 420 1.000 420 1.000

34
Primary reporting format: business segments At 31 December 2007, the Group is organized into the following business segments: Oil and Gas, Energy and Other. Although the Group’s core business is formed by engineering and construction services, the above-mentioned segment reporting format is presented on the understanding that the risks and rewards of its services and the specialisation required to complete the projects, among other matters, make the business segment distinction necessary in order to provide more insight into the organisation. The Oil and Gas segment focuses on engineering services, supply and construction services relating to oil and chemicals processing and production operations, and activities relating to the entire natural gas production and extraction value chain, i.e. production, processing, storage and transport. Activities in the refining sector range from the construction of refineries to the refurbishment and expansion of existing refining plants. Units designed and built include basic refining plants, conversions and octane improvement projects. The Group designs and builds auxiliary services and other refining units. Petrochemical activities include the design and construction of plants that produce and process monomers, polymers and plastics, chemical plants and fertiliser units. As regards natural gas, the Group mainly designs and builds units used in the extraction and preliminary processing of natural gas, prior to its use in subsequent processes or preparation for export. The Group is particularly specialized in regasification and transport facilities. In the energy industry, the Group performs consulting, engineering, supply and construction services for a range of electricity generating plants such as conventional thermal plants, combined cycle plants, gasification integrated with combined cycle, nuclear plants, co-generators, solar, fuel cells, solid waste and biomass applications. The Group also supplies turnkey plants and, at times, performs plant operation and maintenance services. The segment Other encompasses the activities of the business area Infrastructures and Industries and, as regards assets, the activities of the Finance business, none of which may be identified as a separate reporting segment. The unallocated operating profit includes the Group’s structural costs. No sales were made between the Group’s business segments in the years reported. Secondary reporting format: geographical segments The Group’s business segments operate mainly in Spain, Middle East, America, Asia and the Mediterranean, although they are managed on a worldwide basis. The following should be noted: a) the geographical area America relates mainly to operations in Chile and Mexico; b) the Asia area encompasses operations in China and Vietnam; and c) the Mediterranean area basically includes operations in Morocco, Algeria, Egypt and Turkey, among other countries.
Sales 2007 2006
Spain 361.965 397.151 Middle East 1.143.989 478.969 America 250.295 177.480 Asia 150.144 134.281 Mediterranean 98.783 46.647
2.005.176 1.234.528

35
Sales are assigned on the basis of the country in which the customer is located.
Assets Non-current investments
2007 2006 2007 2006
Spain 411.722 345.020 10.551 6.709 Middle East 677.677 431.396 - 1.156 America 249.290 115.861 80 325 Asia 40.354 86.389 - - Mediterranean 111.608 74.670 - -
Total 1.490.651 1.053.336 10.631 8.190 Associates 6.856 6.044 - - Not assigned 19.560 121.099 6.313 9.360
1.517.067 1.180.479 16.944 17.550 All the assets are assigned on the basis of their location. 6. Property, plant and equipment Set out below is an analysis of Property, plant and equipment showing movements during the year:
Cost Land and buildings
Plant and machinery
Furniture and
equipmet
Assets under
construc. Other
assets Total Balance at 1 January 2006 973 9.038 16.496 2.538 3.224 32.269 Increases 22 2.400 2.144 - 105 4.671 Decreases - - - - - - Other movements - - - - - - Balance at 31 December 2006 995 11.438 18.640 2.538 3.329 36.940 Increases - 3.030 3.397 157 678 7.262 Decreases ( 33) - - - - ( 33) Other movements - - - - - - Balance at 31 December 2007 962 14.468 22.037 2.695 4.007 44.169
Accumulated depreciation Land and buildings
Plant and machinery
Furniture and
equipment
Assets under
construc. Other
assets Total Balance at 1 January 2006 397 3.728 9.939 - 1.921 15.985 Increases 11 728 591 - 53 1.383 Decreases - - - - - - Other movements - - - - - - Balance at 31 December 2006 408 4.456 10.530 - 1.974 17.368 Increases 11 1.165 2.637 - 39 3.852 Decreases - - - - - - Other movements - - - - - - Balance at 31 December 2007 419 5.621 13.167 - 2.013 21.220 Net balance at 1 January 2006 576 5.310 6.557 2.538 1.303 16.284 Net balance at 31 December 2006 587 6.982 8.110 2.538 1.355 19.572 Net balance at 31 December 2007 543 8.847 8.870 2.695 1.994 22.949

36
The item Land and buildings includes office buildings that are owned by certain Group companies. The balance in Assets under construction relates to the engineering costs arising from the design and construction of a battery and fluorescent tube recycling plant by a group company. During the year the project was interrupted for reasons linked to the adequacy of the land on which the recycling plant was to be built. The Group believes that not occurs any significant impairment of assets under construction since it considers that the engineering cost is recoverable based on the negotiations held with other interested entities in the project. The item Furniture and equipment includes the following amounts in respect of finance leases under which the Group is the lessee: 2007 2006
Capitalised finance lease cost 3.513 2.878 Accumulated depreciation ( 1.903) ( 1.245) Net carrying amount 1.610 1.633 Finance lease agreements entered into by the company mainly relate to the acquisition of computer equipment. At 31 December 2007, the Group owns investments in PPE located abroad for a cost of K€3.591 (2006: K€3.768) and accumulated depreciation of K€2.243 (2006: K€1,400). The Group's policy is to obtain all insurance policies deemed necessary to cover risks that could affect its property, plant and equipment. 7. Goodwill and other intangible assets Set out below is an analysis of Intangible assets showing movements during the year:
Cost Developm. expenses
Assets under
construc. Other fixed
assets Subtotal Goodwil
l Total
Balance at 1 January 2006 8.551 876 5.229 14.656 1.242 15.898 Increases - 9.417 3.462 12.879 - 12.879 Decreases - - - - - - Other movements - - - - - -
Balance at 31 December 2006 8.551 10.293 8.691 27.535 1.242 28.777 Increases - 8.093 1.589 9.682 - 9.682 Decreases - - - - - - Other movements - - - - - -
Balance at 31 December 2007 8.551 18.386 10.280 37.217 1.242 38.459

37
Accumulated amortisation Developm. expenses
Assets under
construc. Other fixed
assets Subtotal Goodwill Total
Balance at 1 January 2006 8.109 - 3.055 11.164 - 11.164 Increases 198 - 2.357 2.555 - 2.555 Decreases - - - - - - Other movements - - - - - -
Balance at 31 December 2006 8.307 - 5.412 13.719 - 13.719 Increases 198 - 1.265 1.463 - 1.463 Decreases - - - - - - Other movements - - - - - -
Balance at 31 December 2007 8.505 - 6.677 15.182 - 15.182
Net balance at 1 January 2006 442 876 2.174 3.492 1.242 4.734
Net balance at 31 December 2006 244 10.293 3.279 13.816 1.242 15.058
Net balance at 31 December 2007 46 18.386 3.603 22.035 1.242 23.277 Capitalised development expenses relate entirely to the cost of projects relating to the zinc technology that has been used to perform Group contracts or has been sold to customers. The capitalised amount refers to the Zincex and New Zinc Electrolysis projects. During the year, the cost of research and development charged to the income statement totalled K€764, as compared with K€808 in 2006 The item Assets under construction relates to the construction cost of certain assets (car parks, sports facilities and other) for which the Group has obtained the operating concession for a specified period. At the end of the concession period, the asset will revert in full to the granting authority. The Group amortises the capitalised asset during the term of the concession. The item Computer software records the ownership and user rights for computer software acquired from third parties. The balance in Computer software does not include amounts linked to the in-house development of computer applications. Goodwill impairment testing Goodwill has been assigned to the cash generating unit (CGU) identified as Eurocontrol, S.A., a Group company in which an indirect 80% interest is held. The cash generating unit identified pertains to the business segment referred to as Other in Note 5 and its operations are located in Spain. At 1 January 2006 an impairment test was performed on goodwill and no loss was recognised. In addition, impairment tests were performed at 31 December 2006 and 31 December 2007 and no impairment losses were recognised. The recoverable amount of the CGU has been determined on the basis of value-in-use calculations. Cash flow projections based on financial budgets approved by Management covering a five-year period and applying a 6% growth rate have been used. This growth rate reflects growth forecasts based on current plans and the market situation. The final value of the CGU has been determined using a constant growth rate. A discount rate of 9.28% has been applied (2006: 9,6%)

38
The Group considers, based on its current knowledge, that expected changes in the key assumptions mentioned above, on which the recoverable amount calculation is based, will not result in carrying amounts for cash generating units exceeding the recoverable amounts. Sensitivity analyses have been performed on the key growth and discount rate assumptions used. Assuming no growth of any kind, the cash-generating unit would not undergo any impairment at a 12% discount rate. 8. Investments in associates
2007 2006
Opening balance 6.044 11.506 Additions 561 476 Disposals ( 320) ( 6.402) Share in profits 571 464 Closing balance 6.856 6.044
Investments in associates at 31 December 2007 include goodwill totalling K€900 (2006: K€411). During the year there have been no events or circumstances that could indicate a possible impairment of goodwill and no losses in this respect have been recorded. The increases during the year correspond to newly created companies. The date of presentation of the financial statements of all the associates coincides with the presentation date of the parent company's financial statements. The Group's shareholdings in its main associates, none of which are listed on a stock market, are as follows:
Name Country of origin Assets Liabilities %
shareholding
2006 Empresarios Agrupados, A.I.E. Spain 5.476 4.726 42,48% Empresarios Agrupados Internacional, S.A. Spain 8.252 4.356 42,48% Layar Castilla, S.A. Spain 3.245 359 25,39% Ibérica del Espacio, S.A. Spain 3.992 2.476 20,71% Productora de Diesel ,S.A. Chile 79.565 72.038 27,50% Green Fuel Corporación, S.A. Spain 1.235 665 20,93%
2007 Empresarios Agrupados, A.I.E. Spain 5.982 5.232 42,48% Empresarios Agrupados Internacional, S.A. Spain 16.940 12.493 42,48% Layar Castilla, S.A. Spain 3.315 522 25,39% Ibérica del Espacio, S.A. Spain 4.522 3.359 20,71% Productora de Diesel ,S.A. Chile 67.673 60.138 27,50% Green Fuel Aragón, S.A. Spain 2.038 89 20,84% Green Fuel Internacional S.A. Spain 1.645 12 26,00% Green Fuel Corporación, S.A. Spain 2.259 1.123 20,93%

39
Name Country of origin Revenues
Profit /loss
% shareholding
2006 Empresarios Agrupados, A.I.E. Spain 10.866 - 42,48% Empresarios Agrupados Internacional, S.A. Spain 13.810 293 42,48% Layar Castilla, S.A. Spain 577 (104) 25,39% Ibérica del Espacio, S.A. Spain 4.300 (213) 20,71% Productora de Diesel ,S.A. Chile 2.082 1.482 27,50% Green Fuel Corporación, S.A. Spain 471 24 20,93%
2007 Empresarios Agrupados, A.I.E. Spain 17.664 - 42,48% Empresarios Agrupados Internacional, S.A. Spain 24.008 550 42,48% Layar Castilla, S.A. Spain 3.892 ( 412) 20,71% Ibérica del Espacio, S.A. Spain 7.198 1.628 27,50% Productora de Diesel ,S.A. Chile 924 41 20,93% Green Fuel Aragón, S.A. Spain 56 ( 142) 20,84% Green Fuel Internacional S.A. Spain 19 ( 470) 26,00% Green Fuel Corporación, S.A. Spain 368 ( 93) 25,39%
9. Available-for-sale financial assets Set out below are movements in this caption:
At 1 January 2006 687 Additions 1.426 Disposals - At 31 December 2006 2.113 Additions 1.608 Disposals ( 350) At 31 December 2007 3.371 Less: Non-current portion 3.371 Current portion -
The balance in available-for-sale financial assets consists mainly of the investment of K€2.319 in Energía Concon, S.A. (in which the Group has a 17% interest), acquired by the Group in June 2006, additional contributions of K€ 919 having been made in 2007. The investment is carried at fair value as the transaction involved independent parties and was completed close to the balance sheet date. The rest of the balance relates to minor investments in unlisted companies in which the Group does not have significant influence. Due to the fact that these are residual investments in companies that are not significant to the Group and as valuation methods cannot be applied, the investments are presented at acquisition cost. In 2007 and 2006 no provisions were made for impairment losses affecting available-for-sale financial assets.

40
10. Derivative financial instruments The balances relating to derivative financial instruments at year-end 2007 and 2006 are as follows:
2007 2006
Assets Liabilities Assets Liabilities
Foreign exchange forwards – cash flow hedges 17.564 35 10.514 1.371
Foreign exchange forwards – held for trading - - - 74
Total 17.564 35 10.514 1.445 Less non-current portion: Foreign exchange forwards – cash flow hedges 797 35 426 - Current portion 16.767 - 10.088 1.445
Set out below is a breakdown of maturity dates for the contracts in force at 31 December 2007 and 2006 are as follows:
2007 2008 2009 2010 Total fair value
Total 2007 assets - 16.767 797 - 17.564
Total 2007 liabilities - - 35 - 35
Total 2006 assets 10.088 426 - - 10.514
Total 2006 liabilities 1.445 - - - 1.445
The notional principal of foreign exchange forward contracts, mainly hedging the sale of US dollars against the purchase of euros (net of US dollar purchases against euro sales) outstanding at 31 December 2007 totalled was KUSD287.678 (2006: KUSD414,759). Gains and losses cumulative in equity due to foreign exchange forward contracts at 31 December 2007 totalled K€19,032 (2006: K€9,106) and are recognised in the income statement in the period or periods in which the hedged transaction affects the income statement. 11. Trade and other receivables Set out below is an analysis of this caption at year-end 2007 and 2006:
2007 2006
Trade receivables 855.625 643.726 Less: Provision for impairment of receivables ( 4.288) ( 4.087) Trade receivables – Net 851.337 639.639 Other accounts receivable 12.942 5.513 Prepayments 21.166 38.802 Other items 26.431 34.480 Total 911.876 718.434
The Trade receivables account includes K€533,415 (2006: K€365,624) relating to work executed pending certification, which is calculated as described in Note 2.19.

41
There is no significant effect on the fair values of trade and other receivables. Nominal values are considered to approximate fair values. The Group has recognised a loss of K€420 due to the impairment of its trade receivables during the year ended 31 December 2007 (2006: K€1,000). Movements in the provision for impairment of trade receivables are as follows: 2007 2006
Opening balance 4.087 4.003 Appropriations for the year 420 1.000 Applications ( 219) ( 916) Closing balance 4.288 4.087
The carrying amounts of trade receivables, excluding the portion pertaining to work executed pending certification, are denominated in the following currencies:
2007 2006
Euro 220.179 210.256 USD 26.209 50.575 Other currencies 75.822 17.271 Subtotal 322.210 278.102 Work executed pending certification 533.415 365.624 Total 855.625 643.726
The total amount of the costs incurred and profits recognised (less recognised losses) for all current contracts at the balance sheet date was K€3.828.286 (2006: K€3,005,710) and K€364.467 (2006: K€302,940), respectively. 12. Inventories A breakdown of inventory balances is as follows:
2007 2006
Current construction projects 6.770 5.568 Bid presentation costs 5.573 2.394 Materials 4.006 9.889
16.349 17.851 The item Current construction projects records the cost of developing a number of assets (mainly car parks), as described in Note 7, in respect of the portions held for sale. Given their characteristics, a significant portion of these assets have a realisation period of over 12 months.

42
13. Receivables and other assets
2007 2006
Non-current receivables and other assets Loans to employees 592 529 Deposits and guarantees 2.555 1.502 3.147 2.031 Current receivables and other assets Loans to partners in UTEs and joint ventures 7.695 880 Interest 398 138 Short-term guarantee deposits 409 342 Short-term deposits 73 85 Others 3.742 893 12.317 2.338
Others includes expenses paid in advance (insurance premiums, licences, maintenance costs, and others) 14. Financial assets at fair value through profit or loss Set out below is an analysis of this caption showing movements:
2007 2006
Opening balance 21.556 57.266 Net additions and (disposals) ( 3.820) ( 35.710) Closing balance 17.736 21.556
Listed securities:
- Investments in short-term fixed income securities - - - Investments in short-term equity securities 17.736 21.556 17.736 21.556
All financial assets are considered to be held for trading. Other financial assets at fair value through profit and loss are presented in the section on operating activities as part of changes in working capital in the consolidated cash flow statement. Changes in the fair value of other financial assets at fair value through profit and loss are recorded under net financial results in the income statement. (See Note 28) Financial assets at fair value through profit and loss represent investments in listed equities (Principally investments in León Valores, SICAV) and their fair value at 31 December 2007 has been determined by reference to the year-end market price. 15. Cash and cash equivalents
2007 2006
Cash and banks 268.668 225.576 Short-term bank deposits and other cash equivalents 193.379 121.008 462.047 346.584

43
This caption includes cash (cash in hand and demand bank deposits) and cash equivalents (short-term highly-liquid investments easily convertible into specific amounts of cash within a maximum of three months, the value of which is not subject to significant risks). The effective interest rate on short-term bank deposits was between 4% (euro deposits) and 4.60% (US-dollar deposits) (2006: 3.10% and 4.90%, respectively) and the average maturity period was 10 days. Of the total balance of Cash and cash equivalents at 31 December 2007 K€139,720, (2006: K€152,947) relates to balances recorded by the joint ventures and UTEs consolidated, as indicated in Exhibits III and IV, respectively. For the purposes of the cash flow statement, the cash balance includes the cash and cash equivalents balance. 16. Share capital
No. of shares
Ordinary shares
Share premium account
Total
Balance at 1 January 2006 931.600 5.590 8.691 14.281
Other movements 54.964.400 - - -
Balance at 31 December 2006 55.896.000 5.590 8.691 14.281
Other movements - - - -
Balance at 31 December 2007 55.896.000 5.590 8.691 14.281 On 10 May 2006, the shareholders of Técnicas Reunidas, S.A. resolved to reduce the par value of the shares from six euros per share to 0.10 euros per share and to simultaneously increase the number of outstanding shares from 931,600 shares to 55,896,000 shares by splitting each old share valued at six euros into 60 new shares valued at 0.10 euros each, without altering total share capital. The new shares are ordinary shares and carry the same rights as the old shares. Following this change, the total number of authorised ordinary shares is 55,896,000, each having a par value of 0.10 euros. All issued shares are fully paid up. There are no restrictions on the transfer of the shares. During 2006, the Spanish National Securities Market Commission (CNMV) authorised the public offering of a part of the shares in Técnicas Reunidas, S.A. and also admitted the shares to listing in the Madrid, Barcelona, Bilbao and Valencia Stock Exchanges, also including the shares in the Continuous Market, commencing on 21 June 2006. The share capital of Tecnicas Reunidas, S.A. is represented as follows:
2007 2006
Shareholder No. of shares % interest No. of
shares % interest
Aragonesas Promoción de Obras y Construcciones, S.L. 2.848.383 5,10% 2.848.383 5,10% Araltec, S.L. 21.795.284 38,99% 21.795.284 38,99% Banco Industrial de Bilbao 2.969.242 5,31% 2.969.242 5,31% Bilbao Vizcaya Holding 1.656.885 2,96% 2.690.033 4,81% BBVA Elcano Empresarial, SCR, S.A. 2.124.048 3,80% 2.124.048 3,80% BBVA Elcano Empresarial II, SCR, S.A. 2.124.048 3,80% 2.124.048 3,80% Rest of shareholders (including free float in 2007) 22.378.110 40,04% 21.344.962 38,19%
TOTAL 55.896.000 100,00% 55.896.000 100,00%

44
17. Other reserves The total balance of K€1,137 relates to the legal reserve. This reserve, which is fully paid, may not be distributed to shareholders and may only be used to offset losses should no other sufficient reserves be available. It may also be used to increase share capital under certain situations. 18. Cumulative translation difference
Total
1 January 2006 ( 545) Translation differences: – Group and associates 959 31 December 2006 414 Translation differences: – Group and associates ( 3.319) 31 December 2007 ( 2.905)
A breakdown of the cumulative translation difference by company / subgroup at year-end 2007 and 2006 is as follows:
2007 2006
Company or subgroup Damietta LNG Construction ( 565) ( 486) Técnicas Reunidas Metalúrgicas, S.A. 554 118 Técnicas Reunidas Gulf Ltd. ( 1.115) 139 Técnicas Reunidas Omán LLC ( 473) 705 Técnicas Reunidas Engineering LLC ( 139) (129) Technip Consortium (TPC) (*) ( 1.117) - Others (50) 67 Total ( 2.905) 414
(*) Corresponds to a consortium that is part of Técnicas Reunidas.

45
19. Retained earnings and minority interests A breakdown of retained earnings and minority interests at 31 December 2007 and 2006 is as follows:
Company 2007 2006
Técnicas Reunidas, S. A. 80.459 90.591
Técnicas Reunidas Internacional, S. A. 4.196 3.664
Técnicas Reunidas Ecología, S. A. 1.600 1.872
Técnicas Reunidas Gulf Ltd. 4.216 ( 14.080)
Grupo Layar 9.339 8.927
Initec Plantas Industriales, S.A. 104.482 51.030
Initec Infraestructuras, S.A. 4.862 4.476
Initec Chile, S.A. 3.503 1.558
Other companies 7.638 3.351
Retained earnings 220.295 151.389 There are no restrictions on the availability of the retained earnings. The only restrictions affect the legal reserve, as described in Note 17. Each consolidated company’s contribution to consolidated results attributable to the parent company is shown below:
Company 2007 2006
Técnicas Reunidas, S. A. 26.219 50.391
Técnicas Reunidas Internacional, S. A. 532 2.980
Técnicas Reunidas Ecología, S. A. ( 96) 1.577
Técnicas Reunidas Gulf Ltd. 18.774 ( 14.109)
Grupo Layar 1.253 5.788
Initec Plantas Industriales, S.A. 53.331 19.031
Initec Chile, S.A. 1.631 1.092
Other companies 3.036 4.483
Profit attributed to the parent company 104.680 71.233 The proposal for the distribution of the parent company’s 2007 profit that will be presented to the Annual General Meeting and the approved distribution for 2006 is as follows:
2007 2006
Available for distribution Profit for the year 61.068 60.933 61.068 60.933 Distribution Retained earnings 7.129 25.159 Dividends 53.939 35.774
61.068 60.933

46
The item Dividends is analysed below: - 2006: Dividends totalling K€35,774 break down as follows:
o K€16,769 approved as an interim dividend by the General Meeting held on 15 December 2006 and paid on 24 January 2007.
o 19,005 thousand euros approved by the Shareholders Meeting on 26 July 2007.
- Year 2007: The dividends of 53,939 thousand euros consists of the following: o 25,074 thousand euros approved as an advance on Dividends by the Board of Directors on
14 December 2007 and paid on 22 January 2008 (it should be noted that this figure is lower than the dividend originally approved because of the effect of the treasury share portfolio on the payment date).
o 28,865 thousand euros proposed for approval of the Shareholders Meeting when approving the annual accounts for the year 2007.
The following are the provisional accounting and treasury statements on the date of the declaration of the advance on Dividends in the years 2007 and 2006, already mentioned:
2007 2006
Estimated profit for the year 60.200 56.000 Estimated income tax (1.200) 3.900 Maximum possible pay-out 59.000 59.900 Proposed pay-out 25.153 16.769 Surplus 33.847 43.131 Cash prior to pay-out 266.870 145.000 Amount of interim dividend 25.153 16.769 Cash surplus 241.717 128.231
Movements in minority interests in 2007 and 2006 are analysed below
1 January 2006
Increases Other 31 December 2006
Increases Other 31 December 2007
Eurocontrol, S.A. 1.462 116 ( 67) 1.511 196 ( 20) 1.687
Pegasides, SICAV de SA
4 - - 4 - (4) -
Termotécnica, S.A. 1 - - 1 - - 1
ReciclAguilar, S.A. ( 21) ( 15) 33 ( 3) ( 15) 12 ( 6)
TR Gulf Ltd. 82 - ( 82) - - - -
TR Engineering LLC 603 273 ( 82) 794 408 ( 217) 985
TR Oman LLC - 11 301 312 2.605 ( 414) 2.503
Total 2.131 385 103 2.619 3.194 (643) 5.170

47
20. Trade and other payables a) Trade payables are analysed below:
2007 2006
Suppliers 851.330 593.662 Prepayments received for contracted work 279.894 288.766 Other 3.369 832 1.134.593 883.260
b) Other payables are set out below:
2007 2006
Non-current Finance lease liabilities 649 815 Other items 1.366 255 2.015 1.070 Current Finance lease liabilities 961 818 Dividends pending payment 25.153 16.769 Other items 1.618 4.961 27.732 22.548
Non-current finance lease liabilities have the following maturities:
2007 2006
Between 1 and 2 years 500 639 Between 2 and 5 years 149 176 More than 5 years - - 649 815
The above amounts represent minimum lease payments discounted to their present value. Future financial charges under finance leases total K€141 (2006: K€145). The Group’s finance leases relate to acquisitions of computer equipment and other property, plant and equipment.

48
21. Borrowings
2007 2006
Non-current Bank borrowings 11.919 2.024 11.919 2.024 Current Bank borrowings 46.105 48.308 46.105 48.308 Total borrowings 58.024 50.332
Average effective interest rates (all variable) at the balance sheet date are as follows:
2007 2006
Euro US dollar Euro US dollar
Bank borrowings 4,5% 5,5% 3,6% 6% The carrying amount of borrowings (both current and non-current) approximates their fair value. The debts are referenced principally to the Euribor and the Libor, with revision periods up to 6 months. The carrying amount of the Group’s borrowings is denominated in the following currencies:
2007 2006
Euros 26.043 20.147 US dollars and other currencies 31.981 30.185 58.024 50.332
At 31 December 2006, as security for borrowings totalling K€32,230, the Group had pledged all its shares in the subsidiary Pegasides SICAV, S.A. The net assets contributed by that company at 31 December 2006 totalled K€36,132. This guaranteed operation was cancelled in 2007. The Group has the following unused credit lines:
Variable rate: 2007 2006
– maturing in less than one year 147.296 69.754 – maturing in more than one year 18.941 44.223 166.237 113.977

49
22. Employee benefits At 31 December 2007, the Group recognises obligations with its employees in respect of pensions, retirement benefits and non-current remuneration. Pension and retirement obligations refer to commitments set out in the Collective Bargaining Agreement of certain Group companies, relating to retirement awards for employees that have worked for the number of years stipulated in the agreement at the date of retirement. Non-current remuneration obligations refer to length-of-service awards payable by certain Group companies. At 31 December 2007 there are no assets linked to the defined benefit commitments with employees.
2007 2006
Commitments in the balance sheet in respect of: Pension and retirement benefits 4.214 3.769 Non-current remuneration obligations 240 230 4.454 3.999 Charges in the income statement in respect of: Pension and retirement benefits 677 537 Non-current remuneration obligations 26 ( 40) 703 497
Pension and retirement benefits The amounts recognised in the balance sheet have been calculated as follows:
2007 2006
Present value of the obligations at 1 January 3.769 3.438 Cost of the services for the current year 436 279 Interest expense 169 144 Benefits paid and expenses ( 232) ( 206) Actuarial gains/(losses) ( 72) ( 114) Liability in the balance sheet 4.214 3.769
Movements in the liability recognised in the balance sheet are as follows:
2007 2006
Opening balance 3.769 3.438 Expense charged to the income statement (Note 26) 677 537 Contributions paid ( 232) ( 206) Closing balance 4.214 3.769
The principal actuarial assumptions used are as follows:
2007 2006 Annual discount rate 5,50% 4,60% Annual salary growth 4,00% 4,00% Annual inflation 2,50% 2,50%
Mortality PERM/F 2000 Producción
PERM/F 2000 Producción
Retirement age 65 años 65 años

50
The amounts recognised in the income statement are as follows:
2007 2006
Cost of current services 436 279 Interest expense 169 144 Actuarial gains/(losses) ( 72) ( 114) Total included in staff costs (Note 26) 677 537
Non-current remuneration obligations The amounts recognised in the balance sheet have been calculated as follows:
2007 2006
Present value of the obligations at 1 January 230 292 Cost of the services for the current year 32 29 Interest expense 11 12 Benefits paid and expenses ( 16) ( 22) Actuarial gains/(losses) 17 81 Liability in the balance sheet 240 230
Movements in the liability recognised in the balance sheet are as follows:
2007 2006
Opening balance 230 292 Expense charged to the income statement (Note 26) 26 ( 40) Contributions paid ( 16) ( 22) Closing balance 240 230
The amounts recognised in the income statement are as follows:
2007 2006
Cost of current services 32 29 Interest expense 11 12 Actuarial gains/(losses) 17 81 Total included in staff costs (Note 26) 26 ( 40)
The actuarial assumptions for this commitment are the same as those used for pension and retirement commitments as they have similar compliance conditions.

51
23. Provisions for liabilities and charges a) Provisions for liabilities and charges – Non-current portion
ITEM
Provision for estimated
project losses
Provision for project
completion Other
provisions
Total provisions
for liabilities and charges
Balance at 1.1.2006 1.586 37.041 6.611 45.238 Reversals - 5.323 4 5.327 Applications 1.586 14.316 6.607 22.509 Appropriations for the year - 4.114 1.610 5.724
Balance at 31.12.2006 - 21.516 1.610 23.126 Reversals - 1.462 360 1.822 Applications - 903 - 903 Appropriations for the year - 2.193 2.537 4.730
Balance at 31.12.2007 - 21.344 3.787 25.131 Provision for estimated project losses: In compliance with IAS 11, the Group sets up provisions for estimated future losses on projects currently in progress. Provision for project completion: For projects that are completed or substantially completed and, therefore, are in the warranty period or are close to entering the warranty period, the Group estimates probable costs that will be incurred during the warranty period and makes the relevant provision. The provisions recognised by the Group at year-end 2007 and 2006 relate to the following projects: Project 2007 2006 Project 1640 – C1 Chemical Complex Basf - 2.500 Project 8214 – Ourhoud field development - 1.710 Project 8211 – Terminal GNL – Bilbao Harbour - 1.662 Project Damietta - Segas 2.834 3.733 Project 1690 – DHT Complex – Yanbu Refi. Pro. 2.000 3.369 Project 1660 – Diesel/Kerosene Hydrop. 1.014 3.567 Project 1630 – EO/EG Plant Nanhai 400 1.000 Project 1770/8394 – Ing. Paquete IV and V Minatitlan refinery 3.000 - Project 03050 – Biodiesel plant 2.500 - Project 7340 – C.T.C.C. Plana del Vent 1.200 - Project 01730 – DHP-CCR Project Tupras 1.800 Project 8396 – Gas Plant Expansion Ju'aymah 1.500 - Project 7350 – As Pontes 800 - Project 8380 – Unidad Hidrotrat. Diesel HDT 500 - Tanques GNL - Cartagena 3 370 - Other projects 3.426 3.975
Total 21.344 21.516

52
Other provisions: This item relates to provisions for other liabilities and charges, including commitments to pay project partners, provisions for probable risks and provisions for other non-current payments. b) Provisions for liabilities and charges – Current portion Balance at 1 January 2006 5.021 Reversals 1.598 Applications - Appropriations for the year 6.823 Balance at 31 December 2006 10.246 Reversals 6.300 Applications - Appropriations for the year 122 Balance at 31 December 2007 4.068 24. Ordinary revenues
2007 2006
Construction and engineering contract revenues 2.005.046 1.233.805 Services rendered 130 723 Total ordinary revenues 2.005.176 1.234.528
Note 5 presents the main business and geographical segments in which the Group operates. 25. Other operating expenses and revenues
2007 2006
Other operating expenses Services 210.188 126.659 Independent professional services 32.585 52.152 Repairs and maintenance 5.152 4.260 Banking and similar services 4.295 4.151 Transport expenses 3.017 4.645 Insurance premiums 4.033 3.586 Supplies 2.341 1.684 Other 5.586 8.050
267.197 205.187 Other operating revenues Operating grants 402 433 Other 1.922 1.922
2.324 2.355 The item Other in Other operating expenses relates mainly to appropriations to and reversals of provisions for non-current and current liabilities and charges.
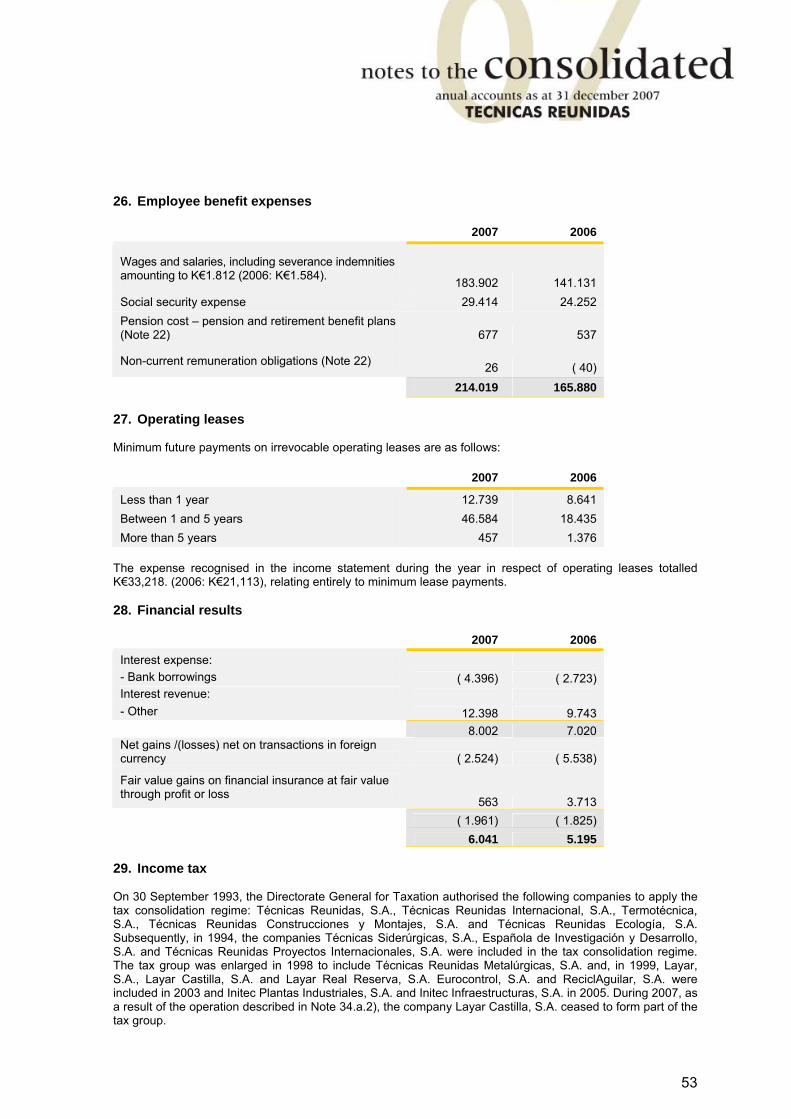
53
26. Employee benefit expenses
2007 2006
Wages and salaries, including severance indemnities amounting to K€1.812 (2006: K€1.584). 183.902 141.131 Social security expense 29.414 24.252 Pension cost – pension and retirement benefit plans (Note 22) 677 537
Non-current remuneration obligations (Note 22) 26 ( 40) 214.019 165.880
27. Operating leases Minimum future payments on irrevocable operating leases are as follows:
2007 2006
Less than 1 year 12.739 8.641 Between 1 and 5 years 46.584 18.435 More than 5 years 457 1.376
The expense recognised in the income statement during the year in respect of operating leases totalled K€33,218. (2006: K€21,113), relating entirely to minimum lease payments. 28. Financial results
2007 2006 Interest expense: - Bank borrowings ( 4.396) ( 2.723) Interest revenue: - Other 12.398 9.743 8.002 7.020 Net gains /(losses) net on transactions in foreign currency ( 2.524) ( 5.538)
Fair value gains on financial insurance at fair value through profit or loss
563 3.713 ( 1.961) ( 1.825) 6.041 5.195
29. Income tax On 30 September 1993, the Directorate General for Taxation authorised the following companies to apply the tax consolidation regime: Técnicas Reunidas, S.A., Técnicas Reunidas Internacional, S.A., Termotécnica, S.A., Técnicas Reunidas Construcciones y Montajes, S.A. and Técnicas Reunidas Ecología, S.A. Subsequently, in 1994, the companies Técnicas Siderúrgicas, S.A., Española de Investigación y Desarrollo, S.A. and Técnicas Reunidas Proyectos Internacionales, S.A. were included in the tax consolidation regime. The tax group was enlarged in 1998 to include Técnicas Reunidas Metalúrgicas, S.A. and, in 1999, Layar, S.A., Layar Castilla, S.A. and Layar Real Reserva, S.A. Eurocontrol, S.A. and ReciclAguilar, S.A. were included in 2003 and Initec Plantas Industriales, S.A. and Initec Infraestructuras, S.A. in 2005. During 2007, as a result of the operation described in Note 34.a.2), the company Layar Castilla, S.A. ceased to form part of the tax group.

54
2007 2006
Current income tax 1.478 6.100 Deferred tax 5.246 868 6.724 6.968
No deferred taxes generated by transactions have been directly charged or credited to equity. The income tax on the Group’s pre-tax profit differs from the theoretical amount that would have been obtained had the tax rate applicable to the consolidated companies’ profits been applied, as shown below
2007 2006
Profit before taxes 114.598 78.586 Tax calculated at the tax rate applicable to the parent company’s profits 37.244 27.505 Tax-free results ( 27.369) (18.780) Non-tax deductible expenses 114 78 Effect of differences in foreign tax rates ( 1.730) 955 Deductions generated ( 1.873) (3.020) Other (net) 338 230 Tax expense 6.724 6.968
The effective tax rate was 5.87% (8.87% in 2006), due mainly to the Group's foreign revenues, which are exempt from Spanish income tax in accordance with Law 18/1982 (26 May) on the Tax System for Groupings and UTEs, and for Regional Industrial Development Companies. These revenues are included in the item Tax-free results in the above table and were generated mainly by UTEs engaged in export activities (see Exhibit IV). The item “Other (net)” includes the effect generated in 2007 on deferred taxes by the change in the income tax rate from 35% existing in 2006 to 32,5% in 2007 and 30% in 2008. Deferred tax assets and liabilities
2007 2006
Deferred tax assets - to be offset after more than 12 months 19.578 18.384 - to be offset in less than 12 months - - 19.578 18.384 Deferred tax liabilities - to be offset after more than 12 months ( 3.820) ( 659) - to be offset in less than 12 months - - ( 3.820) ( 659)

55
Movements in deferred tax assets and liabilities are as follows: Asset Liability
At 31 January 2006 24.020 ( 258) Reversals ( 15.427) - Appropriations for the year 9.590 ( 401) Other movements 201 - At 31 December 2006 18.384 ( 659) Reversals ( 4.695) 109 Appropriations for the year 5.022 ( 3.270) Other movements 867 - At 31 December 2007 19.578 ( 3.820)
Deferred tax assets and liabilities are analysed below: 2007 2006
Tax credits for tax-loss carryforwards 1.406 - Tax credits for deductions pending application 4.672 2.799 Tax credits arising from temporary differences: - Provisions for liabilities and charges 7.338 6.958 - Change in current assets 2.734 2.855 - Change in non-current assets 2.609 1.076 - Other items 819 4.696 19.578 18.384 2007 2006 Grants ( 207) ( 316) Other items ( 3.613) ( 343) ( 3.820) ( 659)
Assets related to deferred taxes due to negative taxable bases pending compensation are recognised to the extent that it is probable the corresponding tax benefit will be materialised through future tax benefits. The Group continues to recognise assets through deferred taxes amounting to K€1,406 referring to losses of K€6,862 to be compensated in future years against tax benefits. A breakdown of taxable bases by the year in which the occurred is as follows:
Year Base659 Amount Usable
until 258
2005 340 102 2,020 2006 6.522 1.304 *
6.862 1.406 *The negative taxable bases correspond to foreign companies which, according to current tax regulations, have no limit on the time within which they can be applied.

56
At 31 December 2007 the Group records deductions pending application totalling K€7,015 (2006: K€5,922). These deductions mainly derive from reinvestment, research and development expenses and exports. At 31 December 2007, the Group recognised an asset of K€4,672 of the above-mentioned total; the Group did not recognise any asset in respect of the remaining amount as it was unable to guarantee the future offset of that amount. The tax Group is open to tax inspections for the years from 2003 to 2007 for Corporate Income Tax and for the years 2004 to 2007 for all the other taxes to which it is subject. As a result, among others, of possible different interpretations of current tax legislation, additional liabilities could arise as the result of an inspection. In any case, the administrators believe that these liabilities, should they arise, would not significantly affect the annual accounts. 30. Earnings per share Basic and diluted Basic earnings per share are calculated by dividing the profit attributable to the Company’s shareholders by the weighted average number of ordinary shares in the year, excluding treasury shares acquired by the Company. Diluted earnings per share are calculated by adjusting the weighted average number of ordinary shares to reflect the conversion of all ordinary shares that may potentially be diluted. Given that the Company does not own any class of ordinary shares that may be diluted, the diluted earnings per share coincide with the basic earnings per share. As mentioned in Note 16, during the year 2006 when the Company changed the par value of its outstanding shares, the number of shares also changed, from 931,600 ordinary shares to 55,896,000 ordinary shares. For the sake of comparability, earnings per shares have been calculated taking into account both numbers, as follows:
2007 2006 2007 2006
Profit attributable to the company’s equity holders 104.680 71.233 104.680 71.233 Weighted average number of ordinary shares outstanding 55.896.000 55.896.000 931.600 931.600
Basic earnings per share (euro per share) 1,87 1,27 112,37 76,46 31. Dividends per share During 2006 dividends were paid out of 2005 profits in the amount of K€24,000 (of which K€12,000 had been declared as an interim dividend in 2005), representing a dividend per share of 25.76 euros (based on 931,600 shares, or 0.43 euros based on 55,896,000 shares). The above-mentioned dividends do not include an extraordinary dividend of K€48,000 paid in 2006. The dividends distributed during the year 2007 corresponding to the profits of 2006 were 35,744 thousand euros (of which 16,769 thousand euros had been declared as advances on dividends during 2006), which correspond to a dividend per share of 38,40 euros (taking 931,600 shares into account) or 0.64 euros considering 55,896,000 shares) The dividend to be submitted to the Annual General Meeting that will approve these consolidated annual accounts during 2007 is K€53.939 (of which K€25.074 was declared in 2007 as an interim dividend), entailing a dividend per share of 57,60 euros (based on 931,600 shares, or 0.96 euros based on 55,896,000 shares). This equivalence per share will be modified on the basis of the treasury share portfolio on the Dividend payment date.

57
32. Contingencies and guarantees furnished The Group has contingent liabilities relating to bank and other guarantees that arose during the ordinary course of business. No significant liability is expected to arise besides the situations for which provision was made as explained in Note 23. In the ordinary course of the Group's activities, as is common practice with engineering and construction companies, guarantees provided to third parties totalled K€1.072.564 (2006: K€522.440), as security for the performance of contracts. In accordance with the general terms of contracting, the parent company and Group companies are required to provide technical guarantees for the execution of work, in cash or in the form of bank guarantees, which must remain in force for a specified period. 33. Commitments Commitments to purchase non-current assets There are no significant investment commitments relating to the purchase of non-current assets at the balance sheet date. Operating lease commitments The Group rents several premises under irrevocable operating lease agreements. These leases have variable terms, segment clauses and renewal rights. The Group is required to provide six months’ prior notice of the termination of these agreements. 34. Related-party transactions Transactions with related parties in 2007 and 2006 arose in the ordinary course of business. These transactions with related parties are described below: a) Transactions with the parent company's principal shareholders a.1) Transactions with Banco Bilbao Vizcaya Argentaria Group (BBVA Group): The Group carries out transactions with the BBVA Group only with respect to its banking activities. Set out below are details of these transactions at 31 December 2007 and 2006:
2007 2006
Credit facilities 30.108 28.093Balances utilised 6.587 6.512Guarantees furnished 264.756 147.982Letter of credit facilities 10.000 10.000
The Group has opened numerous bank accounts that are necessary to carry out its ordinary business and manages a portion of its cash balances by contracting financial assets through the BBVA Group. The Group had contracted forward currency transactions with the BBVA Group, the notional values of which totalled 56.364 thousand of US dollars (2006: 46.523 thousand US dollars). The income statement for each period includes the costs and revenues related to the above-mentioned transactions, which were carried out at arm’s length.

58
a.2) Transactions with Aragonesas Promoción de Obras y Construcciones, S.L. During 2006 the parent company reached an agreement with Aragonesas Promoción de Obras y Construcciones, S.L. to sell 74.61% of the company Layar Castilla, S.A., reducing this shareholding to 25.39% at 31 December 2006. The transaction was completed at the fair value of the shareholding, based on independent expert valuations, generating a gain of K€13,034 before tax, as recognised in 2006. As the shareholding in Layar Castilla, S.A. decreased from 100% in 2005 to 25.39% in 2006, this company was reclassified from a subsidiary to an associate during the year 2006 (see Exhibit II). b) Transactions with company Board Directors and executives Set out below is an analysis of transactions effected with companies in which the parent company’s Board Directors are also directors or administrators:
2007 2006
Trade receiv.
Trade payables
Purch. Sales Trade receiv.
Trade payables
Purch. Sales
Grupo CEPSA 5.148 - 7 13.329 822 - 2 5.695 Air Liquide - - - - - - - - Tubos Reunidos - - - - - 453 809 - Schneider - - - - - - 12 - C-60 17 - - 101 22 - - 82
Note 39 provides details of remuneration paid to the Board Directors of Técnicas Reunidas, S.A. During 2007, remuneration paid to company executives in respect of fixed and variable salaries totalled K€3,701 (2006: K€3.123). c) Transactions with associates included in Exhibit II Set out below is a breakdown of balances and transactions with the associates included in Exhibit II:
2007 2006
Trade receiv.
Trade payables
Purch. Sales Trade receiv.
Trade payables
Purch. Sales
Empresarios Agrupados, A.I.E. 1.471 32 4.274 3.187 - - - -
E.A. Internacional, S.A. 1.693 - 1.382 7.579 - - - -
Ibérica del Espacio, S.A. 327 9 5 190 - - - -
Layar Castilla, S.A. 30 494 20 - - - -
Green Fuel Corp., S.A. - - - 4 - - - -

59
35. Joint ventures The Group has interests in the joint ventures listed in Exhibit III. The amounts set out below represent the Group's percentage interest in the assets, liabilities, revenues and profits of the joint ventures. These amounts have been included in the consolidated balance sheet and income statement (before consolidation eliminations):
Assets: 2007 2006 Non-current assets 479 639 Current assets 68.726 46.647
69.205 47.286 Liabilities: Non-current liabilities 2.892 3.738 Current liabilities 64.674 38.264
67.566 42.002 Net assets 1.639 5.284 Revenues 108.307 72.998 Expenses 111.071 72.848 Profit after taxes ( 2.764) 150
There are no contingent liabilities corresponding to the Groups participation in joint ventures, nor contingent liabilities in the joint ventures themselves. 36. Temporary joint ventures (UTEs) The Group has interests in the UTEs listed in Exhibit IV. The amounts set out below represent the Group's percentage interest in the assets, liabilities, revenues and profits of the UTEs. These amounts have been included in the consolidated balance sheet and income statement (before consolidation eliminations):
Assets: 2007 2006
Non-current assets 18.505 - Current assets 1.042.026 445.672
1.060.531 445.672 Liabilities: Non-current liabilities 12.198 - Current liabilities 823.018 380.763
835.216 380.763 Net assets 225.315 64.909 Revenues 1.100.456 708.085 Expenses 1.033.802 643.176 Profit after taxes 66.654 64.909
There are no contingent liabilities corresponding to participation by the Group in UTEs, nor contingent liabilities in the UTEs themselves.

60
37. Environment Given the activity in which the Group companies are involved, it has no environmental liabilities, expenses, assets, provisions or contingencies that could be significant in relation to its equity, financial situation and results. For this reason, no specific breakdown of environmental information is provided in these notes to the annual accounts. 38. Events after the balance sheet date The Board of Directors meeting held on 14 December 2007, supported by the authorisation granted by the General Meeting and in the statutory regulations, approved an action strategy on the securities market with the aim of favouring liquidity and holding the stock quotation steady, whereby it signed a contract with an investment services company, acting in line with the regulations of the National Securities Market Commission. Additionally, it agreed to limit the maximum number of treasury shares that the company could carry in portfolio to 5% of the share capital. As a result, on 14 January 2008 the company signed a contract in which it named Merryl Lynch as agent to operate on the securities market, empowering it to dispose of and acquire in the Company’s name, its own shares, in the terms and conditions foreseen in the contract, during the validity period of this. Merryl Lynch can intermediate operations directly as a stock market member, or through other members, and is responsible to the Company in all cases for the actions of these third party members. On the date of the accounts, the treasury portfolio of own shares amounted to approximately 1% of the company’s share capital. 39. Other information a) Average number of Group employees by category 2007 2006
Category: Engineers and university graduates 2.030 1.265 Technical engineers, experts and graduate assistants 750 533 Administrative managers 794 425 Unqualified assistants 485 340 Other categories 353 441 TOTAL 4.412 3.004 b) Average number of Group employees by sex in the year 2007 Men Women
Category:
Engineers and university graduates 1.258 772 Technical engineers, experts and graduate assistants 608 142 Administrative managers 667 127 Unqualified assistants 116 369 Other categories 332 21 TOTAL 2.981 1.431
61
c) Audit fees The fees accrued in 2007 to PricewaterhouseCoopers Auditores, S.L. for audit and other services totalled K€344. In addition, fees accrued in 2007 for other services rendered to the Group by other companies that use the PricewaterhouseCoopers trademark totalled K€178. d) Information required by Article 127 ter of the Spanish Companies Act The Directors of the parent company have no disclosures to make with respect to the content of Article 127 ter of the Spanish Companies Act, except for the following: - Mr Juan Lladó Arburúa is a Board Director or Administrator of Initec Plantas Industriales, S.A., Initec
Infraestructuras, S.A., Técnicas Reunidas Internacional, S.A., Técnicas Reunidas Proyectos Internacionales, S.A., Española de Investigación y Desarrollo, S.A., Eurocontrol, S.A. and Empresarios Agrupados Internacional, S.A.; he is also a member of the business organisation Comité de Empresarios Agrupados A.I.E. All of the above-mentioned companies form part of the Tecnicas Reunidas Group.
- Mr Javier Gómez Navarro is a Non-Executive Director of the company Grupo Isolux Corsán, S.A. e) Remuneration paid to the company’s Board Directors Set out below are details of the overall remuneration received by the company’s Board Directors during the financial year ended 31 December 2007 (Board Directors during 2007 but not necessarily at the date of this report): - Per diems for attending Board meetings K€870 (2006: K€600). - Wages and salaries: K€634 (2006: K€586).

Exhibit I
62
SUBSIDIARIES INCLUDED IN THE SCOPE OF CONSOLIDATION
Shareholding
Company name Registered office
Cost (K€)
% of par value Shareholder company
Consolid. method Activity Auditor
Técnicas Reunidas Internacional, S.A. Madrid 120 100% Técnicas Reunidas, S.A. Full Engineering services PwC
Termotécnica, S.A. Madrid 1.450 99.98% Técnicas Reunidas Construcción y Montaje, S.A. Full. Engineering services and machinery wholesaler Not audited
Técnicas Reunidas Construcción y Montaje, S.A. Madrid 150 100% Técnicas Reunidas, S.A. Full Real estate development Not audited Técnicas Reunidas Ecología, S.A. Madrid 120 100% Técnicas Reunidas, S.A. Full Engineering services PwC Técnicas Reunidas Metalúrgicas, S.A. Madrid 120 100% Técnicas Reunidas, S.A. Full Engineering services Not audited Técnicas Reunidas Trade Panamá, S.A. Panamá 46 100% Técnicas Reunidas, S.A. Full Dormant company Not audited Técnicas Siderúrgicas, S.A. Madrid 124 100% Técnicas Reunidas Construcción y Montaje, S.A. Full Engineering services Not audited Técnicas Reunidas Proyectos Internacionales, S.A. Madrid 1.503 100% Técnicas Reunidas, S.A. Full Engineering services Not audited
Española de Investigación y Desarrollo, S.A. Madrid 438 100% Técnicas Reunidas, S.A. Full Engineering services PwC Layar, S.A. Madrid 8.164 100% Técnicas Reunidas, S.A. Full Real estate Not audited Layar Real Reserva, S.A. Madrid 349 100% Layar, S.A. Full Real estate Not audited
Eurocontrol, S.A. Madrid 472 80% Layar, S.A. Full I Inspection, quality control, technical advisory services. Other
Initec Plantas Industriales, S.A. Madrid 4.613 100% Técnicas Reunidas, S.A. Full Engineering services PwC Initec Infraestructuras, S.A. Madrid 1.322 100% Técnicas Reunidas, S.A. Full Engineering services PwC Initec Chile, S.A. Chile 1 100% Initec Plantas Industriales, S.A. Full Engineering services PwC ReciclAguilar, S.A. Madrid 12 80% Técnicas Reunidas, S.A. Full Engineering services Not audited Técnicas Reunidas Gulf Ltd. Yedah 412 75% Técnicas Reunidas, S.A. Full Engineering services PwC TR Engineering LLC Muscat 400 49% Initec Plantas Industriales, S.A. Full Engineering services PwC
Técnicas Reunidas Omán LLC Muscat 215 70% Initec Plantas Industriales, S.A. Full Engineering services Not audited

Exhibit II
63
ASSOCIATES INCLUDED IN THE SCOPE OF CONSOLIDATION
Shareholding
Company name Registered office Cost (K€)
% of par value Shareholder company
Consolid. method Activity Auditor
Layar Castilla, S.A. Madrid 3.968 25,39% Técnicas Reunidas, S.A. Equity Real estate Not audited
Empresarios Agrupados, A.I.E. Madrid 190 42,48% Técnicas Reunidas, S.A. Equity Engineering services Not audited Empresarios Agrupados Internacional, S.A. Madrid 340 42,48% Técnicas Reunidas, S.A. Equity Engineering services Not audited Ibérica del Espacio, S.A. Madrid 134 20,71% Técnicas Reunidas, S.A. Equity Engineering services Not audited
Green Fuel Corporation, S.A. Madrid 157 20,93% Técnicas Reunidas, S.A. Equity Project analysis and execution. Not audited
Productora de Diesel, S.A. Viña del Mar 4.558 27,50% Técnicas Reunidas Metalúrgicas, S.A. Equity Project analysis and
execution. PwC
Green Fuel Aragón, S.A. (*) Madrid 350 20,84% Técnicas Reunidas, S.A. Equity Project analysis and execution. Not audited
Green Fuel Internacional, S.A. (*) Madrid 211 26,00% Técnicas Reunidas, S.A. Equity Project analysis and execution. Not audited
(*) Companies established or acquired during the year and/or additional participation taken in companies already included within the consolidation scope of the previous year. The incorporation of these companies into the scope did not generate any additional sales in this year.

Exhibit III
64
JOINT VENTURES INCLUDED IN THE SCOPE OF CONSOLIDATION
Shareholding
Company name Registered
office Cost (K€) % of par
value Joint venture partner Consolid. method Activity Auditor
Heymo Ingeniería, S. A. Madrid 517 39,98% Técnicas Reunidas, S. A. Proporcionate Engineering services KPMG KJT Engeharia Materiais Madeira 2 33,33% Técnicas Reunidas, S. A. Proporcionate Engineering services Deloitte Damietta Project Management Co. London 0 33,33% Técnicas Reunidas, S. A. Proporcionate Engineering services KPMG
Damietta LNG Construction Damietta 2.941 33,33% Técnicas Reunidas, S. A. Proporcionate Engineering services and project execution E&Y
Proyectos Ebramex, S. de R.L. de C.V. México D.F. 0 33,33% Técnicas Reunidas, S. A. Proporcionate Engineering services PwC
Minatrico, S. de R.L. de C.V. México D.F. 0 33,33% Técnicas Reunidas, S. A. Proporcionate Engineering services PwC
Construcción e Ingeniería D.I. Ltda. Santiago 1 50,00% Initec Chile, S.A. Proporcionate Engineering services Other
Construcción e Ingeniería FIM Ltda. Santiago 1 33,33% Initec Chile, S.A. Proporcionate Engineering services and project execution Not audited
Construcción e Ingeniería FI Ltda. Santiago 1 50,00% Initec Chile, S.A. Proporcionate Engineering services and project execution Not audited
Técnicas Reunidas Ensol, S.A. (*) Madrid 52 50,00% Técnicas Reunidas, S. A. Proporcionate Engineering services and project execution Not audited
(*) Companies established or acquired during the year and/or additional participation taken in companies already included within the consolidation scope of the previous year. The incorporation of these companies into the scope generated additional sales of 3,695 thousand euros

Exhibit IV
65
UTES AND CONSORTIUMS IN WHICH THE CONSOLIDATED COMPANIES HAVE INTERESTS
UTE Name Interest UTE NAME Interest UTE INITEC/TR PLANTAS HDT Y HCK 100% UTE TR/HEYMO ADPI 40% UTE INITEC/TR JU'AYMAH GPE 100% UTE TR/SATE MALLORCA 50% UTE TR/INITEC/DRAGADOS ARGELIA 67% UTE TR/ARDANUY SEÑALIZACION 50% UTE TR/EC ESMERALDAS PESETAS 100% UTE TR/PYCSA PRESA ARENOSO 50% UTE TR/EC ESMERALDAS ECUADOR 100% UTE TR/DF BARRANCO 50% UTE TR/EUROCONTROL PROY.ASPPC 100% UTE TR/DF AS PONTES 50% UTE TR/LOGPLAN A.T.AENA 55% UTE TRISA/EUROCONTROL OX. DE ETILENO 100% UTE TR/TT HORNOS RUSIA 95% UTE TRISA/EUROCONTROL ACERIA DE WISCO 100% UTE TR/SEG PROY.NT AENA 70% UTE TRISA/EUROCONTROL AC. WUHAN 100% UTE TR/INITEC KJT PR. LNG 100% UTE TRISA/EUROCONTROL ETILENO 100% UTE TR/INITEC DAMIETTA LNG 100% UTE TRISA/EBRAMEX SUMINISTROS 50% UTE TR/IONICS RAMBLA MORALES 40% UTE TRISA/MINATRICO SUMINSTROS 50% UTE TR/TRIMTOR EDAR LIBRILLA 50% UTE DALIAS 65% UTE TR/PYCSA CUEVAS DEL CAMPO 50% UTE AUTOVIA SANTIAGO-LUGO 50% UTE TR/RTA VILLAMARTIN 50% UTE VALENCIA 63% UTE TR/ARDANUY ALGECIRAS 70% UTE PRESA ITOIZ 50% UTE TR/SEG PORTAS 50% UTE LAMELA 25% UTE TR/INTERCONTROL VARIANTE PAJARES 80% UTE LOTETA 50% UTE TR/ALTAMARCA/HMF C. ALCOBENDAS 34% UTE INITEC/INTRAESA 50% UTE TR/GDF CTCC PUERTO DE BARCELONA 50% UTE INITEC/PYCSA ALBERCA DEL JUCAR 70% UTE TR/INITEC EBRAMEX INGENIERIA 51% UTE INITEC/INTECSA-INARSA PUESTA EN CARGA ITOIZ 50% UTE TR/INITEC MINATRICO INGENIERIA 51% UTE INIPSA-EPTISA-INITEC INFRAESTRUCTURAS ARVE 2004 25% UTE TR/ASFALTOSY CONS. APARCAM. ALCOBENDAS 50% UTE EPYSA-INITEC 40% UTE TR/INITEC PROYECTO DGC CHILE 100% UTE INITEC INFRAESTRUCTURAS S.A.-GEOCART 50% UTE TR/INITEC JV HAWIYAH GPE 100% UTE INITEC INFRAESTRUCTURAS TRAMO I 50% UTE TR/CTCI GUANDONG EO/EG 90% UTE INITEC-PROVER 50% UTE TR/CTCI JIANGSU SERVICIOS 90% UTE TIS 33% UTE TR/CTCI JIANGSU SUMINISTROS 90% UTE TZI HUELVA 30% UTE TR/SENER PROEYCTO HPP GEPESA 60% UTE TZI CARTAGENA 30% UTE TR/INITEC/INTECSA INTEIN 33% UTE PAMPILLA 50% UTE PLANTAS RSU MEIRAMA 14% UTE COGENERACION 50% UTE TR/FERROVIAL LA PLANA DEL VENT 58% UTE HUELVA 4 LNG 27% UTE TR/INITEC/EMMSA GASODUCTO MAGREB 50% UTE FW/INITEC PLANTAS/MAN FERROSTAAL(ACONCAGUA-I) 33% UTE INITEC/TR MILD HYDROCRAKING 100% UTE FW/INITEC PLANTAS(ACONCAGUA-II) 50% UTE TORRE COTILLAS 50% UTE TRSA/INITEC INDUSTRIAL MINA-TRICO 49% UTE CAMPO DE ESPINARDO 50% UTE TRSA/INITEC INDUSTRIAL EBRAMEX 49% UTE TR/IONICS EL REVENTON 45% UTE TR/INITEC TFT ARGELIA 100% UTE TR/MASTER APM BARCELONA 50% UTE TR/INITEC CONST. PISCINA HUERCAL OVERA 100% UTE TR/SEG BOBADILLA 50% UTE TR/INITEC DESALADORA RAMBLA MORALES 100% UTE TR/INITEC RFK ARGELIA 100% UTE TR/INITEC CONS. PARCELA 5 100% UTE TR/INITEC RABIGH 100% UTE SERCOAL SERVICIOS MÚLTIPLES 50% UTE TR/INITEC SAIH RAWL 100% UTE TR/SOLAER I.S.F. MORALZARZAL 90% UTE SERCOAL CENTRO DE DÍA 60% UTE TR/KV CON.PL.Y URB.ZALIA 50% UTE INITEC INFRA/BLC/FBA NAT AEROP.REUS 90% UTE TR/INITEC INFRA CONS. COMP. LA VIÑA 85% UTE TVR 50% UTE INITEC P.I./SPIE CAPAG MEDGAZ 50% UTE RUZAFA-MARISTAS 50% UTE TR/I.P.I. FENOLES KAYAN 100% UTE INFRA/FULCRUM CUENCA DEL SEGURA 51% UTE TR/I.P.I. C.P. BIO BIO 100% UTE TR/ESPINDESA 100% UTE TR/I.P.I. OFFSITES ABUH DABIH 100% UTE TR/SKANSKA PROYECTO CIE ARGENTINA 40% UTE TR/TRIMTOR DEP. CAÑADA GALLEGO 50% UTE TR/SKANSKA PROYECTO HTG CILC ARGENTINA 40% UTE TR/SERCOAL/DIZU P. RESIDUOS CONSTRUCC. 34% UTE TR/ALTAMARCA COMPLEJO LA VIÑA 80% UTE INITEC/TR MEJILLONES 100% UTE TR/GDF CTCC BESOS 50% UTE TR/IPI REFINERIA SINES GALP 100% UTE TR/IONICS/TCOSA/CHSA DEP.OROPESA 25% UTE TR/INITEC INFRA CONS.PLANTA RCD 85% UTE TR/TECNORESIDUOS PT VALDEMINGOMEZ 90% UTE TR/IPI KHABAROVSK 100% TECHNIP CONSORTIUM (TPC) 20%

Free translation of the consolidated annual accounts originally issued in Spanish and prepared in accordance with International Reporting Standards as adopted by the European Union. In the event
of a discrepancy, the Spanish language version prevails.
CONSOLIDATED DIRECTOR’S REPORT FOR 2007 1. Financial Indicators The Group prepares its consolidated annual accounts in compliance with International Financial Reporting Standards (IFRS). In financial year 2007, the Group’s net sales were 2,005 million euro, which represents a 62% increase over the year before, maintaining the trend of recent years. The consolidated operating profits and after-tax profits were 108 million euro, which is equivalent to 5.4 % of revenues. 2. Research and Development The Group continued its policy of investing in research, development and innovation, which is one of the essential activities of TECNICAS REUNIDAS through the development of technological aspects where potential niches of commercial interest are detected. 3. Significant Events Subsequent to Year End In early 2008, an expansionist situation continued to dominate the market, particularly in the area of refineries and petrochemicals, which means that our services are in high demand and our negotiating position has improved. 4. Acquisition of Treasury Stock The Group did not acquire any treasury stock in 2007. However, on 14 January 2008, the company signed an agreement with Merrill Lynch Capital Markets to enhance the liquidity of the shares with a maximum limit of 5%, which has generated treasury stock in financial year 2008. 5. Management of Financial Risks and Use of Financial Instruments The principal financial risks and the procedures used to manage them are described in Note 3 of the enclosed report. 6. Other Risk Factors affecting the Business - Demand for the services of TECNICAS REUNIDAS is closely related to the level of investment in the gas and oil industry, which is not easy to predict.
TECNICAS REUNIDAS depends on a relatively small number of contracts and clients.
TECNICAS REUNIDAS does part of its business abroad. This business is exposed to a certain degree of economic, social and political uncertainty. Unexpected, adverse changes in the countries where TR does business could result in its projects being paralysed, increased costs and potential losses.
TECNICAS REUNIDAS depends on its key executive personnel.
The success of associations, consortia, and joint ventures depends on our partners' complying with their respective obligations.
A failure of information technology systems could have a negative impact on the business of TECNICAS REUNIDAS.
The future business success of TECNICAS REUNIDAS is contingent upon new contracts being awarded.

TECNICAS REUNIDAS may be exposed to claims for the errors or omissions of its professionals.
The warranty liability to clients could have a negative effect on TR’s profits.
TECNICAS REUNIDAS is not exempt from the risk of being involved in litigation. 7. Average Number of Employees by Category 2007 2006 Category Engineers and other professionals 2,030 1,265 Surveyors, specialists and qualified assistants 750 533 Administrative 794 425 Unqualified assistants 485 340 Other categories 353 441 TOTAL 4,412 3,004 8. The Environment Given the lines of business in which the companies of the Group operate, the Group has no liabilities, expenses, assets, provisions or contingencies of an environmental nature which could have a significant effect on its net worth, financial situation or results. 9. Capital Structure, Restrictions on the Transferability of Shares and Significant Shareholders The share capital consists of 55,896,000 shares with a par value of 0.10 euro per share. All of the shares belong to the same class and therefore have the same rights and obligations. There are no restrictions on the transferability of the shares. The significant shareholders, direct and indirect, are shown below:
Company Number of Shares Percentage of Total
Araltec, S.L. Direct 21,795,284 38.99%
Aragonesa de Promoción de Obras y Construcciones
Direct 2,848,383 5.10%
Banco Bilbao Vizcaya
Argentaria
Indirect 8,874,223 15.9%
10. Restrictions on Voting Rights Pursuant to article 16 of the Articles of Association, shareholders must possess at least 50 shares in order to attend General Meetings. 11. Shareholder Agreements On 23 May 2006, under a contract signed by Aragonesas Promoción de Obras y Construcción, S.L., BBVA Elcano Empresarial I, SCR and BBVA Elcano Empresarial II, SCR, the following agreements were reached:
- A syndicated voting commitment on the governing bodies of the Company by the shares controlled by José Lladó Fernández Urrutia (Araltec, S.L. and Aragonesas Promoción de Obras y Construcciones, S.L.) and those in the possession of the companies BBVA Elcano Empresarial, SCR and BBVA Elcano Empresarial II, SCR, in order to ensure a majority of votes in favour of the companies controlled by José Lladó Fernández Urrutia.
- A commitment by the companies BBVA Elcano Empresarial I, SCR and BBVA Elcano
Empresarial II, SCR to maintain their shareholdings for a period of nearly 9 years. The agreement also establishes a calendar for the progressive and optional exclusion of the shares subject to the syndication and maintenance agreement between the years 2010 and 2015 and a preferential acquisition right in favour of José Lladó Fernández Urrutia.
12. Rules for the Appointment and Substitution of Members of the Board of Directors and Amendment of the Company’s Articles of Association. These rules relative to the Board of Directors are described in detail in the Corporate Governance Report. The most relevant aspects are: Articles 17 to 22 of the Rules of the Board of Directors regulate the appointment and removal of the directors of Técnicas Reunidas, stipulating that: 1. With the favourable report of the Appointments and Remuneration Committee, directors are appointed
by the General Meeting or by the Board of Directors under the conditions stipulated in the Public Limited Companies Act.
2. The Board of Directors will make every effort to ensure that the Directors are persons of recognised
solvency, competence and experience. 3. The Board of Directors may not propose or appoint anyone who holds an executive position in the
Company or group of companies or who has family or professional ties to the executive directors, to other executive staff and/or to shareholders of the Company or its group of companies to fill the position of independent director.
4. The directors' term of office will be five (5) years, although they may be removed prior to that time by
the General Meeting. At the end of their terms of office they may be re-elected for one or more terms of equal length.
5. Independent directors must step down after a term of 12 consecutive years after the time when the
company’s shares are first traded on the stock exchange. 6. Directors shall make their seats available to the Board of Directors and formally resign under the
following circumstances:
- When they no longer occupy the executive posts associated with their appointment as directors.
- When they are affected by a situation of legal incompatibility or prohibition.
- When they receive a warning from the Board of Directors for having violated their obligations as directors.
- When their remaining on the Board could pose a risk to the Company's interests or when the reasons why they were appointed no longer exist (for example, when a nominee director disposes of it interest in the Company).
13. Powers of the Board of Directors, particularly those relative to the possibility of issuing or repurchasing shares. According to the powers attributed to it under the Public Limited Companies Act, the Board of Directors is the ultimate decision-making body of the Company, with the exception of the matters specifically reserved for the General Meeting.
With regard to the power to issue or repurchase shares, article 5 of the Rules of the Board of Directors stipulates that it is the Board’s responsibility to:
- Execute the treasury stock policy as authorised to do so by the General Meeting.
- Approve the Company’s general policies and strategies, including the treasury stock policy and its limits, in particular.
- Approve the company's most relevant operating decision relative to investments and shareholdings in other companies, financial operations, hiring and employee remuneration.
14. Significant agreements signed by the Company which take effect, are modified or conclude if
the control over the Company changes as a result of a takeover bid. There are no agreements of this kind. 15. Agreements between the Company and its officers, executives or other employees who are
entitled to receive an indemnity when they resign or are illegally dismissed or if the employment relationship comes to an end by reason of a takeover bid.
There is only one such agreement with a company executive which provides that in the event of illegal dismissal the indemnity would be determined in court and in the event of an objective dismissal, layoff or any other decision by the company, the amount of the indemnity would be K€622.
