landscape systems modelling
TRANSCRIPT

Landscape Systems Modelling Context and Current Progress
Daniel Rutledge, Alexander Herzig, Robbie Price
EcoArm2ERA – LUMAN Joint Workshop Dublin, Ireland 11 June 2013

Context
• Global Twin Goals – Enhance overall quality of life for everyone and reduce (eliminate) poverty – Maintain and restore the life-supporting capacity of the planet
• Twin Goals must be met under added pressures of
– Continued population growth – Rising affluence – Increasing risk of environmental degradation or exceeding global planetary
“boundaries” or limits
• New Zealand Business Growth Agenda – Life ratio of exports to gross domestic product to 40% by 2025 – Substantial infrastructure investment (roads, broadband, etc.) – Encourage Research and Development – Encourage businesses to become more innovative to get the best returns for
the economy and environment

Twin Goals Visually
United Nations Human Development Index
Ecological Footprint
(Global
Hectares per Person)
An Example of “Safe
Operating Space”

Put another way:
New Zealand Sustainable Business Council

Enter Land-use Modelling
• Important tool for studying coupled human-natural systems and therefore helping achieve the Twin Goals
• Critical role in managing pathways on a finite planet – Multiple scales – Multiple domains – Key integrating mechanism – Setting limits - there is only so much land ( and water)
• Powerful platform for providing an evidence base for policy & planning, informing debate & decision-making, and visualising options

Global Scale: Integrated Assessment Modelling
Source: van Vuuren et al. 2011. The representative concentration pathways:
an overview. Climate Change 109: 5-31.
Land Use Harmonisation Project
luh.umd.edu
Source: Hurtt et al. 2011. Harmonization of land-use scenarios for the period
1500–2100: 600 years of global gridded annual land-use
transitions, wood harvest, and resulting secondary lands. Climate Change 109: 117-161.

National Scale: Belgium
Land use 2010
Strong Europe Global Economy
Regional Communities Transatlantic Markets
Source: de Kok et al. 2012. Spatial-dynamic visualization of long-term scenarios for
demographic, social-economic and environmental change in Flanders.
iEMSs 2012 Conference Proceedings

National Scale: New Zealand
Land Cover
Database
Land Use

Regional Scale
Land Use
Waikato Region
Land Use
Greater Dublin Region

What do these examples have in common?
Land use 2010
Strong Europe Global Economy
Regional Communities Transatlantic Markets

Land use 2010
Strong Europe Global Economy
Regional Communities Transatlantic Markets
They all depict landscapes as a set
of simple, non-overlapping categories
of land use or land cover or
often some (unappealing) hybrid of both.
Landscapes are treated conceptually as
“scanned paper maps”
What do these examples have in common?

Limitations
What are the effects of agricultural intensification?
How can we improve biodiversity outcomes in
peri-urban and urban areas?
Can we enhance ecosystem
services in existing land uses?
What are the opportunities for tourism
development in our rural areas?
Multiple land use?
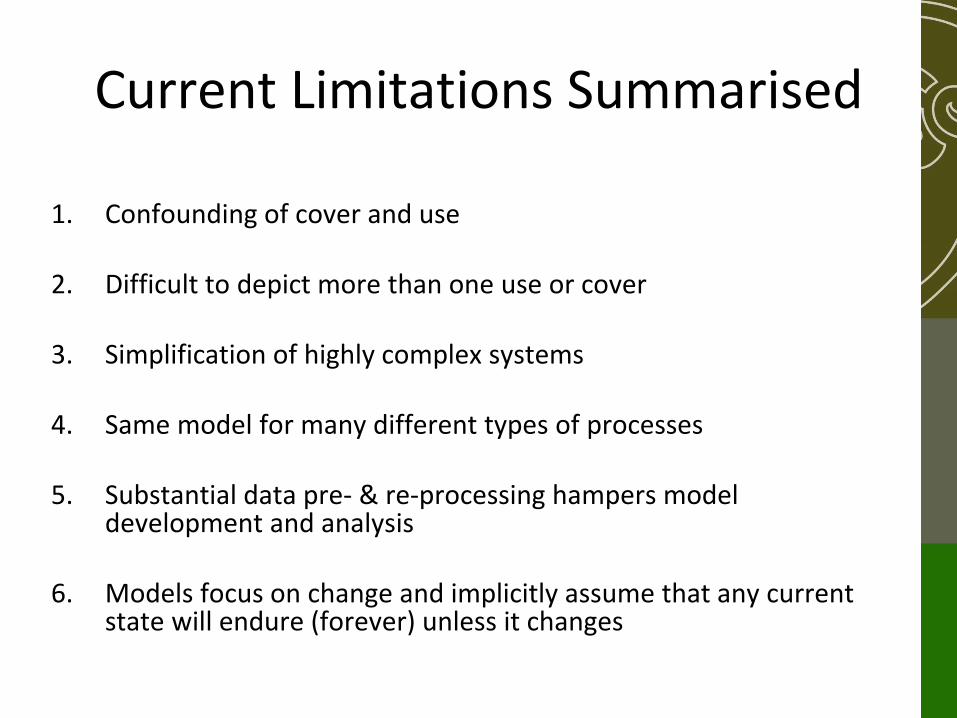
Current Limitations Summarised
1. Confounding of cover and use
2. Difficult to depict more than one use or cover
3. Simplification of highly complex systems
4. Same model for many different types of processes
5. Substantial data pre- & re-processing hampers model development and analysis
6. Models focus on change and implicitly assume that any current state will endure (forever) unless it changes

What to do about it?

Build upon land use modelling by
moving towards
landscape systems modelling

Key Ideas
• Characterise landscapes (use, cover, tenure, etc.) as systems of interacting components operating at appropriate scales (as a start enforce strict separation of land use vs. land cover)
• Store all information elementally as data “atoms” thus moving away from categorical, continugous maps to facilitate more flexible and adaptable characterisation, modelling and analysis
– Scales more easily – Multiple uses possible – Multiple views of the same feature possible – Easier data re-use, analysis and comparison
• Never throw away any data!!!
• Tightly couple the database, model base, analysis base (i.e. GIS) and
visualisation (e.g., LUMASS) to avoid costly re-processing/handling as much as possible

Critical Tensions
Simplicity Complexity
Causation
Reductionism Holism
Correlation
Realism Abstraction
Parsimony
Understanding
Completeness
Confusion


Progress to Date
Operational
Version 1 almost complete
In Development

• Integrates data and information on – environment (cover, soils, topography, landform) – economics (use, management) – society and culture (values, perceptions)
• Stores landscape elements with unique realisations in space and time represented as individual data “atoms”
• Advantages – Better handling of spatio-temporal analyses, use only what is needed – Reduction of data re-processing (e.g., reduced “wheel reinvention”) – Increased capacity to incorporate data as it becomes available – Helps bridge the gap between objective and subjective representations of
landscapes by facilitating multiple representations of similar elements – Assists quantification of uncertainty by building a weight of evidence
regarding landscape composition, configuration, function, service, value, and significance

Data Atomisation Example
Input Data
Land Resource
Inventory
Data Atoms
1w 1 Field = “LUC”
Value = “LUC”
16.0 Field = “CCAV”
Value = “CCAV”
Value = 2 if “PRSIAV” > 21
Field = “PRSIAV”
Value = 1 if “PRSIAV” < 20 2
Atomiser +
Rules

NZLD Data Storage
Elements
Time
Atoms
V2000 (54769)
Lakes
& Ponds V2001 (9189)
V2008 (9295)
V2010 (57100)
Topographic Maps
Land Cover Database
Lakes
V1996 (9141)
Ponds V2000 (740)
V2010 (1896)

Example: Workflows to
generate different land
use classifications
in New Zealand
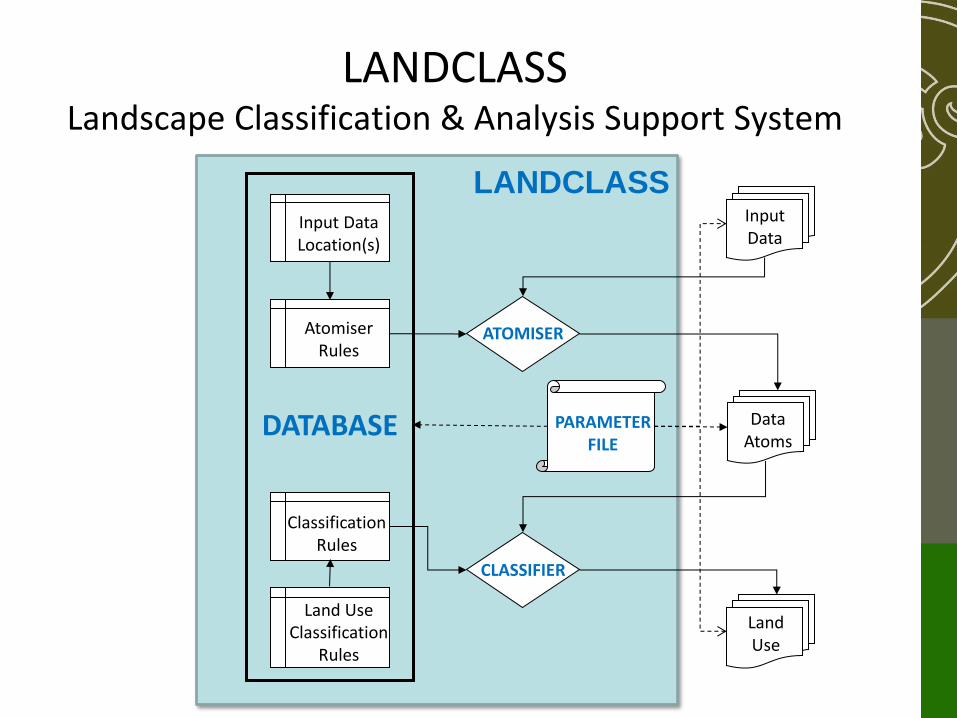
LANDCLASS Landscape Classification & Analysis Support System
Classification Rules
Atomiser Rules
Input Data
Data Atoms
Land Use
ATOMISER
CLASSIFIER
Land Use Classification
Rules
PARAMETER FILE
DATABASE
Input Data Location(s)
LANDCLASS

• Support achievement of the Twin Goals with an emphasis on the New Zealand situation
• Facilitate exploration of scenarios of future landscape development especially over the long-term, e.g., 100 years
• Consideration explicitly interplay among – Resource Availability (e.g., energy, water, minerals) – Thresholds & Limits (ecosystem services, biodivesity) – Opportunities (e.g., technology, innovation, behaviour change) – Adaptive Strategies (e.g., localisation, multifunctional landscapes, resource
efficiency)
• Scale systems & complexity as needed to address the issues(s) at hand
• Facilitate multi-model comparisons (e.g., ensembles)

Atomisation of use & cover

Cover-Use Relationship USE
Not Used Conservation Production Urban
CO
VE
R
Native Vegetation
Non-Native
Vegetation
(Weeds)
Plantation Forest
Grassland & Arable
Built Environment
& Infrastructure
Human Activity H
um
an A
ctivity
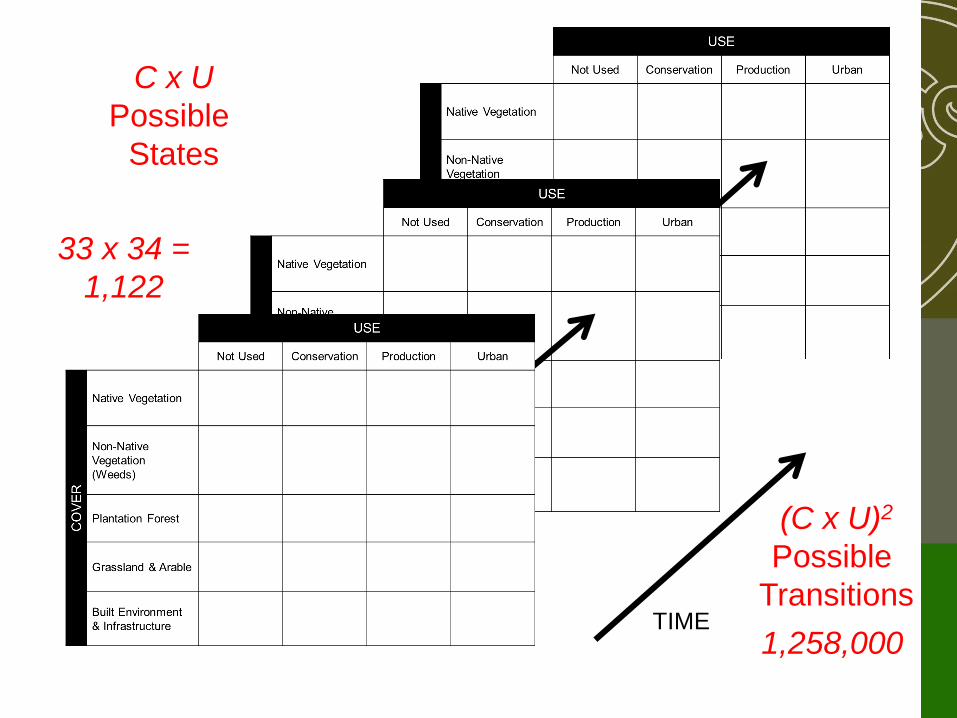
TIME
C x U
Possible
States
(C x U)2
Possible
Transitions
33 x 34 =
1,122
1,258,000

Dairy Farms: Top 10 Land Covers (Agribase 2008 x LCDB2)
High Producing Exotic Grassland 1,629,310
Indigenous Forest 71,392
Manuka and or Kanuka 21,045
Pine Forest - Closed Canopy 17,390
Short-rotation Cropland 15,203
Broadleaved Indigenous Hardwoods 13,292
Low Producing Grassland 12,463
Pine Forest - Open Canopy 11,392
Gorse and Broom 8,751
Deciduous Hardwoods 5,567

Broadleaf Indigenous Hardwoods on Production Land
(Agribase 2008 x LCDB2)
Beef 31,903
Dairy 13,292
Deer 5,246
Forestry 44,209
Sheep 30,462
Sheep &
Beef
127,801
TOTAL 252,913
Total Indigenous Hardwoods
in LCDB 2: ~567,000 ha
At least 45% of Remaining Total
Indigenous Hardwoods occurs
on Production Land Uses

Next Steps
• Complete Version 1 of NLZD
• Analyse combined land-use/land-cover maintenance and change
• Develop feasible suite of models for exploring future landscape evolution (e.g., ecosystem services)

Example: Urban Food Production in Hamilton
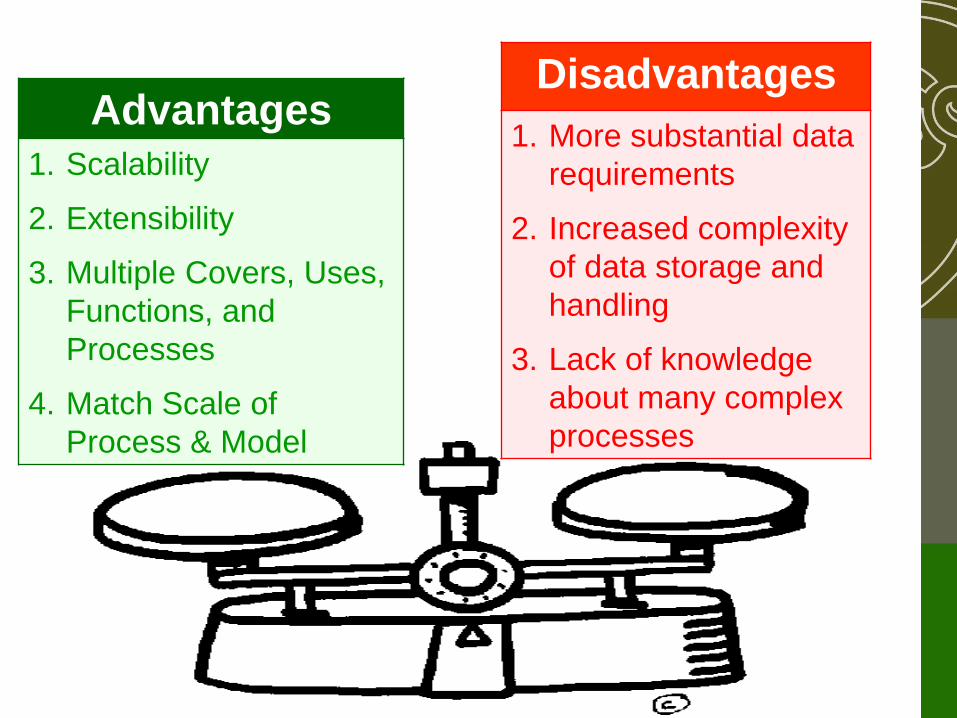
Advantages
1. Scalability
2. Extensibility
3. Multiple Covers, Uses,
Functions, and
Processes
4. Match Scale of
Process & Model
Disadvantages
1. More substantial data
requirements
2. Increased complexity
of data storage and
handling
3. Lack of knowledge
about many complex
processes

Kia ora
Thank you for listening.