landscape 8.7 11-07-06 - world history · 3 j. r. mcneill, something new under the sun: an...
TRANSCRIPT
World History for Us All A project of San Diego State University
In collaboration with the National Center for History in the Schools (UCLA)
http://worldhistoryforusall.sdsu.edu/
Big Era Eight
A Half-Century of Crisis and Achievement 1900-1950 CE
Landscape Teaching Unit 8.7 Environmental Change The Great Acceleration
1900-1950 CE Table of Contents Why this unit? 2 Unit objectives 2 Time and materials 2 Author 3 The historical context 3 This unit in the Big Era timeline 8 Lesson 1: Using Charts and Graphs as Evidence of Environmental Change 9 Lesson 2: Ideological, Economic, and Political Choices Causing Environmental Change 32 This unit and the Three Essential Questions 37 This unit and the Seven Key Themes 37 This unit and the Standards in Historical Thinking 38 Resources 38 Correlations to National and State Standards and to Textbooks 39 Conceptual links to other lessons 39
World History for Us All Big Era 8 Landscape 7
http://worldhistoryforusall.sdsu.edu/ Page 2
Why this unit? Why and how did human impact on the environment become regional and global in this period, and what were the effects? Most of the environmental degradation we decry today was set in motion in the nineteenth century, but it greatly accelerated in the first half of the twentieth. Human determination to master the natural world, sustain continuous economic growth, and expand military power had deleterious effects on earth’s land, water, atmosphere, and biological species. The invention of the internal combustion engine, which powered the early twentieth-century phase of the Industrial Revolution, had particularly drastic effects on the natural and physical environment. Governments and public interest groups, however, did not think much about reversing the negative effects of technological change, population growth, capitalist production, and other factors until the second half of the twentieth century. And it is clear that these issues will be humanity’s headache throughout the twenty-first century. In this unit, students will consider various aspects of the human/nature relationship, recognizing that ideas about environmental change gain or lose currency depending on the circumstances of time and place. Societies value certain ideas concurrently with antithetical ideas. Students will examine economic and political factors that set in process long-term and sometimes irreversible destruction of the earth’s biosphere, atmosphere, and hydrosphere. Students will consider positive, negative, and neutral consequences for the global environment of the choices and decisions societies have made about technological advancement.
Unit objectives Upon completing this unit, students will be able to:
1. Interpret charts and graphs to use as evidence of environmental change. 2. Construct diagrams or models showing the relationship between technology,
population increase, urbanization, and environmental change. 3. Identify factors of environmental change: technology, ideologies, politics, economics,
and population increase and migration.
Time and materials Time: Two to three class periods with homework. Materials: Drawing paper and pencils, colored pencils and markers (or paints and brushes), cardboard, glue, string, metal fasteners, and other model construction supplies teachers may wish to use.
World History for Us All Big Era 8 Landscape 7
http://worldhistoryforusall.sdsu.edu/ Page 3
Author Lori D. Shaller teaches world history to ninth and tenth graders at Martha’s Vineyard Public Charter School. She also teaches world literature, Model United Nations, and portfolio and juried exhibition preparation to eleventh and twelfth graders. She taught in two Northeastern University World History Center Summer Institutes for high school teachers. In 1999 she received a World History Center Award for Excellence in Teaching World History. She lives in Oak Bluffs, Massachusetts on the island of Martha’s Vineyard.
The historical context The Great Acceleration of environmental change from 1900 to 1950 involved several interrelated phenomena and environmental transitions: the world’s population almost doubled; coal began to give way to oil as the principal fossil fuel; cropland increasingly replaced forests and grasslands; and the world’s freshwater consumption doubled. Many more changes could be listed. Environmental degradation increased at a startling rate and accelerated even faster in the second half of the twentieth century. Human effects on the environment, which had previously been largely localized, became global between 1900 and 1950. These shifts, however, occurred unevenly. For example, the number of urban areas and peripheral land facilitating urban growth increased most in Latin America and North America. The former became the fastest growing region in the world. But the number of cities in Europe and Asia remained about the same. Oil replaced coal first in American and European cities, and some cities actually became cleaner rather than more polluted in this period. Nevertheless, the 1900-1950 period set in motion the greatest man-made, global environmental change in the history of humanity to that point. Population Population increase occurs when fertility rates increase, while infant mortality rates decrease and older people live longer owing to antibiotics, vaccines, and improved sanitation.1 From 1900 to 1950 this growth was marked in Europe and the other regions, including the United States, where the descendants of European settlers lived. It happened after 1950 in the rest of the world. This period, however, also saw a mass exodus from Europe, primarily to the U.S. During this period, migration form Europe surpassed the rates of natural increase.2 Urbanization Population increases in and of themselves were probably less responsible for humans adversely affecting the global environment than were urbanization and industrialization. Urbanization was responsible for generating waste that local authorities often dealt with by shunting it out of the urban area, sometimes to places within the exurban area, sometimes further away in the region, thus extending the city’s “footprint.”3 City asphalt, concrete, steel, and glass created their own heat, which could be greater than that of the sun, thus trapping pollutants and changing the
1 Paul Demeny, “Population,” in The Earth as Transformed by Human Action: Global and Regional Changes in the Biosphere over the Past 300 Years, B.L. Turner II, et al., eds. (Cambridge: Cambridge UP, 1990), 46. 2 Ibid., 45. 3 J. R. McNeill, Something New Under the Sun: An Environmental History of the Twentieth-Century World (New York: Norton, 2000), 287.

World History for Us All Big Era 8 Landscape 7
http://worldhistoryforusall.sdsu.edu/ Page 4
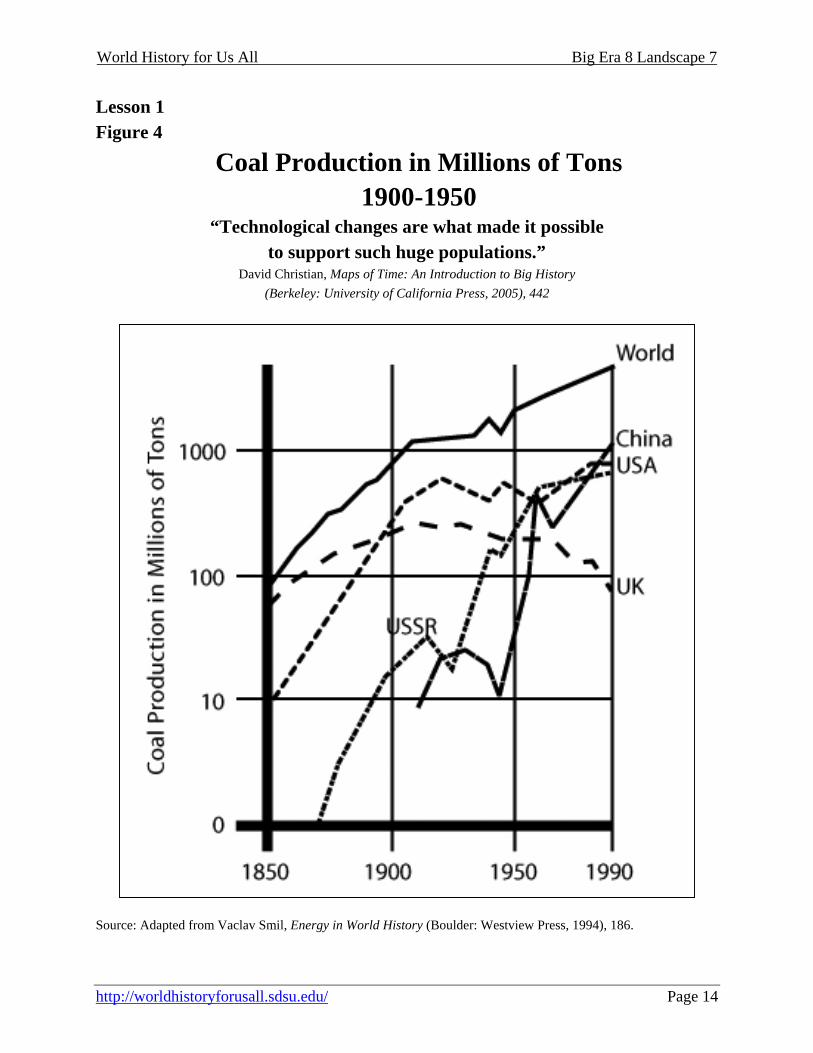
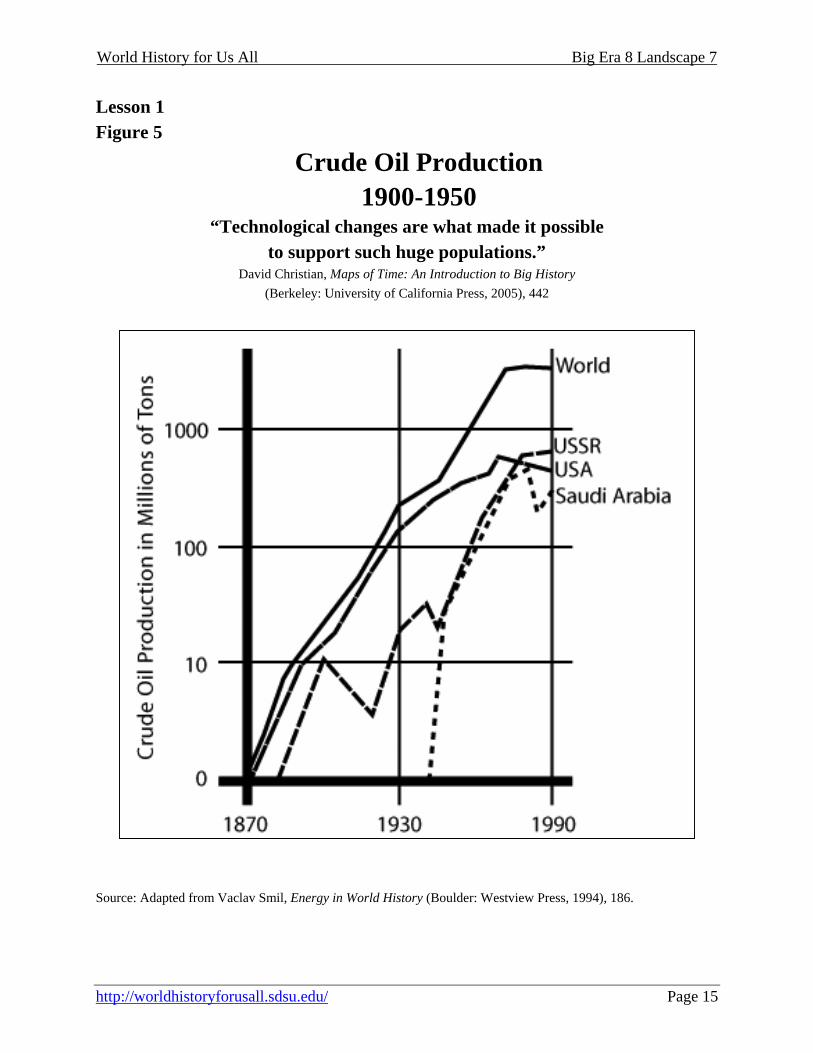
chemical make-up of the air. By adding sulphur and CO2 to the air, cities created greenhouse effects, global warming, and changes in the sea level. The quality and flow of run-off water also changed.4 Urban expansion into forest areas caused deforestation.5 Yet the railroad probably caused even more global deforestation, during this period and in previous ones, than did urbanization.6 The amount of land brought under cultivation did not increase dramatically between 1900 and 1937, but it did grow owing to migrations of South Asians to Oceania, northeastern South America, and South Africa, as well as resettlement of Chinese in Southeast Asia, the Caribbean, Peru, and California.7 In addition to transcontinental migration, transmigration, that is. the movement of people within a region or country, also produced environmental changes. This was the case in Indonesia after the Dutch colonial regime shifted people to areas like Java and Sumatra, which had previously been less densely populated, in order to extract more gold and timber.8 Technology Technological changes supported population increase, for example the increased life expectancy resulting from medical advances.9 The internal combustion engine was invented before 1900 but used much more extensively after that date. While coal extraction went from less than to more than 1 billion tons annually in the 1900-1950s period, crude oil production went from 10 million to over 1 billion tons, and natural gas from 1.7 billion to 150 billion cubic meters. Both oil and gas fueled automobiles and, more importantly on a global scale, trucks and machinery.10 Oil replaced coal for transport by 1930 and increasingly supplanted it as fuel for industry before 1950.11 Western countries used the bulk of this non-renewable fossil fuel energy, even though they accounted for only about 30 percent of the world’s population.12 Coal continued to be used domestically and industrially in most of the world, causing most of the pollution. The pollution effects of burning gasoline and diesel oil were felt heavily later in the century.13 It must be added that while oil burns cleaner than coal, which in the earlier twentieth century caused less air pollution, oil is messier to extract. And later, the sheer numbers of trucks and cars on the world’s roads drastically increased pollution from petroleum products. Ironically, from 1900 to 1950, the regions of the world producing the most oil—Mexico, Venezuela, Russia, Saudi Arabia—used the least amounts of it. Yet, it was their landscapes, and not those of the oil-using U.S. or Europe, that were damaged by it.14 Farming, too, reaped the benefit of the internal combustion engine in the form of the tractor, which farmers used more often in rich than in poor countries.
4 Brian J.L. Berry, “Urbanization,” in Turner, The Earth as Transformed by Human Action, 113. 5 McNeill, Something New Under the Sun, 276. 6 Ibid., 308. 7 Ibid., 277. 8 Ibid., 280. 9 David Christian, Maps of Time: An Introduction to Big History (Berkeley: University of California Press, 2004), 442. 10 Vaclav Smil, Energy in World History (Boulder: Westview Press, 1994), 186. 11 McNeill, Something New Under the Sun, 298. 12 Smil, Energy in World History, 235. 13 McNeill, Something New Under the Sun, 58, 60. 14 Daniel R. Headrick, “Technological Change,” in Turner, 60.
World History for Us All Big Era 8 Landscape 7
http://worldhistoryforusall.sdsu.edu/ Page 5
War Great technological change was wrought in the fighting of wars. Tanks, planes, poison gas, and more efficient machine guns were added to the repertoire for mass killing.15 Large troop movements, particularly during World War I, readily spread disease, creating pandemics like the 1918-1919 influenza outbreak.16 More deaths among soldiers and civilians are attributable to diseases than to combat.17 On the other hand, antibiotics and vaccines kept more soldiers alive longer so they could return to battle, but these miracle drugs were not generally available to civilian populations.18 Electricity Some fossil fuels were used to power electrical plants, which were burgeoning in this period. Electrical power use increased 9 percent from 1900 to 1935, and in the 1920s, the U.S. used more electricity than any other country.19 Electrification took its toll on forests; not only were trees needed for poles to support electrical lines, but great swaths of land were cleared to for utility lines.20 Water Human beings made great progress in water extraction and management between 1900 and 1950 through damming, irrigating, channeling, and wetlands retrieval. Europe and the U.S. used more water than other parts of the world. Better well-digging, resulting from oil extraction technology, made for aquifer depletion at rates greater than their replenishment in such areas as the Middle East and the American West.21 Water was used more to irrigate crops than for other purposes. Between 1900 and 1950, irrigated land area doubled worldwide.22 Building dams is a method of providing irrigation, but it also increases salinity levels, wipes out fish populations, and reduces stream flow. After 1900, damming was used more for providing electricity than for irrigation. For example, by channeling water, Italy was able to provide electricity to areas where massive industrial complexes could be built.23 In many parts of the world, wetlands were drained to make room for more farmland, but this resulted in such a loss of habitat that one third of American wetland species became endangered.24 Chemicals Chemical technology increased crop yields through soil enrichment and, like the tractor, was utilized more by rich countries than by poor ones. Pesticide use also became more widespread. Pesticides accelerated farmers’ transition to monocultures (growing a single crop for the market) because insecticides worked best when they were used on fewer plant species. Adding nitrogen,
15 Smil, Energy in World History, 184. 16 McNeill, Something New Under the Sun, 206. 17 Ibid., 198. 18 Ibid., 200, 205. 19 Smil, Energy in World History, 187. 20 Ibid., 60. 21 McNeill, Something New Under the Sun, 151. 22 Ibid., 180. 23 Ibid., 163. 24 Ibid., 189.
World History for Us All Big Era 8 Landscape 7
http://worldhistoryforusall.sdsu.edu/ Page 6
phosphates, and potassium to the soil, however, causes leaching of toxic chemicals into groundwater, soil, lakes, and rivers. In some places, fertilizer and pesticide use permanently ruined water supplies. These chemicals also adversely affected human health because they made their way into the food chain. The change in the chemical composition of the water favored some plant and animal species but eliminated others.25 Air Pollution Industrialization affected ever broader areas by releasing smoke and particulate matter into the air. Cities like London, Pittsburgh, and Osaka became very polluted, a public outcry went up, and industry therefore built higher smokestacks. If the winds were right, these smokestacks carried the pollution over more extensive areas. Industry went from being city-based to region-based, as, for example, the Ruhr Valley or the Dresden-Prague-Krakow Triangle in Europe.26 Sulphur, as well as heavy metal emissions from trash incineration, smelting, and fuel burning, began to cause problems like acid rain, which also traveled with the prevailing winds.27 Air pollution was the first problem of industrialization to engender a significant public response, although pockets of native peoples had noticed problems with over-fishing and chemical damage to water from runoff.28 As early as 1941 in the U.S., and 1956 in the U.K., legislatures passed clean air laws.29 The nature conservation movement also grew in strength in the U.S. and Europe, notably as a result of the efforts of Theodore Roosevelt. However, advocating for the conservation of open land was different from making industry pay to clean up polluted rivers, a policy that would not appear until later in the twentieth century. The predominant thinking about the human/nature relationship was of “humanity as modifier of nature.”30 Economics The industrializing world had a strong ideological commitment to economic expansion and military power.31 The drive for economic growth made humans view nature as a supplier of natural resources.32 Between 1900 and 1950, working people first became serious consumers.33 John McNeill pinpoints the birth of consumer society on January 5, 1914, because Ford automotive assembly-line workers were given high enough wages to buy the product of their own labor: the Model T car.34 With the advent of consumer society came the commodification of nature. Industrialization thus became more exalted than nature.35 Indeed, in this period, world
25 McNeill, Something New Under the Sun,, 26. 26 Ibid., 86. 27 Ibid., 54, 99. 28 Ibid., 321. 29 Ibid., 69. 30 Robert W. Kates, B.L. Turner II, and William C. Clark, “The Great Transformation,” in Turner, The Earth as Transformed by Human Action, 2.
31 McNeill, Something New Under the Sun, 268. 32 Ibid., 336. 33 Christian, Maps of Time, 446. 34 McNeill, Something New Under the Sun, 316. 35 Ibid., 334.
World History for Us All Big Era 8 Landscape 7
http://worldhistoryforusall.sdsu.edu/ Page 7
gross domestic product rose from 2 to 5 trillion dollars a year, and per capita earning averages in 1990 dollars went from $1,263 to $2,138.36 These amounts, however, were unevenly distributed. From 1900 to 1950, the more industrialized countries grew richer while lands, especially in the tropics, more dependent on agriculture grew poorer.37 These statistical differences translated, for example, into safe drinking water and sewage treatment plants in rich cities, unhealthy water and shanty towns in poor ones, or transitions to mechanized farming in rich countries, yielding greater returns and incomes, while farmers in poorer countries received lower prices for cash crops and had little choice in what they could grow.38 Ecological conclusions In this period, the richer nations also began cleaning up some of their messes. In Western countries, water became cleaner and water-borne disease outbreaks, like cholera and tuberculosis, declined.39 In the more industrialized world population growth rates dropped off, while in much of Latin America, Africa, and Asia they kept rising.40 In the lands of temperate climate (where populations were heavily descended from Europeans), forests began to return, partly owing to a shift to steel and plastic for building materials and consumer goods, and partly to use of oil for fuel. In tropical lands, on the other hand, hardwood forests were depleted.41 Economic growth tended to fuel the forces of environmental degradation. A remarkable aspect of this degradation is that world economic growth was significantly lower between 1914 and 1945—the period of the world wars and the Great Depression—than it had been between 1900 and 1914 or was again between 1945 and 1950.42 This means that global human effects on the environment were most profound during the fourteen years before World War I and the five years after World War II!
36 Christian, Maps of Time, 444. See McNeill, Something New Under the Sun, 7, for per capita earnings. 37 McNeill, Something New Under the Sun, 127. 38 Ibid., 127, and Headrick, “Technological Change,” 59. 39 Ibid., 196. 40 Ibid., 272. 41 Ibid., 232. 42 Ibid., 6.

World History for Us All Big Era 8 Landscape 7
http://worldhistoryforusall.sdsu.edu/ Page 8
This unit in the Big Era Timeline
Big Era Eight 1900-1950 CE

World History for Us All Big Era 8 Landscape 7
http://worldhistoryforusall.sdsu.edu/ Page 9
Lesson 1 Using Charts and Graphs as Evidence of Environmental Change
Introduction This lesson is intended to help students get beyond vague generalizations about the human impact on the environment. Students discover that the environmental problems they are aware of began taking shape with the growth of world population and of fossil fuel use during the first half of the twentieth century. Students interpret and analyze graphs, charts, and quotations to understand how population, urbanization, and the internal combustion engine’s fossil fuel demands affected environmental change in the period. This lesson can be used alone or as the first one in the unit. Preparation Copy the graph and chart sets and accompanying quotations and make a folder for each of six sets of charts, graphs, and quotations entitled:
• Economic Growth Rates • Energy Sources and Uses • Trace Metals in the Atmosphere, Water Use, and Global Vegetation Cover • Fish and Livestock • Population and Urbanization • Prime Movers
Make 108 copies of Student Handout 1.1, or one handout for each of the documents to be used by each of six student groups. Make one copy for each student of Student Handout 1.2. Have on hand drawing materials and cardboard, glue, metal fasteners, string, etc., for the culminating activity. Activities 1. Divide the class into six groups. 2. Give each student a copy of Student Handout 1.2, “Performance Task and Assessment Rubric.” Go over the expectations for the task and the assessment. Give each group eighteen copies of Student Handout 1.1. Give student groups five to ten minutes with each folder to interpret the information and to complete Student Handout 1.1 for each document. 3. When the groups have completed their interpretations of the charts, graphs, and quotations, lead the class in a discussion to move students from interpretation to analysis, or “making meaning” of the data. Be sure the students take notes. You will want to review the data and make some of your own analyses in light of the information in The Historical Context second of this teaching unit, as well as your own knowledge, and the knowledge students bring to the class. Here are some additional ideas to include:
World History for Us All Big Era 8 Landscape 7
http://worldhistoryforusall.sdsu.edu/ Page 10
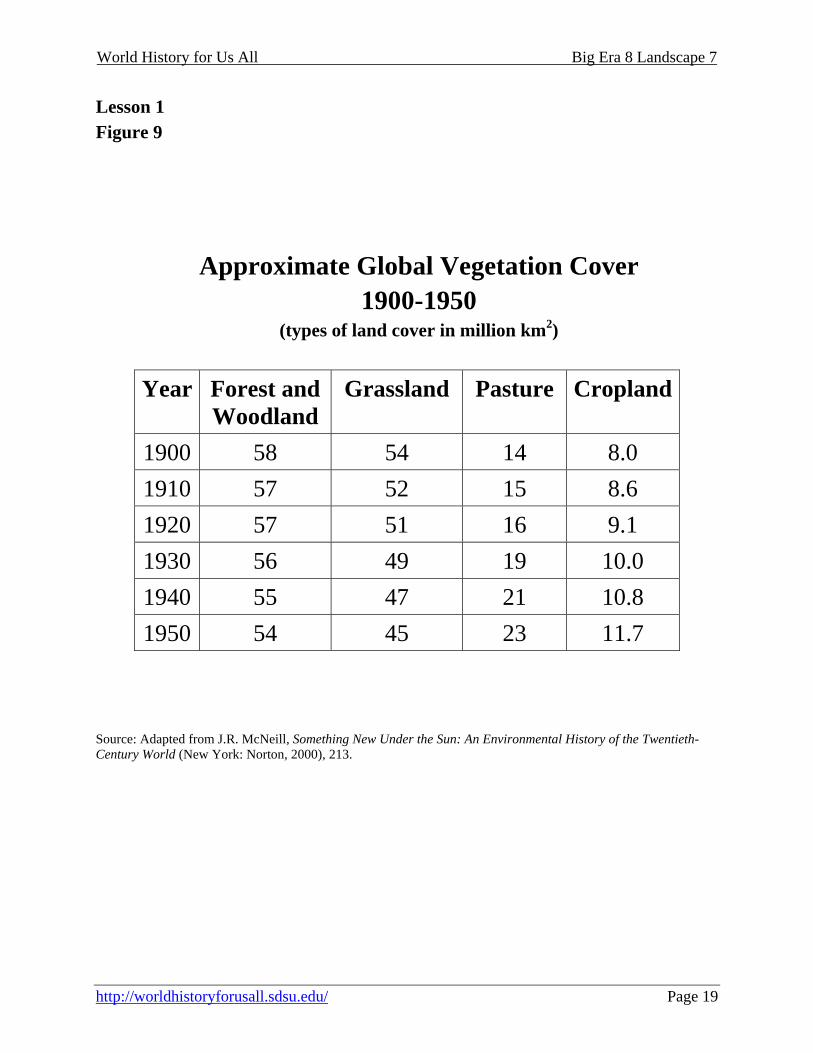
A. Population increases varied depending on place and time, but between 1900 and 1950 the population of the world roughly doubled. For example, in North and South America it more than doubled, while in Europe it grew only by about 1.5 million. This worldwide population increase meant that more food was needed, but it differed from one region to another. This, in turn, meant that some regions had to look outside of their areas for food importation. The ability to feed more people without a huge increase in the amount of acreage under cultivation was due in part to the increased use of chemical fertilizers and improved irrigation methods. These advancements, however, caused more noxious chemicals to leach into groundwater, soil, rivers, and lakes. B. Tractors with internal combustion engines helped provide more food, but they were used unevenly across the planet. Cars, trucks, and buses were also distributed unevenly. This meant that the air in some places was more polluted with exhaust fumes, but the wind spread pollution to places that were not even using tractors, cars, trucks, and buses. Although coal, a significant air polluter, was still in use, oil-fueled vehicles were also adding to pollution. C. The use of fresh water increased almost three-fold, but its purposes were increasingly industrial rather than agricultural. Irrigation methods improved, but more water had to go to cities where food was consumed, not grown. Irrigation also led to salinization of the water. D. Forests and grasslands decreased because wood was still being used as fuel in some places and because they gave way to croplands or industry. In this period, forests in temperate areas actually began to return, but those in tropical areas were seriously depleted.
4. Return to the performance task on Student Handout 1.2. Make available to students the drawing materials. Whether they choose to make a diagram or a model, students should sketch their ideas in class so you can check in, make suggestions, and correct before they make their final diagrams or models for homework. 5. Post or display the diagrams and models. Have students self- and then peer-evaluate, using the rubric on Student Handout 1.2. 6. Use student diagrams and models to discuss some conclusions about the human impact on the environment during this period. Assessment See Student Handout 1.2.
World History for Us All Big Era 8 Landscape 7
http://worldhistoryforusall.sdsu.edu/ Page 11
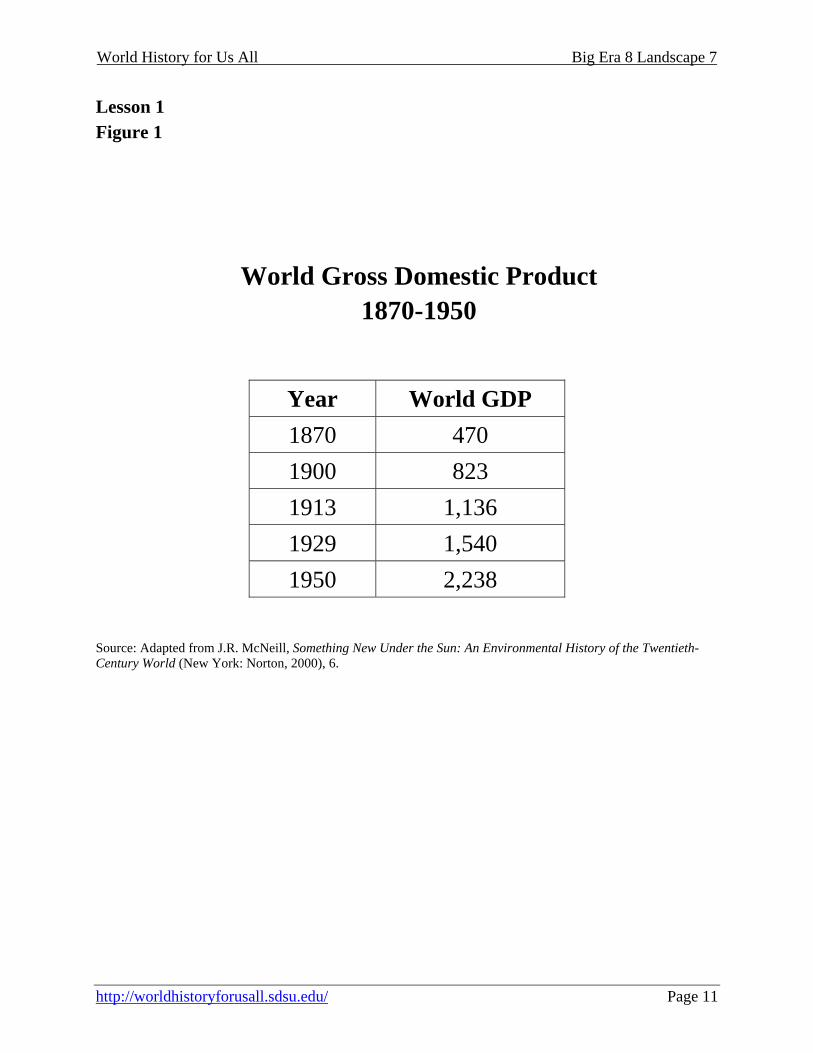
Lesson 1 Figure 1
World Gross Domestic Product 1870-1950
Year World GDP 1870 470 1900 823 1913 1,136 1929 1,540 1950 2,238
Source: Adapted from J.R. McNeill, Something New Under the Sun: An Environmental History of the Twentieth-Century World (New York: Norton, 2000), 6.

World History for Us All Big Era 8 Landscape 7
http://worldhistoryforusall.sdsu.edu/ Page 12
Lesson 1 Figure 2
World Per Capita Gross Domestic Product 1820-1950
Year Per Capita World GDP (1990 dollars)
Index Numbers (AD 1500 = 100 World GDP)
1820 651 117 1900 1,236 224 1950 2,138 378
Source: Adapted from J.R. McNeill, Something New Under the Sun: An Environmental History of the Twentieth-Century World (New York: Norton, 2000), 7.

World History for Us All Big Era 8 Landscape 7
http://worldhistoryforusall.sdsu.edu/ Page 13
Lesson 1 Figure 3
World Energy Use 1800-1990
“Technological changes are what made it possible to support such huge populations.”
David Christian, Maps of Time: An Introduction to Big History (Berkeley: University of California Press, 2005), 442
Year Total (millions of metric tons
of oil equivalent)
Index Numbers (1900 = 100)
1800 400 21 1900 1,900 100 1990 30,000 1,580
Source: Adapted from J.R. McNeill, Something New Under the Sun: An Environmental History of the Twentieth-Century World (New York: Norton, 2000), 15.
World History for Us All Big Era 8 Landscape 7
http://worldhistoryforusall.sdsu.edu/ Page 14
Lesson 1 Figure 4
Coal Production in Millions of Tons 1900-1950
“Technological changes are what made it possible to support such huge populations.”
David Christian, Maps of Time: An Introduction to Big History (Berkeley: University of California Press, 2005), 442
Source: Adapted from Vaclav Smil, Energy in World History (Boulder: Westview Press, 1994), 186.
World History for Us All Big Era 8 Landscape 7
http://worldhistoryforusall.sdsu.edu/ Page 15
Lesson 1 Figure 5
Crude Oil Production 1900-1950
“Technological changes are what made it possible to support such huge populations.”
David Christian, Maps of Time: An Introduction to Big History (Berkeley: University of California Press, 2005), 442
Source: Adapted from Vaclav Smil, Energy in World History (Boulder: Westview Press, 1994), 186.

World History for Us All Big Era 8 Landscape 7
http://worldhistoryforusall.sdsu.edu/ Page 16
Lesson 1 Figure 6
Natural Gas Production 1900-1950
“Technological changes are what made it possible to support such huge populations.”
David Christian, Maps of Time: An Introduction to Big History (Berkeley: University of California Press, 2005), 442
Source: Adapted from Vaclav Smil, Energy in World History (Boulder: Westview Press, 1994), 186.
World History for Us All Big Era 8 Landscape 7
http://worldhistoryforusall.sdsu.edu/ Page 17
Lesson 1 Figure 7
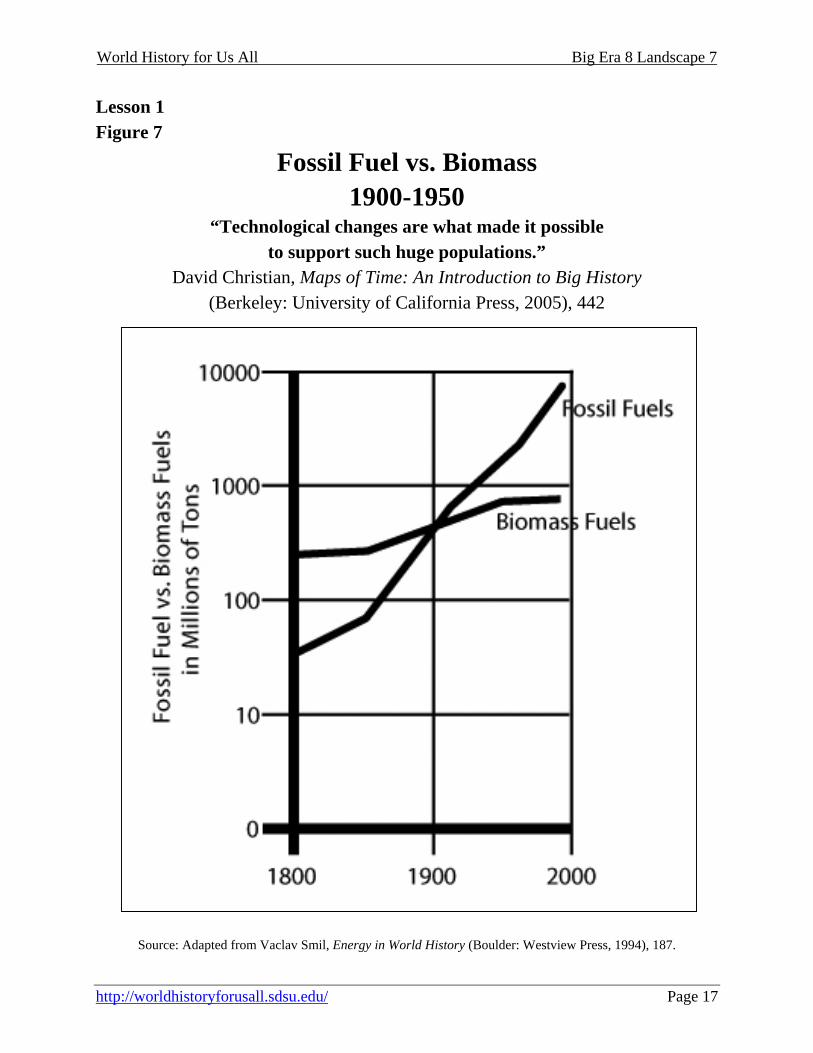
Fossil Fuel vs. Biomass 1900-1950
“Technological changes are what made it possible to support such huge populations.”
David Christian, Maps of Time: An Introduction to Big History (Berkeley: University of California Press, 2005), 442
Source: Adapted from Vaclav Smil, Energy in World History (Boulder: Westview Press, 1994), 187.

World History for Us All Big Era 8 Landscape 7
http://worldhistoryforusall.sdsu.edu/ Page 18
Lesson 1 Figure 8
Estimated Fresh Water Uses 1800-1950
Year Withdrawals (km 3)
Withdrawals(per capita)
Irrigation%
Industry %
Municipal%
1800 243 0.27 90 3 7 1900 580 0.36 90 6 3 1950 1,360 0.54 83 13 4 Source: Adapted from J.R. McNeill, Something New Under the Sun: An Environmental History of the Twentieth-Century World (New York: Norton, 2000), 121.
World History for Us All Big Era 8 Landscape 7
http://worldhistoryforusall.sdsu.edu/ Page 19
Lesson 1 Figure 9
Approximate Global Vegetation Cover 1900-1950
(types of land cover in million km2)
Year Forest and Woodland
Grassland Pasture Cropland
1900 58 54 14 8.0 1910 57 52 15 8.6 1920 57 51 16 9.1 1930 56 49 19 10.0 1940 55 47 21 10.8 1950 54 45 23 11.7
Source: Adapted from J.R. McNeill, Something New Under the Sun: An Environmental History of the Twentieth-Century World (New York: Norton, 2000), 213.
World History for Us All Big Era 8 Landscape 7
http://worldhistoryforusall.sdsu.edu/ Page 20
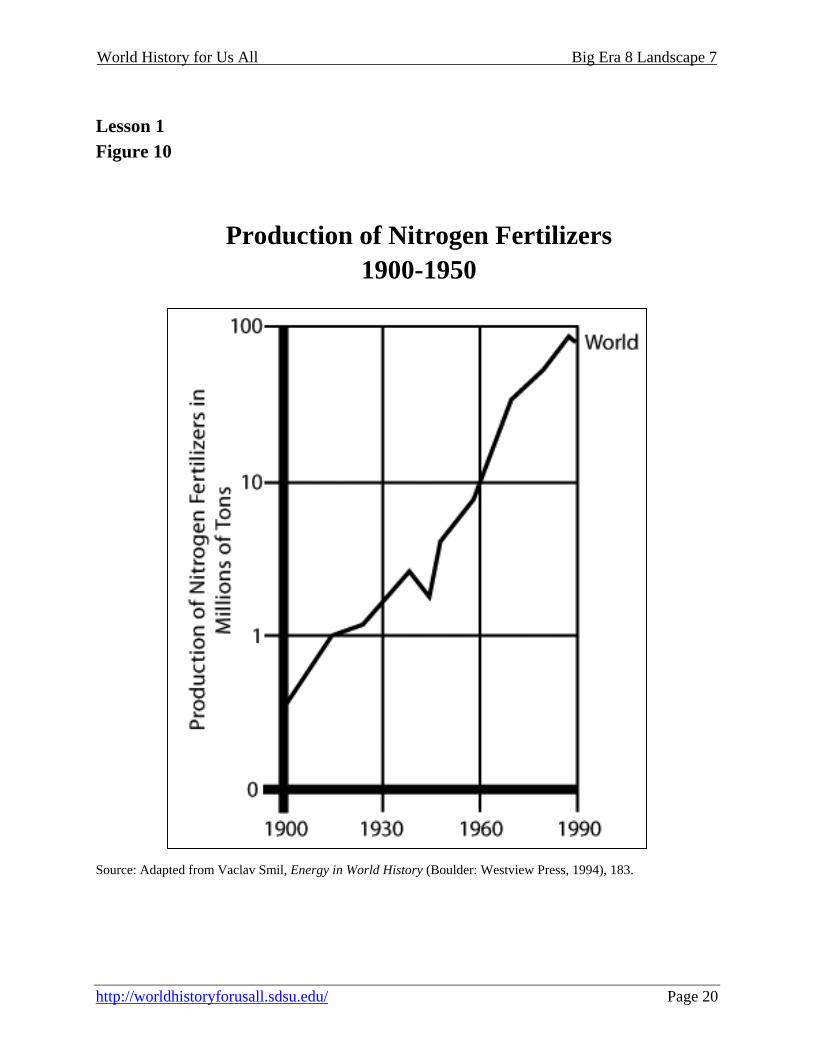
Lesson 1 Figure 10
Production of Nitrogen Fertilizers
1900-1950
Source: Adapted from Vaclav Smil, Energy in World History (Boulder: Westview Press, 1994), 183.

World History for Us All Big Era 8 Landscape 7
http://worldhistoryforusall.sdsu.edu/ Page 21
Lesson 1 Figure 11
Tractors in the World 1920-1950
(in millions)
Year United States USSR World 1920 0.25 0 0.3 1930 1.0 0.05 1.1 1940 1.6 0.5 3 1950 3.4 0.6 6
Source: Adapted from J.R. McNeill, Something New Under the Sun: An Environmental History of the Twentieth-Century World (New York: Norton, 2000), 217.

World History for Us All Big Era 8 Landscape 7
http://worldhistoryforusall.sdsu.edu/ Page 22
Lesson 1 Figure 12
Number of Cars, Trucks, and Buses 1900-1950
Source: Adapted from Vaclav Smil, Energy in World History (Boulder: Westview Press, 1994), 199.
World History for Us All Big Era 8 Landscape 7
http://worldhistoryforusall.sdsu.edu/ Page 23
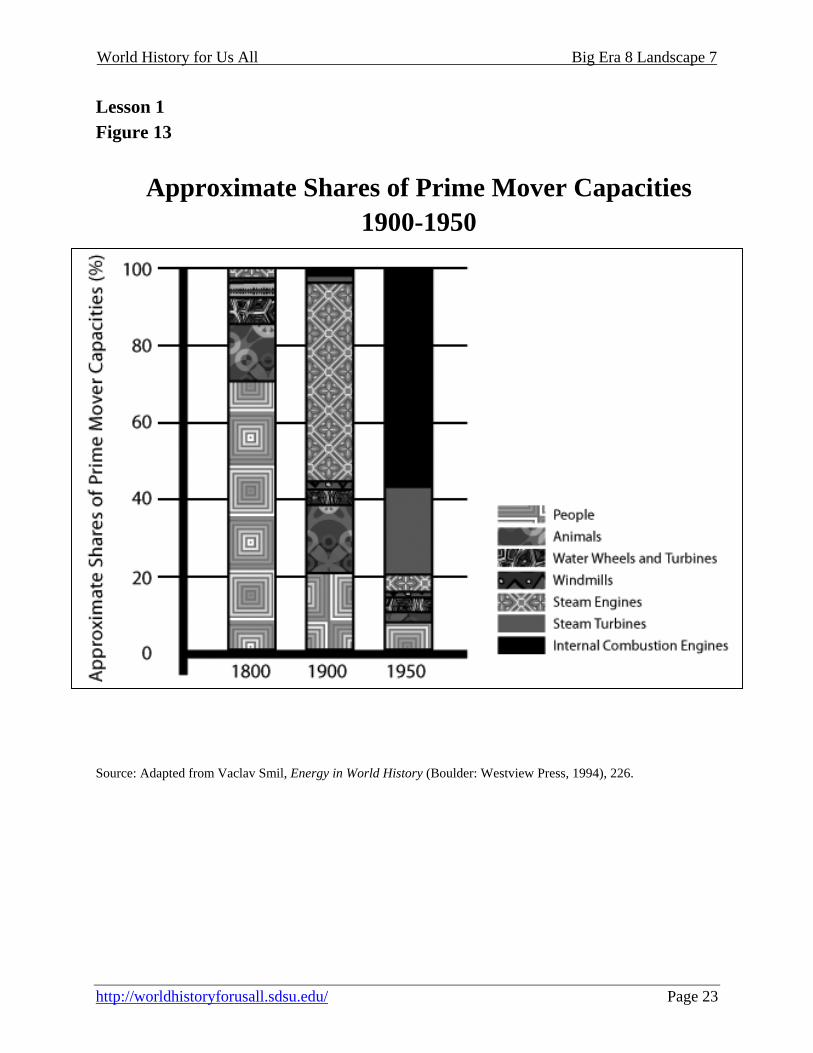
Lesson 1 Figure 13
Approximate Shares of Prime Mover Capacities 1900-1950
Source: Adapted from Vaclav Smil, Energy in World History (Boulder: Westview Press, 1994), 226.
World History for Us All Big Era 8 Landscape 7
http://worldhistoryforusall.sdsu.edu/ Page 24
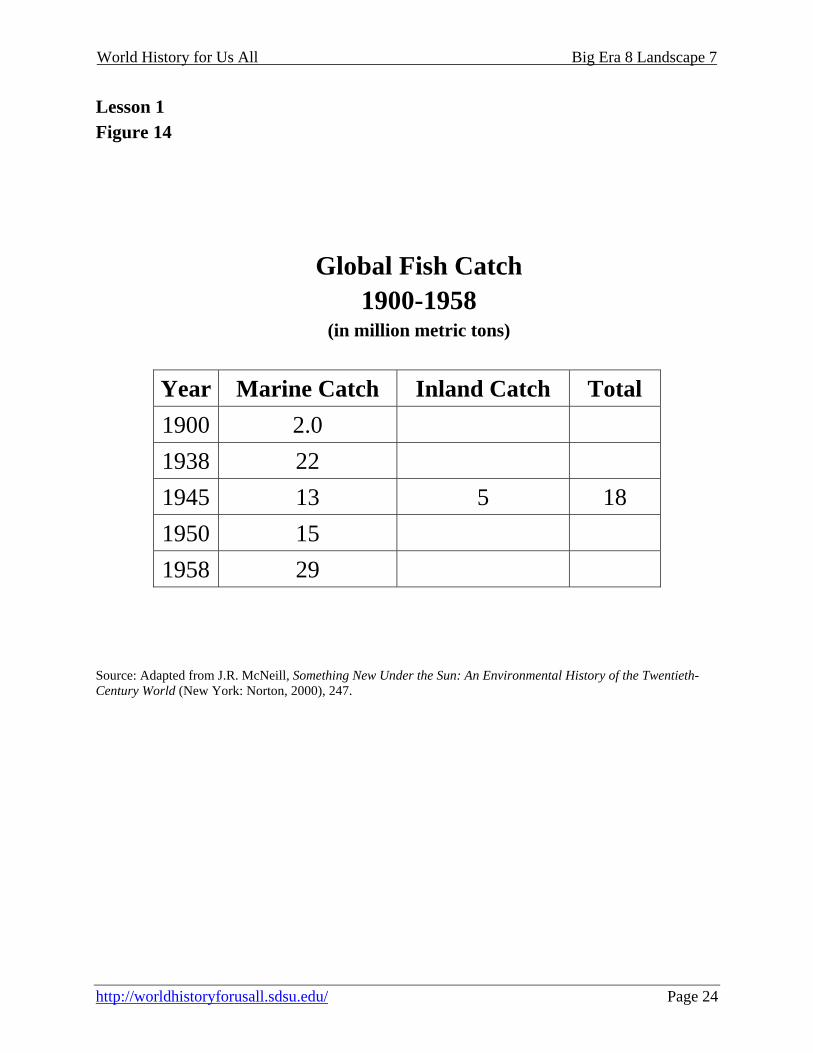
Lesson 1 Figure 14
Global Fish Catch 1900-1958
(in million metric tons)
Year Marine Catch Inland Catch Total 1900 2.0 1938 22 1945 13 5 18 1950 15 1958 29
Source: Adapted from J.R. McNeill, Something New Under the Sun: An Environmental History of the Twentieth-Century World (New York: Norton, 2000), 247.

World History for Us All Big Era 8 Landscape 7
http://worldhistoryforusall.sdsu.edu/ Page 25
Lesson 1 Figure 14
Global Livestock Population 1890-1950
(in millions of heads)
Year Cattle Sheep Goats Pigs Horses Poultry1890 319 356 52 90 51 706 1910 391 418 83 115 73 828 1930 513 567 153 187 88 1,203 1950 644 631 187 300 69 1,372
Source: Adapted from J.R. McNeill, Something New Under the Sun: An Environmental History of the Twentieth-Century World (New York: Norton, 2000), 264.

World History for Us All Big Era 8 Landscape 7
http://worldhistoryforusall.sdsu.edu/ Page 26
Lesson 1 Figure 15
Population by Region 1850-1950
(in millions) “In the period 1850 to 1950, the populations of Africa, Asia, and Europe
roughly doubled. Meanwhile numbers in the Americas, Australia, and Oceania grew much faster, five- or sixfold in 100 years.”
J.R. McNeill, Something New Under the Sun: An Environmental History of the Twentieth-Century World (New York: Norton, 2000), 271-2.
1850 1900 1950 Asia 749 937 1,386
Europe 266 401 576 Africa 95 120 206
North America 26 81 167 Central and South
America 33 63 162
Australia and Oceania
2 6 13
Source: Adapted from J.R. McNeill, Something New Under the Sun: An Environmental History of the Twentieth-Century World (New York: Norton, 2000), 271.

World History for Us All Big Era 8 Landscape 7
http://worldhistoryforusall.sdsu.edu/ Page 27
Lesson 1 Figure 16
Urban Population Proportions by Region
1890-1950 (in percent of total population)
“In the period 1850 to 1950, the populations of Africa, Asia, and Europe roughly doubled. Meanwhile numbers in the Americas, Australia,
and Oceania grew much faster, five- or sixfold in 100 years.”
1890 1910 1930 1950 United States 35 46 56 64
Japan 30 40 48 56 Western Europe 35 45 55 63 Latin America 5 7 17 41
USSR 12 14 18 39 Africa 5 5 7 15 China 5 5 6 11
South Asia 5 8 12 16 World 14 18 23 29
Source: Adapted from J.R. McNeill, Something New Under the Sun: An Environmental History of the Twentieth-Century World (New York: Norton, 2000), 283.

World History for Us All Big Era 8 Landscape 7
http://worldhistoryforusall.sdsu.edu/ Page 28
Lesson 1 Figure 17
World Population 1812-2000
(in billions) “In the period 1850 to 1950, the populations of Africa, Asia, and Europe
roughly doubled. Meanwhile numbers in the Americas, Australia, and Oceania grew much faster, five- or sixfold in 100 years.”
Year 1815 1 1900 1,634 1910 1,746 1920 1,857 1930 2,036 1940 2,267 1950 2,515 1960 3,019 1970 3,698 1980 4,450 1990 5,292 2000 6,100
Source: David Christian, Maps of Time: An Introduction to Big History (Berkeley: University of California Press, 2004). 443; Robert W. Kates, B.L. Turner, II, William C. Clark, “The Great Transformation,” in B.L. Turner II, et al., eds., The Earth as Transformed by Human Action: Global and Regional Changes in the Biosphere over the Past 300 Years (Cambridge: Cambridge UP, 1990), 1.

World History for Us All Big Era 8 Landscape 7
http://worldhistoryforusall.sdsu.edu/ Page 29
Lesson 1 Student Handout 1.1—Chart, Graph, and Quotation Interpretation
1. Title of the chart or graph. 2. Does this graph show regional, global, or both regional and global data?
3. What results did the growth in urban areas have on fresh water use and trace metals in the
atmosphere?
4. How did population increase affect use of land and water for food?
5. What competed with food production for land use?

World History for Us All Big Era 8 Landscape 7
http://worldhistoryforusall.sdsu.edu/ Page 30
Student Handout 1.1 6. What accounts for forest and grassland depletion?
7. What environmental consequences did the internal combustion engine and fossil fuel use have?
8. What environmental consequences did fertilizer use have? 9. Did people generally get richer or poorer in this period? What led to the greater
prosperity or poverty?
World History for Us All Big Era 8 Landscape 7
http://worldhistoryforusall.sdsu.edu/ Page 31
Lesson 1 Student Handout 1.2—Performance Task and Assessment Rubric Use the information from the charts, graphs, quotations, and your notes from our discussion to construct a diagram or model that shows a relationship between population increase, the use of the internal combustion engine, urbanization, and environmental change from 1900 to1950. Your diagram or model does not need to include all the information from the charts, graphs, and quotations. It is more important that in your work, using the evidence, you show the relationship between human activities and change in the earth’s physical environment. Assessment Rubric Awesome! The diagram or model demonstrates both positive and negative effects on the environment from increased population, the internal combustion engine, and urbanization; the diagram or model is clearly labeled and logical; the information is accurate; the diagram or model is artfully crafted. Pretty darn good! The diagram or model demonstrates the effects on the environment from increased population, the internal combustion engine, and urbanization; it is clearly labeled and accurate; it is neatly crafted. Good enough. The diagram or model demonstrates human effects on the environment; it is labeled and neatly crafted. Not yet. A relationship between human action and environmental effects is not demonstrated; it is unclear or incorrect; the work is sloppy.

World History for Us All Big Era 8 Landscape 7
http://worldhistoryforusall.sdsu.edu/ Page 32
Lesson 2 Ideological, Economic, and Political Choices
Causing Environmental Change Preparation Copy and distribute Student Handout 2.1 to each student. Introduction As the human population roughly doubled between 1900 and 1950, beliefs about the human/nature relationship, economic growth, and military power informed decisions about resource use and technology. Nationalist and imperialist agendas fostered industrialization in underdeveloped regions and in fully developed nation-states. This lesson asks students to examine and evaluate ideologies and choices that accelerated change in the earth’s physical environment in the first half of the twentieth century. This lesson is best paired with Lesson 1. Activities 1. Read with your class the excerpts on Student Handout 2.1. Fill in with historical information from the unit’s Introductory Essay, from your own knowledge, and from answering students’ questions. 2. As a class, make a list of positive, negative, and neutral ecological results of the various beliefs. Be sure to remind students that these ideas were what people were thinking in the period 1900-1950, and that they did not know then what we know now about the earth’s physical environment and human effects on it. Also, be sure to complicate the students’ thinking with some of the following questions:
A. If the idea that humans modified nature in ways that were deleterious to it, when, if ever, was it all right to modify the physical environment? For example, was it all right to dam the Nile River to keep water from flooding out homes and crops and to irrigate under-watered crops?
B. Can you think of examples where national pride was more important than protection or
nurturing of the environment? C. What conveniences or labor-saving innovations in this period should people have done
without, for example, cars or refrigerators, to avoid environmental degradation? Could their use have been limited? How?
World History for Us All Big Era 8 Landscape 7
http://worldhistoryforusall.sdsu.edu/ Page 33
D. Help students remember that in the period under study, the deleterious environmental effects of fossil fuel use on the atmosphere, of irrigation and damming on land erosion, and of chemical fertilizer use on the soil and ground water, were largely unknown.
Assessment Performance Task: The period from 1900 to 1950 has been called “The Great Acceleration” owing to the doubling of the world’s population and to the industrial and economic growth made possible by the internal combustion engine and other technological innovations. There was also a great acceleration in the process of degrading the earth’s land, water, and air. Write an editorial evaluating the ideological, political, and economic beliefs that led to this degradation. Include ideas that you think were most detrimental to the earth’s natural environment. Choose a persona from the 1900-1950 period from whose perspective to write. For example, you might choose to be a scientist, statesman, peasant farmer, agri-businessman, hydropower engineer, urban industrial laborer, or economist. Assessment Rubric Awesome! The essay is stylistically original and convincing; the evidence is substantive and gleaned from lessons and additional research; the persona is realistic; historical integrity is maintained; development around a muscular thesis is logical; the mechanics and grammar are correct. Pretty darn good! The essay is convincing; the evidence is substantive and gleaned from lessons; the use of the persona provides perspective; historical integrity is maintained; development around a thesis is logical; the mechanics and grammar are correct. Good enough. The essay has a thesis supported by some evidence from the lessons; perspective is hinted at; the historical ideas are accurate; there is some development of the main idea; some mechanics and grammar are correct. Not yet. The ideas in the essay are not connected or developed, little or no historical evidence is used, or inappropriate evidence is used to support the ideas; grammar and mechanics are problematic.
World History for Us All Big Era 8 Landscape 7
http://worldhistoryforusall.sdsu.edu/ Page 34
Lesson 2 Student Handout 2—Ideological, Political, and Economic Beliefs 1. Beliefs about the human/nature relationship
A. Humanity in harmony with nature: Think about a Taoist sitting in his garden meditating. He hears a gentle waterfall gurgle over pebbles. A bird chirps in rhythm with the Taoist’s heartbeat, a breeze brushes a wisp of hair from his forehead, and the fragrance of lilies pleases his nose. The Taoist gets up and strolls through his garden noticing a fallen tree limb. He picks it up and sets it on a rock in order to meditate later on its gnarled nodes.
B. Humanity as determined by nature: Ancient Greek philosophers taught that humans were
composed of the same elements as the planet: earth, wind, fire, and water, and that balancing these led to physical health. Seventeenth-century American ministers suggested that New England’s earthquakes were the manifestations of society’s sins. Some Native American children are named for an environmental phenomenon, like a lunar eclipse or thunderstorm, that occurred during their birth and that is expected to affect their character as they grow up.
C. Humanity as a modifier of nature: In Genesis, the first book of the Bible, God made
humans to be the custodians of the natural world, an idea found throughout Jewish theology. Karl Marx suggested that “nature exists to be harnessed by labor.” China’s Three Gorges dam is touted by its government as the triumph of humans over nature.
2. Beliefs about economic growth
A. The belief in economic growth maintains that it is good to increase production, distribution, and consumption of goods and services. This idea was held by communists, socialists, capitalists, and fascists. By increasing production, more workers had jobs, and so they had the incomes with which to buy the products of their labor. Owners had profits to reinvest, allowing their businesses to grow. The out-flow of products to buyers resulted in the in-flow of profit to sellers, be they the state, private companies, or individuals. Between 1900 and 1914, some sellers worldwide reaped gigantic profits from markets which became increasingly global, while many more sellers earned profits from relatively smaller regional and local markets. Between World War I and the end of World War II, there were only isolated, short periods of economic growth in the global economy. One example is provided by the sale of arms during the wars. However, after 1945, communist and capitalist nations sought to grow their economies regardless of the cost to the environment. Air pollution over cities like Dresden and Osaka returned after the temporary abatement during the war, and ocean fish stocks began to be depleted after their replenishment during the war, when fishing fleets could not sail.

World History for Us All Big Era 8 Landscape 7
http://worldhistoryforusall.sdsu.edu/ Page 35
B. “Communism aspired to become the universal creed of the twentieth century, but a more flexible and seductive religion succeeded where communism failed: the quest for economic growth. Capitalists, nationalists—indeed almost everyone, communists included—worshiped at this same altar because economic growth disguised a multitude of sins. Indonesians and the Japanese tolerated endless corruption as long as economic growth lasted. Russians and eastern Europeans put up with clumsy surveillance states. Americans and Brazilians accepted vast social inequalities. Social, moral, and ecological ills were sustained in the interest of economic growth; indeed, adherents to the faith proposed that only more growth could resolve such ills. Economic growth became the indispensable ideology of the state nearly everywhere.” Source: J.R. McNeill, Something New Under the Sun: An Environmental History of the Twentieth Century (New York: Norton, 2000), 334.
3. Beliefs about politics: imperialism and nationalism
A. Governments supported economic imperialism because it made for strong economies in nations such as France, Great Britain, the U.S., and Japan. In the West it was justified by the belief that the countries were “civilizing” the areas they colonized, by bringing Christianity and culture to them. For all imperialist nations, an added justification was in the imperialists’ “superiority” over the native populations. Imperialism allowed some areas to begin competing in the global marketplace; it was also one way that modern education was instituted; and it was one way in which modern goods and technology could be of benefit.
B. “As the twentieth century began, Russia, Japan, the United States, and especially the
western European powers had embarked on imperial expansions. This often involved the displacement of existing populations, as in South Africa and Algeria. Colonial powers reoriented local economies toward mining and logging, and toward export monocultures [growing only one crop for profit] of cotton, tea, peanuts, or sisal. Normally these changes were imposed with no thought to environmental consequences: the only goals were to make money for the state and for entrepreneurs, and to assure the mother country ready access to strategic materials. By the 1940s the French and British at least claimed to have local interests at heart when converting as much as possible of Mali to cotton or of Tanganyika to peanut production. But through ecological ignorance they nonetheless brought salinization in the Niger bend region of Mali and turned marginal land into useless hardpan in central Tanganyika.” Source: J.R. McNeill, Something New Under the Sun, 347.
C. Nationalism is, most simply, the belief in the superiority of the nation-state to organize people. Nationalism grew out of the demise of empires, like the Ottoman empire, which collapsed in 1914 and led to the founding of modern nation-states in Egypt and Turkey, as a response to imperialism in places like India and Vietnam, and as a result of economic depression and perceived political emasculation in places like Italy and Germany.

World History for Us All Big Era 8 Landscape 7
http://worldhistoryforusall.sdsu.edu/ Page 36
D. “The vast changes in land use and pollution patterns brought on by industrialization, then, were in part a consequence of nationalisms.
“So were the changes provoked by efforts to populate ‘empty’ frontiers. States earned popular support to settle (and establish firm sovereignty over) the Canadian Arctic, Soviet Siberia, the Australian Outback, Brazilian (not to mention Peruvian and Ecuadorian) Amazonia, and the outer islands of Indonesia. Settling and defending such areas involved considerable environmental change, deforestation in some cases, oil infrastructure in others, and road building in nearly all.
“Nationalism lurked behind other population policies too, notably pronatalism. [Pronatalism is the belief in increasing birth rates as a way of increasing a nation’s number of citizens.] Many twentieth-century states sought security in numbers, especially in Europe where birth rates were sagging. Hypernationalist regimes in particular tried to boost birth rates, in France after the humiliation at the hands of Prussia in 1871, in fascist Italy, and in Nazi Germany.” Source: J.R. McNeill, Something New Under the Sun, 331.
E. “Italy’s emergence as a European and imperial power after 1890 rested on this electrification. Northern Italy created metallurgical, railroad, shipbuilding, aircraft and other strategic industries before, during and especially after World War I.” Source: J.R. McNeill, Something New Under the Sun, 176.
F. “The giant dams [like the Hoover Dam] served larger political purposes wherever they
were built. Communists, democrats, colonialists, and anticolonialists all saw some appeal in big dams. Governments liked the image they suggested: an energetic, determined state capable of taming rivers for the social good. Dams helped to legitimate governments and popularized leaders, something the United States needed more than ever in the Depression years, and something Stalin [Soviet Union], Nehru [India], Nasser [Egypt], Nkrumah [Ghana], and others all sought.” Source: J.R. McNeill, Something New Under the Sun, 157.

World History for Us All Big Era 8 Landscape 7
http://worldhistoryforusall.sdsu.edu/ Page 37
This unit and the Three Essential Questions
In the first half of the twentieth century, was human exploitation and management of the natural and physical environment more beneficial then destructive, or the other way around? What criteria would you develop for answering this question? Would you answer the question differently for the second half of the twentieth century?
Which of these events do you think had the greatest impact on environmental change? How might these events have affected the environment? Was the impact short-term, long-term, or both?
• World War I • The Great Depression • World War II
David Christian has written: “In the course of the twentieth century, human beings have caused changes so decisive, so rapid, and so vast in their scale that they force us to see human history, once again, as an integral part of the history of the biosphere” (Maps of Time, 462). Consider these questions: Is the history of human relationship to the environment basic to understanding all other history—political, social, cultural, and so on? Do world history textbooks pay enough attention to environmental changes in the twentieth century? Might humans look back a hundred years from now and conclude that environmental change was the single most important event of the twentieth century?
This unit and the Seven Key Themes This unit emphasizes: Key Theme 1: Populations in Motion Key Theme 4: Haves and Have-Nots Key Theme 7: Science, Technology, and the Environment

World History for Us All Big Era 8 Landscape 7
http://worldhistoryforusall.sdsu.edu/ Page 38
This unit and the Standards in Historical Thinking Historical Thinking Standard 1: Chronological Thinking The student is able to (C) establish temporal order in constructing historical narratives of their own. Historical Thinking Standard 2: Historical Comprehension The student is able to (F) utilize visual and mathematical data presented in charts, tables, pie and bar graphs, flow charts, Venn diagrams, and other graphic organizers. Historical Thinking Standard 3: Historical Analysis and Interpretation The student is able to (C) compare and contrast differing sets of ideas, values, personalities, behaviors, and institutions. Historical Thinking Standard 4: Historical Research Capabilities The student is able to (C) interrogate historical data. Historical Thinking Standard 5: Historical Issues-Analysis and Decision-Making The student is able to (C) identify relevant historical antecedents.
Resources Resources for teachers Christian, David. Maps of Time: An Introduction to Big History. Berkeley: University of
California Press, 2004. Chapter 14, “The Great Acceleration of the Twentieth Century,” Provides an overview of earth’s ecological history in this period.
McNeill, J.R. Something New Under the Sun: An Environmental History of the Twentieth
Century. New York: Norton, 2000. The major comprehensive text on this topic. Smil, Vaclav. Energy in World History. Boulder: Westview Press, 1994. Chapter 5 discusses the
transition from biomass to fossil fuel use and the results of that transition. Turner, B.L. II, et al., ed. The Earth as Transformed by Human Action: Global and Regional Changes in the Biosphere Over the Past 300 Years. Cambridge: Cambridge UP, 1990. The
collection of essays in this volume covers topics from population and migration to
World History for Us All Big Era 8 Landscape 7
http://worldhistoryforusall.sdsu.edu/ Page 39
technology and chemicals, and changes in the atmosphere, hydrosphere, and biosphere of the earth.
Correlations to National and State Standards National Standards for World History Era 8: A Half-Century of Crisis and Achievement, 1900-1945. 3C: The student understands the interplay between scientific or technological innovations and new patterns of social and cultural life between 1900 and 1940; 5: The student understands major global trends from 1900 to the end of World War II. Therefore the student is able to explain how new technologies and scientific breakthroughs both benefited and imperiled humankind. Illinois Standards of Learning: Social Science State Goal 16: 16.E.5a (W) Analyze how technological and scientific developments have affected human productivity, human comfort, and the environment. Minnesota III. World History. G. Age of Empires and Revolutions, 1640-1920 AD. 1. Students will explain industrial developments and analyze how they brought about urbanization as well as social and environmental changes. Oklahoma Priority Academic Student Skills Grade 7, Standard 5. The student will examine the interactions of humans and their environment.
Conceptual links to other teaching units This teaching unit has explored issues of environmental change during the first half of the twentieth century. From here, we move on to Big Era Nine, “Paradoxes of Global Acceleration, 1945 – Present.” The first Landscape Teaching Unit, titled “World Politics and Global Economy after World War II,” takes us once again to the political and economic scene. However, the unit just completed parallels in subject matter a unit to come in Big Era Nine. This unit is titled “Population Explosion and Environmental Change since 1950” (9.6). Study of both of these units provides opportunities to compare and contrast environmental change in the first half of the century with the transformations that have occurred since 1950.