landcover change, land surface temperature, surface albedo and
TRANSCRIPT
Land 2015, 4, 300-324; doi:10.3390/land4020300
land ISSN 2073-445X
www.mdpi.com/journal/land/
Article
Landcover Change, Land Surface Temperature, Surface Albedo and Topography in the Plateau Region of North-Central Nigeria
Shakirudeen Odunuga * and Gbolahan Badru
Department of Geography, University of Lagos, Lagos 23401, Nigeria; E-Mail: [email protected]
* Author to whom correspondence should be addressed; E-Mail: [email protected];
Tel.: +234-803-723-2665.
Academic Editor: Audrey L. Mayer
Received: 16 December 2014 / Accepted: 26 March 2015 / Published: 17 April 2015
Abstract: This study assessed the change in some environmental parameters in the Plateau
region of North-Central Nigeria (Barakinladi, Jos, and Kafachan environs) using the nexus
of landcover change, land surface temperature, surface albedo, and topography.
The study employed both remote sensing and statistical techniques for the period between
1986 and 2014 to analyze the dynamics between and within these environmental variables.
In Barakinladi, the built up landcover change is highest (increasing from 39.53% to 47.59%
between 1986 and 2014); LST ranges from 19.09 °C to 38.59 °C in 1986 and from 22.68 °C
and 41.68 °C in 2014; and the albedo ranges between 0.014 and 0.154 in 1986 and 0.017 and
0.248 in 2014. In Jos, the built-up landcover occupied 34.26% in 1986 and 36.67% in 2014;
LST values range between 20.83 °C and 41.33 °C in 1986 and between 21.61 °C and
42.64 °C in 2014; and the albedo ranges between 0.003 and 0.211 in 1986 and 0.15 and 0.237
in 2014. In Kafachan area, the built up landcover occupied 32.95% in 1986 and 39.01% in
2014. Urbanization and agricultural activities, including animal grazing, were responsible
for the gradual loss in vegetation and increasing average LST and albedo. The results also
revealed that changing landcover and topography have a relationship with surface albedo
and land surface temperature, thereby impacting significantly on ecosystem services
delivered by the natural system.
Keywords: surface temperature; albedo; Jos-Plateau; land degradation; ecosystem services
OPEN ACCESS

Land 2015, 4 301
1. Introduction
The world is currently experiencing an unprecedented, unanticipated, wave of environmental change.
Unlike previous environmental changes, which were nature-induced and highly localized, the
contemporary forms of environmental changes are universal and can be attributed to anthropogenic
activities. Current environmental changes are discernable in events like biodiversity loss, land
degradation (including deforestation and desertification), depletion of fisheries, declines in major
freshwater aquifers and global dispersion of non-biodegradable chemical pollutants, including increases in
the concentration of CO2, CH4, N2O, O3, and other greenhouse gases in the environment [1–3]. Pertinent,
therefore, among other requirements, is the assemblage of long-term, consistent and comprehensive data
series for climate change research [4–7] to monitor and advise on the best line of action.
Most essential among the wide range of climate data required in local, regional and global
climate/environmental change studies are the Land Surface Temperature (LST) and albedo parameter [8–15].
The LST is a key parameter in land surface processes acting not only as indicator of climate change, but
also control upward terrestrial radiation and consequently the control of the surface sensible and latent
heat flux exchange with the atmosphere [16]. Land surface albedo is the ratio of the radiant flux reflected
from the earth’s surface to the incident flux, and it is a key forcing parameter controlling the planetary
radiative energy budget and partitioning of radiative energy between the atmosphere and surface [14].
Specifically, the changing characters of these parameters have been credibly adjudged to be
responsible for changing the local, regional and global climate [17–19]. Findell et al. [20], in
substantiating this view, asserts that land surface changes induce global warming, particularly through
deforestation, which reduces surface albedo, results in less solar radiation being reflected back into
space, and more being absorbed by the surface, thereby increasing the land surface temperature. Thus,
in as much as LST and Land surface albedo play key roles in the energy balance of any system, they
would, accordingly, affect the systems’ ecosystem service delivery.
With this attached importance, especially in relation to the prominent roles these parameter plays in
climate modeling, energy balance, and other environmental modeling studies, several successful
attempts have been made, while numerous valid algorithms have been developed, to compute their
values from remotely sensed data [11,21–23]. Prominent amongst these algorithms are the radiative
transfer equation; Qin et al. algorithm; Jimenez-Munoz and Sobrino’s algorithm for retrieving LST for
remotely sensed images; and Liang’s algorithm for computing albedo from Landsat digital numbers.
This development, therefore, makes climate/environmental change studies relatively easy to execute for
land surface areas, ranging from local to global, using the synoptic, repetitive, and wide area coverage
capabilities of remote sensing [24,25].
Nigeria, like the rest of the world, has not been immune to the impacts of climate change. In fact, the
unique location of the country, traversing three climatic zones and seven ecological zones [26], makes the
country even more vulnerable to the impacts of changing climatic and environmental externalities [27].
The country, in other words, is being plagued on all fronts through serious coastline erosion, the
pervasive gully erosion in eastern parts of the Rain Forest zone and central Guinea Savannah zone, and
ferocious wind erosion and desertification in the Sahelian zone [28,29]. With these opposing pressures
on its fringes, internal migration towards the center of the country has been pervasive [30].

Land 2015, 4 302
Prominent for its rich agricultural land, scenic landforms and friendly environment, the north-central
part of the country has been under excessive pressure, although traceable to the nineteenth century, with
the advent of farming, cattle herding and the discovery of a large reservoir of tin deposits by the
colonialists, has resulted in tin ore excavation pits, overgrazing by large population of cattle, and clearing
of forest for cultivation. Recent events have further shown that the region now experiences more serious
environmental changes, like flash floods and the drying up of wells [30]. There is also a tremendous
decrease in the natural vegetation of the region, dwindling from 33.59% in 1986 to 19.07% in 2007 [31].
In addition, the region has also in recent years been engulfed with debilitating violence attributed to the
dwindling natural resources and land availability between the pastoralist settler group and the indigenous
farmers [32].
In spite of these events, few studies have been carried out to assess the nexus between changing
climatic parameters (surface temperature and albedo), changing landcover, and the incidence of natural
resource conflict in the region. This study thus assesses the nexus between Land Surface Temperature,
Surface albedo, and Topography in relation to dwindling resources and ecosystem services as well as
the spate of conflicts in the Plateau region of north-central Nigeria.
2. Experimental Section
2.1. Study Area
2.1.1. Location
The study area is located in the north-central part of Nigeria, falling within longitude 7°59′57′′ and
9°15′33′′E and latitude 9°24′59′′ and 10°44′34′′N. Situated on the Jos plateau formation, the area
transverses three (3) states in Nigeria, Plateau, Kaduna, and Bauchi (Figure 1). The area is part of the
largest region in Nigeria with an elevation over 1000 meters and forms a clearly defined highland area,
standing above surrounding plains. It is distinguished by its bounding scarp and bare grassland.
The plateau landscape rises steeply from 200 meters around the plains of River Benue in the South to an
average height of 1200 meters on the Jos plateau (Figure 2). Its highest point is Mt. Shere (1829 meters).
The Jos plateau, in other words, just like other extensive land masses, plays an important role in local
and regional climate through thermal forcing mechanisms and with its surface absorbing large amounts
of incoming solar radiation energy and undergoing seasonal variations of surface heat fluxes [33].
2.1.2. Relief and Drainage
The Jos plateau landscape has been divided into three broad (3) physiographic units: hills and
mountains, dissected terrain, and undulating terrain. The nature of the relief is closely related to the
underlying rock types where the resistant younger and older granites have formed a resistant core through
a long erosional history and still form the hill masses of the present landscape rising to over 1500 m. The
morphology of these hills is largely controlled by the joint pattern. Over much of the plateau, the
underlying rock is obscured by unconsolidated material, and in detail the iron pan largely controls
the relief.

Land 2015, 4 303
Figure 1. Study area.
Figure 2. A view of the study area (Kuru, near Jos on the Jos Plateau).
The drainage system of the plateau is radial and is the source of numerous rivers, including the
Kaduna, Karami and N’gell, which feed the Niger River; the Mada, Ankwe, Dep, Shamanker and Wase,
which flow into the Benue; the Lere, Maijuju and Bagei, supplying the Gongola; and the Kano, Delimi,
Bunga, Jamaari, and Misau, which intermittently nourish Lake Chad. The Plateau’s steep, irregular
southern slopes have many waterfalls, notably among them is the Gurara falls.

Land 2015, 4 304
2.1.3. Weather, Climate and Vegetation
The climate on the plateau is semi-temperate, with temperature ranging from 18 °C to 25 °C while
rainfall is around 2000 mm in the wetter southwest and declines to around 1500mm in the northeast.
Even though the region falls largely within the guinea savannah zone, it possesses an isolated vegetation
unit within the entire Guinea-Congolian/Sudanian regional transition zone. The vegetation unit consists
mainly of short trees, grasses and the plateau type of mosaic vegetation. Specifically, the vegetation of
the Jos plateau reflects interactions with climate, soil and the activities of man. There are six of these
complexes, according to Alford and Tuley [34] and they include:
• The plateau complex; this occurs over the central part of the plateau and contains grassland
and shrubland.
• The Southwest complex; this occurs in the south-western part of the plateau and is covered with
riparian woodland.
• The west escarpment complex; this occurs in the western part of the plateau and is covered with
shrubland and riparian woodland.
• The east escarpment complex; this occurs in the eastern part of the plateau and is also covered with
shrubland and riparian woodland.
• The Toro complex; this occurs mainly on the mainly on the Mongu plains and is covered by shrubland.
• Alluvial complex; this is found intermittently within other complexes and is covered with
riparian woodland.
2.1.4. Human Setting
The study area is originally inhabited by small independent groups, including the Birom, Jerawa, Angas,
Goernai, Afizere, Anaguta, Yourn, Bogghom, Rukkuba, Jukum, Pyern, Buji, and Ron, among others. The
area’s mineral deposit and exceptional climate has overtime attracted numerous groups
from all parts of the country and beyond, making the area highly heterogeneous with over 40
ethno-linguistic groups.
With respect to mineral deposit, the plateau is home to numerous mines. Specifically, it was once,
one of the world’s major suppliers of tin and also has the largest known deposit of columbite. It also
contains ore of niobium, as well as smaller quantities of tantalite, tungsten, kaolin, zircon and uranium.
Lead and iron ore are also found in the eastern and central plateau region. While the mining sites for
most of these mines have been closed, a few of them are still in operation.
Even when the mines were in full operation providing jobs to thousands of people, some inhabitants,
especially the indigenes still engaged extensively in farming. With the closure of most of the mines, a
great deal of attention has been shifted to agriculture specializing in the production of exotic crops like;
Irish potatoes, apples, grapes, wheat, barley and vegetables. In addition, the absence of tsetse fly on the
Plateau, due to its high elevation, and the shortage of pasture in the far northern part of the country, due
to desertification, has also lured Fulani herdsmen to the area. The area in effect has an estimated cattle
population of 1.07 million, half of which graze permanently on the plateau, while the remainder spends
the dry season on the rangeland of the Benue plains and move up to the plateau during the wet season.

Land 2015, 4 305
2.2. Methodology
The study made extensive use of Landsat images due to their archival qualities. The study also utilized
other spatial data, like ASTERDEM, for the topography assessment. The acquired spatial data were
complemented with aspatial data, like population records and other ancillary information.
Figure 3 shows the methodological framework for this study.
Figure 3. The methodological framework for the study.
2.2.1. Data Acquisition
The Characteristics of the acquired spatial and aspatial data utilized in this study are presented in
Table 1 below:
Literature
Data Processing
LU/LC ClassificationUsing Landsat Band 7,4,2
Albedo Computation using Landsat Band
1,3,4, 5 and 7
LST Computation using
Topography based on ASTERDEM
Population Change
Ecosystem Services
including Agricultural
Data Analysis
Climate-induced
Land Change
Data Collection
LANDSAT Image 1986
and 2014
ASTERDEM Image
Spatial Data Aspatial Data

Land 2015, 4 306
Table 1. Data sources and characteristics.
S/N Data Source Scale 1 LANDSAT TM (1986) Landcover.org 30 m 2 LANDSAT ETM+ (2014) Landcover.org 30 m 3 ASTERDEM lpdaac.usgs.gov 30 m 4 Population Records NPC, 1991 and 2006 N/A
2.2.2. Data Processing
The acquired data were processed as follows:
Landcover Classification
Using bands 7, 4 and 2 of Landsat TM (1986) and Landsat ETM+ (2014), color composites of the
area of interest were generated. A hierarchical classification scheme, which takes into consideration the
characteristics of the multi-date remotely sensed data and the physical and human setting of the study
area, was also developed. The developed classification scheme is a modified USGS (United State
Geological Survey) classification scheme with the primary level having the following Landcover classes:
• Vegetation
• Water body
• Built up
• Cultivation/Bare surface
The composed Landsat images (1986 and 2014) were thus classified based on the developed scheme
using supervised classification techniques with maximum likelihood classification algorithm in ENVI
remote sensing software.
Land Surface Temperature (LST) Computation
To compute the LST, the study adopted the algorithms developed by NASA, (2008) and Artis and
Carnahan [35] (Equations (1) and (2)). The LST retrieval process in essence entails the use of the
corrected reflectance for the thermal band of Landsat image (Band 6 for TM and Band 10 for
Landsat ETM+) in conjunction with the formulae. TB = K2In (K1/Lλ + 1) (1)
LST = TB1 + (λ ∗ TB/ρ) (2)
where TB = at satellite brightness temperature; Lλ = spectral radiance; λ = 11.457 μm; ρ = 0.01438;
and ε = emissivity (0.95).

Land 2015, 4 307
Albedo Computation
For the computation of albedo, bands 1, 3, 4, 5, and 7 for Landsat TM and Landsat ETM+ were
downloaded and converted from .tiff format to .img so as to identify the digital numbers (DN).
The converted Landsat bands were then converted to radiance using Equation (3).
Lλ = (Gainλ × Dn) + Biasλ (3)
where Lλ = radiance (in watts/(sq. meter × μm × ster); Gain = (Lmax – Lmin)/255; Bias = Lmin;
and Dn = Digital Number of the Landsat band.
The obtained radiance values for the bands were further processed to obtain the at-surface reflectance
(Rλ) for the bands using Equation (4). Rλ = π × Lλ × d2Esun, λ × Sin(SE) (4)
where Rλ = at surface reflectance; π = 3.142; Lλ = radiance calculated with formula (1); d = earth-sun distance; Esun, λ = band-specific radiance emitted by the sun; θSE = Sun elevation angle.
During the conversion of the Landsat band from radiance to reflectance, small negative reflectance
errors were created. These are not physical and thus would require correction. The reflectance errors
were corrected using Equation (5)
Rλc = CON ([reflectance] < 0.0, 0.0, [reflectance]) (5)
The corrected reflectance for bands 1, 3, 4, 5 and 7 were then used to calculate the albedo (α) using
Equation (6) [21]. α = 0.356Rλc1 + 0.130Rλc3 + 0.373 Rλc4 + 0.085 Rλc5 + 0.072Rλc7– 0.00180.356 + 0.130 + 0.373 + 0.085 + 0.072 (6)
Data Cleaning and Configuration
In preparation for data analysis, equal areas covering three major contiguous environments in the
study area were delineated from the range of processed raster data to ensure a streamlined, focused and
in-depth assessment of the relationship between the parameters of interest. The regions delineated
include Jos area and Barakinladi in Plateau state and Kafachan in Kaduna state. These areas were
selected based on the following criteria:
• their history of Landcover change and degradation;
• their history of resource conflicts;
• their altitude morphology (Barakinladi having the highest and Kafachan the lowest; and
• contiguous socioeconomic activities and settlement characteristics.
To further prepare the data for analysis, the delineated raster data for the three (3) regions, for each
parameter and for the two years of interest (1986 and 2014) were all converted to point data for ease of analysis.

Land 2015, 4 308
Analysis of Inter/Intra-Relationships
Hypotheses to test the impacts of the parameters of interest (Topography, albedo and LST) on
landcover for each of the regions, Barakinladi, Jos and Kafachan, were formulated. The hypothesis
states that:
Ho: μ1 = μ2 = μ3 (7)
Ha: μ1 ≠ μ2≠ μ3 (8)
where μ1 = Topography; μ2 = Albedo; μ3 = LST.
To test these null hypotheses, the extracted processed data were all imported into the Statistical
Package for Social Sciences (SPSS) where the Levene’s Test of Homogeneity of Variances, Welch
statistic and the single factor ANOVA at an alpha level of .05 was executed to see if a significant
difference was present between the Landcover and the other parameters for the two years (1986 and
2014) considered in the study.
A post hoc test (Games–Howell), also at an alpha level of .05, was then performed to test for the
particular significant differences between the albedo, LST and topography values associated with the
Landcover within and between each image.
LST and Albedo Weighted Average Computation
The weighted average for the LST and albedo for the regions of interest and for the two years were
calculated using the formula 9 below:
(x1 × a1 + x2 × a2…xn × an)/(x1 + x1 +...xn) (9)
X1 = % landcover type 1; a1 = % LST or Albedo for land cover 1.
3. Results and Discussion
3.1. Landcover, LST, Albedo and Topography Dynamics in the Study Area
3.1.1. Landcover Change
Tables 2–4 and Figure 4 show the static Landcover in 1986 and 2014 for Kafachan, Barakinladi and
Jos, respectively. The trend as depicted shows a continuous reduction in vegetal cover in all the three
locations. This can be attributed to intense urban growth and expanding agricultural activities, especially
grazing by ever increasing number of cattle in the area. The dynamics is such that while vegetal cover
was decreasing (negative change), the built up area on the other hand was increasing (positive change).
Continuous reduction in vegetation cover in the region is further exerting other environmental pressures
including soil erosion and mass wasting. For instance, gully erosion sites and badlands have been
observed to be increasing in Bukuru area of Jos in recent time while agricultural activities including
animal grazing were possibly responsible for the gradual increase in unproductive bare surfaces in
Kafachan. Figure 4 shows the landcover maps (1986 and 2014) for the three study locations.

Land 2015, 4 309
Figure 4. Landcover change in the three regions.
Land 2015, 4 310
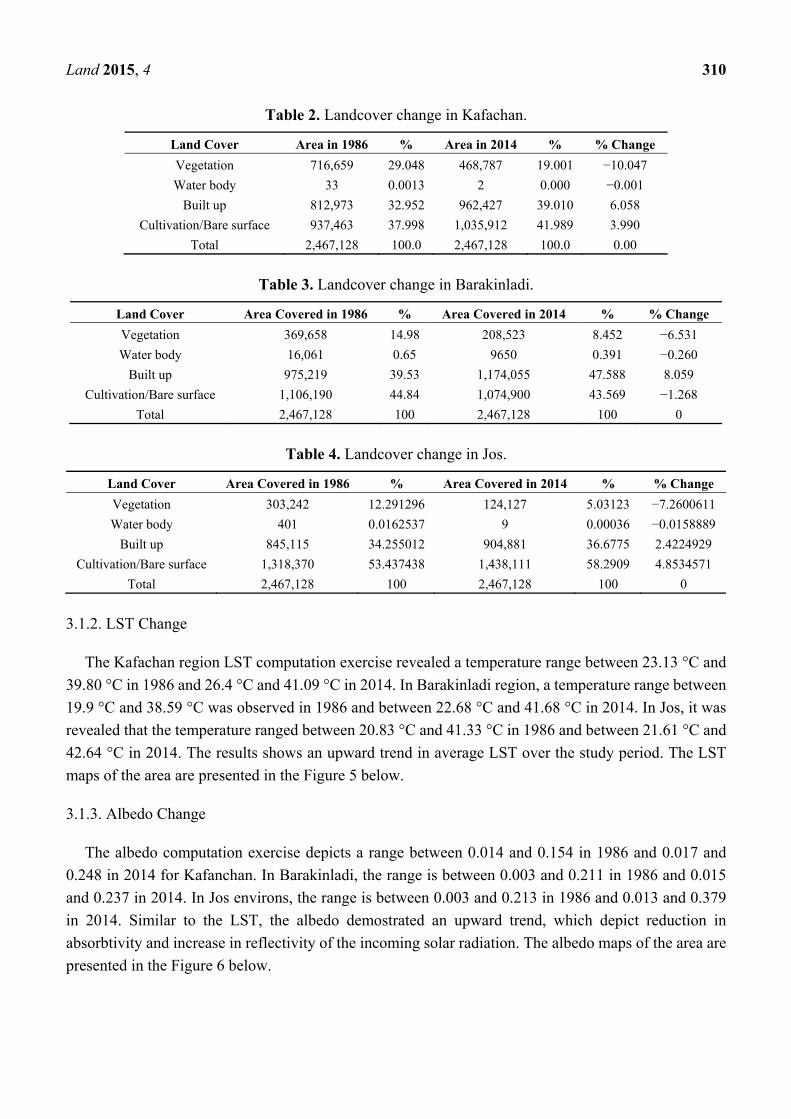
Table 2. Landcover change in Kafachan.
Land Cover Area in 1986 % Area in 2014 % % Change
Vegetation 716,659 29.048 468,787 19.001 −10.047
Water body 33 0.0013 2 0.000 −0.001
Built up 812,973 32.952 962,427 39.010 6.058
Cultivation/Bare surface 937,463 37.998 1,035,912 41.989 3.990
Total 2,467,128 100.0 2,467,128 100.0 0.00
Table 3. Landcover change in Barakinladi.
Land Cover Area Covered in 1986 % Area Covered in 2014 % % Change
Vegetation 369,658 14.98 208,523 8.452 −6.531
Water body 16,061 0.65 9650 0.391 −0.260
Built up 975,219 39.53 1,174,055 47.588 8.059
Cultivation/Bare surface 1,106,190 44.84 1,074,900 43.569 −1.268
Total 2,467,128 100 2,467,128 100 0
Table 4. Landcover change in Jos.
Land Cover Area Covered in 1986 % Area Covered in 2014 % % Change
Vegetation 303,242 12.291296 124,127 5.03123 −7.2600611
Water body 401 0.0162537 9 0.00036 −0.0158889
Built up 845,115 34.255012 904,881 36.6775 2.4224929
Cultivation/Bare surface 1,318,370 53.437438 1,438,111 58.2909 4.8534571
Total 2,467,128 100 2,467,128 100 0
3.1.2. LST Change
The Kafachan region LST computation exercise revealed a temperature range between 23.13 °C and
39.80 °C in 1986 and 26.4 °C and 41.09 °C in 2014. In Barakinladi region, a temperature range between
19.9 °C and 38.59 °C was observed in 1986 and between 22.68 °C and 41.68 °C in 2014. In Jos, it was
revealed that the temperature ranged between 20.83 °C and 41.33 °C in 1986 and between 21.61 °C and
42.64 °C in 2014. The results shows an upward trend in average LST over the study period. The LST
maps of the area are presented in the Figure 5 below.
3.1.3. Albedo Change
The albedo computation exercise depicts a range between 0.014 and 0.154 in 1986 and 0.017 and
0.248 in 2014 for Kafanchan. In Barakinladi, the range is between 0.003 and 0.211 in 1986 and 0.015
and 0.237 in 2014. In Jos environs, the range is between 0.003 and 0.213 in 1986 and 0.013 and 0.379
in 2014. Similar to the LST, the albedo demostrated an upward trend, which depict reduction in
absorbtivity and increase in reflectivity of the incoming solar radiation. The albedo maps of the area are
presented in the Figure 6 below.

Land 2015, 4 311
Figure 5. LST change in the three regions.
3.1.4. Difference in Altitude
The altitude in Kafanchan ranges between 0 and 1258 m amsl while that of Barakinladi ranges
between 0 and 1614 m amsl. The topography in Jos, however, ranges between 0 and 1752 m amsl.
The topography in the three region are presented in the Figure 7.

Land 2015, 4 312
Figure 6. Albedo change in the three regions.
3.2. Inter/Intra Relationship between the Parameters
Starting with the Kafachan region in 1986, the results revealed that the built-up landcover had the
highest mean elevation values (799.5 m amsl), while water bodies had the lowest mean altitude value
(0 m amsl). The trend in the Albedo and LST are similar, with built-up having the highest mean values
(0.0789 °C, 30.702 °C) while water body landcover had the lowest values (0.0221 °C, 25.593 °C).
This is presented in Table 5 and Figure 8 below.

Land 2015, 4 313
Figure 7. Topography in the three regions.
Table 5. Mean elevation, mean albedo and mean LST across land cover types in Kafachan in 1986.
Land Cover Mean Elevation (m) Albedo LST (°C)
Vegetation 791.81 0.068 28.825 Water body 0 0.0221 25.593
Built up 799.50 0.0789 30.702 Cultivation/Bare surface 795.55 0.0721 30.215
Within the Barakinladi region in 1986, the analyzed data revealed that all landcover types had
significantly different mean topography, albedo and LST values (p < 0.001). Specifically, the water body
landcover class had the highest mean altitude of 1206.5 m amsl (source of rivers from high elevation)
followed by the built-up (1168.1 m amsl), cultivation/bare surface (1160.9 m amsl) and then vegetation
(1152.6 m amsl). In the same vein, and with regards to the albedo values, built-up class had the highest
mean (0.082), followed by cultivation/baresurface (0.071), vegetation (0.063) and water body (0.039).
In the case of the LST values, it was revealed that the built up landcover class had the highest mean
values (32.89 °C) while the water body landcover class had the lowest mean LST values (23.94 °C).
This is presented in Table 6 and Figure 9 below.
Table 6. Mean topography, mean albedo and mean LST across land cover types in Barakinladi in1986.
Land Cover Topography (m) Albedo LST (°C)
Vegetation 1152.61 0.063 29.536 Water body 1206.49 0.039 23.943
Built up 1168.11 0.082 32.894 Cultivation/Bare surface 1160.91 0.071 32.150

Land 2015, 4 314
Figure 8. Landcover, LST, topography and albedo in Kafachan in 1986.
Figure 9. Landcover, LST, topography and albedo in Barakinladi in 1986.
Land 2015, 4 315
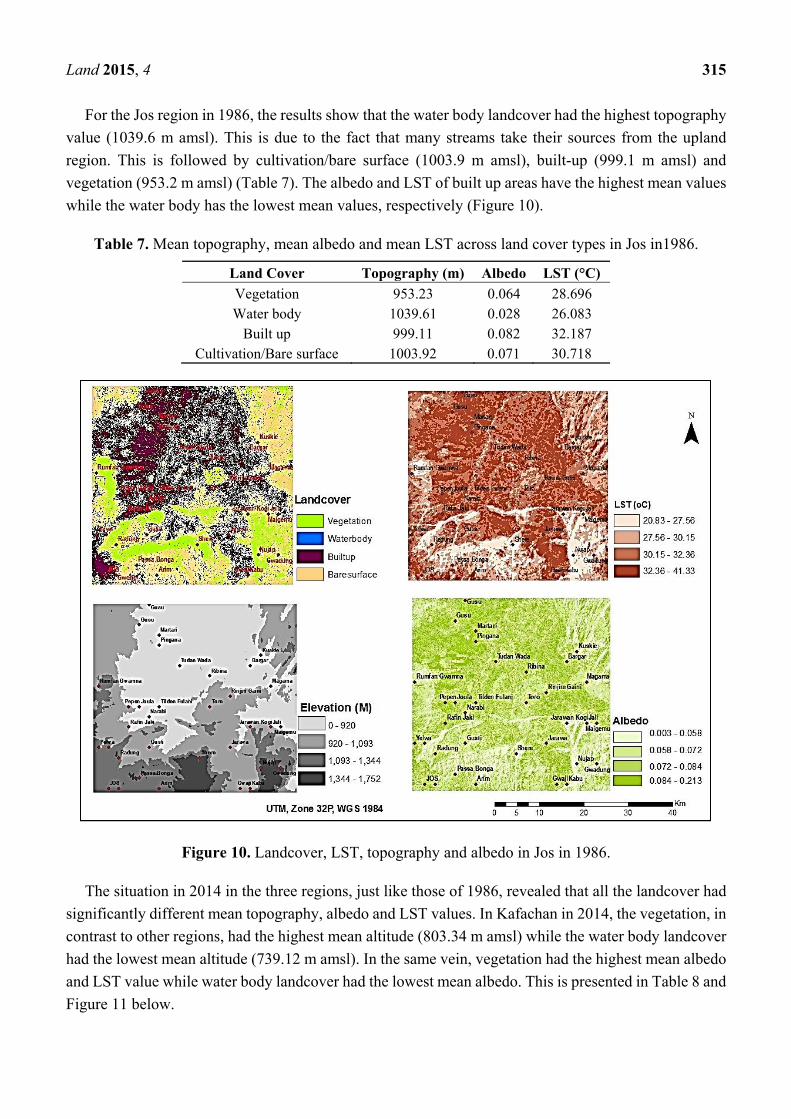
For the Jos region in 1986, the results show that the water body landcover had the highest topography
value (1039.6 m amsl). This is due to the fact that many streams take their sources from the upland
region. This is followed by cultivation/bare surface (1003.9 m amsl), built-up (999.1 m amsl) and
vegetation (953.2 m amsl) (Table 7). The albedo and LST of built up areas have the highest mean values
while the water body has the lowest mean values, respectively (Figure 10).
Table 7. Mean topography, mean albedo and mean LST across land cover types in Jos in1986.
Land Cover Topography (m) Albedo LST (°C)
Vegetation 953.23 0.064 28.696 Water body 1039.61 0.028 26.083
Built up 999.11 0.082 32.187 Cultivation/Bare surface 1003.92 0.071 30.718
Figure 10. Landcover, LST, topography and albedo in Jos in 1986.
The situation in 2014 in the three regions, just like those of 1986, revealed that all the landcover had
significantly different mean topography, albedo and LST values. In Kafachan in 2014, the vegetation, in
contrast to other regions, had the highest mean altitude (803.34 m amsl) while the water body landcover
had the lowest mean altitude (739.12 m amsl). In the same vein, vegetation had the highest mean albedo
and LST value while water body landcover had the lowest mean albedo. This is presented in Table 8 and
Figure 11 below.
Land 2015, 4 316
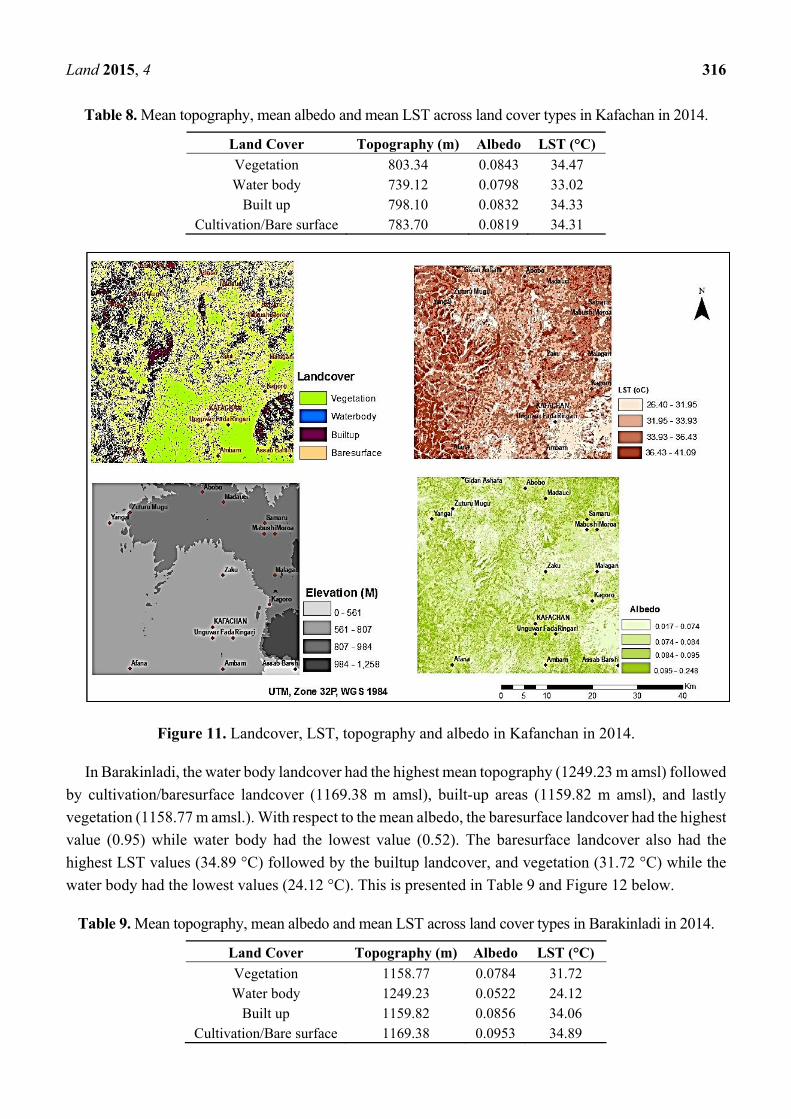
Table 8. Mean topography, mean albedo and mean LST across land cover types in Kafachan in 2014.
Land Cover Topography (m) Albedo LST (°C)
Vegetation 803.34 0.0843 34.47 Water body 739.12 0.0798 33.02
Built up 798.10 0.0832 34.33 Cultivation/Bare surface 783.70 0.0819 34.31
Figure 11. Landcover, LST, topography and albedo in Kafanchan in 2014.
In Barakinladi, the water body landcover had the highest mean topography (1249.23 m amsl) followed
by cultivation/baresurface landcover (1169.38 m amsl), built-up areas (1159.82 m amsl), and lastly
vegetation (1158.77 m amsl.). With respect to the mean albedo, the baresurface landcover had the highest
value (0.95) while water body had the lowest value (0.52). The baresurface landcover also had the
highest LST values (34.89 °C) followed by the builtup landcover, and vegetation (31.72 °C) while the
water body had the lowest values (24.12 °C). This is presented in Table 9 and Figure 12 below.
Table 9. Mean topography, mean albedo and mean LST across land cover types in Barakinladi in 2014.
Land Cover Topography (m) Albedo LST (°C)
Vegetation 1158.77 0.0784 31.72 Water body 1249.23 0.0522 24.12
Built up 1159.82 0.0856 34.06 Cultivation/Bare surface 1169.38 0.0953 34.89

Land 2015, 4 317
Figure 12. Landcover, LST, albedo and topography in Barakinladi in 2014.
The analyzed data for the Jos region in 2014 revealed that the cultivation/bare surface in particular
had the highest mean topography values (1012.21 m amsl) while the built-up landcover had the lowest
mean topography (984.42 amsl). In the same vein, the water body landcover had the highest mean albedo
(0.1070) while cultivation/baresurface had the lowest (0.0983). Water body, however, had the highest
mean LST values (35.81 °C) while vegetation had the lowest mean temperature values (34.80 °C). This
is presented in Table 10 and Figure 13 below.
When comparing the topography, albedo and LST values between the three regions, significant
differences were also revealed (Table 11). Explicitly, while vegetation landcover had the highest mean
topography in Kafachan (803.3 m), water body had the highest mean topography in Jos (1012.2 m) and
Barakinladi (1249.2 m).
Table 10. Mean topography, mean albedo and mean LST across land cover types in Jos in 2014.
Land Cover Topography (m) Albedo LST (°C)
Vegetation 988.32 0.0986 34.81 Water body 1001.34 0.1070 35.81
Built up 984.42 0.0986 34.76 Cultivation/Bare surface 1012.21 0.0983 34.80
In the case of albedo and LST values, the built-up and baresurface landcover had the highest mean
values in Barakinladi. This was, however, different in Jos where water body had the highest albedo and
lowest LST values in 1986 and built-up had the highest albedo and LST values in 2014.

Land 2015, 4 318
Across the regions, the analyzed data revealed that there is an increase in the values of all parameters
under all landcover types (Tables 12 and 13).
Figure 13. Landcover, LST, albedo, and topography in Jos in 2014.
Table 11. Mean topography across landcover and regions.
Land Cover KAF BAR JOS
Vegetation 803.34 1158.77 988.32
Water body 739.12 1249.23 1001.34
Built up 798.10 1159.82 984.42
Bare surface 783.70 1169.38 1012.21
Table 12. Mean albedo across landcover and regions.
Land Cover KAF ALB 86 BAR ALB 86 JOS ALB 86 KAF ALB 14 BAR ALB 14 JOS ALB 14
Vegetation 0.0716 0.0785 0.0749 0.0843 0.0683 0.0986
Water body 0.0670 0.0523 0.0846 0.0798 0.0457 0.1070
Built up 0.0713 0.0856 0.0751 0.0832 0.0745 0.0986
Bare surface 0.0712 0.0953 0.0743 0.0818 0.0781 0.0983
Total 0.0712 0.0891 0.0748 0.08270 0.0755 0.0985

Land 2015, 4 319
Table 13. Mean land surface temperature (LST) (°C) across landcover and regions.
Land Cover KAF LST 86 BAR LST 86 JOS LST 86 KAF LST 14 BAR LST 14 JOS LST 14
Vegetation 29.79 30.89 31.05 34.47 31.72 34.81
Water body 28.34 23.25 32.97 33.02 24.12 35.81
Built up 29.72 32.36 31.03 34.32 34.06 34.76
Bare surface 29.66 32.62 31.00 34.31 34.89 34.80
Total 29.69 32.31 31.05 34.32 34.19 34.79
With respect to the weighted averages, it was revealed that there was an increase in the weighted
value of albedo and LST in the three regions (Table 14). Specifically, the study shows that the LST
weighted averages increased from 1.2905 to 1.3056 while and albedo weighted averages increased from
1.2125 to 1.5543 in Kafanchan between 1986 and 2014. The same applies to Barakinladi where albedo
increased from 1.8420 to 2.5088 and LST from 1.8103 to 2.5088 between 1986 and 2014. In the case of
Jos, an increase was also discovered in the weighted values of albedo and LST, where the albedo
increased from 2.1356 to 4.4037 and LST increased from 2.136 to 4.2035 between 1986 and 2014.
Table 14. Weighted values of albedo and LST between 1986 and 2014 in the three selected regions.
Location ALB_86 ALB_14 LST_86 LST_14
Kafanchan 1.2905 1.3056 1.2125 1.5543
Barakinladi 1.842 2.5088 1.8103 2.5088
Jos 2.1356 4.4037 2.1356 4.2035
3.3. Discussion
This study has shown that large-scale landcover change is evident in all the study locations under
investigation. It has also intricately revealed that the most affected landcover are the vegetation and
built-up landcover with the vegetation landcover decreasing and the built-up landcover increasing.
In addition, it has shown that all the changing landcover types differed in their relation to topography,
surface albedo and land surface temperature values implying a direct relationship. It has also depicted
that surface albedo, LST, and topography differed between the years and within all the landcover types.
It thus distinctly confirmed the increasing trend in the values of the parameters under consideration
(albedo and LST) from 1986 to 2014.
Even though the results of the study are consistent with previous studies with regards to the
relationship between albedo and LST and the landcover types, it has gone ahead of others by including
the impact and role of topography in all of these fluxes. In other words, while corroborating the results
of earlier studies by asserting that lower albedo are found over vegetated areas while higher albedo were
found over bare surface and built up areas and also confirming that built-up and baresurface exhibits the
highest mean LST while vegetation and water body portray the lowest mean LST, this study has
specifically added to the discussion by revealing a consistency in the impact of topography on the
different types of landcover and the resultant impacts on the albedo and LST.
The above-illustrated results, especially those that relate to the nexus between LST value and
vegetation landcover as explained by Xu et al. [36], can be attributed to the dampening effect of

Land 2015, 4 320
vegetation cover due to the cooling effect of shading and evapo-transpiration, which in no small measure
explains its low LST values, whereas the high insolation (caused by low cloud cover), low heat capacity,
and lack of evaporative cooling (caused by low vegetation cover) of bare surface and built-up areas
explain their high temperature. The relatively low temperature of water was also explained by its rather
high thermal and evapo-transpiration capacity.
With regards to the impact of topography, van de Kerchove et al. [37] explained that in view of the
fact that topography controls surface temperatures by changing the air temperature due to the
environmental lapse rate and since surface temperatures are connected to air temperatures, LST tends to
decrease with increasing elevation. In the case of the albedo, Kvalevag et al. [38] rightly opined that
when surface albedo increases, less solar radiation is absorbed by the surface and the result is a surface
cooling. This invariably means that land surface temperature is determined in part by surface albedo,
which is how much surface insolation is reflected back to space. Thus, at low albedo more solar energy
is absorbed leading to an increase in surface temperature.
3.4. Implication for Ecosystem Service Delivery and Resource Conflict
The results of the study as presented have over-riding implications with the increase in LST and
albedo and decrease in vegetation and water body land covers advertently affecting ecosystem service
delivery in the study area. This is more so as changing land cover, especially in the Jos plateau area,
which plays an important role in local and regional climate directly influences weather conditions in the
surroundings, either because of varying albedo or varying CO2 exchange between plant respiration
processes. Specifically, the implication for ecosystem service delivery comes from the assertion that
ecosystems are regulated by climate and climate is to some degree determined by natural ecosystems.
In essence, climate variability will cause shifts in the structure, composition, and functioning of
ecosystems affecting plants, insects and animals that are highly specialized and adapted to the landscape,
with increasing temperature altering their range, type, and number.
Loss of, or decreasing, vegetation cover in the area also propagates land degradation via land
surface-atmosphere feedback through reduction in evaporation and increase in the radiation reflected
back to the atmosphere (albedo), consequently reducing cloud formation and in essence precipitation.
The situation in the area can thus be advertently linked to global environmental change with land cover
change at the center, which increases land degradation by reducing cultivable and pasture land or through
the immigration especially from the Northern lowlands, which is already seriously suffering from land
degradation in the form of desertification. The profound implication of all these is that the ecosystem
services (agriculture and grazing land) provided by the land resources in the region are being seriously
impacted by excessive competition and overburdening of land resources.
The social dimension to the issue is evident in the rising strings of debilitating conflicts bedeviling
the area. Hence, the area which was once prominent for its peaceful, scenic and amiable environment
attracting individuals and investments from the world over is being overwhelmed by inter-communal
conflicts traceable to 1992 in Kaduna State and 2001 in Plateau State [39]. These conflicts, which
unswervingly stem from longstanding disputes over land, political and economic privileges between
indigenous groups, who are predominantly farmers, and settler ethnic groups, who are mostly
nomads [40], have resulted in the death of over 10,000 people [39].

Land 2015, 4 321
4. Conclusions
This study analyzed the spatiotemporal dimension of landcover change, land surface temperature and
surface albedo in the Plateau region of north-central Nigeria. In addition to ascertaining the
multi-correlation of these parameters in similar studies, it has added to it the relevance of topography to
explain the observed pattern in the environmental parameters. The connections with change in climate
and incidence of conflicts in the region were brought to foreshore. A sustainable regional developmental
plan to control anthropogenic activities, including farming and grazing activities, is recommended. This
is to sustain, not only the beautiful scenery and aesthetics the region is known for, but also to protect the
ecosystem services provided by the environment in an all-encompassing approach.
Acknowledgment
We would like to thank the two anonymous reviewers for their very useful comments, and also the
Journal Editorial Office for their always present support.
Author Contributions
This research work was conceived by Shakirudeen Odunuga. The two authors were however involved
in the design of the methodology, data collection, analysis and report writing.
Conflict of Interest
The authors declare no conflict of interest.
References
1. McMichael, A.J.; Patz, J.; Kovats, R.S. Impacts of global environmental change on future health
and health care in tropical countries. Br. Med. Bull. 1998, 54, 475–488.
2. Bates, B.C.; Kundzewicz, Z.W.; Wu, S.; Palutikof, J.P. Climate Change and Water; Technical Paper
of the Intergovernmental Panel on Climate Change; IPCC Secretariat: Geneva, Switzerland, 2008.
3. Simms, A. Up in Smoke? Latin America and the Caribbean: The Threat from Climate Change to
the Environment and Human Development; The 3rd Report from the Working Group on Climate
Change and Development; New Economics Foundation: London, UK, 2006.
4. Nigerian Environmental Study/Action Team (NEST). Regional Climate Modelling and Climate
Scenarios Development in Support of Vulnerability and Adaptation Studies: Outcome of Regional
Climate Modeling Efforts over Nigeria; NEST: Ibadan, Nigeria, 2004.
5. IPCC. Contribution of working group I to the fourth assessment report of the intergovernmental
panel on climate change. In Climate Change 2007: The Physical Science Basis; Cambridge
University Press: Cambridge, UK, 2007; pp. 1–996.
6. Ajibade, I.M. Climate Change and Human Rights: A Case Study of Vulnerability and Adaptation
in Coastal Communities in Lagos, Nigeria. Ph.D. Thesis, University of Western Ontario, London,
ON, Canada, 2013

Land 2015, 4 322
7. Pinheiro, A.C.T.; Privette, J.L.; Bates, J.J.; Pedelty, J. Satellite retrieval of land surface temperature:
Challenges and opportunities. In Earth Science Satellite Remote Sensing Science; Qu, J.J., Gao, W.,
Lafatos, M., Murphy, R.E., Salomonson, V.V., Eds.; Springer Verlag: Berlin, Germany, 2005;
Volume 1, pp. 69–87
8. Barton, I.J. Satellite-derived sea surface temperatures: A comparison between operational,
theoretical and experimental algorithms. J. Appl. Meteorol. 1992, 31, 432–442.
9. Lagouarde, J.P.; Kerr, Y.H.; Brunet, Y. An experimental study of angular effects on surface
temperature for various plant canopies and bare soils. Agric. For. Meteorol. 1995, 77, 167–190.
10. Qin, Z.; Karnieli, A.; Berliner, P. A mono-window algorithm for retrieving land surface temperature
from Landsat TM data and its application to the Israel-Egypt border region. Int. J. Remote Sens.
2001, 22, 3719–3746.
11. Dash, P.; Göttsche, F.M.; Olesen, F.S.; Fischer, H. Land surface temperature and emissivity
estimation from passive sensor data: Theory and practice current trends. Int. J. Remote Sens. 2002,
23, 2563–2594.
12. Schmugge, T.; French, A.; Ritchie, J.C.; Rango, A.; Pelgrum, H. Temperature and emissivity separation
from multispectral thermal infrared observations. Remote Sens. Environ.2002, 79, 189–198.
13. Igusky, K. Quantifying Albedo and Surface Temperature over Different Landcovers: Implications
for Carbon Offsets. Master’s Thesis, Duke University, Durham, NC, USA, 2008.
14. Schaaf, C.B. Albedo and Reflectance Anisotropy: Assessment of the Status of the Development of
the Standards for the Terrestrial Essential Climate Variables; Global Terrestrial Observing System:
Rome, Italy, 2009.
15. Preuschmann, S. Regional Surface Albedo Characteristics-Analysis of Albedo Data and
Application to Land-Cover Changes for a Regional Climate Model. Ph.D. Thesis, Hamburg
University, Hamburg, Germany, 2012.
16. Aires, F.; Prigent, C.; Rossow, W.B.; Rothstein, M. A new neural network approach including
first-guess for retrieval of atmospheric water vapor, cloud liquid water path, surface temperature and
emissivities over land from satellite microwave observations, J. Geophys Res. 2001, 106,
14887–14907.
17. Pitman, A.J.; Narisma, G.T.; Pielke, R.A., Sr.; Holbrook, N.J. Impact of land cover change on the
climate of Southwest Western Australia. J. Geophys. Res. 2004, 109, doi:10.1029/2003JD004347.
18. McAlpine, C.A.; Syktus, J.; Deo, R.C.; Lawrence, P.J.; McGowan, H.A.; Watterson, I.G.; Phinn, S.R.
Modeling the impact of historical land cover change on Australia’s regional climate. Geophys. Res.
Lett. 2007, 34, doi:10.1029/2007GL031524.
19. Nair, U.S.; Ray, D.K.; Wang, J.; Christopher, S.A.; Lyons, T.J.; Welch, R.M.; Pielke, R.A., Sr.
Observational estimates of radiative forcing due to land use change in Southwest Australia.
J. Geophys. Res. 2007, 112, doi:10.1029/2006JD007505.
20. Findell, K.L.; Shevliakova, E.; Milly, P.C.D.; Stouffer, R.J. Modelled impact of anthropogenic
landcover change on climate. J. Clim. 2007, 20, 3621–3634.
21. Liang, S. Narrowband to broadband conversions of land surface albedo. I: Algorithms. Remote Sens.
Environ. 2000, 76, 213–238.
22. Sobrino, J.A.; Li, Z.L.; Soria, G.; Jiménez, J.C. Land surface temperature and emissivity retrieval
from remote sensing data. Recent Res. Dev. Geophys. 2002, 4, 21–44.

Land 2015, 4 323
23. Kerr, Y.H.; Lagouarde, J.P.; Nerry, F.; Ottlé, C. Land surface temperature retrieval techniques and
applications: Case of AVHRR. In Thermal Remote Sensing in Land Surface Processes;
Quattrochi, D.A., Luvall, J.C., Eds.; CRC Press: Boca Raton, FL, USA, 2004; pp. 33–109.
24. Owen, T.W.; Carlson, T.N.; Gillies, R.R. Remotly sensed surface parameters governing urban
climate change. Int. J. Remote Sens. 1998, 19, 1663–1681.
25. Tasumi, M.; Allen, R.G.; Trezza, R. At-surface reflectance and albedo from satellite for operational
calculation of land surface energy balance. J. Hydrol. Eng. 2008, 13, 51–63.
26. Ojo, O. The Climates of West Africa; Heineman: London, UK, 1977.
27. Abiodun, B.J.; Salami, A.T.; Tadross, M. Climate Change Scenarios for Nigeria: Understanding
Biophysical Impacts; Climate Systems Analysis Group, Cape Town, for Building Nigeria’s
Response to Climate Change Project; Nigerian Environmental Study/Action Team (NEST): Ibadan,
Nigeria, 2011.
28. Building Nigeria’s Response to Climate Change (BNRCC). Annual workshop of Nigerian
Environmental Study Team (NEST): The recent global and local action on climate change. In
Proceedings of the Building Nigeria’s Response to Climate Change, Abuja, Nigeria, 8–9 October
2008.
29. Akor, G. Climate change and agriculture: The Nigerian story. In Proceedings of the Conference
Presentation FES, Accra, Ghana, 10–11 April 2012.
30. Werz, M.; Conley, M. Climate Change, Migration and Conflict in Northwest Africa: Rising
Dangers and Policy Options Across the Arc of Tension; Centre for American Progress: Washington,
DC, USA, 2012.
31. Osunmadewa, B.A.; Enokela, S.E. Remote sensing and GIS for assessing land use landcover
Change: A case study of Jos and environs, Plateau State Nigeria. In Proceedings of the Tropentag,
Development on the Margin, Bonn, Germany, 5–7 October 2011.
32. Okelo, A.N.; Majekodunmi, A.O.; Malala, A.; Welburn, S.C.; Smith, J. Identifying motivators for
state-pastoralist dialogue: Exploring the relationships between livestock services, self-organisation
and conflict in Nigeria’s pastoralist Fulani. Pastoralism 2014, 4, doi:10.1186/s13570-014-0012-7.
33. Ye, D.Z.; Gao, Y.X. Meteorology of Qinghai–Xizhang (Tibet) Plateau; Science Press: Beijing,
China, 1979.
34. Alford, M.T.; Hill, I.D.; Rackham, L.J; Tuley, P. The Jos Plateau, a survey of environment and land
use. In Occasional Publications (New Series); Morgan, W.T.W., Ed.; University of Durham:
England, UK, 1979.
35. Artis, D.A.; Carnahan, W.H. Survey of emissivity variability in thermography of urban areas.
Remote Sens. Environ. 1982, 12, 313–329.
36. Xu, L.; Myneni, R.B.; Chapin, F.S., III; Callaghan, T.V.; Pinzon, J.E.; Tucker, C.J.; Zhu, Z.; Bi, J.;
Ciais, P.; Tømmervik, H.; et al. Temperature and vegetation seasonality diminishment over northern
lands. Nat. Clim. Change 2013, doi:10.1038/NCLIMATE1836.
37. Van de Kerchove, R.; Lhermitte, S.; Veraverbeke, S.; Goossens, R. Spatio-temporal variability in
remotely sensed land surface temperature, and its relationship with physiographic variables in the
Russian Altay Mountains. Int. J. Appl. Earth Obs. Geoinf. 2013, 20, 4–19

Land 2015, 4 324
38. Kvalevag, M.M.; Myhre, G.; Bonan, G.; Levis, S. Anthropogenic landcover changes in a GCM with
surface albedo changes based on MODIS data RIDA-3598–2008. Int. J. Climatol. 2010, 30,
2105–2117.
39. Guttschuss, E. Leave Everything to God Accountability for Inter-Communal Violence in Plateau
and Kaduna States, Nigeria; Human Rights Watch: New York, NY, USA, 2013.
40. Carina, T. Revenge in the Name of Religion: The Cycle of Violence in Plateau and Kano States;
Human Rights Watch: New York, NY, USA, 2005; Volume 17, p. 83.
© 2015 by the authors; licensee MDPI, Basel, Switzerland. This article is an open access article
distributed under the terms and conditions of the Creative Commons Attribution license
(http://creativecommons.org/licenses/by/4.0/).