land surface albedo determination: remote sensing … · land surface albedo determination: remote...
TRANSCRIPT

Land Surface Albedo Determination: Remote Sensing, Ground and Statistical Validation, (6910) Siti Aekbal Salleh and Andy Chan (Malaysia) FIG Congress 2014 Engaging the Challenges – Enhancing the Relevance Kuala Lumpur, Malaysia 16-21 June 2014
1/13 Land
Land Surface Albedo Determination: Remote Sensing and Statistical Validation
Siti Aekbal SALLEH and Andy CHAN, Malaysia
Key words: climate, albedo, remote sensing, modelling SUMMARY Surface albedo has been documented as one of the Essential Climate Variables (ECV) of the Global Climate Observing System (GCOS). It influences the Earth’s Radiation Budget which has been complemented with the recent launched of Landsat 8 that is specifically design to archive data for the climate studies. The availability of surface albedo data at both temporally and spatially is needed. This paper discussed the development of a model (Nii) to determine land surface albedo from the climatic variables. The model generated in this study enables the continuous observation of land surface albedo through relative model established from the Multiple Regression method. Thus, it is an alternative way to depict land surface albedo considering the establishment of albedometer or mounting this instrument to existing monitoring station might incur monetary obligation. This finding allows the use of remote sensing historical data to be utilised as well as to the area where the radiation network has yet been established for the study in related to energy budget where land surface albedo is essential. It was found that the model is able to explain 82.2% of land surface albedo variances. Using internal validation method (Bootstraps) it was found that an equal standard error of the original and bootstrapped regression (0.001), thus highlight the adequacy samples population used to develop this model. The model is also validated using correspondence ASTERVNIR Albedo and insitu measurements. Using this data, the Mean Absolute Error (MAE) was computed and indicated to be as low as 0.0689, relative standard error (RSE) is 0.023, root mean square error (RMSE) is 00478 and MSE is 0.00002. Further testing was recommended on the time series analyses of LSA through the selected multiple dates involving Landsat and ASTER images to test the flexibility of air temperature as the negative predictor of land surface albedo.

Land Surface Albedo Determination: Remote Sensing, Ground and Statistical Validation, (6910) Siti Aekbal Salleh and Andy Chan (Malaysia) FIG Congress 2014 Engaging the Challenges – Enhancing the Relevance Kuala Lumpur, Malaysia 16-21 June 2014
2/13 Land
Land Surface Albedo Determination: Remote Sensing and Statistical Validation
Siti Aekbal SALLEH and Andy CHAN, Malaysia
1. INTRODUCTION Land surface albedo is the key element to the urban climate degradation such as urban heat island. Figure1 shows that urban temperature is influenced by many factors. The receiving radiation from the Sun will interact with the atmosphere and reach the ground surface and subsequently behaving differently according to the contacted earth features. The power of reflectivity will result in leaving radiance from the earth and thus keeping the earth surface cool. Albedo is regulated by the moisture, vaporization, earth and man-made materials, colour and also the physical and chemical properties of the earth and atmosphere. Hence, identifying and quantifying this association is important to see how significant the impact of land surface albedo to the urban temperature. The land surface albedo (LSA) values can be observed by using two techniques; namely in-situ observation and satellite observation. The in-situ observation involves instruments that are able to capture direct solar radiation at the surface. The spatial resolution for this method of observation is very limited as the instrument is usually mounted at a specific study area or even carried around for more flexible sampling works (handheld). However, this technique offers dynamic temporal resolution where the observation can be performed upon request. Other technique for retrieving the surface albedo values is through the space observation satellite system.
Figure 1: Conceptual Relationship of Albedo and the Earth Interaction
Several climate studies estimated LSA using remote sensing images and verified through in-situ measurement (Franch Gras, 2013; Jacobsen, Carstensen, & Kamper, 2012; Román et al., 2013). Extensive reviews on techniques and technology adopted to depict LSA using satellite images can be seen in (Salleh, Latif, Pradhan, Wan Mohd, & Chan, 2012). These studies can easily be verified with the existing Baseline Radiation Network (BSRN) and in-situ
Thermal = Albedo (moisture~vapour~material~colour) +/- (environment~chemistry~physics)

Land Surface Albedo Determination: Remote Sensing, Ground and Statistical Validation, (6910) Siti Aekbal Salleh and Andy Chan (Malaysia) FIG Congress 2014 Engaging the Challenges – Enhancing the Relevance Kuala Lumpur, Malaysia 16-21 June 2014
3/13 Land
measurement given the cloud cover is minimal. However, in Malaysia with an abundance of cloud in addition to the absence of BSRN, studies involving LSA quantification may face difficulty to validate. Time series study of albedo in this region is highly dependent on MODIS albedo product and historical archives (Salleh, Abd Latif, Wan Mohd, & Chan, 2012b). Especially when current image are difficult to obtain due to atmospheric condition, cloud cover and some other climate change effects. As such condition, researcher will have to consider using backdated cloud free images to conduct a study. Thus, an alternative method besides depending on in-situ measurement is needed. Opportunity can be gathered through an existing network parameter such as the continuous air quality monitoring stations (CAQMs). There are 52 CAQMs were established throughout Malaysia as at March 2010. An early study suggested that the simulated air quality impacts of increased albedo and vegetation cover with the impacts of other strategies reveals that they are of the same order of magnitude (Taha, Douglas, & Haney, 1997). However, there is no reliable evidence that may suggest the direct relationship of LSA with the parameters observed by CAQMs and there is still insufficient data to conclude that the adequacy of these parameters in estimating LSA (Salleh, Abd Latif, Wan Mohd, & Chan, 2012a). Thus, the objective of this paper is to investigate the relationship of the climatic variables from CAQMs in determining the LSA. 2. RESEARCH DESIGN AND METHODOLOGY 2.1 ASTERVNIR land surface albedo determination Using ASTER image dated 19 Jan 2011 corresponding to the insitu observation made around the site cloud free region, land surface albedo was depicted by using VNIR through the equation developed by Mokhtari & Busu (2011) that further improved in (Mohammad H Mokhtari et al., 2013).
𝐴𝑆𝑇𝐸𝑅!"#$ 𝐿𝑆𝐴 = 0.697𝛼! + 0.298𝛼! + 0.008 Equation 1 Where, 𝛼! is the reflectance band 1 and 𝛼! is the reflectance band 3. With this equation the absent of Shortwave in ASTER bands will not jeopardize the quantifications of land surface albedo. 2.2 Selection of Climatic Variables Dependencies The climatic variables selection is limited to the parameters that are available from the acquisition of CAQMs data from the Department of Environment (DOE), Malaysia. The climatic variables that were suggested to have a certain degree of influence toward the formation of LSA are humidity (Akbari, Matthews, & Seto, 2012; Bornstein et al., 2006; Menglin, 2011), wind speed (Bastiaanssen, Ahmad, & Chemin, 2002) and ambient temperature (Akbari et al., 2012; Bornstein et al., 2006; Menglin, 2011). The samples data used in this study were observed in Jan 2011. There were 7440 samples were collected and

Land Surface Albedo Determination: Remote Sensing, Ground and Statistical Validation, (6910) Siti Aekbal Salleh and Andy Chan (Malaysia) FIG Congress 2014 Engaging the Challenges – Enhancing the Relevance Kuala Lumpur, Malaysia 16-21 June 2014
4/13 Land
averaged into hourly in order to get a consistent interval with data acquired from CAQMs DOE. The samples were selected based on the weather condition during the observation and a good morning to evening observation can be derived (approximately from 7.30am to 6.00pm). 2.3 The Multiple Linear Regression testing the Assumptions Multiple Linear Regression (MLR) requires seven assumptions to be accepted (Hair, Black, Babin, Anderson, & Tatham, 2006). These assumptions works as the diagnostics tool for the dependent and independent variables data preparation. The diagnostics assumptions are crucial in order to verify that the data is in accordance to the standard for performing MLR. The assumptions are as follows:
i. Normality ii. Linearity
iii. Normality of error iv. Constant
v. Multicollinearity vi. Outliers
vii. Autocorrelations
Using SPSS, normality can be checked by examining the histogram or by the mean and standard deviation value of the data while the error of normality is by referring to the normality partial plot. The linearity and multicollinearity can be tested through the scatter plot and partial plot. According to Hair et. al, (2006), if variance inflation factor (VIF) more than 10, researcher should consider looking back at the dependent variable and removes outliers (should there be any +/- 3 residuals through the casewise diagnostics table results). Different from spatial statistics, autocorrelation in SPSS is tested using Durbin-Watson. 2.4 Statistical, Internal and Insitu validations There are three types of accuracy assessments and one type of internal validation was performed. In addition of three in-situ observation locations; five CAQM stations and two Meteorological stations are included (see yellow dots in Figure 2) for these tests.
Figure 2: The Location of CAQMs and METs used for Ground-based Validation

Land Surface Albedo Determination: Remote Sensing, Ground and Statistical Validation, (6910) Siti Aekbal Salleh and Andy Chan (Malaysia) FIG Congress 2014 Engaging the Challenges – Enhancing the Relevance Kuala Lumpur, Malaysia 16-21 June 2014
5/13 Land
2.4.1 Mean Absolute Error (MAE) This MAE is computed using Equation 2, where j represents the current predictor, and n represents the number of predictors.
𝑀𝐴𝐸 = 1𝑛 𝑦𝑗 − 𝑦𝑗
!
!!!
Equation 2
The sigma in this equation is an indication of summation of the predictor absolute values of residual. Which mean the negative and positive sign was removed from the over and under predicted values based on the actual and predicted values differences. This summation is later divided with the total number of samples used to generate the prediction model. 2.4.2 Relative Standard Error (RSE) Another tool for reliability assessment is the relative standard error (RSE) of an estimate. Estimates with large RSEs are considered less reliable than estimates with small RSEs. The relative standard error can be attained using the following expression:
𝑅𝑆𝐸 % 𝑥 =𝑆𝐸 (𝑥)𝑥 ×100 Equation 3
Where, SE (x) is the standard error of the estimation and x is the estimate number of samples. 2.4.3 Root Mean Square Error (RMSE) The predictive linear equation model performance is calculated using root mean square error (RMSE). The RMSE is the square root of the variance of the residuals. It indicates the absolute fit of the model to the data–how close the observed data points are to the model’s predicted values. RMSE is a good measure of model accuracy. Lower values of RMSE indicate better fit. RMSE is calculated using Equation 4, where Xobs is observed values and Xmodel is modelled values at time/place i.
𝑅𝑀𝑆𝐸 = 1𝑛 ( idelmoiobs XX ,, − )!
!
Equation 4
2.4.4 Bootstrap Resample and Regression There are many methods available to confirm the goodness of fit of the model and the statistic significance of the estimated parameters. The goodness of fit is commonly check using the pattern analysis of residuals and hypothesis testing, while statistically significance checked by using the F-test and followed by t-test of individual parameters interpretation of these diagnostic tests. This study utilised bootstrap method for the internal validation. The bootstrap methods are employed to improve the accuracy of statistical estimations (Efron & Tibshirani, 1986). One of the situation demands for bootstrap where small samples are involved in the regression model (Ader, Mellenbergh, & Hand, 2008; Efron & Tibshirani, 1993). Thus, bootstrap will resample the data. The determination of the number of replications is based on the coefficient of variation of the width of the confidence interval (Juan & Lantz, 2001).
Land Surface Albedo Determination: Remote Sensing, Ground and Statistical Validation, (6910) Siti Aekbal Salleh and Andy Chan (Malaysia) FIG Congress 2014 Engaging the Challenges – Enhancing the Relevance Kuala Lumpur, Malaysia 16-21 June 2014
6/13 Land
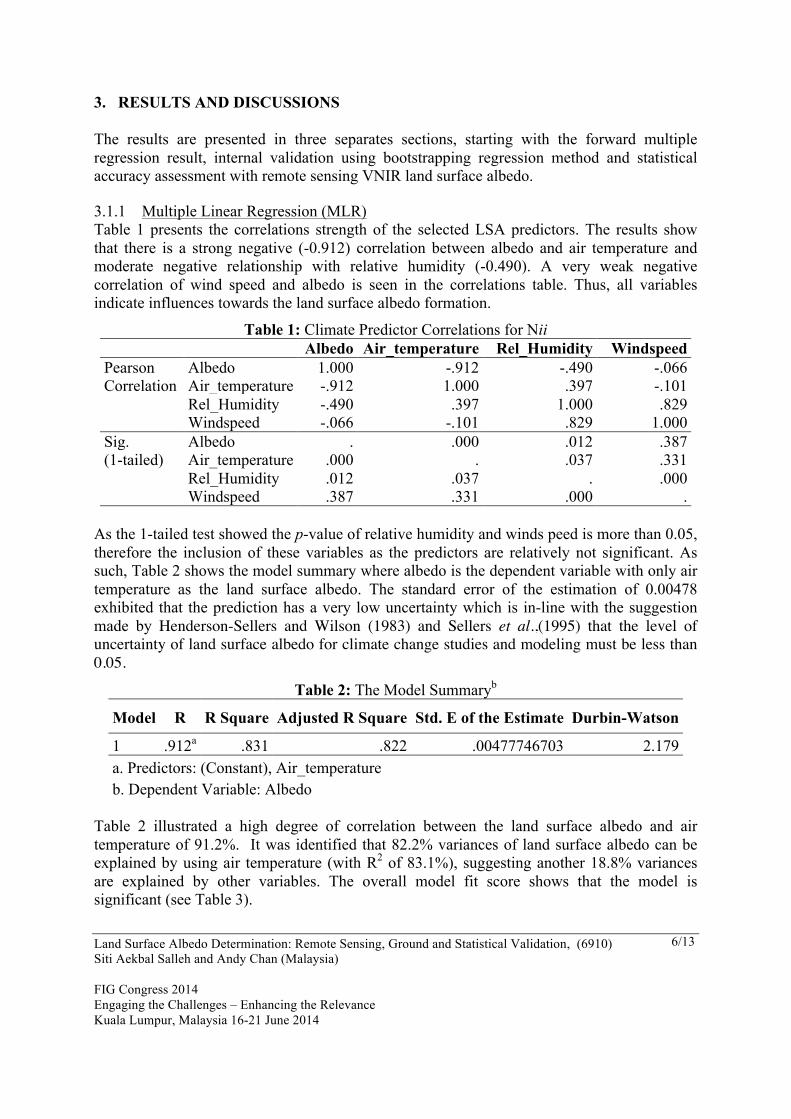
3. RESULTS AND DISCUSSIONS The results are presented in three separates sections, starting with the forward multiple regression result, internal validation using bootstrapping regression method and statistical accuracy assessment with remote sensing VNIR land surface albedo. 3.1.1 Multiple Linear Regression (MLR) Table 1 presents the correlations strength of the selected LSA predictors. The results show that there is a strong negative (-0.912) correlation between albedo and air temperature and moderate negative relationship with relative humidity (-0.490). A very weak negative correlation of wind speed and albedo is seen in the correlations table. Thus, all variables indicate influences towards the land surface albedo formation.
Table 1: Climate Predictor Correlations for Nii Albedo Air_temperature Rel_Humidity Windspeed
Pearson Correlation
Albedo 1.000 -.912 -.490 -.066 Air_temperature -.912 1.000 .397 -.101 Rel_Humidity -.490 .397 1.000 .829 Windspeed -.066 -.101 .829 1.000
Sig. (1-tailed)
Albedo . .000 .012 .387 Air_temperature .000 . .037 .331 Rel_Humidity .012 .037 . .000 Windspeed .387 .331 .000 .
As the 1-tailed test showed the p-value of relative humidity and winds peed is more than 0.05, therefore the inclusion of these variables as the predictors are relatively not significant. As such, Table 2 shows the model summary where albedo is the dependent variable with only air temperature as the land surface albedo. The standard error of the estimation of 0.00478 exhibited that the prediction has a very low uncertainty which is in-line with the suggestion made by Henderson-Sellers and Wilson (1983) and Sellers et al.,(1995) that the level of uncertainty of land surface albedo for climate change studies and modeling must be less than 0.05.
Table 2: The Model Summaryb
Model R R Square Adjusted R Square Std. E of the Estimate Durbin-Watson
1 .912a .831 .822 .00477746703 2.179 a. Predictors: (Constant), Air_temperature b. Dependent Variable: Albedo
Table 2 illustrated a high degree of correlation between the land surface albedo and air temperature of 91.2%. It was identified that 82.2% variances of land surface albedo can be explained by using air temperature (with R2 of 83.1%), suggesting another 18.8% variances are explained by other variables. The overall model fit score shows that the model is significant (see Table 3).

Land Surface Albedo Determination: Remote Sensing, Ground and Statistical Validation, (6910) Siti Aekbal Salleh and Andy Chan (Malaysia) FIG Congress 2014 Engaging the Challenges – Enhancing the Relevance Kuala Lumpur, Malaysia 16-21 June 2014
7/13 Land
Table 3: The ANOVAb Nii Model Sum of Squares Mean Square F Sig.
1 Regression .002 .002 93.648 .000a Residual .000 .000
Total .003 There are two predictors (Relative humidity and Wind speed) were removed due to p > 0.05 (Hair et al., 2006). Despite of their good VIF scores, these variables were removed from the model prediction. There was a negative linear relationship between the predictor and outcome variable, β = -.008, p = .000 (p < 0.05), revealed that every unit increase of land surface albedo is able to reduce the air temperature by 0.008°C. This finding exhibited consistency with other research that were previously conducted (Huwald et al., 2009; Jiang, Zhang, Gao, & Miao, 2007). The coefficients represented the effect size, beta = .912. The Durbin-Watson test scored is 2.179, which is very close to the ideal score (2.000) indicates the non-existence of autocorrelation. This test was performed to check the autocorrelation (inter-variables relationships within residuals are supposed to be independent). The Anova test revealed the overall model is significant, p = .000.
Table 4: The Coefficientsa Nii
Model
Unstandardized Coefficients
Standardized Coefficients
t
Sig. B Std. Error Beta 1 (Constant) .408 .027 15.085 .000
Air_temperature -.008 .001 -.912 9.677 .000
Model 1 95.0% Confidence Interval
for B Correlations Collinearity
Statistics Lower Bound Upper Bound Zero-order Partial Part Tolerance VIF
(Constant) .351 .464 Air_temperature -.010 -.006 -.912 -.912 -.912 1.000 1.000
a. Dependent Variable: Albedo Hence, the land surface albedo can be estimated using the air temperature using Equation 5 (Nii):
y= 0.008 (ATemp) + 0.408 Equation 5 Where, Atemp representing the air temperature acquired from the in-situ observation or continuous monitoring stations (air quality or meteorological station). 3.1.2 Statistical Internal validation (Bootstrapping) Nii was developed using minimum samples, thus bootstrapping was performed to evaluate the internal validity and sufficiency of the samples size. Bootstrap technique is able to tackle two issues in a process i.e. samples adequacy and reliability. Two crucial bootstrap regression items were examined are the Standard Error (SE) and the Confidence Interval (CI). Table 5 summarized the comparative model summary of the original and bootstrap regression. The

Land Surface Albedo Determination: Remote Sensing, Ground and Statistical Validation, (6910) Siti Aekbal Salleh and Andy Chan (Malaysia) FIG Congress 2014 Engaging the Challenges – Enhancing the Relevance Kuala Lumpur, Malaysia 16-21 June 2014
8/13 Land
bootstrap model summary exhibited the SE of 0.455 and Bias of 0.766. The 95% CI of the bootstrap regression was 0.439 (Lower) and 2.189 (Upper). In the case of regression models with small samples, bootstrapping is most useful technique to replicate the sample by using re-sampling procedure to the existing samples (Efron & Tibshirani, 1986; Efron & Tibshirani, 1994).
Table 5: Comparison of Nii with Bootstrap Regression
Samples n SE coefficient
B coefficient Confidence Interval
Const. Ambient temperature Lower Upper
Original 21 0.027 0.001 -0.008(0.408) -0.010(0.351) -.006(0.464) Bootstrap 1000 0.027 0.001 -0.007(0.357) -.008(0.299) -.005(0.405) Table 5 show bootstrap standard error of the ambient temperature coefficients is equal to the original standard error (0.001), highlight the adequacy samples population. The inadequacy of samples is indicated if the bootstrap standard error larger than the original standard error (Efron & Tibshirani, 1986; Fox, 2002). Thus, given the minimum number of samples used to generate Equation 5, the reliability of this question is tested and proven dependable as the standard error of bootstrap regression was not larger than the original regression. Figure 3 illustrated the observed and predicted values of LSA. There is no prominent discrepancy can be seen between the predicted values with regards to the observed values. They definitely have the same pattern. This is evidently exhibited in Figure 4, when linear trend of predicted LSA scored remarkably at 83.13% relative measure of fit.
Figure 3: Line Graph of Observed LSA and Predicted LSA
Figure 4: Linear Trendline of Observed and Predicted LSA
0
0.05
0.1
0.15
0.2
1 2 3 4 5 6 7 8 9 10 11 12 13 14 15 16 17 18 19 20 21
Observed Albedo
R² = 0.83133
0.1
0.12
0.14
0.16
0.18
0.2
0.1 0.12 0.14 0.16 0.18 0.2
Pred
icte
d A
lbed
o
Observed Albedo
Predicted Albedo Linear (Predicted Albedo)

Land Surface Albedo Determination: Remote Sensing, Ground and Statistical Validation, (6910) Siti Aekbal Salleh and Andy Chan (Malaysia) FIG Congress 2014 Engaging the Challenges – Enhancing the Relevance Kuala Lumpur, Malaysia 16-21 June 2014
9/13 Land
3.1.3 ASTER VNIR and Model Accuracy Assessments ASTER image captured in Jan 2011 was utilized to depict the relative albedo values and compared to the model predicted values as an external validation method. Table 6 presents the comparison of LSA determination using Nii and ASTERVNIR with regards to ground observation.
Table 6: LSA Determination Comparison
Origin/Model Nii Ambient Temperature
ASTERvnir (Mohammad H Mokhtari et al., 2013)
Insitu (Asphalt)
Point 1 0.14536 0.259251 0.14 Point 2 0.144 0.229133 0.14 Point 3 0.13736 0.23527 0.14
Table 7 shows the residual of the observed LSA values with respect to the model predicted LSA values and the relative values from ASTER image. It is apparent that a very small residual value calculated from the three (3) test sites.
Table 7: Residuals of Observed, Predicted and Relative values of LSA
Nii Ambient Temperature ASTER
In-situ
Residual with In-situ Nii ASTER
point 1 0.14536 0.259251 0.14 -0.00536 -0.119251 point 2 0.144 0.229133 0.14 -0.004 -0.089133 point 3 0.13736 0.23527 0.14 0.00264 -0.09527
The ASTERVNIR LSA ground samples are expanded to the number of CAQMs and Meteorological stations over the captured scene (see Figure 5). A total of ten locations with three (3) in-situ observation, five (5) CAQMs stations and two (2) Meteorological stations. Table 8 presents the remote sensing albedo and estimated LSA using Equation 5.
Table 8: Residuals of Remotely sensed LSA Nii LSA ASTERVNIR LSA D % Point 1 0.14536 0.259251 -0.113891 56.06921478 Point 2 0.144 0.229133 -0.085133 62.84559623 Point 3 0.13736 0.23527 -0.09791 58.38398436 Putrajaya CAQMs 0.172 0.239545 -0.067545 71.80279279 Bt. Muda CAQMs 0.1904 0.279282 -0.088882 68.17481972 P. Jaya CAQMs 0.1768 0.191914 -0.015114 92.12459748 Shah Alam CAQMs 0.1848 0.236881 -0.052081 78.01385506 Cheras CAQMs 0.1816 0.22658 -0.04498 80.14829199 P. Jaya METs 0.1848 0.241634 -0.056834 76.47930341 Subang METs 0.1816 0.248245 -0.066645 73.15353784
The dark red points in Figure 5 shows the locations ten (10) verifications points comprises of three (3) in-situ, five (5) CAQMs stations and two (2) Meteorological stations. Using this data, the Mean Absolute Error (MAE) was computed and indicated as low as 0.0689 deviation of Nii albedo as compared to the ASTERVNIR albedo.

Land Surface Albedo Determination: Remote Sensing, Ground and Statistical Validation, (6910) Siti Aekbal Salleh and Andy Chan (Malaysia) FIG Congress 2014 Engaging the Challenges – Enhancing the Relevance Kuala Lumpur, Malaysia 16-21 June 2014
10/13
Figure 5: ASTER VNIR Land Surface Albedo and Ground Truthing Locations
Table 9: Accuracy Assessment
RSE (%) RMSE MSE MAE Nii - Ambient Temperature 0.023 .00478 0.00002 0.004
The closeness to Zero value indicates better fitness of the prediction. From Table 9, the value of RMSE and MAE exhibited that all the errors are of the same magnitude as the value of RMSE and MAE of the Nii is similar. The RMSE values of 0.00478 shows that these predictions are well within the tolerance with low residual variance and therefore good fitting models. It is in line with recommendation made by Browne, Cudeck, Bollen, & Long (1993), where the cut off value for RMSE is at best when it is below 0.08. 4. CONCLUSION AND RECOMMENDATION There is a strong negative relationship (-0.822) can be depicted from this study with every unit of increment in land surface albedo will bring down the air temperature by 0.008°C. As such, an equation is developed to enable air temperature to be used as the LSA predictor. In addition to that, the finding in this study indicates that the land surface albedo is able to suppress the surface temperature given the similar condition as the study area which also in line with studies conducted by several researchers (Huwald et al., 2009; Jiang et al., 2007). It was found that air temperature is the negative predictor of LSA and the other two climate

Land Surface Albedo Determination: Remote Sensing, Ground and Statistical Validation, (6910) Siti Aekbal Salleh and Andy Chan (Malaysia) FIG Congress 2014 Engaging the Challenges – Enhancing the Relevance Kuala Lumpur, Malaysia 16-21 June 2014
11/13
variables (relative humidity and wind speed) were statistically insignificant to explain LSA. The bootstrap regression proves that the minimum samples biased were not questionable as the standard error exhibited the sample size adequacy. The model goodness of fits are tested using common MAE, RMSE, MSE and RSE indicated that the prediction are well within the tolerance with low residual variance, consistent with the recommendation made by Browne et al., (1993) of RMSE < 0.08, and therefore it is a good fitting model. It is also recommended to examine the model on LSA that are depicted from different sensor such as Landsat and MODIS to ensure the flexibility of air temperature as the LSA negative predictor at different temporal and spatial resolution. It is also crucial to confirm if the current methods and the proposed equation for LSA determination have fulfilled the absolute requirements for datasets suitable for evaluating climate model demand for land surface albedo with the level of uncertainty range from ±0.02 to ±0.05 as documented by Henderson-Sellers and Wilson (1983) and Sellers et al.,(1995). REFERENCES Ader, H.J., Mellenbergh, G.J., & Hand, D.J. (2008). Advising on Research Methods: a consultant 愀 companion:
Johannes van Kessel Publ. Akbari, H., Matthews, H.D., & Seto, D. (2012). The long-term effect of increasing the albedo of urban areas.
Environmental Research Letters, 7(2), 024004. Bastiaanssen, W.G.M., Ahmad, M.D., & Chemin, Y. (2002). Satellite surveillance of evaporative depletion
across the Indus Basin. Water Resources Research, 38(12), 1273-1282. Bornstein, R., Balmori, P., Taha, H., Byun, D., Cheng, B., Nielsen-Gammon, J. (2006). Modeling the effects of
land-use/land-cover modifications on the urban heat island phenomena in Houston, Texas. Final report to David Hitchcock Houston Advanced Research Center.
Browne, M.W., Cudeck, R., Bollen, K.A., & Long, J.S. (1993). Alternative ways of assessing model fit. Sage Focus Editions, 154, 136-136.
Efron, B., & Tibshirani, R. (1986). Bootstrap methods for standard errors, confidence intervals, and other measures of statistical accuracy. Statistical science, 54-75.
Efron, B., & Tibshirani, R. (1993). An introduction to the bootstrap (Vol. 57): CRC press. Efron, B., & Tibshirani, R.J. (1994). An Introduction to the Bootstrap (Chapman & Hall/CRC Monographs on
Statistics & Applied Probability). Fox, J. (2002). Bootstrapping regression models. An R and S-PLUS Companion to Applied Regression: A Web
Appendix to the Book. Sage, Thousand Oaks, CA. URL http://cran. r-project. org/doc/contrib/Fox-Companion/appendix-bootstrapping. pdf.
Franch Gras, B. (2013). A model to estimate daily albedo from remote sensing data: accuracy assessment of MODIS MCD43 product.
Hair, J., Black, W., Babin, B., Anderson, R., & Tatham, R. (2006). Multivariate Data Analysis: Upper Saddle River, NJ: Prentice Hall.
Henderson-‐Sellers, A., & Wilson, M. (1983). Surface albedo data for climatic modeling. Reviews of Geophysics, 21(8), 1743-1778.
Huwald, H., Higgins, C., Boldi, M., Bou-Zeid, E., Lehning, M., & Parlange, M. (2009). Albedo effect on radiative errors in air temperature measurements. Water Resources Research, 45(8), W08431.
Jacobsen, A., Carstensen, A.R., & Kamper, J. (2012). Mapping of satellite derived surface albedo on the Mitdluagkat Glacier, Eastern Greenland, using a digital elevation model and SPOT HRV data. Geografisk Tidsskrift-Danish Journal of Geography, 93.
Jiang, X., Zhang, C., Gao, H., & Miao, S. (2007). Impacts of urban albedo change on urban heat island in Beijing—a case study. Acta Meteorologica Sinica, 65, 301-307.
Juan, S., & Lantz, F. (2001). Application of bootstrap techniques in econometrics: the example of cost estimation in the automotive industry. Oil & Gas Science and Technology, 56(4), 373-388.

Land Surface Albedo Determination: Remote Sensing, Ground and Statistical Validation, (6910) Siti Aekbal Salleh and Andy Chan (Malaysia) FIG Congress 2014 Engaging the Challenges – Enhancing the Relevance Kuala Lumpur, Malaysia 16-21 June 2014
12/13
Menglin, J. (2011). Urban Surface Temperature Reduction via the Urban Aerosol Direct Effect: A Remote Sensing and WRF Model Sensitivity Study. Advances in Meteorology, 2010.
Mokhtari, M.H., & Busu, I. (2011). Downscaling Albedo from moderate-resolution imaging spectroradiometer (MODIS) to advanced space-borne thermal emission and reflection radiometer (ASTER) over an agricultural area utilizing ASTER visible-near infrared spectral bands. International Journal of the Physical Sciences, 6(24), 17.
Mokhtari, M.H., Busu, I., Mokhtari, H., Zahedi, G., Sheikhattar, L., & Movahed, M.A. (2013). Neural Network and Multiple Linear Regression for Estimating Surface Albedo from ASTER Visible and Near-Infrared Spectral Bands. Earth Interactions, 17(3), 1-20.
Román, M.O., Gatebe, C.K., Shuai, Y., Wang, Z., Gao, F., Masek, J.G. (2013). Use of In Situ and Airborne Multiangle Data to Assess MODIS-and Landsat-Based Estimates of Directional Reflectance and Albedo. Geoscience and Remote Sensing, IEEE Transactions on, 51(3), 1393-1404.
Salleh, S.A., Abd Latif, Z., Wan Mohd, W.M.N., & Chan, A. (2012a). Air quality parameters dependency of remotely-sensed albedo. Paper presented at the Signal Processing and its Applications (CSPA), 2012 IEEE 8th International Colloquium on.
Salleh, S.A., Abd Latif, Z., Wan Mohd, W.M.N., & Chan, A. (2012b). Albedo Pattern Recognition and Time-series Analyses in Malaysia. Int. Arch. Photogramm. Remote Sens. Spatial Inf. Sci., XXXIX-B7(2012), 6. doi: 10.5194/isprsarchives-XXXIX-B7-235-2012
Salleh, S.A., Latif, Z.A., Pradhan, B., Wan Mohd, W.M.N., & Chan, A. (2012). Functional relation of land surface albedo with climatological variables: a review on remote sensing techniques and recent research developments. Geocarto International, null-null. doi: 10.1080/10106049.2012.748831
Sellers, P., Meeson, B., Hall, F., Asrar, G., Murphy, R., Schiffer, R. (1995). Remote sensing of the land surface for studies of global change: Models—algorithms—experiments. Remote Sensing of Environment, 51(1), 3-26.
Taha, H., Douglas, S., & Haney, J. (1997). Mesoscale meteorological and air quality impacts of increased urban albedo and vegetation. Energy and Buildings, 25(2), 169-177.
BIOGRAPHICAL NOTES Siti Aekbal SALLEH is a Senior Lecturer at the Center of Studies Surveying Science and Geomatics, Faculty of Architecture Planning and Surveying, Universiti Teknologi MARA, Shah Alam, Malaysia. She has a Bachelor Degree in Georaphical Information Science from Geomatics Department, School of Civil Engineering and Geosciences, University of Newcastle upon Tyne, United Kingdom and MSc in Built Environment from Faculty of Architecture Planning and Surveying, Universiti Teknologi MARA, Shah Alam, Malaysia. She is currently pursuing her Doctoral Degree in Environmental Remote Sensing and GIS Modelling. Her main research area revolves around the environmental modelling using Remote Sensing and Geographical Information Science (GIS). Focus discipline lie in field of Geo-informatics technology particularly in Geographical Information Science (GIS) and 3D GIS, Remote Sensing, climate change and change assessments impacts of land surface process and its biophysical responses towards global, regional and local climate conditions. She is a member of a number of ARSG-RIG, CGT and IEEE GRSS Malaysian Section. CONTACTS Mrs Siti Aekbal SALLEH Center of Studies Surveying Science and Geomatics, Faculty of Architecture Planning and Surveying, Universiti Teknologi MARA, 40450 Shah Alam, MALAYSIA

Land Surface Albedo Determination: Remote Sensing, Ground and Statistical Validation, (6910) Siti Aekbal Salleh and Andy Chan (Malaysia) FIG Congress 2014 Engaging the Challenges – Enhancing the Relevance Kuala Lumpur, Malaysia 16-21 June 2014
13/13
Tel. +60355211755 Fax + 60355444545 Email: [email protected]