land use /land cover classification of an urban area- a ... · land use /land cover classification...
TRANSCRIPT

INTERNATIONAL JOURNAL OF GEOMATICS AND GEOSCIENCES
Volume 2, No 4, 2012
© Copyright 2010 All rights reserved Integrated Publishing services
Research article ISSN 0976 – 4380
Submitted on March 2012 published on May 2012 1014
Land Use /Land Cover classification of an urban area- A case study of
Burdwan Municipality, India Srimanta Gupta, Moupriya Roy
Department of Environmental Science, The University of Burdwan
Burdwan-713104, West Bengal, India
ABSTRACT
This work explains the Land Use/ Land Cover classification of urban area (the Burdwan
municipality, West Bengal, India) using Geographical Information System and Remote
Sensing software. Mapping of the Classification is done with the help of existing Burdwan
municipality ward map and IRS-P6 LISS-IV image of January 7, 2008, having a resolution of
5m × 5m and a hand held Gramin12 Global Positioning System receiver. Supervised Land
Use/Land Cover classification algorithm (Maximum likelihood with null class) is run into
PCI Geomatica V.10.1 software. The classification shows 83.01 % average accuracy and
76.47 % overall accuracy .The output classified map reveals that Burdwan Municipality Area
is divided into 35 no of wards having a total area of 25.29 square kilometres. Depending upon
United States Geological Survey classification system an urban classification scheme is
generated where Burdwan municipality area is divided into 7 major Land Use/ Land Cover
classes and subclasses. Using the software, ward wise area statistic is calculated. The area
statistics of Land Use/ Land Cover classes of an area is very important for future
development.
Keywords: Supervised Classification, LULC Classification, Urban Classification, Area
Statistics, Image Classification, Remote Sensing.
1. Introduction
The urban is a compound system of human and nature. It is also a high-dense geographical
synthesis of population, resources, environment, and social, economic and so on. Land is
most important and basic resource concerning the urban development. Population growth,
unplanned industrialization, urbanization and its consequences adversely affect the regional
environment. Improper land use practice results in an adverse impact on ecosystem. So the
two words “Land cover” and “Land use” have important significance in regard to land. Land
cover implies the physical or natural state of the Earth’s surface. On the other hand a tract of
land is covered by forest or a building or a water body or so but it is quite difficult to say
what purpose a building may be used for as it may be use for residential or commercial
simultaneously. e.g., a multi-complex building often is being used for cinema hall and at the
same time one part of it is being used as commercial area / shopping market. Land use is the
manner in which human beings employ the land and its resources. Thus urban development is
strictly depends upon Land Use/ Land Cover (LULC) of that area.
Several knowledge-based approaches were used by Anderson, 1971, Hutchinson, 1982,
Jenssen et.al., 1992 for LULC classification by utilizing additional geographical data beside
satellite images. The framework of a national land use and land cover classification system
was presented by Anderson, et.al., 1976, for use with remote sensor data.
Land Use /Land Cover Classification of an Urban Area- A Case Study of Burdwan Municipality, India
Srimanta Gupta, Moupriya Roy
International Journal of Geomatics and Geosciences
Volume 2 Issue 4, 2012 1015
Different workers worked even on municipality level using Geographical Information System
(GIS) and Remote Sensing (RS). Recent legal requirements in Colombia require each
municipality to develop land use plans for the next decade (Ministerio del Medio Ambiente
de Colombia, 1997). For municipal-level general land use planning, Rubiano et al., 1997
makes land use restriction recommendations. To support the specific land use planning,
Hyman et.al., 2000 developed spreadsheet programs that run parallel to the GIS to help the
municipal agricultural extension service assess agricultural restrictions for different types of
land units (Rodriguez et al., 1999).
In this work a LULC classification scheme of Burdwan municipality area is generated on the
basis of United States Geological Survey (USGS) classification system, concerning the
existing LULC features of that area i.e., evergreen vegetation is divided into two sub classes,
“surrounding the forest area” and “along with residential area”. Evergreen vegetation along
with residential area is further subdivided into “spar vegetation along with residential area”
and “dense vegetation along with residential area”. Mixed urban or built-up land is divided
into “mixed urban with rice mill area” and “mixed urban with commercial area”. Ponds under
water bodies are also subdivided into many other sub classes (Table1). Map is a graphic
representation or scale model of spatial concepts. In this study the output of LULC
classification of Burdwan municipality area is presented by the maps (Figure 5).
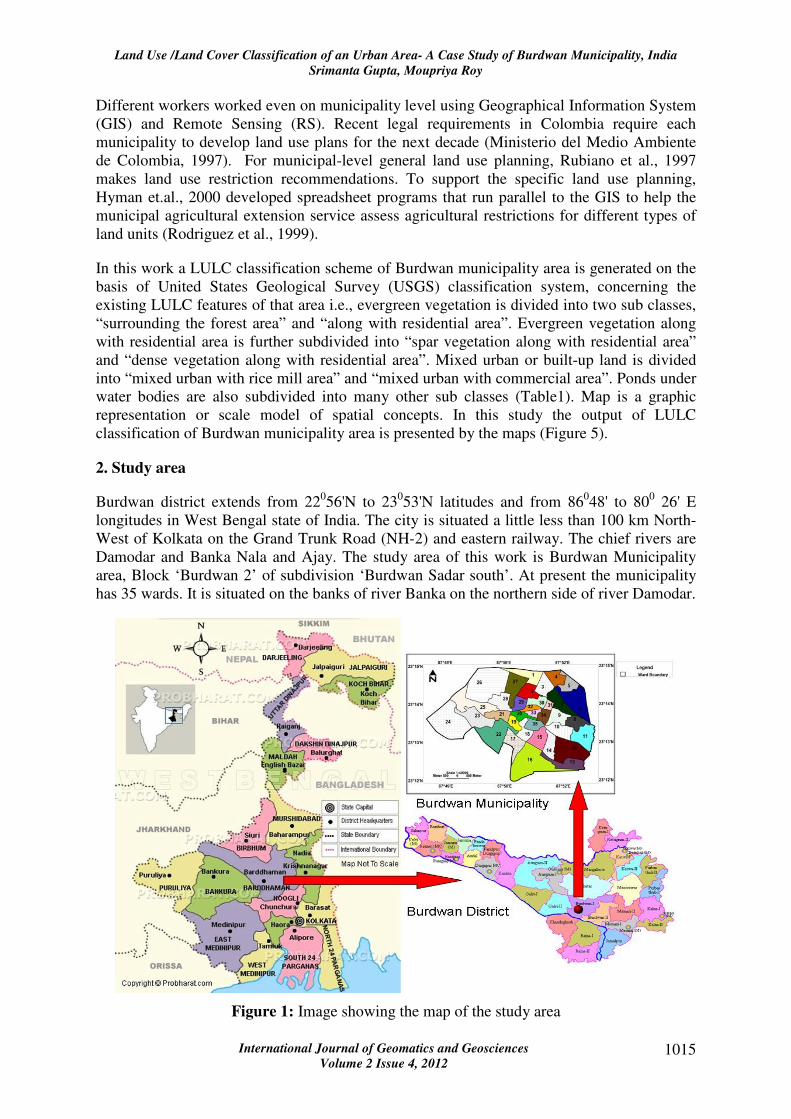
2. Study area
Burdwan district extends from 22056'N to 23
053'N latitudes and from 86
048' to 80
0 26' E
longitudes in West Bengal state of India. The city is situated a little less than 100 km North-
West of Kolkata on the Grand Trunk Road (NH-2) and eastern railway. The chief rivers are
Damodar and Banka Nala and Ajay. The study area of this work is Burdwan Municipality
area, Block ‘Burdwan 2’ of subdivision ‘Burdwan Sadar south’. At present the municipality
has 35 wards. It is situated on the banks of river Banka on the northern side of river Damodar.
Figure 1: Image showing the map of the study area

Land Use /Land Cover Classification of an Urban Area- A Case Study of Burdwan Municipality, India
Srimanta Gupta, Moupriya Roy
International Journal of Geomatics and Geosciences
Volume 2 Issue 4, 2012 1016
2.1 Objective of the study
The objective of this work is to produce LULC Classification scheme of Burdwan
municipality area depending upon USGS classification, ward wise LULC area statistics and
LULC map of Burdwan municipality and thematic map (including the following layers: rail,
canal, municipality area boundary, road, river, ward boundary and LULC classes) of
Burdwan Municipality area.
2.2 Major inputs
1. A base map of Burdwan municipality area (Burdwan municipality).
2. Satellite image (IRS-P6 LISS-IV image of January 7, 2008).
3. A hand held GARMIN GPS12 (12 Channels) receiver for collecting ground
control points.
4. PCI Geomatica V.10.1 software.
Figure 2: Image showing base map of Burdwan municipality area

Land Use /Land Cover Classification of an Urban Area- A Case Study of Burdwan Municipality, India
Srimanta Gupta, Moupriya Roy
International Journal of Geomatics and Geosciences
Volume 2 Issue 4, 2012 1017
Figure 3: Image showing Satellite image (IRS-P6 LISS-IV image of January 7, 2008)
3. Methodology
The work is constructed on the principle of GIS. There are two kinds of databases;
1) The specific characteristics of a locations and
2) The attribute data, i.e., statistics of written text, tables and so on.
New maps can generated preciously be on the basis of the classification scheme by easily
integrating innumerable layers of data. This can be performed by image processing of digital
data with the help of PCI Geomatica V10.1 software.
Ground Control Points (GCPs) are collected to convert the Base map (Figure 2), containing
the basic information such as road networks, word boundaries of Burdwan municipality area
and the Satellite image (Figure 3), IRS-P6 LISS-IV image of January 7, 2008 into longitude
and latitude map using a hand held GARMIN GPS12 (12 Channels) receiver. Mainly the
road-road intersections, rail-road intersections, bridge-road intersections, famous spots are
selected on the map to collect the GCPs. A standard technique is adopted for georeferencing
the base map using PCI Geomatica V10.1 software. Image to image registration of the
satellite image is made using the georeferenced base map. Then reprojected the maps (base
map and georefferenced satellite image) into UTM projection. UTM projection is done to
minimize the map distortion and to activate the grid option. After Subsetting and Clipping of
the Burdwan municipality area from the total georefferenced satellite image, run supervised
classification algorithm (Maximum likelihood with null class) by the help of developed
LULC classification scheme (Table1). Post Classification Analysis is done by merging
classes and by masking and unmasking methods after each field survey. Digitisation of rail,
river, road, canal and production of thematic map (Figure 6) of Burdwan municipality
including the ward boundary is done by using the software. Digitisation of municipality ward
boundary helps to get the ward wise LULC classes. Then fields are added in the attribute
manager to put important road names, ward numbers. Map output is done to get the LULC

Land Use /Land Cover Classification of an Urban Area- A Case Study of Burdwan Municipality, India
Srimanta Gupta, Moupriya Roy
International Journal of Geomatics and Geosciences
Volume 2 Issue 4, 2012 1018
map (Figure 5) and thematic map including the ward boundary layer (Figure 6) layout. The
overall method is given below in figure 4.
Figure 4: Image showing GIS output flow-chart
Satellite image (IRS-
P6 LISS-IV image of
January 7, 2008)
Base map of Burdwan
municipality
Collection of
GCPs using
hand held
GARMIN
GPS12 (12
Channels)
receiver
Georeferencing of base map
using PCI Geomatica
V.10.1 software
Image to image registration of
the satellite image using
georeferenced base map.
Converted into
UTM projection.
Run supervised classification algorithm
(Maximum likelihood with null class)
Subsetting and
Clipping of the
Burdwan
municipality area.
Post classification
analysis by class editing,
masking and clear
masking.
Generation of map
layout
Map output
Converted
into UTM
projection.
GIS creation:
1) Digitisation of
different layers.
2) Addition of attributes.
GIS output flowchart

Land Use /Land Cover Classification of an Urban Area- A Case Study of Burdwan Municipality, India
Srimanta Gupta, Moupriya Roy
International Journal of Geomatics and Geosciences
Volume 2 Issue 4, 2012 1019
3.1 Development of modified LULC Classification scheme
LULC classification of an area depends upon the available features of that area. Depending
upon the existing LULC features of Burdwan municipality and based on U.S.G.S
classification system (Anderson’s classification, 1971), the municipality area of Burdwan has
been divided into the following LULC classes (Table 1).
Table 1: Table showing LULC Classification of Burdwan Municipality area depending upon
U.S.G.S classification system
1. Urban or built-up
land
1.1 Residential
1.2 Commercial,
services &
institutional
1.3 Mixed urban or
built-up land
1.4 Rice-mill cluster
1.5 Other urban built-
up land
1.21 Hospital
1.22 Commercial
area
1.23 Services
1.24 Institutional
area
1.31. Mixed urban
with rice mill
1.32. Mixed urban
with commercial
area
1.51. Playground
2. Agricultural area
2.1 cropland
2.2 Nurseries
3. Range land 3.1 Herbaceous
rangeland
4. Forest land &
Vegetation
4.1 Mixed Forest
4.2 Evergreen
Vegetation
4.21 Surrounding
the forest area
4.22 Along with
residential area
4.221 Spar
vegetation along
with residential
area
4.222 Dense
vegetation along
with residential
area
5. Water bodies
5.1. Stream & canals
5.2 Ponds
5.21 Perennial
5.22 Ephemeral
5.211 Fishing
pond
5.212 Non-fishing
pond
6. Wet land 6.1 Non-forested wet
land
7. Barren land 7.1 sandy area other
than beaches
7.2 Bare, Exposed
rocks

Land Use /Land Cover Classification of an Urban Area- A Case Study of Burdwan Municipality, India
Srimanta Gupta, Moupriya Roy
International Journal of Geomatics and Geosciences
Volume 2 Issue 4, 2012 1020
4. Results and discussions
The growth of industrial sector and urban centre of all scale and categories have made drastic
changes in LULC all over the Burdwan Municipality area. The cultivated land has been
converted into settlement areas and many ponds are being filled up for the purpose of multi-
storeyed apartments in Burdwan Municipality area. Whether it is industrialization or
urbanization, the face of the land is altered. Based on the ground information collected and
LULC classification scheme, LULC scenario of total Burdwan Municipality and ward wise
LULC scenario are represented in the following tables and figures (Table 2, Table 3 and
Figure 5, Figure 6). Burdwan Municipality Area is divided into 35 no of wards having a total
area of 25.29 square kilometres. The main land use of the municipality is dominated by
Residential area (36.88%). In a similar work, Haider, 2008, analysed that in 2005, residential
was the main function followed by education, recreation, and commercial of Isa town. It is
also reveals in this work that different wards of Burdwan municipality are dominated by
residential density.
Figure 5: Image showing LULC Map of Burdwan Municipality Area
Ward wise LULC recommendation (Haider, 2008 made such recommendations in his work
for the municipal-level general land use planning) for future LULC management are given in
Table 3. Though it is a municipality area, but agriculture is still practiced in few wards.
However crop land became dominated land use in those wards (Ward no. 1, 16, 22, 23, 24, 25
and 26) which are near the gram panchayets. Banka nala, canal are the main sources to supply
water in most of these areas.

Land Use /Land Cover Classification of an Urban Area- A Case Study of Burdwan Municipality, India
Srimanta Gupta, Moupriya Roy
International Journal of Geomatics and Geosciences
Volume 2 Issue 4, 2012 1021
Rice mill is the major industry of this municipality. Overall 2.51% and 2.59% area of
Burdwan municipality (Table 2) is covered by rice mill cluster and mixed urban with mill
areas but rice mill cluster is the major land use in ward no. 17, 18, 22, 23 (Table 3). In ward
no. 15 (1.96%), 16(3.45%), 19(1.92%), 21(0.04%), 35 (5.65%) mills remain associated with
residential areas. Overall 2.95% and 2.70% area of this municipality is covered by
commercial areas and mixed urban with commercial areas respectively which seems that
more commercialization is necessary for future development related to residential area. It is
clear from the Table 3 and Figure 6 that highly commercialized area is mainly restricted in
the ward no. 29, 30, 31, 32, 33 and 34. So in this aspect Burdwan municipality has future
scope of growth for commercialization to meet the need of people of the municipality. From
the above discussion it is clear that range land plays an important role for future urbanization
and commercialization. So from the Table 3 it can be stated that ward no. 2, 10, 12, 14, 18,
27, 35 have sufficient range land which can be use for development of urban or built-up
areas.
Figure 6: Image showing Thematic Map of Burdwan Municipality including ward boundary.
Table 2: Table showing LULC scenario of Burdwan Municipality area
LULC Classes LULC scenario of Burdwan
Municipality area (%)
Evergreen Vegetation Surrounding the forest area 2.00
Spar evergreen Vegetation Along with Residential
area 11.83
Crop Land 8.35
Residential area 36.88
Commercial area 2.95
Mixed urban with commercial area 2.70
Ephemeral Ponds 0.25
Barren land 1.97

Land Use /Land Cover Classification of an Urban Area- A Case Study of Burdwan Municipality, India
Srimanta Gupta, Moupriya Roy
International Journal of Geomatics and Geosciences
Volume 2 Issue 4, 2012 1022
Nonforested Wet land 0.72
Mixed Forest 1.03
Streams & Canals 1.17
Perennial Fishing ponds 6.08
Sandy area other than beaches 1.03
Perennial Nonfishing ponds 0.62
Rice mill clusters 2.51
Mixed urban with mill areas 2.59
Herbaceous Range Land 4.47
Play Ground 0.45
Institutions 0.29
Hospital 0.04
Services Area 0.19
Nurseries 0.03
Dense Evergreen Vegetation Along with residential
area 11.85
Table 3: Table showing Ward wise LULC scenario of Burdwan municipality
(Ward number 1-15)
WARD WISE % OF AREA LULC
Classes 1 2 3 4 5 6 7 8 9 10 11 12 13 14 15
Evergreen
Vegetation
Surrounding
the forest
area 1.7 0.8 0.4 0.20 0.30 0.1 0.08 0.0 0.10 0.21 0.02
Spar
evergreen
Vegetation
Along with
Residential
area 31 21.3 22. 24. 19.3 6.34 12. 16.8 20 21.0 0.28 6.48 7.83 2. 22
Crop Land 10 0.5 2.3 2.25 1.56 0.1 0.10 7.22 1.60 3.76
Residential
area 4. 50.4 50. 44. 37.9 47.8 51. 53.1 49. 44.1 33.8 40.1 32.5 52. 60.1
Commercial
area 5.5 10. 5.3 0.35 3.03 18.8 0.18 5.4 3.06 0.54 1.11 1.31 2.3 1.58
Mixed
urban with
commercial
area 1.69 1.04 3.9 17. 1.25 4.26 4.8 1.61 4.1 0.03 0.07 0.05 1.96 0.0
Ephemeral
Ponds 0.10 0.08 0.2 0.1 0.13 0.00 0.26 0.0 0.23 0.27 0.13 0.22
WARD WISE % OF AREA LULC
Classes 1 2 3 4 5 6 7 8 9 10 11 12 13 14 15
Nonforested
Wet land 4.55 1.3 0.18 4.36 7.9
Streams &
Canals 1.79 2.0 1.48 1.11
Perennial
Fishing
ponds 0.8 6.83 6.1 3.2 10.0 7.16 1.5 6.47 5.7 3.98 3.38 3.39 0.08 6.6 10.
Perennial
Nonfishing
ponds 1.44 0.20 0.14 0.6 0.39 0.5 0.88 0.65 0.21 0.5
Land Use /Land Cover Classification of an Urban Area- A Case Study of Burdwan Municipality, India
Srimanta Gupta, Moupriya Roy
International Journal of Geomatics and Geosciences
Volume 2 Issue 4, 2012 1023
Mixed
urban with
mill areas 1.9
Herbaceous
Range Land 3.1 10.6 4.67 0.48 2.50 2.89 0.26 0.92 2.31 11.42 4.25 15.62 4.27 8.89 2.46
Play
Ground 1.83 0.86 1.18 0.01 2.05
Institutions 1.32 0.47 0.08 1.12
Services
Area 0.38 0.24 6.19
Dense
Evergreen
Vegetation
Along with
residential
area 24.34 21.88 17.13 11.93 48.14 30.39 43.63 0.08
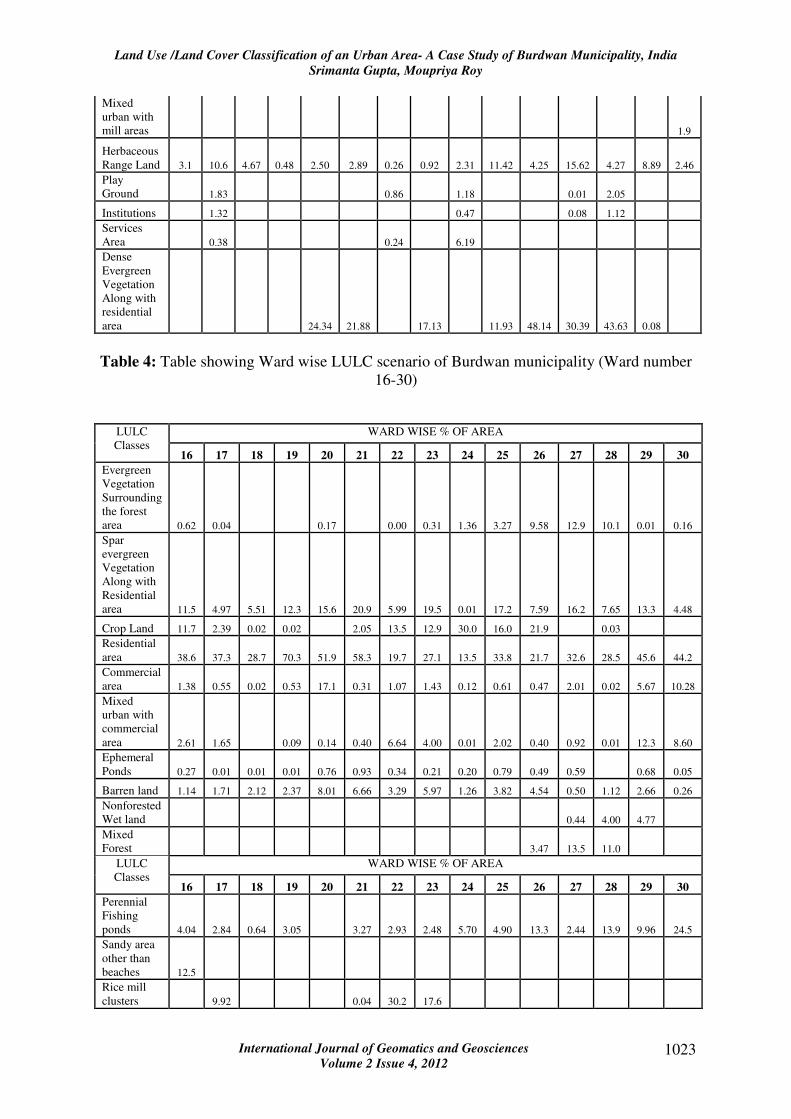
Table 4: Table showing Ward wise LULC scenario of Burdwan municipality (Ward number
16-30)
WARD WISE % OF AREA LULC
Classes 16 17 18 19 20 21 22 23 24 25 26 27 28 29 30
Evergreen
Vegetation
Surrounding
the forest
area 0.62 0.04 0.17 0.00 0.31 1.36 3.27 9.58 12.9 10.1 0.01 0.16
Spar
evergreen
Vegetation
Along with
Residential
area 11.5 4.97 5.51 12.3 15.6 20.9 5.99 19.5 0.01 17.2 7.59 16.2 7.65 13.3 4.48
Crop Land 11.7 2.39 0.02 0.02 2.05 13.5 12.9 30.0 16.0 21.9 0.03
Residential
area 38.6 37.3 28.7 70.3 51.9 58.3 19.7 27.1 13.5 33.8 21.7 32.6 28.5 45.6 44.2
Commercial
area 1.38 0.55 0.02 0.53 17.1 0.31 1.07 1.43 0.12 0.61 0.47 2.01 0.02 5.67 10.28
Mixed
urban with
commercial
area 2.61 1.65 0.09 0.14 0.40 6.64 4.00 0.01 2.02 0.40 0.92 0.01 12.3 8.60
Ephemeral
Ponds 0.27 0.01 0.01 0.01 0.76 0.93 0.34 0.21 0.20 0.79 0.49 0.59 0.68 0.05
Barren land 1.14 1.71 2.12 2.37 8.01 6.66 3.29 5.97 1.26 3.82 4.54 0.50 1.12 2.66 0.26
Nonforested
Wet land 0.44 4.00 4.77
Mixed
Forest 3.47 13.5 11.0
WARD WISE % OF AREA LULC
Classes 16 17 18 19 20 21 22 23 24 25 26 27 28 29 30
Perennial
Fishing
ponds 4.04 2.84 0.64 3.05 3.27 2.93 2.48 5.70 4.90 13.3 2.44 13.9 9.96 24.5
Sandy area
other than
beaches 12.5
Rice mill
clusters 9.92 0.04 30.2 17.6

Land Use /Land Cover Classification of an Urban Area- A Case Study of Burdwan Municipality, India
Srimanta Gupta, Moupriya Roy
International Journal of Geomatics and Geosciences
Volume 2 Issue 4, 2012 1024
Mixed
urban with
mill areas 3.40 33.6 48.0 1.92 0.04 8.94 0.03
Herbaceous
Range Land 2.85 4.48 11.6 3.22 0.12 1.89 3.90 0.01 6.72 1.35 1.33 14.0 1.84 0.80 3.14
Play
Ground 1.62 0.07 3.91 3.36
Institutions 0.44 0.10 0.34 0.07 1.27 0.73 0.22 0.23
Hospital 3.01
Services
Area 0.26 2.21
Nurseries 0.85
Dense
Evergreen
Vegetation
Along with
residential
area 5.02 3.44 38.0 12.0 12.91
Table 5: Table showing Ward wise LULC scenario of Burdwan municipality (Ward number
31-35)
WARD WISE % OF AREA LULC Classes
31 32 33 34 35
Evergreen Vegetation Surrounding the forest area 0.2 0.92 0.13
Spar evergreen Vegetation Along with Residential area 12.5 8.4 5.35 15.03 10.6
Crop Land 0.01
Residential area 53.5 68.3 57.06 54
Commercial area 23.7 23.31 11.7 17.15 2.33
Mixed urban with commercial area 7.61 57.85 4.56 0.88 0.01
Ephemeral Ponds 0.34 0.18 0.24
Barren land 2.61 2.22 3.88 2.77 2.35
Streams & Canals 0.81 2.21
Perennial Fishing ponds 5.93 3.86 1.81 8.59
Perennial Nonfishing ponds 0.45 1.04 1.89 1.02
Mixed urban with mill areas 5.65
Herbaceous Range Land 0.11 8.61
Play Ground 1.99 4.21
Institutions 1.65 0.3 0.22
Acknowledgement
Authors would like to express gratitude to the department of environmental science, the
University of Burdwan for providing GIS laboratory facilities and also like to express sincere
gratitude to Prof. Jayanta Kumar Dutta, Dr Apurba Ratan Ghosh and Dr. Naba Kumar
Mondal for their constant moral support and valuable comments.

Land Use /Land Cover Classification of an Urban Area- A Case Study of Burdwan Municipality, India
Srimanta Gupta, Moupriya Roy
International Journal of Geomatics and Geosciences
Volume 2 Issue 4, 2012 1025
5. References
1. Anderson, J.R., (1971), Land use classification schemes used in selected recent
geographic applications of remote sensing, Photogrammetric Engineering and Remote
Sensing, 37(4), pp 379-387.
2. Anderson, J.R., Hardy, E.E., Roach, J.T., Witmer, R.E., et.al., (1976), A Land Use
and Land Cover Classification System for Use with Remote Sensor Data (revised),
U.S. Geological Survey 964, pp 28.
3. Chopra. N., (2012). Land use planning of southern part of Sonbhadra District, U.P.,
using Remote Sensing Techniques, International Journal of Geomatics and Geo
Sciences. 2(4), pp 934- 948.
4. Chopra. N., (2012). Land Use/ Land Cover information at various levels from
different scales of Remote Sensing data of Southern part of Sonbhadra district, U.P.
International Journal of Geomatics and Geo Sciences. 2(1), pp 336- 348.
5. Haider, L., Ait Belaid, M., Khalil, A.S., et.al., (2008), Analysis of Urban Planning in
Isa Town Using Geographic Information Systems Techniques, The International
Archives of the Photogrammetry, Remote Sensing and Spatial Information Sciences,
Beijing 37, pp 95-100.
6. Hutchinson, C.F., (1982), Techniques for Combining Landsat and Ancillary Data for
Digital Classification improvement, Photogrammetric Engineering and Remote
Sensing 48, pp 123-130.
7. Hyman, G., Leclerc, G., Beaulieu, N., et.al., (2000), GIS for Sustainable Development
at Local Scales: Applications in the Rural Hillsides, Savannas and Forest Margins of
Latin America, Paper for the 19th Congress of the International Society for
Photogrammetry and Remote Sensing Meeting (ISPRS), Amsterdam, the Netherlands.
8. Jenssen, L.L.,and Middelkoop, F.H., (1992), Knowledge-base crop classification of
Landsat Thermatic Mapper image, International Journal of Remote Sensing, 13, pp
2827-2837.
9. Karwariya.Sateesh, Goyal Sandip, (2011), Land use and Land Cover mapping using
digital classification technique in Tikamgarh district, Madhya Pradesh, India using
Remote Sensing , International Journal of Geomatics and Geo Sciences, 2(2), pp 519-
529
10. Lakshumanan.C., (2012). Landuse / Land cover dynamics study in Nilgiris district
part of Western Ghats, Tamilnadu. International Journal of Geomatics and Geo
Sciences. 2(3), pp 921- 933.
11. Ministerio del Medio Ambiente de Colombia, (1997), Bases ambientales para el
ordenamiento territorial. Ley 388 de julio 17 de 1997. [Environmental base for land
use planning. Law 388 of July 17th, 1997].

Land Use /Land Cover Classification of an Urban Area- A Case Study of Burdwan Municipality, India
Srimanta Gupta, Moupriya Roy
International Journal of Geomatics and Geosciences
Volume 2 Issue 4, 2012 1026
12. Prakasam.C., (2010), Land use and land cover change detection through remote
sensing approach: A case study of Kodaikanal taluk, Tamil nadu. International
Journal of Geomatics and Geo Sciences. 1(2), pp 150-158.
13. Rahman. S, Hasan. S. M. R, Islam, M. A, Maitra.M.K, (2011), Temporal change
detection of vegetation coverage of Dhaka using Remote Sensing , International
Journal of Geomatics and Geosciences, 2(2), 481-490.
14. Rodríguez, M, Rubiano, Y, Beaulieu, N. y Muñoz, O., et.al., (1999), Guía para la
evaluación de la capacidad de uso de los suelos y su aptitud para cultivos específicos
usando el sistema de información geográfica MapMaker Popular y la hoja de cálculo
Excel y. Informe interno, CIAT, Cali, Colombia, 46p, [Guide for the evaluation of
land use capacity and potential for specific crops.
15. Rubiano, Y, Santana, L.M. y Beaulieu, N., et.al., (1997), Criterios para la
planificación del uso de la tierra basada en unidades de paisajes, aplicación al
municipio de Puerto López. Informe interno, CIAT, Cali, Colombia, 27 p. [Criterias
for land use planning based on landscape units, application to Puerto López
municipality].