land use and natural resources planning for sustainable
TRANSCRIPT

Sustainability 2012, 4, 412-429; doi:10.3390/su4030412
sustainability ISSN 2071-1050
www.mdpi.com/journal/sustainability
Article
Land Use and Natural Resources Planning for Sustainable Ecotourism Using GIS in Surat Thani, Thailand
Khwanruthai Bunruamkaew * and Yuji Murayama
Division of Spatial Information Science, Graduate School of Life and Environmental Sciences,
University of Tsukuba, 1-1-1 Tennodai, Tsukuba, Ibaraki 305-8572, Japan;
E-Mail: [email protected]
* Author to whom correspondence should be addressed; E-Mail: [email protected];
Tel.: +81-29-853-4211; Fax: +81-29-853-4211.
Received: 13 February 2012; in revised form: 12 March 2012 / Accepted: 13 March 2012 /
Published: 21 March 2012
Abstract: The primary objective of this study is to evaluate the land use and natural
resources for future sustainable ecotourism site planning using GIS as a tool. The study is
based on 2007 land use land cover data and ecotourism suitability data which are then
integrated with other GIS datasets to evaluate the land use and natural resources at a
district level in Surat Thani province. The final step of this study was the prioritization of
the area that is best suited for ecotourism in assessing ecotourism sustainability in Surat
Thani province. The result is useful for tourism facilities development and ecotourism
resource utilization where ecotourism could be more developed. Additionally, the results
can be used for managers and planners working in local and central governments and other
non-governmental organizations. These integrated approaches cover complex and universal
issues such as sustainable development of ecotourism, biodiversity conservation and
protected area management in a tropical and developing country such as Thailand.
Moreover, it is believed that this study can be used as a basis for evaluating the suitability
of other areas for ecotourism. In addition, it may also serve as a starting point for more
complex studies in the future.
Keywords: GIS; ecotourism; land use; Surat Thani; Thailand
OPEN ACCESS

Sustainability 2012, 4
413
1. Introduction
Tourism is a highly complex activity and thus requires tools to assist in effective decision making to
come to terms with the competing economic, social, and environmental demands of sustainable
development [1]. Similarly, tourism activities generally can create various negative impacts on the
surrounding environment. Increased human interference in ecologically fragile areas can cause
irreversible change in the existing ecological processes. These problems can be reflected in degrading
natural resources, vegetation structure and the size of the habitat patch, increasing deforestation and
decreasing upstream water flows. Ecotourism encompasses a spectrum of nature-based activities that
foster visitor appreciation and understanding of natural and cultural heritage and are managed to be
ecologically, economically and socially sustainable [2]. Therefore, ecotourism is accepted as an
alternative type of sustainable development [3]. Ecotourism has attracted increasing attention in recent
years, not only as an alternative to mass tourism, but also as a means to promote a country’s economic
development and environmental conservation [4]. For example, in Costa Rica, Ecuador, Nepal, Kenya,
Madagascar and Antarctica, ecotourism represents a significant portion of the gross domestic product
and economic activity [5,6]. This necessitates a methodical management of ecotourism destinations,
which can minimize the impacts from ecotourism activities while offering benefits to local
communities. Ecotourism is based on the natural environment with a focus on natural and cultural
heritage. Hence, establishing a set of warning indicators and criteria is necessary for ecotourism
management [7]. Abidin (1995) identified a set of 15 criteria and 58 indicators for evaluating sustainable
ecotourism development in Taman Negara National Park (TNNP), Malaysia, on the basis of Delphi
method [8]. Boyd et al. (1994) and Boyd and Butler (1996) used a resource inventory to identify
potential ecotourism sites in Northern Ontario in Canada. GIS techniques were used to measure the
ranking of different sites according to the set criteria (naturalness, wildlife, cultural heritage, landscape
and community) for ecotourism [9,10]. Bukenya (2000) employed six criteria—a high number of
species, wildlife management potential, endangered species, potential to attract more tourists, less
susceptibility to encroachment and degradation over long period—to prioritize the potential national
parks in Uganda [11]. In Samoa, 20 critical sustainable indicators were developed by field testing and
screening to assess the overall sustainability [12]. There is no doubt that ecotourism represents more
friendly alternatives for economic use of natural resources, when compared to other consumptive
economic uses, such as mining, logging, farming, and others [7]. Furthermore, Kumari (2010)
integrated five indicator indices to identify and prioritize the potential ecotourism sites in West District
of Sikkim state in India by using analytical hierarchical process (AHP) and GIS. The primary variables
used for generating various indices were landform, elevation, land use/cover, vegetation diversity,
density and endemism, wildlife, tourism attraction features and the infrastructure facilities [13].
Godratollah et al. (2011) identified 61 indicators on environmental (ecological), social, economic,
cultural and institutional aspects affecting sustainability of ecotourism. The study shows that it is
possible to define a set of indicators for monitoring ecotourism sustainability in Northern forest of Iran [3].
Use of ecotourism indicators will help to identify the potential ecotourism sites based on the physical
environmental and socio-economic parameters [13].
Land use management practices have a major impact on natural resources including water, soil,
fertility, plants and animals [14,15]. In Thailand, being a tropical country, one of the prominent

Sustainability 2012, 4
414
characteristics of land use/cover change (LUCC) is the decline in forest and woodlands due to land
conversion, and particularly agricultural expansion for cash crop production such as cassava, corn, rice,
and sugarcane [16–18]. In order to determine the most desirable direction for future development, the
suitability for various land uses should be carefully studied with the aim of directing growth of the land
use to the most appropriate sites. Land suitability evaluation is the process of determining the fitness of a
given tract of land for proper use [19]. Careful planning of the use of land resources is based on land
evaluation, which is the process of assessing the suitability of land for alternative land uses [20]. Land
use is characterized by combination of land cover and human activities which can change over time. In
the definition of land use, a direct link is established between land cover and the actions of human beings
in their environment [21]. The process of land resource plans and decision making aims to identify the
most appropriate spatial pattern for future land uses [22]. Therefore, the monitoring of LUCC provides
significant input information for effective natural resources rehabilitation, protection and
conservation planning.
Among the most fundamental issues that need careful consideration when pursuing such a research
endeavor, are the quality of the data and the adoption of appropriate techniques. Likewise, GIS has
also been very helpful in facilitating LUCC studies [23]. These capabilities make them a promising
tool, especially for land use planning and LUCC modeling [24,25]. Additionally, GIS technology can
be used for suitability evaluation and management of land resources [26]. Site selection is also an
important use of GIS in tourism planning. For instance, by using suitable location identification tools
and topology it is possible to identify potential areas for further tourism development [27]. The land
suitability classifications will be determined by overlaying thematic maps and by analyzing attribute
data with the support of GIS [28]. Minagawa and Tanaka (1998) used GIS to locate areas suitable for
tourism development at Lombok Island in Indonesia. Using map overlay and multi-criteria evaluation
a number of potential sites for tourism development were identified [29]. GIS can play a critical role in
auditing environmental conditions, examining the suitability of locations for proposed development
sites, identifying conflicting interests and modeling relationships [30].
This study investigated Surat Thani to prepare ecotourism planning for sustainable development
involving GIS as a tool for evaluating and monitoring the natural resources, especially potential
ecotourism sites. GIS is a tool to acquire, explore and analyze the geospatially distributed objects and
their associated attribute information that can improve decision making. Nowadays, GIS is an integral
part of spatial planning to identify the suitability of sites based on existing land resources which can be
integrated with non-spatial information (i.e., socio-economic, government policy, etc.) by decision
makers [31]. Therefore, the study aims to evaluate and monitor the natural resources used for
ecotourism site selection on the land ecosystem of Surat Thani province using GIS. The methodology
is to generate land use/cover (LUC) map for ecotourism and present a suitable area for ecotourism
development at a district level. Likewise, the land ecosystem resources and aesthetics are related to
terrestrial ecotourism, i.e., ecosystems located inland, excluding marine ecosystem. These land
ecosystem resources cover landscape, flora, fauna, culture and the way of life of local people while its
activities consist of such as, trekking, biking, bird watching, cultural study, natural study, etc. [32].
Surat Thani was selected as the research area. It plays an important role for ecotourism; the physical
attributes and scale of Surat Thani landscape make the area a prime candidate for ecotourism. This area
contains rich biodiversity, wildlife, trekking, scenic, and other attractions. Socio-economic activities

Sustainability 2012, 4
415
impose increasing pressure on land resources, thereby creating competition and conflicts in their uses.
Therefore, it is important to maintain a careful balance between preservation and the promotion of
sustainable development in order to ensure the long-term health of both the ecosystems and the tourism
economies in this province. Since, the lack of tourism planning and management currently inhibit
Surat Thani province from fulfilling its tourism potential. Many destination areas are being developed
on the basis of supply push, rather than the existing market demand. This may cause duplication,
competition and oversupply among those attractions. There is a lot of package holidays and mass
tourism. Due to the rapid growth of mass tourism, some activities can degrade natural resources,
especially when confronted with poor management [33]. Hence, it is necessary to identify the area
suitable for ecotourism in order to help in the decision making of the concerned authorities and help to
maintain the environment of these attractions. Likewise, a challenge for a decision maker is how to
manage ecotourism in order to minimize the negative impacts. Therefore, ecotourism planning is needed
for sustainable tourism development in Surat Thani by guiding regional land use decisions that provide
the greatest benefits in terms of conservation of biodiversity and other ecosystem services.
2. Study Area
The study area is focused on the land ecosystem of Surat Thani province in the south of Thailand
which covers an area of 1,250,957.61 ha and consists of 17 districts (Figure 1). This area is situated
along the coastline of Surat Thani province, which has a length of around 156 km together with
various islands. There are ferries providing transportation from main land to the islands at Don Sak
district. The province of Surat Thani also occupies the largest area on the coast of the Gulf of Thailand.
The topography of this area is a combination of mountain ranges, valleys and river plains. The
northern and southern parts are mostly mountainous. The local climate is influenced by the northeast
monsoon towards the Gulf of Thailand and the southeast monsoon from the Indian Ocean. This study
area appears to have many potential attributes that can be explored and utilized for successful
ecotourism development. For example, it is a rich in nature, history and culture which make it a
favorite destination for various international tourists. Besides, there have been a number of provincial
parks which further the recreational-tourist presence and help to safeguard some of the natural features.
This province is one of the most popular and important tourism areas of Thailand. The types of
tourism include natural tours, cultural tours, excursions and recreational activities. Most tourist
attractions are popular among Thais and foreigners with a gradually increasing number. The Tourism
Authority of Thailand (TAT) estimates that the number of tourists has increased dramatically since
2003 from 1.64 million and up to 2.58 million tourists in 2007. Whereas, the rapid increase of visitors
in this province can be considered a warning signal for tourism development in this region. In recent
years, policy makers have begun to advocate sustainable destination planning for tourism in Thailand
with a set of management approaches but an information systems to assist decision making is less
apparent. Besides, most of the management approaches are focused on meeting the demands of the
tourists rather than the needs of the ecotourism resources. It must be recognized that at present
resource managers at site level still lack a fundamental understanding of ecotourism management and
an ability to develop the resources’ ecotourism potential in assessing sustainable development of

Sustainability 2012, 4
416
ecotourism. Therefore, planning is essential for future development to conserve the natural
environment of the ecotourism destinations in a sustainable manner.
Figure 1. Location of the study area.
3. Data and Methods
3.1. Data Acquisition and Pre-processing
The primary input data of the 2007 LUC and topographic map are derived from the Department of
Land Development, Thailand at the scale of 1:50,000. The thematic maps are created and edited,
overlaid and visualized on ArcGIS 9.3. There are 5 main classified LUC classes in Surat Thani
province. These are urban and built-up land (U), agricultural land (A), forest (F), water body (W) and
miscellaneous land (M). This study considered some important issues related to ecotourism potential
resources. There were 10 LUC classes determined in this study. The definition and characteristics of
each LUC class is described as follows:
(1) Crop land (AC) includes paddy fields, field crops, truck crops and horticulture.
(2) Farm land (AF) includes pasture and farm houses, poultry farm houses and aqua cultural land.
(3) Orchard (AO) is an agricultural land which consists of mixed orchard and orchard (orange,
durian, rambutan, coconut, and cashew).
(4) Plantation (AP) is an agricultural land which consists of mixed perennials and perennials (oil
palm, para-rubber, eucalyptus, teak, magosa, casuarinas, and coffee).
(5) Dense forest (F) consists of the main natural forest including evergreen forest, swamp forest
and mangrove forest.

Sustainability 2012, 4
417
(6) Open forest (FO) is forest lands in which further the recreational lands are included in mixed
forest plantations, forest plantations and agro-forestry that are caused by human activity, such
as conversion of forest areas, vegetated areas for new cultivation.
(7) Degraded forest (FD) includes disturbed evergreen forest, disturbed swamp forest, disturbed
mangrove forest and disturbed forest plantations.
(8) Miscellaneous land (M) includes rangelands (grass, scrub, and bamboo), marsh and swamp,
mines and pits (laterite pits, sand pits, and soil pits) and other.
(9) Urban and built-up land (U) is composed of cities, towns and commercial, residential houses,
villages, institution land, industrial land, transportation, communications, utilities and so forth.
(10) Water body (W) includes both natural water bodies (rivers, canals, and lakes) and man-made
(reservoirs, dams, farm ponds, and irrigation canals).
3.2. Classified LUC Map
This part is to generate LUC map 2007 for ecotourism development focuses in land ecosystems of
Surat Thani province. The various LUC types were identified according to the bio-physical vegetation
characteristics for ecotourism potential resources and the background knowledge of the study area.
Therefore, the LUC 2007 was reclassified into 10 LUC classes presented in Figure 2. The result of the
area coverage of each LUC class in hectares shows in Table 1. It could be seen that, from the total area
of 1,250,957.61 ha of the province being classified, about 60.12% was used for various agricultural
uses, such as oil palm, para-rubber, orchard and other crops/farm land, while 31.27% was classified as
forest area. Less than 3% was classified as urban and built-up area.
Figure 2. Classified land use/cover (LUC) map of Surat Thani province in 2007.

Sustainability 2012, 4
418
Table 1. Area coverage of land use/cover change (LUCC) classes in 2007.
LUC Type Area (ha) Proportion (%)
Crop Land (AC) 24,793.02 1.98 Farm Land (AF) 18,050.94 1.44 Orchard (AO) 43,688.62 3.49 Plantation (AP) 665,634.10 53.21 Dense Forest (F) 381,372.70 30.49 Degraded Forest (FD) 8,893.26 0.71 Open Forest (FO) 825.03 0.07 Miscellaneous Land (M) 45,822.42 3.66 Urban & Built-up Land (U) 33,064.38 2.64 Water Body (W) 28,813.14 2.30
Total area 1,250,957.61 100.00
3.3. Classification of Suitable Areas for Ecotourism
This study has been built upon the land suitability map for ecotourism to classify suitability by each
LUC type at district level [34]. This study demonstrates a methodology for identifying potential
ecotourism sites using GIS and AHP as case study of Surat Thani province, Thailand. The main steps
to produce land suitability map for ecotourism are: finding suitable factors to be used in the analysis,
assigning factor priority, weight and class weight (rating) to the parameters involved and generating
land suitability map of ecotourism. In this process, experts’ opinions were asked to calculate the
relative importance factors involved. The AHP is one of the most extended Multi-Criteria Decision
Making (MCDM) techniques. This method provides a structural basis for qualifying the comparison of
decision elements and criteria in a pair wise technique. The decision criteria and factors were divided
into two main categories according to the land ecosystems of Surat Thani: physical environmental and
socio-economic parameters. This study selected five criteria and nine factors in the form of nine
GIS-based layers in determining what areas are best suited for ecotourism development. These are
landscape/naturalness (visibility, land use/cover), wildlife (reservation/protection, species diversity),
topography (elevation, slope), accessibility (proximity to cultural sites, distance from roads) and
community characteristics (settlement size). These criteria and factors were chosen based on the
opinion experience and expertise of experts, surveying of authenticated literatures and analysis of
historical data. The flow chart of the suitability analysis methodology is shown in Figure 3.
First, the AHP method was applied to determine the relative importance of all selected criteria and
factors. Each criterion and factor received a weight and a score which represented its relative
importance in the suitability evaluation. The total score for suitability is achieved by multiplying
criterion score with its appropriate weight and adding all weighted scores. At the next stage, spatial
data of the 9 factors as a set of GIS layers were overlaid together for final suitability classification for
ecotourism. Further analysis was done in raster-based format and was then reclassified into 4 classes
using the ‘reclassify’ function. Finally, the suitability map for ecotourism was produced using GIS
overlay. At the end of this process, the suitability map for ecotourism development is generated. The
degree of suitability of each factor classified as highly suitable (S1), moderately suitable (S2),
marginally suitable (S3) and not suitable (N) is displayed in Figure 4.

Sustainability 2012, 4
419
Figure 3. Flow chart of the suitability analysis.
Figure 4. Land suitability map for ecotourism in Surat Thani province [34].
Sustainability 2012, 4
420
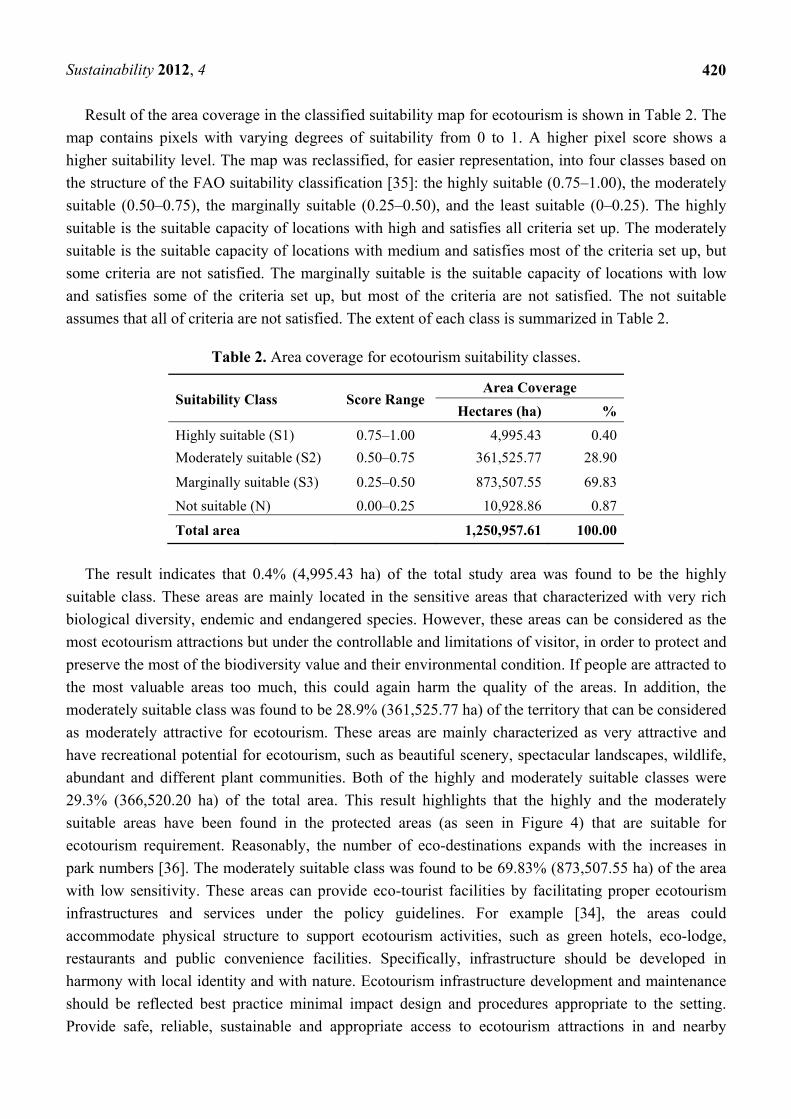
Result of the area coverage in the classified suitability map for ecotourism is shown in Table 2. The
map contains pixels with varying degrees of suitability from 0 to 1. A higher pixel score shows a
higher suitability level. The map was reclassified, for easier representation, into four classes based on
the structure of the FAO suitability classification [35]: the highly suitable (0.75–1.00), the moderately
suitable (0.50–0.75), the marginally suitable (0.25–0.50), and the least suitable (0–0.25). The highly
suitable is the suitable capacity of locations with high and satisfies all criteria set up. The moderately
suitable is the suitable capacity of locations with medium and satisfies most of the criteria set up, but
some criteria are not satisfied. The marginally suitable is the suitable capacity of locations with low
and satisfies some of the criteria set up, but most of the criteria are not satisfied. The not suitable
assumes that all of criteria are not satisfied. The extent of each class is summarized in Table 2.
Table 2. Area coverage for ecotourism suitability classes.
Suitability Class Score Range Area Coverage
Hectares (ha) %
Highly suitable (S1) 0.75–1.00 4,995.43 0.40
Moderately suitable (S2) 0.50–0.75 361,525.77 28.90
Marginally suitable (S3) 0.25–0.50 873,507.55 69.83
Not suitable (N) 0.00–0.25 10,928.86 0.87
Total area 1,250,957.61 100.00
The result indicates that 0.4% (4,995.43 ha) of the total study area was found to be the highly
suitable class. These areas are mainly located in the sensitive areas that characterized with very rich
biological diversity, endemic and endangered species. However, these areas can be considered as the
most ecotourism attractions but under the controllable and limitations of visitor, in order to protect and
preserve the most of the biodiversity value and their environmental condition. If people are attracted to
the most valuable areas too much, this could again harm the quality of the areas. In addition, the
moderately suitable class was found to be 28.9% (361,525.77 ha) of the territory that can be considered
as moderately attractive for ecotourism. These areas are mainly characterized as very attractive and
have recreational potential for ecotourism, such as beautiful scenery, spectacular landscapes, wildlife,
abundant and different plant communities. Both of the highly and moderately suitable classes were
29.3% (366,520.20 ha) of the total area. This result highlights that the highly and the moderately
suitable areas have been found in the protected areas (as seen in Figure 4) that are suitable for
ecotourism requirement. Reasonably, the number of eco-destinations expands with the increases in
park numbers [36]. The moderately suitable class was found to be 69.83% (873,507.55 ha) of the area
with low sensitivity. These areas can provide eco-tourist facilities by facilitating proper ecotourism
infrastructures and services under the policy guidelines. For example [34], the areas could
accommodate physical structure to support ecotourism activities, such as green hotels, eco-lodge,
restaurants and public convenience facilities. Specifically, infrastructure should be developed in
harmony with local identity and with nature. Ecotourism infrastructure development and maintenance
should be reflected best practice minimal impact design and procedures appropriate to the setting.
Provide safe, reliable, sustainable and appropriate access to ecotourism attractions in and nearby

Sustainability 2012, 4
421
natural areas. While, only a few percentage of the area is about 0.87% (10,928.86 ha) which was
classified as not suitable for ecotourism refers to the areas with several effects of development from
human activity and degraded forest. There is decreasing of forest because of deforestation for
agriculture areas, the cultivation of steep slopes, trespassing upon public area to be dwelling of local
people and illegal wood processing. Such areas are in a deteriorated condition or have been destroyed.
3.4. Comparison between LUC Map and Suitability Map
The spatial matching offered valuable information to identify whether the land was optimally
utilized in the region [37]. The result of overlaying the suitability map (Figure 4) with the LUC map of
2007 (Figure 2) is presented in Table 3. This table displays the suitability of each LUC type in
the study area.
Table 3. Classification of suitability by each LUC type.
LUC
Type
Highly Suitable
(S1)
Moderately Suitable
(S2)
Marginally Suitable
(S3)
Not Suitable
(N)
Total
Area
ha % ha % ha % ha % ha
AC 0.00 0.00 38.61 0.01 24,229.35 2.77 525.06 4.80 24,793.02
AF 0.00 0.00 13.77 0.00 17,717.67 2.03 319.50 2.92 18,050.94
AO 3.6 0.07 2,119.2 0.59 41,025.37 4.70 540.45 4.95 43,688.62
AP 202.77 4.06 19,952.97 5.52 643,562.73 73.68 1,915.63 17.53 665,634.10
F 4782.04 95.73 331,527.84 91.70 44,918.73 5.14 144.09 1.32 381,372.70
FD 5.22 0.10 400.86 0.11 8,076.87 0.92 410.31 3.75 8,893.26
FO 0.00 0.00 183.96 0.05 641.07 0.07 0.00 0.00 825.03
M 0.00 0.00 723.96 0.20 39,911.76 4.57 5,186.70 47.46 45,822.42
U 1.80 0.04 330.75 0.09 31,185.09 3.57 1,546.74 14.15 33,064.38
W 0.00 0.00 6,233.85 1.72 22,238.91 2.55 340.38 3.11 28,813.14
Total 4,995.43 100.00 361,525.77 100.00 873,507.55 100.00 10,928.86 100.00 1,250,957.61
The LUC map indicates that the four major land uses are plantation (655,634.10 ha), dense forest
(381,372.70 ha), miscellaneous land (45,822.42 ha) and orchard (43,688.62 ha), which account for
53.21%, 30.49%, 3.66% and 3.49%, respectively, of the total study area. Dense forest (F) that is
mainly dry evergreen forest and mixed deciduous forest is mainly located in the protected areas.
Considering plantation is mainly characterized by para-rubber and oil palm that is the most important
cash crop in Southern Thailand. Miscellaneous land includes rangelands, marsh and swamp. The
orchard consists of mixed orchard (such as rambutan, durian, mangosteen, orange, etc,) and coconut.
As expected, the highly suitable and moderately suitable areas for ecotourism were found in the
dense forest but these utilized lands should be controlled under the use of certain limitations and
guidelines. If too many people claim the most valuable areas, this could again harm the quality of the
areas. The result indicates that 95.73% of the highly suitable class was distributed over the dense
forest, while only 4.06% of this classification was located in the plantations. With respect to the
moderately suitable class, 91.70% was also found in the dense forest, whereas only 5.52% of the class
was located in the plantation. However for the marginally suitable area, 73.68% was found in the
plantations. This is because plantation areas should be properly monitored and protected from any

Sustainability 2012, 4
422
encroachment. In addition, the unsuitable class was distributed over the miscellaneous land (47.46%).
This class was also found in the plantations (17.53%) and the urban and built-up land (14.14%) that is
generally suitable for eco-tourist infrastructure development.
3.5. Classification of Suitable Areas for Ecotourism at District Level
The zonal analysis method was used to determine the average suitability for each district. This
method is the creation of an output raster (or statistics table) in which the desired function is computed
on the cell values from the input value raster that intersect or fall within each zone of a specified input
zone dataset. The ecotourism land suitability analysis at district level was also assessed and the results
are shown in Table 4.
Table 4. Classification of suitable areas for ecotourism at district level.
District
Highly Suitable
(S1)
Moderately Suitable
(S2)
Marginally Suitable
(S3)
Not Suitable
(N)
ha % ha % ha % ha %
Tha Chana 315.45 7.34 6,338.70 1.75 59,013.36 6.78 1,126.26 10.06
Chaiya 446.94 10.41 29,117.70 8.06 61,376.67 7.05 1,489.50 13.30
Tha Chang 87.12 2.03 32,950.89 9.12 76,571.64 8.79 986.04 8.81
Ban Takhun 290.70 6.77 123,723.63 34.25 34,942.05 4.01 87.12 0.78
Wipavadee 526.86 12.27 22,603.68 6.26 20,031.84 2.30 0.00 0.00
Donsak 0.00 0.00 4,085.01 1.13 29,469.06 3.38 0.00 0.00
Karnjanadit 248.40 5.78 22,564.62 6.25 83,084.40 9.54 648.36 5.79
Punpin 0.00 0.00 313.92 0.09 93,665.52 10.75 2,973.24 26.55
Muang Surat Thani 0.00 0.00 43.56 0.01 33,273.90 3.82 78.03 0.70
Khiriratnikom 1,329.03 30.94 14,945.04 4.14 51,322.05 5.89 75.24 0.67
Phanom 306.90 7.14 69,532.47 19.25 49,318.11 5.66 132.66 1.18
Ban Nasan 692.82 16.13 25,640.73 7.10 47,035.71 5.40 946.89 8.46
Ban Nadeam 0.00 0.00 11.61 0.00 20,121.21 2.31 1,453.68 12.98
Kiansa 0.00 0.00 1,885.41 0.52 69,457.68 7.97 468.72 4.19
Wieng Sra 7.65 0.18 3,680.28 1.02 31,178.61 3.58 601.83 5.37
Prasang 42.57 0.99 2,022.21 0.56 75,213.90 8.64 130.68 1.17
Chai Buri 0.99 0.02 1,739.97 0.48 35,900.55 4.12 0.00 0.00
Total 4,295.43 100.00 361,199.43 100.00 870,976.26 100.00 11,198.25 100.00
Note: District locations are shown in Figure 1.
The result indicates that the highly suitable areas (S1) are mostly located in the districts of
Khiriratnikom (30.94%) and Ban Nasan (16.13%). These districts are characteristically endowed with
lush green forests, wildlife sanctuaries and a rich cultural heritage and they are mainly located in
protected areas. Therefore, the management of these areas is comprehensive and addresses issues of
resource conservation, environmental management, and the control of tourism development. For
instance, these areas can be used for education as well as conservation of biodiversity and maintenance
of the ecosystem. Then, the moderately suitable areas (S2) are mainly located in the districts of Ban
Takhun (34.25%) and Phanom (19.25%). Most of these are largely free from urban settlements, with a
unique and outstanding natural beauty, diverse attractions and great tourism potential. Most of them

Sustainability 2012, 4
423
are located in the protected areas, where they are attractive and have recreational potential for
ecotourism. Subsequently, the three areas with the highest percentages of marginally suitable land
(S3) are located in Punpin (10.75%), Karnjanadit (9.54%) and Tha Chang (8.79%) districts. The most
appropriate areas are mainly located in urban area. The areas are appropriate for facilities development
because there are no conflicts or any restrictions on usage areas. These areas can provide ecotourism
services which take into account the condition of the natural environment, local society and culture.
Finally, the percentages of unsuitable areas (N) for ecotourism are often located in urban areas of
Punpin district (26.55%) and Chiya district (13.30%).
More specifically, ecotourism development needs to consider additional environmental problems
which can be controlled using sustainable ecotourism site planning where the areas are suitable for
ecotourism. This classification of suitable areas for ecotourism at district level also encouraged the
development of a database and inventory of natural areas with ecotourism potential to minimize
fragmentation and duplication in planning.
4. Results and Discussion
This study is at the preliminary stage of assessing whether land is likely to be practical and
successful for future sustainable ecotourism sites. The study was conducted from the perspective of
natural resource management and future sustainable ecotourism development using GIS. The GIS data
offered LUC information that was crucial to examining the spatial matching between the potential
suitability areas and the current LUC patterns. This information helped to identify priority areas for
ecotourism and whether future land uses can be modified for future development within the province.
This study further classified suitable areas for ecotourism at district level of Surat Thani where
ecotourism sites should be promoted. The application of this paper can be useful for the managers and
planners working in local and central governments and other non-governmental organizations. Since
tourism in Surat Thani is largely dependent on a major use of natural resources and biodiversity, it is
recommended that tourism be specifically addressed by regional policies that deal with biodiversity
and conservation. More specifically to this study, it should be noted that the land suitability map for
ecotourism is intended to guide regional land use decisions. It can be used for a decision making
process that allocates land to the uses that provide the greatest benefits in terms of conservation of
biodiversity and other ecosystem services in this province. Therefore, an ecotourism development plan
should be incorporated into the development plans at district, provincial and regional levels to link
resources which can complement each other. This will make it easier to redirect tourists away from
tourism resources whose capacity is already exceeded.
In addition, this study result appears practically useful for the development of tourism facilities and
ecotourism resource utilization: First, for the highly suitable areas (4,995.43 ha), most of which are
located in the protected areas (Figure 4) characterized by dense forest and need to be conserved. Its
high value of natural resources is suitable for research and education because some are involved in the
sensitive areas. To maintain ecotourism, development must control and manage the resources in order
to retain their original conditions as far as possible, and to avoid or to abstain from travelling in
sensitive areas [38]. Thus, this area can still be considered for ecotourism attraction, but with the use of
certain limitations and guidelines. Hence, the example of guidelines to be used to limit the number of

Sustainability 2012, 4
424
tourists and duration of access to the areas is the necessary code of conduct. Activities suggested for
these areas include those for purposes of research and education [39]. With regards to preserving most
of the biodiversity value, ecosystem protection is the first issue for ecotourism development in
environmentally sensitive areas. Moreover, effective and responsible marketing of ecotourism
opportunities can be used as a form of visitor management, creating realistic expectations and an
understanding of allowable and acceptable behavior while visiting sensitive natural areas. However,
reducing the amount of visitor pressure on these sites is recommended.
Secondly, the moderately suitable class was found to consist of 361,525.77 ha of the total area that
could serve as major attractions for ecotourism. Most of them are located in the protected areas. The
majority of the marginally suitable land (873,507.55 ha of the total area) can be considered for
ecotourism by incorporating appropriate infrastructures and services under the policy guidelines.
Finally, about 10,928.86 ha of the total area was classified as unsuitable for ecotourism because some
are degraded forest areas and destroyed public areas that would cause severe environmental
degradation from an effective use of land for human requirements. Thus, it should be strictly restricted
from tourism and any activities. It is very important that more people, especially Surat Thani visitors,
are educated in the concept of sustainable development and the principles of sustainable living [40].
Therefore, issues of ecosystem management and conservation of biodiversity should be addressed with
local communities and stakeholders in protecting ecosystem and biodiversity [41–43]. These will
increase opportunities for local people and communities to participate in ecotourism and will help in
distributing the income. More importantly, apart from local communities, the government and
international agencies play a very important role for promotion as well as demotion of any initiative.
Civil societies need to be more responsible for sustainable ecotourism to safeguard public lands,
protected forests, water bodies, and violation of local and indigenous customary rights [44]. This
consideration is a very important aspect for high-quality tourism in this province.
However, the GIS tool is only a preliminary way to assess appropriate land areas which may be
suitable for ecotourism. This study is just a beginning, its regular monitoring and needs-based
implementation of activities is crucial for this work. Carrying capacity should be dealt with higher up
where the marketing element is discussed. Local communities can play a crucial role in planning,
organizing community and stakeholder engagement, finding other forms of land use and environmental
impact assessments, as well as performing social impact assessments. Provincial and federal
governments also should recognize the contribution of the local people. Likewise, ecotourism
management must take the character and potential of existing resources from the suitability map for
ecotourism in order to arrange appropriate activities and to ensure compatibility between ecotourism
and the original activities carried out in the area. This should include the avoidance of any serious
conflict, especially in areas that are highly suitable for ecotourism, with other forms of tourism. For
example, zoning, i.e., establishing a tourism zone, a conservation zone, a buffer zone, and a
rehabilitation zone, which should be done not only in protected areas but also in areas which are
currently not suitable for ecotourism, the land having severe limitations that preclude the given type of
use, but can be improved by specific management. We believe that if such tourism strategies are
introduced according to these zones, they can prevent further deforestation and improve the
appropriate use of land in the buffer zone. In addition, ecotourism marketing will have to wait until the
resources are more ready, but in the meantime existing tourism activities in potential ecotourism areas

Sustainability 2012, 4
425
are in need of proper control and guidelines if they are not to be subject to environmental deterioration
and destructive competition in order to attract ever greater numbers of visitors which would have a
greater impact on the goal of promoting sustainability. This is a good form of alternative tourism but
numbers and land use should be carefully monitored. Therefore, the ecotourism market is expected to
grow somewhat slowly until many of the issues mentioned here are addressed.
Additionally, ecotourism development must promote educational development and create awareness
in people of the need to jointly maintain the ecosystem of the area. There is a need to implement
development plans and manage natural resources in a way that ensures ecological and environmental
integrity. Environmental education and interpretation is the key to creating an enjoyable and
meaningful ecotourism experience, and is one of the key points of differentiation between ecotourism
and other tourism products. Successful interpretive components of ecotourism products will foster
appreciation and support for conservation efforts, local communities and culture [2]. Moreover, a
further study should be done implementing other sub-related models such as the carrying capacity
model in establishing a comprehensive ecotourism resource management plan. Furthermore, this can
be done by allowing local people, communities and organizations to participate in environmental and
resource management [45] and by creating legal and economic measures to control environmental and
resource use, including setting up a management system that can foster economic development and
improvements in people’s quality of life. In addition, villagers should be empowered to manage natural
resources within the boundary of their own villages. This study recommended that local people should
be involved in the planning process under participatory approaches, i.e., when decision makers prepare
a plan, they must consider local people’s opinions and their interest [27].
Furthermore, this study might be useful to those who are interested in the GIS technique for
assessment and monitoring of natural resources, especially ecotourism sites and mapping. GIS plays a
key role in documenting natural conditions, developments and documenting the suitability of resources
for tourism, exposing conflicts, and revealing cause-effect relationships [46,47]. As previously
mentioned, the use of GIS is not only ideal for reducing the time and cost of site selection, but also
provides a digital data bank for long-term and beneficial monitoring of sites [48]. The study shows that
GIS can evaluate dynamic patterns of LUCC as well as providing a preliminary study for identifying
priority areas for ecotourism and thus, it contributes to improving the efficiency of conservation and of
sustainable land management in the Surat Thani province. This approach can be used as a basis for
evaluating the suitability of other areas for ecotourism and it may also serve as a starting point for
more complex studies in the future taking into consideration those limitations encountered in
this study.
Finally, land use decisions are based not only on such information but also on other assessments,
such as economic analysis of land uses and environmental impact assessments. Since only a small
number of socio-economic factors have been considered for the evaluation of land suitability, it is
recommended to incorporate more factors to represent a holistic view of the actual process, such as
distance from local community or from protected areas. Moreover, research can be extended to
explore the application of other information sources such as remote sensing images, Global Positioning
System (GPS), etc. which should be encouraged as it will help bring real changes to land use and
management strategies.

Sustainability 2012, 4
426
Acknowledgments
The authors gratefully thank the Royal Thai Government Scholarship for financial support.
Likewise, I would also like to express thanks to Ko Ko Lwin for his valuable comments and
suggestions. Finally, special thanks are given to the anonymous referees and the editor for their useful
suggestions in the revision of this manuscript.
References and Notes
1. Fadahunsi, J.T. Application of Geographical Information System (GIS) technology to tourism
management in lle-lFe, Osun State, Nogeria. Pac. J. Sci. Technol. 2011, 2(13), 274–283.
2. Tourism Queenland. Queensland Ecotourism Plan 2003–2008; Tourism Queensland: Brisbane,
Australia, 2002.
3. Godratollah, B.; Azlizam, A.; Manohar, M.; Mohd, H.I.; Syed, M.H. Delphi technique for
generating criteria and indicators in monitoring ecotourism sustainability in Northern forests of
Iran; case study on Dohezar and Sehezar Watersheds. Folia Forestalia Polonica Series A 2011,
53(2), 130–141.
4. Tewodros, K.T. Geospatial Approach for Ecotourism Development: A Case of Bale Mountains
National Park, Ethiopia. Master Thesis, Faculty of Natural Science, Department of Earth
Sciences, Addis Ababa University, Addis Ababa, Ethiopia, 2010.
5. Isaacs, J.C. The limited potential of ecotourism to contribute to wildlife conservation. The
Ecologist 2002, 28(1), 61–69.
6. Eadington, W.R.; Smith, V.L. The Emergence of Alternative Forms of Tourism, in Tourism
Alternatives: Potentials and Problems in the Development of Tourism; University of Pennsylvania
Press: Pennsylvania, PA, USA, 1992.
7. Li, W. Environmental Management indicators for ecotourism in China’s nature reserve: A case
study in Tianmushan nature reserve. Tourism Manage. 2004, 25(5), 559–564.
8. Abidin, Z.Z. The Identification of Criteria and Indicators for the Sustainable Management of
Ecotourism in Taman Negara National Park, Malaysia: A Delphi Consensus. Ph.D. Dissertation,
West Virginia University, Morgantown, WV, USA, 1995.
9. Boyd, S., Butler, R., Haider, W.; Perera, A. Identifying areas for ecotourism in Northern Ontario:
Application of a Geographical Information System methodology. J. Appl. Recreat. Res. 1994,
19(1), 41–46.
10. Boyd, S.W.; Butler, R.W. Seeing the forest through the trees: using GIS to identify potential
ecotourism sites in Northern Ontario. In Practicing Responsible Tourism: International: Case
Studies in Tourism Planning, Policy and Development; Harrison, L.C., Husbands, W., Eds.;
J. Wiley & Sons: New York, NY, USA, 1996; pp. 380–403.
11. Bukenya, J.O. Application of GIS in Ecotourism Development Decisions: Evidence from the
Pearl of Africa; Research Paper; Natural Resource Economics Program, West Virginia University:
Morgantown, WV, USA 2000. Available online: http://www.rri.wvu.edu/pdffiles/bukenya2012.pdf
(accessed on 4 April 2010).
12. Twining-ward, L. Monitoring sustainable tourism in Samoa. Industry Environ. 2002, 24, 46–47.

Sustainability 2012, 4
427
13. Kumari, S.; Behera, M.D.; Tewari, H.R. Identification of potential ecotourism sites in West
District, Sikkim using geospatial tools. Trop. Ecology 2010, 51(1), 75–85.
14. Di Gregorio, A.; Jansen, L.J.M. A new concept for a land cover classification system. The Land
1998, 2, 55–65.
15. Baniya, N. Land Suitability Evaluation Using GIS for Vegetable Crops in Kathmandu Valley,
Nepal. Ph.D. Dissertation, Institute of Horticulture Science, Faculty of Agriculture, Humboldt
University of Berlin, Berlin, Germany, 2008.
16. FAO. State of the World’s Forests 1997; Food and Agriculture Organization of the United
Nations (FAO): Rome, Italy, 1997.
17. FAO. State of the World’s Forests 2003; Food and Agriculture Organization of the United
Nations (FAO): Rome, Italy, 2003.
18. Barbier, E.B.; Burgess, J.C. The economics of tropical deforestation. J. Economic Surveys 2001,
15(3), 413–421.
19. Marsh, S.P.; MacAulay, T.G. Land reform and the development of commercial agriculture in
Vietnam: Policy and issues. Agribus. Rev. 2002, 10(1), 1–19.
20. Fresco, L.O.; Huizing, H.; Keulen, H.V.; Luning, H.A.; Schipper, R.A. Land Evaluation and
Farming Systems Analysis for Land Use Planning, FAO Working Document; FAO: Rome,
Italy, 1994.
21. Jamal, B.N. Land Evaluation for Land Use Planning with Especial Attention to Sustainable
Fodder Production in the Rouzeh Chai Catchment of Orumiyeh Area, Iran. Master Thesis,
International Institute for Geo-Information Science and Earth Observation, Enschede,
The Netherland, 2003.
22. Arabinda, L. Integrating GIS and Multi-Criteria Decision Making Techniques for Land Resource
Planning. Master Thesis, International Institute for Geo-Information Science and Earth
Observation, Enschede, The Netherland, 2003.
23. Estoque, R.C.; Murayama, Y. Spatio-temporal urban land use/cover change analysis in a hill
station: the case of Baguio city, Philippines. Procedia. Soc. Behav. Sci. 2011, 21, 326–335.
24. Serneels, S.; Lambin, E.F. Proximate causes of land use change in Narok District Kenya: A case
spatial statistical model. Agr. Ecosyst. Environ. 2001, 85(1–3), 65–81.
25. Wu, Q.; Li, H.; Wang, R.; Paulussen, J.; He, Y.; Wang, M.; Wang, B.; Wang, Z. Monitoring and
predicting land use change in Beijing using remote sensing and GIS. Landscape Urban Plan.
2006, 78(4), 322–333.
26. Obi Reddy, B.P.; Maji, A.K.; Srinivas, C.V.; Kamble, K.H. and Velayutham, M. GIS-based basin
morphometric information system for terrain and resources analysis. In Proceedings of First
National Conference on Agro-Informatics, Dharwad, India, June 2001; pp. 37–42.
27. Azizur, R.M. Application of GIS in Ecotourism Development: A Case Study in Sundarbans,
Bangladesh. Master Thesis, Department of Social Science, Mid-Sweden University, Ostersund,
Sweden, 2010.
28. Chuong, M. Multi-Criteria Land Suitability Evaluation for Selected Fruit Crops in Hilly Region of
Central Vietnam. Ph.D. Dissertation, Humboldt University of Berlin, Berlin, Germany, 2007.

Sustainability 2012, 4
428
29. Minagawa, Y.; Tanaka, N. Application of Geographic Information Systems to tourism
development planning: A case study of Lombok, Indonesia. UNCRD Research Report Series
No. 27; United Nations Centre for Regional Development: Nagoya, Japan, 1998.
30. Bahaire, M.; Elliot-White, M. The application of Geographical Information Systems (GIS) in
sustainable tourism planning: A review. J. Sustain. Tourism 1999, 7(2), 159–174.
31. Bauer,T.; Dowing, R.K. Ecotourism policies and issues in Antarctica. In Ecotourism Policy and
Planning; Fennell, D.A., Dowind, R.K., Eds.; CAB International: Wallingford, UK, 2003;
pp. 309–330.
32. Anomasiri, W. Eastern Philosophy of Ecotourism Management Model in Mae Hong Son
Province, Thailand. Master Thesis, Technology of Environmental Management, Faculty of
Graduate Studies, Mahidol University, Bangkok, Thailand, 2004.
33. Mieczkowski, Z. Environmental Issues of Tourism and Recreation; University press of America:
Maryland, MD, USA, 1995.
34. Bunruamkaew, K.; Murayama, Y. Site suitability evaluation for ecotourism using GIS & AHP: A
case study of Surat Thani province, Thailand. Procedia Soc. Behav. Sci. 2011, 21, 269–278.
35. FAO. A Framework for Land Evaluation; Soils Bulletin No. 32; Food and Agriculture
Organization of the United Nations (FAO): Rome, Italy, 1976.
36. Zurick, D.N. Adventure travel and sustainable tourism in the peripheral economy of Nepal.
Ann. Assoc. Am. Geogr. 1992, 82(4), 608–628.
37. Khoi, D.D.; Murayama, Y. Delineation of suitable cropland areas using a GIS based multi-criteria
evaluation approach in the Tam Dao National Park region, Vietnam. Sustainability 2010,
2, 2024–2043.
38. Eurblarp, S. Ecotourism policy in Thailand. In Linking Green Productivity to Ecotourism:
Experiences in the Asia-Pacific Region; University of Queensland: Brisbane, Australia, 2002;
pp. 236–241.
39. Yaakup, A.; Che’Man, N.; Hosni, N.; Haron, H.W.; Sulaiman, S. A GIS approach in evaluation of
metropolitan green area: A case of Sungai Pulai wetland. In proceeding of Urban Forestry
Conference: Managing Urban Green for Sustainable Cities, Kuala Lumpur, Malaysia,
6–7 June, 2006.
40. IUCN/UNEP/WWF. Caring for the Earth: A Strategy for Sustainable Living; Second Report on
World Conservation and Development; International Union for Conservation of Nature and
Natural Resources: Gland, Switzerland, 1991.
41. WCMC. Global Biodiversity: Status of the Earth's Living Resources; Compiled by the World
Conservation and Monitoring Center, Chapman and Hall: London, UK, 1992.
42. Maser, C. Sustainable Forestry: Philosophy, Science, and Economics; St. Lucie Press: St. Lucie,
FL, USA, 1994.
43. Ceballos-Lascurain, H. Tourism, Ecotourism, and Protected Areas; IUCN Protected Areas Program:
Gland, Switzerland, 1996.
44. Bhattacharya, P.; Kumari, S. The Commons in an age of global transition: Challenges, risk and
opportunities. In Proceeding of IASCP Bi-Annual Conference: Oaxaca, Mexico, 9–14 August 2004.

Sustainability 2012, 4
429
45. Shackleton, S.; Bruce, C.; Wollenberg, E.; Edmunds, D. Devolution and community-based natural
resource management: Creating space for local people to participate and benefit? Revenue or
conservation interests rather than local livelihood. Nat. Resour. Per. 2002, 76, 1–6.
46. Dye, A.S.; Shaw, S.L. A GIS-based spatial decision support system for tourists of the Great
Smoky Mountains National Park. J. Retailing Consum. Serv. 2007, 14(4), 269–278.
47. Rannveig, O.; Micael, C. A GIS approach to evaluating ecological sensitivity for tourism
development in fragile environments: A case study from SE Iceland. Scand. J. Hosp. Tour. 2009,
9, 22–38.
48. Mazaher, M. Siting MSW landfill using weighted linear combination and analytical hierarchy
process (AHP) methodology in GIS environment (case study: Karaj). Waste Manag. 2010,
30, 912–920.
© 2012 by the authors; licensee MDPI, Basel, Switzerland. This article is an open access article
distributed under the terms and conditions of the Creative Commons Attribution license
(http://creativecommons.org/licenses/by/3.0/).