land expropriation, peri-urbanization and income diversification: evidence from peri-urban tigray,...
TRANSCRIPT

Land Expropriation, Peri-urbanization
and Income Diversification: Evidence
from Peri-urban Tigray, Northern
Ethiopia
IFPRI/ESSP Seminar at EDRI , May 8, 2015
Tsega G. Mezgebo and Catherine Porter
Outline
1. Motivation
2. Peri-urbanization in Ethiopia: overview
3. Conceptual and Empirical Framework
4. Data and Main findings
5. Conclusions
6. Policy implications

1. Motivation
Urban areas in many developing countries expand
rapidly by incorporating the nearby rural villages.
Squeezes land for farming, eventually farming livelihoods
vanished over time and replaced by urban-based
activities
Necessitates rural to urban livelihood transitions
i.e. simple to complex in terms of social and economical issues
Rural-urban livelihood transitions could be far from
smooth due to asset fixity and missing markets.
Livelihood adaptation could be negative, e.g. shift from
cash crop production to unskilled nonfarm employments.
Not only poor but also better-off farm households could be
marginalized.

Cont.
Rural–urban livelihoods transitions have such social cost.
The current literature on income diversification focus on rural areas.
Peri-urban areas differ from rural No uniform definition for peri-urban areas.
Dynamic urban and rural livelihoods co-exits where the later vanish with time.
Diversification to nonfarm is crucial to the farm households to make a living.
Given the peculiar feature, applying the common assumptions of rural livelihood diversification could be less effective and appropriate to policy.

This study
Objective: investigate factors that influence the
household’s decision to adopt specific income
diversification strategies.
Also compare if the strategies and associated
factors depend on the administration the
household belongs to – urban versus rural.
Aim: to contribute to policy in designing effective
interventions to the poor in peri-urban areas to
improve access to assets and productivity of the
assets they already own.

2. Peri-urbanization in Ethiopia:
overview
Urban Ethiopia is expanding rapidly with annual rate of
4% between 1994 and 2007 (Bane and Alemu, 2012) and
land is owned by the sate.
The process:
First, urban development plan is prepared and endorsed. To
implement the plan, the nearby rural villages incorporated to
the respective town administrations (FDRE, 2008).
New urban boundary is demarcated and then land is
expropriated for investments.
Affected households receive compensation equivalent to the
lost farm-income and property damages (FDRE, 2005).
New investments effected then after.
This is the stage where peri-urbanization (urban
expansion) starts formally.6 [email protected]

3. Conceptual and Empirical Framework
Causes to diversify income sources
For instance Ellis (2000)
Choice or pull factors to accumulate wealth
Necessity or push factors to survive
We argue that peri-urban farm households diversify
to alternative income sources likely of Necessity.
The farmers lost farmland due to urban expansion and likely
forced to diversify to nonfarm to sustain the lost farm income.

Cont.
Incentives and constraints to diversify to nonfarm
sector depend on
Experiences, skills and asset ownership (Haggabled et al,
2007)
In contexts where markets for credit and insurance
are missing,
A hypothetical household has to possess the necessary capital
(skill, tools, and/finance) to enter high-niche nonfarm
HHs endowed with nonfarm skills have better
opportunity to access better-paying nonfarm
activities compared to those equipped with farm
skills

Estimation Model
Assumption: the HH is expected to choose one
strategy from mutually exclusive strategies to
maximize utility.
Maddala’s (1983) random utility model is applied to
examine the associated factors.
Multinomial logit is used and the covariates consist of household
capital, shocks and towns (as proxies for the local economy).


Data
The rate of urban expansion in Tigray Regional State
is above the national average.
Urban population change between 1994 and 2007 is 85%
in Tigray while 59% national (CSA).
Data from Tigray can represent features of the fast
growing towns in Ethiopia.
Towns with a population of 20,000 and above were
identified first.
Mekelle, Adigrat, Axum and Alamata were purposely
selected for the study considering the expansion rate
but FHS selected randomly.

Cont.
Each survey site has two groups – in urban versus
rural, we call them rur-urban and rural
Rur-urban: sub-villages included to urban admin between 2006
and 2009.
Rural: under rural admin but adjacent to rur-urban
Panel data was collected in 2011 and 2012 from
FHS in peri-urban areas of the towns.
Peri-urban, in this study, is the sub-villages within 15kms from
edge town built up.
First round, the sample was 478 HH ( 240 rur-urban & 238
rural).
Second round, attrition rate 3% and seeming random


Terms used
Income is collected from all sources.
Income earned by member of the FH is considered
as income of the FH
Income sources classified in to
farm, nonfarm and unearned
A FH is assumed engaged in the category, if at least
one member has earned from the source.
Nonfarm is further classified to skilled and unskilled
employments.


Distribution of time-varying variables
Rur-Urban Rural
Year 2011 Year 2012 Year 2011 Year 2012
Variable Mean (StD) Mean (StD) Mean (StD) Mean (StD)
Head main job farming (%) 46 37 70 62
Real value of livestock (000 ETB) 6.64 (1.15) 6.26 (9.62) 6.77 (6.99) 8.14 (9.34)
Share to total HH income
Farm income 0.28 (0.36) 0.33 (0.35) 0.51 (0.31) 0.50 (0.32)
Nonfarm income 0.66 (0.37) 0.65 (0.35) 0.35 (0.29) 0.33 (0.30)
PSNP income 0.05 (0.12) 0.02 (0.08) 0.13 (0.17) 0.17 (0.24)

Percentage distribution of income sources, Rur-urban
2011 2012
Q1 Q2 Q3 Q4 Average Use Q1 Q2 Q3 Q4 Average Use
Farm income
On-farm (crop and livestock) 43 31 17 24 27 61 48 31 28 23 25 76
Nonfarm
Skilled employment 1 21 49 50 44 40 5 25 25 45 39 35
Unskilled employment 5 17 18 9 12 18 12 29 31 18 18 32
Productive safety net 13 5 2 1 2 41 5 2 1 1 1 37
Rent, remittance, etc. 38 22 13 15 12 56 28 14 14 12 16 46
Mean income (ETB) 604 1774 3311 8251 1077 2673 4501 10862
Observation (N) 60 60 60 60 240 59 58 59 58 234
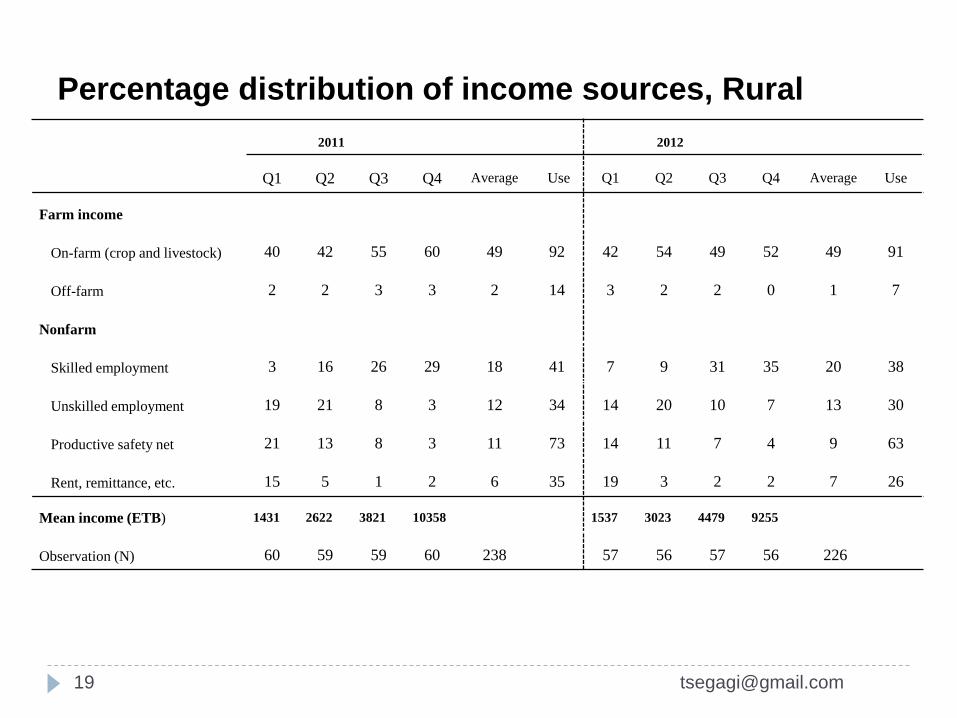
Percentage distribution of income sources, Rural
2011 2012
Q1 Q2 Q3 Q4 Average Use Q1 Q2 Q3 Q4 Average Use
Farm income
On-farm (crop and livestock) 40 42 55 60 49 92 42 54 49 52 49 91
Off-farm 2 2 3 3 2 14 3 2 2 0 1 7
Nonfarm
Skilled employment 3 16 26 29 18 41 7 9 31 35 20 38
Unskilled employment 19 21 8 3 12 34 14 20 10 7 13 30
Productive safety net 21 13 8 3 11 73 14 11 7 4 9 63
Rent, remittance, etc. 15 5 1 2 6 35 19 3 2 2 7 26
Mean income (ETB) 1431 2622 3821 10358 1537 3023 4479 9255
Observation (N) 60 59 59 60 238 57 56 57 56 226

Percentage distribution of diversification strategies
2011 2012
Q1 Q2 Q3 Q4 Total Q1 Q2 Q3 Q4 Total
Rur-urban farm households
Farm and skilled nonfarm 3 17 43 44 27 3 24 27 55 28
Farm and unskilled nonfarm 3 17 16 9 11 5 38 37 16 24
Skilled nonfarm 0 12 24 23 14 5 10 15 9 7
Unskilled nonfarm 3 9 9 5 6 10 5 12 7 8
Farm and transfer income 52 28 3 12 24 58 16 15 10 24
Transfer income only 38 17 3 7 16 19 7 3 3 8
Observation (N) 60 60 60 60 240 59 58 59 58 234
Rural households
Farm and off-farm 0 5 2 2 2 0 0 0 0 0
Farm and skilled nonfarm 22 32 46 61 40 11 41 49 50 38
Farm and unskilled nonfarm 42 27 27 22 30 37 34 25 18 28
Skilled nonfarm 2 0 2 2 1 2 2 5 2 3
Unskilled nonfarm 5 7 5 0 4 0 2 4 4 2
Farm and transfer income 28 24 14 14 20 49 21 18 27 29
Transfer income only 3 2 0 2 2 5 0 0 5 3
Observation (N) 60 59 59 60 238 57 56 57 56 226

Percentage distribution of diversification strategies (re-grouped)
Rur-urban Rural
2011 2012 Average 2011 2012 Average
Farm and skilled nonfarm (FSNF) 42 35 38 44 40 42
Farm and unskilled nonfarm (FUNF) 18 31 25 34 31 33
Farm and transfer income (FTI) 40 33 37 22 29 25
Observations (N) 240 234 238 227

Estimation results for rur-urban HHsFSNF FUNF FTI
variable dy/dx Std. err. dy/dx Std. err. dy/dx Std. err.
hsex* -0.114* 0.063 -0.021 0.052 0.135** 0.068
hage -0.005** 0.002 -0.003* 0.002 0.008*** 0.002
hjob* -0.180*** 0.059 -0.186*** 0.048 0.366*** 0.061
hedu* -0.014 0.067 -0.093 0.062 0.107 0.069
nadult 0.047 0.032 0.016 0.029 -0.063** 0.029
lwelm 0.065 0.062 0.045 0.057 -0.109* 0.063
upelm 0.018 0.040 0.003 0.035 -0.021 0.036
rlval 3.88E-07 0.000 3.69E-06** 0.000 3.30E-06 0.000
fland -0.001 0.020 0.019 0.017 -0.017 0.020
comp 1.95E-06*** 0.000 -4.58E-07 0.000 -1.49E-06** 0.000
nonf* 0.114** 0.055 0.056 0.049 -0.170*** 0.052
other* -0.185*** 0.059 -0.023 0.055 0.208*** 0.067
health* -0.014 0.071 -0.135*** 0.049 0.149** 0.076
crime* -0.187** 0.091 0.072 0.098 0.116 0.113
climate* -0.143** 0.061 -0.004 0.058 0.148** 0.066
price* -0.038 0.055 0.101** 0.049 -0.063 0.054
mekelle* -0.229** 0.107 0.252*** 0.092 -0.023 0.090
adigrat* -0.267*** 0.092 0.232 0.149 0.035 0.117
axum* -0.059 0.127 0.206 0.151 -0.147* 0.088

Estimation results for rural HHsFSNF FUNF FTI
variable dy/dx Std. err. dy/dx Std. err. dy/dx Std. err.
hsex* -0.238*** 0.084 0.131* 0.079 0.107 0.083
hage 0.001 0.003 -0.005* 0.003 0.004** 0.002
hjob* -0.039 0.086 -0.038 0.079 0.077 0.052
hedu* 0.091 0.074 -0.130* 0.070 0.039 0.054
nadult 0.061** 0.032 -0.056* 0.031 -0.005 0.018
lwelm 0.012 0.050 0.032 0.049 -0.043 0.035
upelm -0.003 0.040 0.044 0.038 -0.041* 0.024
rlval 0.13E-04 ** 0. 1E-04 0.2E-04 *** 0. 1E-04 0.1E-04*** 0.000
fland -0.036 0.021 0.038* 0.021 -0.002 0.012
nonf* 0.338*** 0.063 0.118* 0.063 -0.457 0.065
other* 0.019 0.086 -0.134* 0.071 0.116 0.073
health* -0.143 0.088 0.086 0.086 0.057 0.061
climate* -0.019 0.076 0.108 0.071 -0.089** 0.044
crime* 0.056 0.121 -0.054 0.119 -0.002 0.082
price* -0.186*** 0.063 0.146** 0.059 0.040 0.044
mekelle* 0.051 0.095 0.076 0.088 -0.126** 0.055
adigrat* -0.063 0.118 0.199* 0.119 -0.137*** 0.041
axum* -0.218 0.110 0.201 0.119 0.017 0.060

5.Conclusion
The results show that: Agriculture is an important source of livelihood, although
access to farmland is limited.
Almost all households earn income from diversified sources, diversification is a norm.
Participation in nonfarm employments is higher for the rural compared to the rur-urban.
Production behaviour of the better-off FHs is similar regardless of the administration they belong but not the poor.
Associated factors depend the administration the FHs belongs to.
Labor-poor FHs are marginalized in the emerging employment opportunities.
Experience in nonfarm play crucial role to engage in rewarding activities but money has negligible effect.

6. Policy implications
Targeted interventions should be designed to
improve the productive capacity of the poor.
The land compensation packages should be revised
and incorporate capacity building trainings with
special emphasis to labor-poor FHs.
Further studies to understand the poverty dynamics
and risk perceptions of FHs in peri-urban areas.
