land development program state lot … australian planning commission page 3 state lot activity...
TRANSCRIPT

Western Australian Planning Commission Page 1 State Lot Activity September quarter 2006
Jun qtr 2006 206 1 210 326 3 375 216 1 077 1 201 10 218 172 665
Sep qtr 2006 239 1 511 372 3 584 243 1 228 1 247 10 521 184 720
Jul 06 – Sep 06 239 1 511 243 1 228 184 720
Trend
Jun qtr 2006 926 8 652 1 132 19 260 697 9 756 5 031 62 605 575 5 677
Sep qtr 2006 1 166 11 121 1 184 19 947 1 001 8 530 5 421 67 103 574 4 989
Jul 06 – Sep 06 1 166 11 121 1 001 8 530 574 4 989
Trend
STATE LOT ACTIVITYWESTERN AUSTRALIA
L A N D D E V E L O P M E N T P R O G R A M
September Q
uarter 2006
1 State summary
1. State summary ..............................................12. Residential activity ....................................... 23. Residential lot size.........................................34. Residential final approvals by suburb............45. Financial-year-to-date
residential final approvals ..............................66. Rural-residential and special residential
activity............................................................77. Commercial activity ...................................... 88. Industrial activity ............................................99. Applications received...................................1010. Applications pending....................................1111. Quarterly preliminary approvals...................1212. All current preliminary approvals .................1313. Quarterly final approvals..............................1414. Metropolitan local government
area (LGA) summary ...................................1515. Selected regional local government
area summary .............................................1616. State lot approvals.......................................1717. Notes ...........................................................18
Final approvals by land zoning category
All current
preliminary
approvals (page 13)
as at quarter
Final approvals
(Page 14)
No. Lots
Residential
Proposed
lotsNo.
Proposed
lotsNo.
Proposed
lotsNo.
Proposed
lots
Non-residential
1.1 Final approval activity - September quarter 2006
Rural-residential/special residential 6%
Commercial 1%
Industrial 2%
Other 4%
Residential 87%
Residential• During the September quarter 2006, 1166
applications were lodged to create 11 121residential lots in the State.
• Preliminary residential approvals numbered8530 lots; 13 per cent lower than the previousquarter figure of 9756 lots.
• Final residential lot approvals decreased12 per cent from 5677 lots in the June quarter to4989 lots in the September quarter.
• By the end of September 2006, the number ofproposed residential lots with current preliminaryapproval in the State totalled 67 103 lots.
• The number of proposed lots in submittedapplications pending a decision totalled 19 947.
• The median lot size of a newly created residentiallot in the Perth region and Peel sector in theSeptember quarter was estimated at 542 sq m.
• In country areas, the estimated median lot sizewas 722 sq m.
Non-residential• In the September quarter 2006, 239 applications
were lodged to create 1511 non-residential lots inthe State.
• Preliminary non-residential lot approvals totalled1228.
• Final non-residential lot approvals increased from665 lots to 720 lots.
• By the end of September 2006, the number ofproposed non-residential lots with currentpreliminary approval in the State totalled 10 521.
• There were 3584 proposed lots pending a decisionby the end of September.
Applications
received (page 10)
Applications
pending (page 11)
as at quarter
Preliminary
approvals
(page 12)
No.
1-10
11-20
21-50
51-100
101-500
501 +
Final approvals by local government area - lots
Data
type Stock
Flow
Contents... Page

• During the September quarter 2006, 11 121 proposed lots were lodged for approval in the State; 6364lots in the Perth region and Peel sector and 4757 lots in country areas.
• Prelminary approval was granted to 5590 proposed lots in the Perth region and Peel sector and 2940lots in country areas.
• Final residential lot approvals totalled 4989 in the State; 3540 in the Perth region and Peel sector and1449 lots in country areas.
• In the Perth region and Peel sector, the north-west and inner-middle sectors together contributed 45 percent of regional final approvals.
• In the country, the South-West region accounted for the highest proportion of regional final approvalswith 46 per cent.
• The suburb of Canning Vale, in the Perth region recorded the highest number of final approvals with235 lots endorsed.
• Three localities in the country that recorded more than 100 final approvals were: Jurien Bay with 202lots, Australind with 138 lots and Vasse with 113 lots.
• During the September quarter, 84 per cent of final residential lot approvals in the State were green titlelots.
• By the end of September 2006, the number of proposed residential lots in applications pending adecision in the State totalled 19 947 lots.
• The number of proposed residential lots with current preliminary approval in the State totalled 67 103lots by the end of the same month; 48 412 lots in the Perth region and Peel sector and 18 691 lots inthe country.
Rank Metropolitan and Peel Lots Country (local government areas) Lots
1 CANNING VALE 235 JURIEN BAY (Dandaragan) 2022 SOUTHERN RIVER 175 AUSTRALIND (Harvey) 1383 ELLENBROOK 161 VASSE (Busselton) 1134 AVELEY 147 WANDINA (Greenough) 985 MADELEY 145 CASTLETOWN (Esperance) 816 RIDGEWOOD 116 MARGARET RIVER (Augusta-Marg River) 807 DAWESVILLE 111 NICKOL (Roebourne) 788 SECRET HARBOUR 101 MILLBRIDGE (Dardanup) 729 TAPPING 98 CABLE BEACH (Broome) 7110 SINAGRA 90 BRIDGETOWN (Bridgetown-G’bushes) 67
North-West 25%
Eastern 14%
South-East 14%South-West 15%
Peel sector 11%
Inner-Middle 21%
South-West 47%Pilbara 6%
Mid-West 8%
Great Southern 8%
Kimberley 5%
Goldfields-Esperance 8%Wheatbelt 18%
Country
Western Australian Planning Commission Page 2 State Lot Activity September quarter 2006
2 Residential activity
1-10
11-20
21-50
51-100 501 +
101-500
No final approvals
Final approvals by local government area - lots
RIDGEWOOD
TAPPINGSINAGRAELLENBROOKAVELEY
MADELEY
CANNING VALE
SOUTHERN RIVER
SECRET HARBOUR
DAWESVILLE
CABLE BEACH
NICKOL
WANDINA
JURIEN BAY
CASTLETOWN
AUSTRALINDMILLBRIDGE
VASSE
BRIDGETOWN
MARGARET RIVER
Final
approvals
All current
preliminary
approvals
Preliminary
approvals
Applications
pending
Applications
received
Proposed lotsProposed lots up
to end of Sept
2006
Proposed lotsProposed lots up
to end of Sept
2006
Lots
2.1 Regional summary: September quarter 2006
2.2 Final approval activity - top suburbs and localities
0%
10%
20%
30%
40%
50%
60%
70%
80%
90%
100%
1999-00
green title strataJul 06 -
Sep 06
2005-06
2004-05
2003-04
2002-03
2001-02
2000-01
Green title lots versus strata lotsMetropolitan and Peel
Perth metropolitan region and Peel sector
Inner-Middle 1 899 2 047 1 381 8 223 750North-West 813 2 510 512 9 778 845Eastern 439 858 786 4 808 500South-East 1 219 2 643 515 7 384 499South-West 1 431 2 387 1 619 10 702 539
Metropolitan 5 801 10 445 4 813 40 895 3 133Peel 563 1 032 777 7 517 407Metropolitan and Peel 6 364 11 477 5 590 48 412 3 540
CountryGascoyne 149 98 85 549 0Goldfields-Esperance 198 319 183 1 394 117Great Southern 596 1 322 113 1 805 120Kimberley 34 36 220 658 74Mid-West 1 262 1 907 597 3 329 120Peel Region - remaining local government areas 20 67 94 112 3Pilbara 107 737 404 791 86South-West 1 752 3 007 1 152 8 465 662Wheatbelt 639 977 92 1 588 267Country 4 757 8 470 2 940 18 691 1 449State 11 121 19 947 8 530 67 103 4 989

Western Australian Planning Commission Page 3 State Lot Activity September quarter 2006
InnerDec qtr 05 129 25 15 11 413Mar qtr 06 119 20 12 4 396Jun qtr 06 195 29 31 12 394Sep qtr 06 141 22 18 43 364
MiddleDec qtr 05 367 126 71 21 447Mar qtr 06 464 92 36 14 392Jun qtr 06 422 104 71 15 420Sep qtr 06 428 80 43 13 402
North-West Dec qtr 05 289 467 480 12 574Mar qtr 06 252 172 256 10 552Jun qtr 06 312 539 434 4 566Sep qtr 06 274 256 303 12 567
Eastern Dec qtr 05 129 52 156 26 601Mar qtr 06 163 91 258 30 610Jun qtr 06 46 103 188 25 634Sep qtr 06 160 137 174 29 561
South-EastDec qtr 05 111 210 194 14 574Mar qtr 06 101 137 88 19 554Jun qtr 06 163 149 245 13 574Sep qtr 06 113 202 170 14 571
South-WestDec qtr 05 182 220 249 9 565Mar qtr 06 278 270 354 14 559Jun qtr 06 313 265 329 20 562Sep qtr 06 183 184 152 20 545
Perth metropolitan regionDec qtr 05 1 207 1 100 1 165 93 572Mar qtr 06 1 377 782 1 004 91 572Jun qtr 06 1 451 1 189 1 298 89 548Sep qtr 06 1 299 881 860 93 533
Country
2000–01 96 76 836 256 734
2001–02 177 264 779 306 780
2002–03 108 291 961 291 690
2003–04 165 191 1 111 330 710
2004–05 226 458 2 112 297 670
2005–06 474 553 2 861 500 763
2006–07
Sep qtr 219 130 895 205 722
Financial
year
Final approvals by lot size range (m2))
<500 500-599 600-999 1000-2999
Estimated
median
lot size
3 Residential lot size
3.1 Lot size by planning region
Metropolitan and Peel
2000–01 2 516 1 996 2 724 395 562
2001–02 2 666 2 679 4 065 402 584
2002–03 3 172 3 636 5 699 462 591
2003–04 4 023 4 394 5 979 598 580
2004–05 4 726 5 002 5 258 517 560
2005–06 5 438 4 686 5 644 527 558
2006–07
Sep qtr 1 417 923 1 102 98 542
Financial
year
Final approvals by lot size range (m2)
<500 500-599 600-999 1000-2999
Estimated
median
lot size
QuarterFinal approvals by lot size range (m2))
<500 500-599 600-999 1000-2999
Estimated
median
lot size
Financial
year
Final approvals by lot size range (m2))
<500 500-599 600-999 1000-2999
Estimated
median
lot size
Peel sectorDec qtr 05 52 48 141 13 626Mar qtr 06 113 100 305 13 623Jun qtr 06 117 136 115 7 562Sep qtr 06 118 42 242 5 625
Goldfields-EsperanceDec qtr 05 0 3 1 1 600Mar qtr 06 3 4 3 0 567Jun qtr 06 3 12 63 7 706Sep qtr 06 1 4 107 5 827
Great SouthernDec qtr 05 6 4 106 6 737Mar qtr 06 8 8 8 4 567Jun qtr 06 5 14 55 12 696Sep qtr 06 9 21 80 10 663
KimberleyDec qtr 05 1 0 10 2 820Mar qtr 06 0 2 1 1 550Jun qtr 06 0 0 0 7 1 400Sep qtr 06 3 0 68 3 768
Mid-WestDec qtr 05 1 2 248 78 780Mar qtr 06 13 3 136 15 770Jun qtr 06 5 114 235 33 699Sep qtr 06 10 0 99 11 686
South-WestDec qtr 05 13 80 366 111 735Mar qtr 06 49 83 608 22 705Jun qtr 06 201 105 264 71 617Sep qtr 06 115 94 338 115 714
Remaining country local government areasDec qtr 05 13 8 52 16 700Mar qtr 06 15 7 34 8 642Jun qtr 06 20 26 14 9 566Sep qtr 06 81 11 203 61 729
Final approvals by lot size range – Metropolitan and Peel Final approvals by lot size range – country
0% 10% 20% 30% 40% 50% 60% 70% 80% 90% 100%
2005-06Jul 06 to Sep 06
2004-05
2003-042002-032001-02
2000-01
< 500 m2 500- 599 m2 600- 999 m2 1000- 2999 m2
0% 10% 20% 30% 40% 50% 60% 70% 80% 90% 100%
2005-06Jul 06 to Sep 06
2004-05
2003-042002-03
2001-02
2000-01
< 500 m2 500- 599 m2 600- 999 m2 1000- 2999 m2

Western Australian Planning Commission Page 4 State Lot Activity September quarter 2006
4 Residential final approvals by suburb
Alfred Cove 16 2 48Applecross 18 4 46Ardross 24 8 42Armadale 8 4 46Ascot 4 0 0Ashby 86 2 48Ashfield 6 0 0Attadale 19 7 43Atwell 171 0 0Aubin Grove 317 60 14Aveley 0 147 4Balcatta 25 14 36Baldivis 764 0 0Balga 28 7 43Ballajura 3 0 0Banksia Grove 64 43 19Bassendean 47 21 31Bateman 5 0 0Bayswater 81 29 25Beaconsfield 28 6 44Beckenham 15 0 0Bedford 21 6 44Beechboro 18 0 0Beeliar 155 32 24Bellevue 6 2 48Belmont 123 14 36Bentley 103 2 48Bertram 262 70 11Bibra Lake 2 0 0Bickley 0 2 48Bicton 68 8 42Booragoon 3 0 0Boya 8 1 49Brentwood 18 0 0Bull Creek 4 0 0Burns Beach 161 3 47Burswood 18 3 47Butler 119 0 0Byford 297 49 16Calista 28 0 0Canning Vale 738 235 1Cannington 17 10 40Carlisle 37 20 32Carramar 187 52 15Churchlands 2 0 0City Beach 1 0 0Claremont 34 7 43Clarkson 538 35 22Cloverdale 34 6 44Como 47 11 39Connolly 4 0 0Coogee 62 44 18Coolbellup 13 11 39Cooloongup 2 0 0Cottesloe 35 2 48Craigie 4 0 0Crawley 1 0 0Currambine 2 0 0Dalkeith 10 0 0Darch 280 25 27Darlington 2 3 47Dianella 61 12 38Doubleview 84 23 29Duncraig 0 11 39East Cannington 78 20 32East Fremantle 41 4 46East Perth 1 1 49East Victoria Park 47 15 35Eden Hill 4 0 0Edgewater 4 0 0Ellenbrook 969 161 3Embleton 18 10 40Ferndale 2 0 0Floreat 2 0 0Forrestdale 163 0 0Forrestfield 70 0 0Fremantle 37 21 31
Girrawheen 2 0 0Glendalough 3 0 0Gooseberry Hill 7 0 0Gosnells 66 28 26Greenmount 18 0 0Greenwood 5 2 48Guildford 1 1 49Gwelup 26 33 23Hamersley 4 0 0Hamilton Hill 41 12 38Hammond Park 96 44 18Hazelmere 6 0 0Helena Valley 2 0 0High Wycombe 2 76 10Highgate 2 0 0Hillarys 68 33 23Hilton 28 2 48Hocking 160 66 12Huntingdale 10 12 38Iluka 58 0 0Inglewood 27 2 48Innaloo 47 15 35Jandakot 2 0 0Jane Brook 4 0 0Jindalee 184 40 21Jolimont 2 0 0Joondalup 3 2 48Joondanna 12 8 42Kalamunda 11 3 47Kallaroo 0 2 48Kardinya 26 6 44Karrinyup 55 8 42Kelmscott 4 5 45Kensington 12 0 0Kenwick 39 0 0Kewdale 30 2 48Kingsley 4 2 48Kinross 2 2 48Koondoola 3 0 0Landsdale 244 32 24Langford 16 0 0Lathlain 19 6 44Leederville 1 0 0Lesmurdie 1 0 0Lynwood 10 0 0Maddington 58 0 0Madeley 320 145 5Mahogany Creek 2 0 0Maida Vale 19 0 0Manning 25 6 44Marangaroo 76 0 0Marmion 2 4 46Maylands 29 9 41Medina 4 0 0Melville 21 8 42Middle Swan 38 0 0Midland 27 14 36Midvale 6 0 0Mindarie 71 2 48Morley 105 22 30Mosman Park 22 12 38Mt Claremont 10 6 44Mt Hawthorn 23 7 43Mt Helena 6 0 0Mt Lawley 19 13 37Mt Nasura 1 0 0Mt Pleasant 26 17 34Mt Richon 10 0 0Mullaloo 12 4 46Mundaring 2 0 0Munster 114 3 47Myaree 7 4 46Nedlands 67 0 0Nollamara 36 17 34Noranda 9 0 0North Beach 19 9 41North Fremantle 9 1 49
North Perth 38 10 40Ocean Reef 1 0 0Osborne Park 3 0 0Padbury 3 2 48Palmyra 16 2 48Parkwood 6 0 0Parmelia 40 0 0Pearsall 53 4 46Perth 7 1 49Port Kennedy 15 2 48Queens Park 10 5 45Quinns Rocks 24 10 40Redcliffe 12 0 0Ridgewood 538 116 6Riverton 40 24 28Rivervale 27 22 30Rockingham 205 13 37Roleystone 52 2 48Rossmoyne 10 0 0Safety Bay 8 0 0Salter Point 6 2 48Sawyers Valley 2 0 0Scarborough 52 12 38Secret Harbour 542 101 7Seville Grove 322 13 37Shelley 38 2 48Shenton Park 4 0 0Shoalwater 48 18 33Sinagra 52 90 9Singleton 61 17 34Sorrento 14 8 42South Fremantle 11 0 0South Guildford 2 0 0South Lake 63 4 46South Perth 18 0 0Southern River 187 175 2Spearwood 14 0 0St James 15 0 0Stirling 183 25 27Subiaco 4 6 44Success 369 62 13Swan View 2 2 48Swanbourne 5 0 0Tapping 791 98 8The Vines 103 15 35Thornlie 134 10 40Trigg 6 5 45Tuart Hill 4 7 43Two Rocks 68 0 0Victoria Park 40 18 33Viveash 0 42 20Waikiki 56 0 0Walliston 6 0 0Wanneroo 9 5 45Warnbro 2 0 0Waterford 27 0 0Watermans Bay 8 2 48Wattle Grove 91 29 25Wellard 184 0 0Wembley 15 4 46Wembley Downs 30 5 45West Leederville 14 0 0West Perth 4 0 0Westfield 2 0 0Westminster 42 9 41White Gum Valley 23 9 41Willagee 52 5 45Willetton 16 7 43Wilson 66 12 38Winthrop 0 2 48Woodbridge 15 2 48Woodlands 6 0 0Yanchep 170 5 45Yangebup 120 46 17Yokine 47 14 36
2005 - Sept
Suburb 2006 qtr 2006 Qtr rank
2005 - Sept
Suburb 2006 qtr 2006 Qtr rank
2005 - Sept
Suburb 2006 qtr 2006 Qtr rank
Perth metropolitan region
Peel sector total 1 694 407
Metropolitan and Peel sector 16 299 3 540
Perth metropolitan region total 14 605 3 133
Peel sector
Coodanup 77 10 8Dawesville 357 111 1Dudley Park 49 6 10Erskine 22 17 7Falcon 50 3 11Greenfields 40 2 12
Halls Head 202 3 11Lakelands 195 54 4Madora Bay 93 68 2Mandurah 75 8 9Meadow Springs 281 25 6North Dandalup 0 2 12
North Yunderup 0 6 10Pinjarra 127 0 0Ravenswood 87 57 3Wannanup 39 35 5

4.1 Quarterly residential final approvals, Perth metropolitan region and Peel sector
The Pines
Indian
Ocean
YANCHEP
JINDALEE
RIDGEWOOD
QUINNS ROCKS
CLARKSON
MINDARIE
BANKSIA GROVE
CARRAMAR
TAPPING
KINROSS
JOONDALUP
BURNS BEACH
ASHBY
WANNEROO
SINAGRA
THE VINES
ELLENBROOK
HOCKING
AVELEY
MULLALOO
PEARSALL
KALLAROO
PADBURY
LANDSDALE
HILLARYS
KINGSLEY MADELEY
DARCH
DUNCRAIG
SORRENTO
GREENWOOD
MARMION
BALGA
WATERMANS BAY
NORTH BEACH
KARRINYUP GWELUP
WESTMINSTER
BALCATTA
DIANELLA
TRIGG
STIRLING
VIVEASH
NOLLAMARA
SWAN VIEW
MIDLAND
MORLEY
INNALOO
WOODBRIDGE
YOKINE
TUART HILL
DOUBLEVIEWSCARBOROUGH
EMBLETON
BELLEVUE
GUILDFORD
BEDFORD
BASSENDEAN
BOYA
JOONDANNA
BAYSWATER
INGLEWOOD
DARLINGTON
NORTH PERTH
WEMBLEY DOWNS
MAYLANDS
HIGH WYCOMBE
WEMBLEY
BELMONT
PERTH
SUBIACO EAST PERTH
CLOVERDALE
RIVERVALE
LATHLAIN
KEWDALE
BURSWOOD
KALAMUNDA
VICTORIA PARK
CARLISLE
EAST VICTORIA PARK
CLAREMONT
COTTESLOE
COMO
WATTLE GROVE
BENTLEY
QUEENS PARK
EAST CANNINGTON
BICKLEY
CANNINGTON
APPLECROSS
MOSMAN PARK
MANNING
WILSON
BICTON
ATTADALE
SALTER POINT
ARDROSS
SHELLEY
NORTH FREMANTLE
RIVERTON
ALFRED COVE
EAST FREMANTLE
MELVILLE
PALMYRA
MYAREE
WILLETTON
FREMANTLE
WINTHROP
WILLAGEE
THORNLIEKARDINYA
WHITE GUM VALLEY
GOSNELLS
CANNING VALE
HILTON
BEACONSFIELD
HUNTINGDALE
COOLBELLUP
HAMILTON HILL
SOUTHERN RIVER
SOUTH LAKE
ROLEYSTONE
COOGEE
KELMSCOTT
YANGEBUP
SEVILLE GROVE
SUCCESS
BEELIAR
MUNSTER
ARMADALE
HAMMOND PARK AUBIN GROVE
BYFORD
BERTRAM
ROCKINGHAM
SHOALWATER
PORT KENNEDY
SECRET HARBOUR
SINGLETON
LAKELANDS
MADORA BAY
MEADOW SPRINGS
GREENFIELDS
NORTH DANDALUP
MANDURAH
HALLS HEAD
COODANUP
DUDLEY PARK
ERSKINE
FALCON
RAVENSWOOD
NORTH YUNDERUP
WANNANUP
DAWESVILLE
kilometres
0 5 10 15
N
21 - 50
51 -100
GEOCENTRIC DATUM OF AUSTRALIA
Fremantle
Mandurah
Armadale
Rockingham
Joondalup
Pinjarra
Yanchep
Kwinana
Jandakot
Ellenbrook
Quinns Rocks
Port Kennedy
Dawesville
residential area
top suburbs/localities★★
1 - 10
Lots
11 - 20
Midland
Perth
Cannington
101 +
Base information supplied by DLI PA 23-2003
★
★
★
★
★
★
★
★
Produced by Project Mapping Section,Mapping and GeoSpatial Data Branch,Department for Planning and Infrastructure,on behalf of the Western Australian PlanningCommission, Perth, WA January 2007
ntw-map11\ \strat_plan\research\state\res_lot_activity\ 2006_Qreport\Septembermaps\map6.dgn
Western Australian Planning Commission Page 5 State Lot Activity September quarter 2006

Western Australian Planning Commission Page 6 State Lot Activity September quarter 2006
5 Financial-year-to-date residential final approvals
Local government areaQuarterly
%
Sep
quarter
2006
Jul 06 to
Sep 062005-062004-05 Local government area
Quarterly
%
Sep
quarter
2006
Jul 06 to
Sep 062005-062004-05
Metropolitan and PeelInner-Middle Bassendean (T) 66 57 21 21 1Bayswater (C) 308 263 78 78 2Belmont (C) 164 230 44 44 1Cambridge (T) 41 33 4 4 0Canning (C) 404 715 116 116 3Claremont (T) 34 31 7 7 0Cottesloe (T) 21 35 2 2 0East Fremantle (T) 42 41 4 4 0Fremantle (C) 130 136 39 39 1Melville (C) 492 323 73 73 2Mosman Park (T) 24 22 12 12 0Nedlands (C) 13 93 6 6 0Peppermint Grove (S) 1 0 0 0Perth (C) 4 5 1 1 0South Perth (C) 110 135 19 19 1Stirling (C) 906 821 232 232 7Subiaco (C) 19 11 6 6 0Victoria Park (T) 230 166 62 62 2Vincent (T) 67 78 24 24 1Total 3 076 3 195 750 750 21North-West Joondalup (C) 181 347 75 75 2Wanneroo (C) 3 921 4 039 770 770 22Total 4 102 4 386 845 845 24Eastern Kalamunda (S) 231 207 110 110 3Mundaring (S) 63 44 6 6 0Swan (C) 983 1 200 384 384 11Total 1 277 1 451 500 500 14South-East Armadale (C) 313 562 24 24 1Gosnells (C) 1 166 954 426 426 12Serpentine-Jarrahdale (S) 59 297 49 49 1Total 1 538 1 813 499 499 14South-WestCockburn (C) 1 262 1 539 318 318 9Kwinana (T) 533 518 70 70 2Rockingham (C) 1 938 1 703 151 151 4Total 3 733 3 760 539 539 15
Perth metropolitan region 13 726 14 605 3 133 3 133 88
Peel sector Mandurah (C) 1 672 1 480 342 342 10Murray (S) 109 214 65 65 2Total 1 781 1 694 407 407 11Perth metropolitan region and Peel sector 15 507 16 299 3 540 3 540 71
Note: (C) for City, (T) for Town, and (S) for Shire and LGAs for local government areas
CountryGascoyneCarnarvon (S) 6 2 0 0 0Exmouth (S) 19 9 0 0 0Remaining LGAs 5 4 0 0 0Total 30 15 0 0 0Goldfields-EsperanceEsperance (S) 33 12 81 81 6Kalgoorlie-Boulder (C) 84 60 34 34 2Remaining LGAs 3 50 2 2 0Total 120 122 117 117 8Great SouthernAlbany (C) 112 280 110 110 8Remaining LGAs 14 73 10 10 1Total 126 353 120 120 8KimberleyBroome (S) 53 137 74 74 5Wyndham-East Kimberley (S) 35 40 0 0 0Remaining LGAs 0 4 0 0 0Total 88 181 74 74 5Mid-WestGeraldton (C) 21 17 4 4 0Greenough (S) 199 620 102 102 7Irwin (S) 68 130 0 0 0Remaining LGAs 18 230 14 14 1Total 306 997 120 120 8PilbaraPort Hedland (T) 13 8 8 8 1Roebourne (S) 130 171 78 78 5Remaining LGAs 0 0 0 0 0Total 143 179 86 86 6Peel Region - remaining local government areasBoddington (S) 0 0 0 0 0Waroona (S) 5 7 3 3 0Total 5 7 3 3 0South-WestAugusta-Margaret River (S) 149 257 84 84 6Bunbury (C) 92 282 33 33 2Busselton (S) 939 442 154 154 11Capel (S) 256 523 59 59 4Dardanup (S) 258 231 108 108 7Harvey (S) 420 653 138 138 10Remaining LGAs 20 18 86 86 6Total 2 134 2 406 662 662 46WheatbeltBeverley (S) 1 0 3 3 0Brookton (S) 0 0 0 0 0Chittering (S) 0 0 0 0 0Gingin (S) 3 0 2 2 0Northam (S) 0 2 0 0 0Northam (T) 4 15 0 0 0Toodyay (S) 1 7 2 2 0York (S) 8 10 55 55 4Remaining LGAs 142 113 267 267 18Total 146 130 267 267 18
Country 3 098 4 390 1 449 1 449 29
State 18 605 20 689 4 989 4 989 100
North-West 25%
Eastern 14%South-East 14%
South-West 15%
Peel sector 11%Inner-Middle 21%
South-West 47%
Mid-West 8%
Kimberley 5%
Great Southern 8%
Goldfields-Esperance 8%Wheatbelt 18%
Pilbara 6%
Final residential final approvals July 06 to September 06
• During the September quarter, final approval was granted to 4989 residential lots throughout the State; 3540 lots in the Perth region and Peel sector and1449 lots in the country.
• In the Perth region and Peel sector, the City of Wanneroo continued to record strong subdivision activity, with 770 final lot approvals.
• In the country, over 100 final lot approvals were recorded in the following local governments: Busselton 154 lots, Harvey 138 lots, Albany 110 lots, Dardanup108 lots and Greenough 102 lots.
Metropolitan and Peel Country
Eastern 10%
South-East 82%
South-West 7%
Peel 1%
Metropolitan and Peel
Mid-West 34%
Great Southern 15%Wheatbelt 35%
South-West 7%
Peel Region-remaining LGA’s 9%
Country
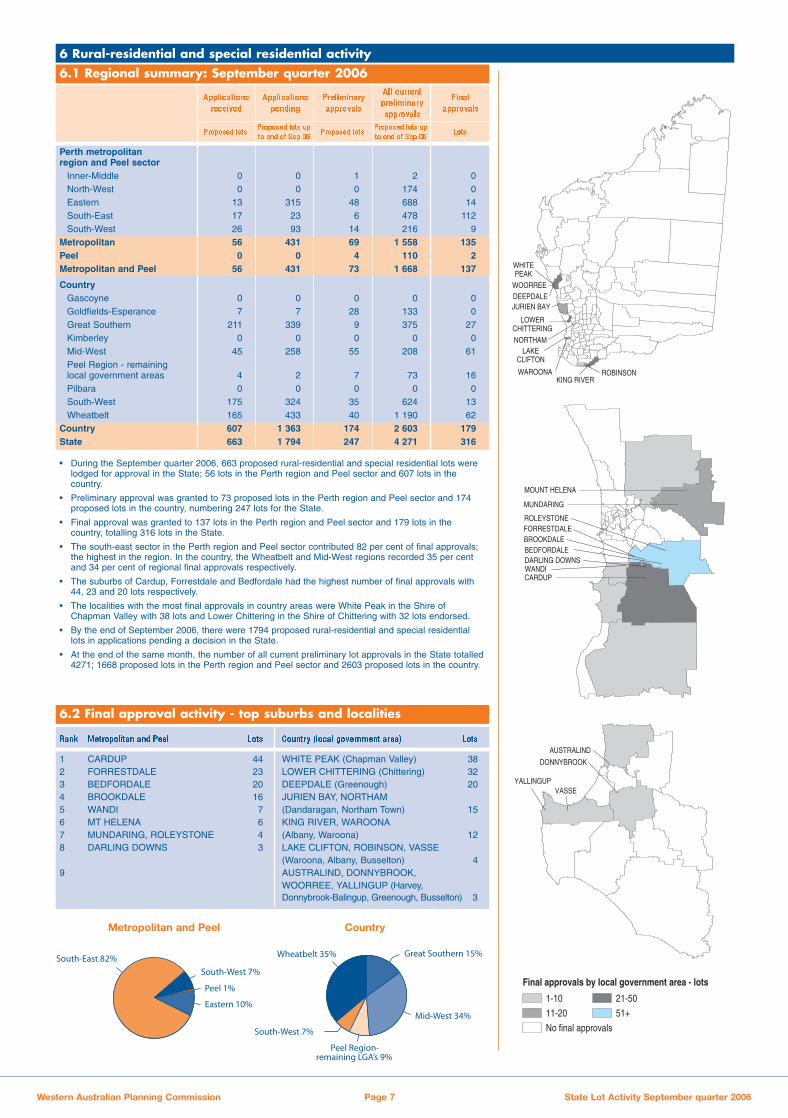
Rank Metropolitan and Peel Lots Country (local government area) Lots
1 CARDUP 44 WHITE PEAK (Chapman Valley) 382 FORRESTDALE 23 LOWER CHITTERING (Chittering) 323 BEDFORDALE 20 DEEPDALE (Greenough) 204 BROOKDALE 16 JURIEN BAY, NORTHAM 5 WANDI 7 (Dandaragan, Northam Town) 156 MT HELENA 6 KING RIVER, WAROONA7 MUNDARING, ROLEYSTONE 4 (Albany, Waroona) 128 DARLING DOWNS 3 LAKE CLIFTON, ROBINSON, VASSE
(Waroona, Albany, Busselton) 49 AUSTRALIND, DONNYBROOK,
WOORREE, YALLINGUP (Harvey,Donnybrook-Balingup, Greenough, Busselton) 3
Western Australian Planning Commission Page 7 State Lot Activity September quarter 2006
Final
approvals
All current
preliminary
approvals
Preliminary
approvals
Applications
pending
Applications
received
Proposed lotsProposed lots up
to end of Sep 06Proposed lots
Proposed lots up
to end of Sep 06Lots
6 Rural-residential and special residential activity6.1 Regional summary: September quarter 2006
1-10 21-50
No final approvals
Final approvals by local government area - lots
11-20 51+
MOUNT HELENA
MUNDARING
ROLEYSTONEFORRESTDALE
BEDFORDALEBROOKDALE
DARLING DOWNSWANDICARDUP
WOORREEDEEPDALEJURIEN BAY
NORTHAM
WAROONAKING RIVER
ROBINSON
LOWERCHITTERING
LAKECLIFTON
WHITEPEAK
AUSTRALIND
DONNYBROOK
YALLINGUPVASSE
6.2 Final approval activity - top suburbs and localities
• During the September quarter 2006, 663 proposed rural-residential and special residential lots werelodged for approval in the State; 56 lots in the Perth region and Peel sector and 607 lots in thecountry.
• Preliminary approval was granted to 73 proposed lots in the Perth region and Peel sector and 174proposed lots in the country, numbering 247 lots for the State.
• Final approval was granted to 137 lots in the Perth region and Peel sector and 179 lots in thecountry, totalling 316 lots in the State.
• The south-east sector in the Perth region and Peel sector contributed 82 per cent of final approvals;the highest in the region. In the country, the Wheatbelt and Mid-West regions recorded 35 per centand 34 per cent of regional final approvals respectively.
• The suburbs of Cardup, Forrestdale and Bedfordale had the highest number of final approvals with44, 23 and 20 lots respectively.
• The localities with the most final approvals in country areas were White Peak in the Shire ofChapman Valley with 38 lots and Lower Chittering in the Shire of Chittering with 32 lots endorsed.
• By the end of September 2006, there were 1794 proposed rural-residential and special residentiallots in applications pending a decision in the State.
• At the end of the same month, the number of all current preliminary lot approvals in the State totalled4271; 1668 proposed lots in the Perth region and Peel sector and 2603 proposed lots in the country.
Perth metropolitan region and Peel sector
Inner-Middle 0 0 1 2 0North-West 0 0 0 174 0Eastern 13 315 48 688 14South-East 17 23 6 478 112South-West 26 93 14 216 9
Metropolitan 56 431 69 1 558 135Peel 0 0 4 110 2Metropolitan and Peel 56 431 73 1 668 137
CountryGascoyne 0 0 0 0 0Goldfields-Esperance 7 7 28 133 0Great Southern 211 339 9 375 27Kimberley 0 0 0 0 0Mid-West 45 258 55 208 61Peel Region - remaininglocal government areas 4 2 7 73 16Pilbara 0 0 0 0 0South-West 175 324 35 624 13Wheatbelt 165 433 40 1 190 62
Country 607 1 363 174 2 603 179State 663 1 794 247 4 271 316

• During the September quarter 2006, 50 proposed commercial lots were lodged for approval in theState; 17 lots in the Perth region and Peel sector and 33 lots in the country.
• Preliminary approval was granted to 72 lots in the Perth region and Peel sector and 30 lots in thecountry; numbering 102 proposed in the State.
• Final approval was granted to 30 lots in the Perth region and Peel sector and 32 lots in the country,totalling 62 lots in the State.
.• The inner-middle planning sector in the Perth region and Peel sector recorded 60 per cent of finalapprovals.
• In the country, the South-West region recorded 66 per cent of regional final approvals.
• During the September quarter, 66 per cent of final commercial lot approvals in the State were greentitle lots.
• By the end of September 2006, there were 172 proposed commercial lots in applications pending adecision in the State; 67 proposed lots in the Perth region and Peel sector and 105 lots in thecountry.
• At the end of the same month, the number of proposed lots with current preliminary approval in theState totalled 670 lots; 491 lots in the Perth region and Peel sector and 179 lots in the country.
Western Australian Planning Commission Page 8 State Lot Activity September quarter 2006
Final
approvals
All current
preliminary
approvals
Preliminary
approvals
Applications
pending
Applications
received
Proposed lotsProposed lots up
to end of Sep 06Proposed lots
Proposed lots up
to end of Sep 06Lots
7 Commercial activity7.1 Regional summary: September quarter 2006
1-5
No final approvals
Final approvals by local government area - lots
VICTORIA PARKCARLISLEEAST VICTORIA PARK
6-10 11+
EXMOUTH
BUNBURYSOUTH BUNBURY
WEST BUSSELTON
Inner-Middle60%
South-East 13%
Peel sector 3%
North-West 17%
Eastern 7%
Metropolitan and Peel
South-West66%
Wheatbelt 6%
Gascoyne 22%
Pilbara 3%
GreatSouthern 3%
Country
Green title lots versus strata lots
0%
10%
20%
30%
40%
50%
60%
70%
80%
90%
100%
1999-00
green title strataJul 06 -
Sep 06
2005-06
2004-05
2003-04
2002-03
2001-02
2000-01
7.2 Final approval activity - top suburbs and localities
Rank Metropolitan and Peel Lots Country (local government area) Lots
1 CARLISLE 4 SOUTH BUNBURY (Bunbury) 132 EAST VICTORIA PK, VICTORIA PK 3 EXMOUTH (Exmouth) 73 BUNBURY, WEST BUSSELTON
(Bunbury, Bussleton) 3
Perth metropolitan region and Peel Sector
Inner-Middle 3 19 55 242 18North-West 6 11 8 101 5Eastern 6 10 2 17 2South-East 0 9 1 17 0South-West 2 2 3 92 4
Metropolitan 17 51 69 469 29Peel 0 16 3 22 1Metropolitan and Peel 17 67 72 491 30
CountryGascoyne 0 4 2 10 7Goldfields-Esperance 0 13 10 17 0Great Southern 3 40 2 43 1Kimberley 2 2 3 9 0Mid-West 2 4 1 10 0Peel Region - remaininglocal government areas 0 0 0 0 0Pilbara 2 2 0 2 1South-West 24 24 9 80 21Wheatbelt 0 16 3 8 2
Country 33 105 30 179 32State 50 172 102 670 62

Perth metropolitan region and Peel Sector
Inner-Middle 53 51 7 395 11North-West 0 48 13 428 8Eastern 0 122 4 178 2South-East 5 2 11 35 4South-West 4 79 54 584 6
Metropolitan 62 302 89 1 620 31Peel 0 0 1 79 0Metropolitan and Peel 62 302 90 1 699 31
CountryGascoyne 5 5 7 31 0Goldfields-Esperance 0 56 6 95 18Great Southern 28 53 1 47 11Kimberley 0 0 4 14 2Mid-West 10 10 31 97 2Peel Region - remaininglocal government areas 0 0 1 16 0Pilbara 0 0 0 22 2South-West 27 238 127 280 42Wheatbelt 60 69 29 80 0Country 130 431 206 682 77State 192 733 296 2 381 108
Western Australian Planning Commission Page 9 State Lot Activity September quarter 2006
Final
approvals
All current
preliminary
approvals
Preliminary
approvals
Applications
pending
Applications
received
Proposed lotsProposed lots up
to end of Sep 06Proposed lots
Proposed lots up
to end of Sep 06Lots
8 Industrial activity8.1 Regional summary: September quarter 2006
1-5
No final approvals
Final approvals by local government area - lots
6-10
NEERABUP
WANGARA
NORTH FREMANTLEO’CONNORJANDAKOT
21+
11-20
BROADWOOD
WILLYUNG
MILPARA MIRA MAR
DAVENPORT
Eastern 6%
South-West19%
South-East 13%
Inner-Middle36%
North-West26%
• In the September quarter 2006, 62 proposed industrial lots were received for approval in the Perthregion and Peel sector and 130 proposed lots in the country, amounting to 192 lots in the State.
• Preliminary approval for subdivision was granted to 90 proposed lots in the Perth region and Peelsector and 206 proposed lots in the country, numbering 296 lots in the State.
• Final approval was granted to 31 lots in the Perth region and Peel sector and 77 lots in the country,totalling 108 lots in the State.
• In the Perth region and Peel sector, the inner-middle planning sector contributed 35 per cent of finalapprovals; the highest in the region.
• In the country, the South-West region contributed the largest proportion of final approvals, with 54per cent of regional approvals. The locality of Davenport in the Shire of Bunbury had the most finalapprovals, with 41 lots endorsed.
• Between July 2005 and December 2005, 87 per cent of final industrial lot approvals in the Statewere green title lots.
• By the end of December, the number of proposed industrial lots pending a decision in the Statetotalled 733 lots.
• By the end of the same month, there were 2381 proposed lots with current preliminary approval inthe State; 1699 proposed lots in the Perth region and Peel sector and 682 proposed lots in thecountry.
8.2 Final approval activity - top suburbs and localities
Rank Metropolitan and Peel Lots Country (local government area) Lots
1 O’CONNOR 7 DAVENPORT (Bunbury) 412 JANDAKOT, NEERABUP, WANGARA 4 BROADWOOD (Kalgoorlie-Boulder) 183 NORTH FREMANTLE 3 MILPARA, MIRA MAR, WILLYUNG (Albany) 3
Metropolitan and Peel
Country
Green title lots versus strata lots
0%
10%
20%
30%
40%
50%
60%
70%
80%
90%
100%
1999-00
green title strataJul 06 -
Sep 06
2005-06
2004-05
2003-04
2002-03
2001-02
2000-01
Goldfields-Esperance
23%
Pilbara 3%
Kimberley 3%
Great Southern14%
Mid-West 3%
South-West54%

Western Australian Planning Commission Page 10 State Lot Activity September quarter 2006
Residential Non-residential
Applications Proposed lots Applications Proposed lots Applications Proposed lots
9 Applications received9.1 Regional summary: September quarter 2006
9.2 Applications received (number of lots) - top suburbs and localities
Number of lots lodged by local government area
No applications received
1-20
21-50
51-100
101-500
501+
BURNS BEACHWANNEROOUPPER SWAN
QUEENS PARK
CANNING VALE
BYFORDBERTRAMWELLARDBALDIVIS
PINJARRA
AUSTRALIND
DUNSBOROUGH
VASSE
MARGARET RIVER
GLENFIELD
NUNILE
NORTHAM
HAYDENMARK
DRUMMONDCOVE
Rank Metropolitan and Peel Proposed lots Country (local government area) Proposed lots
1 BYFORD 491 GLENFIELD (Greenough) 7112 BERTRAM 393 MARGARET RIVER (Augusta-Marg River) 6643 WELLARD 322 NUNILE (Toodyay) 3754 QUEENS PARK 302 DUNSBOROUGH (Busselton) 2105 BURNS BEACH 292 DRUMMOND COVE (Greenough) 1846 UPPER SWAN 209 HAY (Denmark) 1757 BALDIVIS 201 NORTHAM (Northam Town) 1518 WANNEROO 155 AUSTRALIND (Harvey) 1479 PINJARRA 152 DENMARK (Denmark) 14310 CANNING VALE 150 VASSE (Busselton) 118
South-West 34%
Wheatbelt 17%
Goldfields-Esperance 5%
Great Southern15%
Mid-West 22%
Pilbara 2%
Peel Region - remaining LGAs 1%
Gascoyne 3%
Kimberley 1%
Country
Total
• During the September quarter 2006, 907 applications were received to create 6364 residential lotsand 219 non-residential lots in the Perth region and Peel sector; totalling 6583 proposed lots. 30per cent of these received lots occurred in the inner-middle planning sector; the highest in theregion.
• In the country, 498 applications were lodged to create 4757 residential lots and 1292 non-residentiallots; totalling 6049 proposed lots. The South-West region recorded 35 per cent of the proposed lots;the highest in the country region.
• The suburb of Byford in the Perth region and Peel sector recorded the highest number of lotsreceived for approval in the September quarter, with 491 proposed lots.
• In the country, two localities with the highest number of lots received for approval were: Glenfield inthe Shire of Greenough with 711 proposed lots and Margaret River in the Shire of Augusta-MargaretRiver with 664 proposed lots.
Eastern 8%
Peel sector 9%
South-East19%
South-West22%
North-West12%
Inner-Middle30%
Metropolitan and Peel
Perth metropolitan region and Peel Sector
Inner-Middle 476 1 899 10 66 486 1 965North-West 81 813 3 8 84 821Eastern 43 439 19 58 62 497South-East 95 1 219 18 46 113 1 265South-West 99 1 431 8 32 107 1 463
Metropolitan 794 5 801 58 210 852 6 011Peel 51 563 4 9 55 572Metropolitan and Peel 845 6 364 62 219 907 6 583
CountryGascoyne 6 149 2 7 8 156Goldfields-Esperance 32 198 8 78 40 276Great Southern 77 596 32 325 109 921Kimberley 5 34 5 21 10 55Mid-West 32 1 262 21 112 53 1 374Peel Region - remaininglocal government areas 7 20 7 16 14 36Pilbara 4 107 2 4 6 111South-West 123 1 752 58 348 181 2 100Wheatbelt 35 639 42 381 77 1 020
Country 321 4 757 177 1 292 498 6 049State 1 166 11 121 239 1 511 1 405 12 632

• By the end of September 2006, there were 11 477 proposed lots pending a decision for residentialsubdivision and 984 proposed lots pending a decision for non-residential subdivision in the Perthregion and Peel sector, numbering 12 461 lots.
• The south-east planning sector had 22 per cent of lots still pending a decision in the region.
• Two suburbs that had the highest number of proposed lots pending a decision in the Perth regionand Peel sector were: Burns Beach with 1439 proposed lots and Byford with 910 proposed lots.
• In the country, there were 8470 proposed residential lots and 2600 proposed non-residential lots insubmitted applications pending a decision by the end of December. The South-West regionrecorded 33 per cent of total regional lots pending a decision.
• In the country, five localities that had the highest number of proposed lots pending a decision were:Glenfield 739 proposed lots, Margaret River 666 lots, College Grove 471 lots, Newman 470 lots andAustralind 403 proposed lots.
Perth metropolitan region and Peel Sector
Inner-Middle 398 2 047 19 95 417 2 142North-West 78 2 510 6 61 84 2 571Eastern 66 858 33 487 99 1 345South-East 105 2 643 27 87 132 2 730South-West 95 2 387 21 203 116 2 590
Metropolitan 742 10 445 106 933 848 11 378Peel 53 1 032 9 51 62 1 083Metropolitan and Peel 795 11 477 115 984 910 12 461
CountryGascoyne 4 98 3 9 7 107Goldfields-Esperance 21 319 11 145 32 464Great Southern 104 1 322 53 549 157 1 871Kimberley 6 36 5 21 11 57Mid-West 51 1 907 30 330 81 2 237Peel Region - remaininglocal government areas 7 67 6 13 13 80Pilbara 14 737 2 4 16 741South-West 141 3 007 71 705 212 3 712
Wheatbelt 46 977 76 824 122 1 801Country 394 8 470 257 2 600 651 11 070State 1 189 19 947 372 3 584 1 561 23 531
Western Australian Planning Commission Page 11 State Lot Activity September quarter 2006
Residential Non-residential
Applications Proposed lots Applications Proposed lots Applications Proposed lots
Total
10 Applications pending10.1 Regional summary: up to end of September 2006
Number of lots pending a decision bylocal government area
No applications pending
1-50
51-100
101-500
501-1000
1001 +
BURNS BEACH
QUEENS PARK
CANNING VALE
FORRESTDALEMUNSTER
BYFORDBERTRAM
WELLARDBALDIVIS
PINJARRA
NEWMAN
GLENFIELD
NUNILENORTHAM
BAYONET HEAD
CAPEBURNEY
AUSTRALIND
COLLEGE GROVE
DUNSBOROUGH
MARGARET RIVER
Rank Metropolitan and Peel Proposed lots Country (local government area) Proposed lots
1 BURNS BEACH 1439 GLENFIELD (Greenough) 7392 BYFORD 910 MARGARET RIVER (Augusta-Marg River) 6663 BALDIVIS 506 COLLEGE GROVE (Bunbury) 4714 BERTRAM 393 NEWMAN (East Pilbara) 4705 FORRESTDALE 378 AUSTRALIND (Harvey) 4036 CANNING VALE 356 NUNILE (Toodyay) 3757 WELLARD 338 BAYONET HEAD (Albany) 3268 MUNSTER 296 NORTHAM (Northam Town) 3029 QUEENS PARK 281 DUNSBOROUGH (Busselton) 21510 PINJARRA 274 CAPE BURNEY (Greenough) 191
Eastern 11%
Peel sector 9%
South-East 21%
South-West 21%
Inner-Middle 17%
North-West 21%
Wheatbelt 16%
Gascoyne 1%
Goldfields-Esperance 4%
Great Southern 17%
Kimberley 1%
Mid-West 20%Peel Region-
remainingLGA’s 1%
Pilbara 7%
South-West33%
10.2 Applications pending (number of lots) - top suburbs and localities
Metropolitan and Peel Country

• During the September quarter 2006 preliminary approval for subdivision was granted to 5590residential lots and 327 non-residential lots in the Perth region and Peel sector, totalling 5917proposed lots. The south-west planning sector recorded 29 per cent of total regional preliminaryapprovals; the highest in the region.
• In the country, preliminary approval was granted to 2940 residential lots and 901 non-residentiallots, numbering 3841 proposed lots. The South-West region accounted for 37 per cent of theseproposed lots.
• Two suburbs with the most preliminary approvals in the Perth region and Peel sector were Baldiviswith 926 proposed lots and Ellenbrook with 564 lots.
• Two localities with the most preliminary approvals in the country were Gap Ridge in the Shire ofRoebourne with 402 proposed lots and Dalyellup in the Shire of Capel with 400 proposed lots.
Western Australian Planning Commission Page 12 State Lot Activity September quarter 2006
11 Quarterly preliminary approvals11.1 Regional summary: September quarter 2006
1-20
21-50
51-100
101-500
No preliminary approvals
Final approvals by local government area - lots
1001+
501-1000
ASHBY
THE VINESELLENBROOK
SEVILLE GROVEAUBIN GROVE
BALDIVIS
SECRET HARBOUR
LAKELANDS
RAVENSWOODSOUTH YUNDERUP
GAP RIDGE
EXMOUTH
KALBARRI
CERVANTES
BOULDER
DRUMMONDCOVE
PRESTONBEACH
AUSTRALIND
DALYELLUP
MARGARET RIVER
Residential Non-residential
Applications Proposed lots Applications Proposed lots Applications Proposed lots
Perth metropolitan region and Peel sector
Inner-Middle 495 1 381 25 83 520 1 464North-West 57 512 3 21 60 533Eastern 37 786 23 76 60 862South-East 74 515 18 42 92 557South-West 72 1 619 20 79 92 1 698
Metropolitan 735 4 813 89 301 824 5 114Peel 33 777 7 26 40 803Metropolitan and Peel 768 5 590 96 327 864 5 917
CountryGascoyne 2 85 5 40 7 125Goldfields-Esperance 26 183 9 53 35 236Great Southern 31 113 14 51 45 164Kimberley 10 220 5 11 15 231Mid-West 23 597 16 100 39 697Peel Region - remaininglocal government areas 7 94 7 110 14 204Pilbara 2 404 0 0 2 404South-West 110 1 152 48 274 158 1 426Wheatbelt 22 92 43 262 65 354
Country 233 2 940 147 901 380 3 841State 1 001 8 530 243 1 228 1 244 9 758
Total
11.2 Preliminary approval activity - top suburbs and localities
Rank Metropolitan and Peel Proposed lots Country (local government area) Proposed lots
1 BALDIVIS 926 GAP RIDGE (Roebourne) 4022 ELLENBROOK 564 DALYELLUP (Capel) 4003 LAKELANDS 248 AUSTRALIND (Harvey) 2344 SECRET HARBOUR 218 KALBARRI (Northampton) 1695 AUBIN GROVE 184 PRESTON BEACH (Waroona) 1346 SOUTH YUNDERUP 159 DRUMMOND COVE (Greenough) 1287 ASHBY 156 CERVANTES (Dandaragan) 938 SEVILLE GROVE 152 EXMOUTH (Exmouth) 819 THE VINES 146 BOULDER (Kalgoorlie-Boulder) 7710 RAVENSWOOD 144 MARGARET RIVER (Augusta-Marg. River) 69
Eastern 15%
Peel sector14%
South-East9%
South-West28%
Inner-Middle25%
North-West9%
Metropolitan and Peel
South-West38%
Wheatbelt 9%
Goldfields-Esperance 6%
Kimberley 6%
Mid-West 18%
Gascoyne 3%
Peel Regionremaining
LGAs 5%
Pilbara 11% Great Southern 4%
Country

• By the end of September 2006, the number of proposed lots with current preliminary approvals inthe Perth region and Peel sector totalled 53 010 lots; 48 412 lots were proposed for residential and4598 proposed lots for non-residential subdivision.
• Two planning sectors contributed 42 per cent of all regional current preliminary lot approvals: thesouth-west with 22 per cent and the north-west with 20 per cent.
• The suburbs of Baldivis and Forrestdale recorded the highest total number of all current preliminaryapprovals by the end of September with 2617 proposed lots and 2331 proposed lots respectively.
• In the country, the number of proposed lots with current preliminary approvals totalled 24 614 lots;18 691 lots were proposed for residential and 5923 lots implied non-residential. The South-Westregion recorded 42 per cent of all current preliminary approvals; the highest in the country region.
• The locality of Australind continued to record the highest number of all regional current preliminaryapprovals, with 1395 proposed lots.
Western Australian Planning Commission Page 13 State Lot Activity September quarter 2006
12 All current preliminary approvals12.1 Regional summary: up to end of September 2006
1-100
101-500
No current preliminary approvals
Lots with current preliminary approvals bylocal government area
5001 +
2001-5000
1001-2000
501-1000
BUTLERCLARKSON
ELLENBROOK
CANNING VALE
FORRESTDALE
BALDIVIS
DUDLEY PARK
DAWESVILLE
AUBIN GROVEBYFORD
EXMOUTH
GLENFIELD
JURIEN BAY
CASTLETOWN
MCKAIL
AUSTRALINDMILLBRIDGE
GEOGRAPHE
BRIDGETOWN
DALYELLUP
Rank Metropolitan and Peel Proposed lots Country (local government area) Proposed lots
1 BALDIVIS 2617 AUSTRALIND (Harvey) 13952 FORRESTDALE 2331 DALYELLUP (Capel) 11143 ELLENBROOK 1900 EXMOUTH (Exmouth) 7904 CANNING VALE 1890 JURIEN BAY (Dandaragan) 7825 CLARKSON 1328 GEOGRAPHE (Busselton) 7446 BUTLER 1319 MILLBRIDGE (Dardanup) 7057 DAWESVILLE 1198 GLENFIELD (Greenough) 6958 AUBIN GROVE 1192 MCKAIL (Albany) 6239 BYFORD 1159 CASTLETOWN (Esperance) 56710 DUDLEY PARK 1118 BRIDGETOWN (Bridgetown-G’bushes) 501
Eastern 11%
Peel sector 15%
South-East 15%
South-West 22%
Inner-Middle 17%
North-West 20%
South-West 43%
Wheatbelt 14%Goldfields-
Esperance 7%
Gascoyne 3%
Kimberley 3%
Mid-West 15%
Pilbara 3% Peel Region - remaining LGAs 2%
GreatSouthern 10%
Country
Residential Non-residential
Applications Proposed lots Applications Proposed lots Applications Proposed lots
Total
12.2 Current preliminary approvals (number of lots) - top suburbs and localities
Metropolitan and Peel
Perth metropolitan region and Peel sector
Inner-Middle 2 659 8 223 123 693 2 782 8 916North-West 359 9 778 56 748 415 10 526Eastern 250 4 808 143 1 044 393 5 852South-East 365 7 384 105 758 470 8 142South-West 433 10 702 96 1 032 529 11 734
Metropolitan 4 066 40 895 523 4 275 4 589 45 170Peel 240 7 517 40 323 280 7 840Metropolitan and Peel 4 306 48 412 563 4 598 4 869 53 010
CountryGascoyne 24 549 13 142 37 691Goldfields-Esperance 107 1 394 49 393 156 1 787Great Southern 241 1 805 98 666 339 2 471Kimberley 31 658 15 140 46 798Mid-West 93 3 329 73 486 166 3 815Peel Region - remaininglocal government areas 21 112 22 275 43 387Pilbara 20 791 6 63 26 854South-West 490 8 465 241 1 995 731 10 460Wheatbelt 88 1 588 167 1 763 255 3 351
Country 1 115 18 691 684 5 923 1 799 24 614State 5 421 67 103 1 247 10 521 6 668 77 624

• During the September quarter 2006, final approval was granted to 3540 residential lots and 250non-residential lots throughout the Perth region and Peel sector, totaling 3790 lots. The north-westand inner-middle planning sectors recorded 23 per cent and 21 per cent of final approvalsrespectively.
• Canning Vale recorded the highest number of final approvals with 235 lots.
• In the country, final approval was granted to 1449 residential lots and 470 non-residential lots,totalling 1919 lots in the September quarter. The South-West region continued to contribute themost final approvals, with 43 per cent of regional total final approvals.
• Three suburbs in the country region recorded over 100 final approval lots; Jurien Bay in the Shire ofDandaragan with 218 lots, Australind in the Shire of Harvey with 141 lots and Vasse in the Shire ofBusselton with 117 lots.
Western Australian Planning Commission Page 14 State Lot Activity September quarter 2006
13 Quarterly final approval13.1 Regional summary: September quarter 2006
1-10
11-20
21-50
51-100 501 +
101-500
No final approvals
Final approvals by local government area - lots
RIDGEWOOD
TAPPING
ELLENBROOK
CANNING VALE
SINAGRA
AVELEYMADELEY
SOUTHERN RIVER
SECRET HARBOUR
DAWESVILLE
CABLE BEACH
NICKOL
WANDINA
JURIEN BAY
CASTLETOWN
AUSTRALINDMILLBRIDGE
VASSE BRIDGETOWN
MARGARET RIVER
Residential Non-residential
Applications Lots Applications Lots Applications Lots
Perth metropolitan region and Peel sector
Inner-Middle 270 750 19 39 289 789North-West 52 845 9 15 61 860Eastern 24 500 15 34 39 534South-East 42 499 24 136 66 635South-West 44 539 10 21 54 560
Metropolitan 432 3 133 77 245 509 3 378Peel 31 407 3 5 34 412Metropolitan and Peel 463 3 540 80 250 543 3 790
CountryGascoyne 0 0 2 13 2 13Goldfields-Esperance 8 117 1 18 9 135Great Southern 17 120 22 62 39 182Kimberley 3 74 4 14 7 88Mid-West 9 120 5 67 14 187Peel Region - remaininglocal government areas 1 3 9 27 10 30Pilbara 2 86 2 3 4 89South-West 60 662 42 165 102 827Wheatbelt 11 267 17 101 28 368
Country 111 1 449 104 470 215 1 919State 574 4 989 184 720 758 5 709
Total
13.2 Final approval activity - top suburbs and localities
Rank Metropolitan and Peel Lots Country (local government area) Lots
1 CANNING VALE 235 JURIEN BAY (Dandaragan) 2182 SOUTHERN RIVER 175 AUSTRALIND (Harvey) 1413 ELLENBROOK 169 VASSE (Busselton) 1174 AVELEY 147 WANDINA (Greenough) 985 MADELEY 145 CASTLETOWN (Esperance) 816 RIDGEWOOD 116 MARGARET RIVER (Augusta-Marg. River) 807 DAWESVILLE 111 NICKOL (Roebourne) 788 SECRET HARBOUR 101 BRIDGETOWN (Bridgetown-G’bushes) 739 TAPPING 98 MILLBRIDGE (Dardunup) 7210 SINAGRA 90 CABLE BEACH (Broome) 71
Eastern14%
Peel sector11%
South-East17%
South-West 15%
Inner-middle21%
North-West22%
Metropolitan and Peel
South-West 42%
Wheatbelt 19%
Goldfields-Esperance 7%
Kimberley 5%
Mid-West 10%
Pilbara 5%Great Southern 9%
Gascoyne 1%
Peel Region - remainingLGAs 2%
Country

Western Australian Planning Commission Page 15 State Lot Activity September quarter 2006
14 Metropolitan local government area summary
September quarter 2006Final
approvals
All current
preliminary
approvals
Preliminary
approvals
Applications
pending
Applications
received
Lots
Proposed lots
up to end of
Sep 2006
Proposed
lots
Proposed lots
up to end of
Sep 2006
Proposed
lots
Final
approvals
All current
preliminary
approvals
Preliminary
approvals
Applications
pending
Lots
Proposed lots
up to end of
Sep 2006
Proposed
lots
Proposed lots
up to end of
Sep 2006
Proposed
lots
Residential Non-residental
Inner-MiddleBassendean (T) 37 103 20 328 21 24 29 0 35 0Bayswater (C) 292 297 205 804 78 0 0 9 35 0Belmont (C) 72 55 77 610 44 0 4 1 18 2Cambridge (T) 75 77 14 70 4 0 0 1 6 1Canning (C) 456 468 182 1 100 116 18 21 26 383 0Claremont (T) 20 25 11 87 7 0 0 0 4 3Cottesloe (T) 4 2 6 69 2 0 0 0 0 0East Fremantle (T) 7 7 0 110 4 0 0 0 2 0Fremantle (C) 117 155 113 537 39 0 0 2 12 11Melville (C) 138 110 116 1 013 73 0 0 8 100 0Mosman Park (T) 28 28 8 79 12 0 0 3 5 0Nedlands (C) 21 32 141 229 6 2 5 7 12 0Peppermint Grove (S) 0 0 6 32 0 0 0 0 0 0Perth (C) 0 0 3 10 1 2 13 18 22 7South Perth (C) 30 29 35 173 19 0 0 0 2 1Stirling (C) 457 494 369 2 237 232 18 18 7 27 2Subiaco (C) 4 4 3 67 6 0 0 0 0 1Victoria Park (T) 112 120 43 340 62 2 5 1 26 10Vincent (T) 29 41 29 328 24 0 0 0 4 1Total 1 899 2 047 1 381 8 223 750 66 95 83 693 39
North-West Joondalup (C) 374 1 562 92 1 154 75 3 8 8 26 2Wanneroo (C) 439 948 420 8 624 770 5 53 13 722 13Total 813 2 510 512 9 778 845 8 61 21 748 15
Eastern Kalamunda (S) 76 230 42 1 487 110 2 10 1 124 7Mundaring (S) 35 103 16 387 6 8 25 3 193 12Swan (C) 328 525 728 2 934 384 48 452 72 727 15Total 439 858 786 4 808 500 58 487 76 1 044 34
South-East Armadale (C) 368 765 248 3 288 24 22 38 25 289 71Gosnells (C) 356 942 177 2 957 426 10 19 13 78 4Serpentine-Jarrahdale (S) 495 936 90 1 139 49 14 30 4 391 61Total 1 219 2 643 515 7 384 499 46 87 42 758 136
South-WestCockburn (C) 353 1 016 352 4 502 318 4 147 50 703 6Kwinana (T) 739 730 21 1 321 70 2 25 8 56 7Rockingham (C) 339 641 1 246 4 879 151 26 31 21 273 8Total 1 431 2 387 1 619 10 702 539 32 203 79 1 032 21
Perth metropolitan region 5 801 10 445 4 813 40 895 3 133 210 933 301 4 275 245
Peel sectorMandurah (C) 292 651 398 5 833 342 0 38 1 48 2Murray (S) 271 381 379 1 684 65 9 13 25 275 3Total 563 1 032 777 7 517 407 9 51 26 323 5
Perth metropolitanregion andPeel sector 6 364 11 477 5 590 48 412 3 540 219 984 327 4 598 250
Note: (C) for City, (T) for Town, and (S) for Shire.
Applications
received

GascoyneCarnarvon (S) 92 92 37 60 0 2 4 5 7 0Exmouth (S) 49 0 48 429 0 5 5 33 133 13Remaining LGAs 8 6 0 60 0 0 0 2 2 0Total 149 98 85 549 0 7 9 40 142 13
Goldfields-EsperanceEsperance (S) 36 131 57 609 81 5 7 39 203 0Kalgoorlie-Boulder (C) 151 148 113 456 34 4 13 4 66 18Remaining LGAs 11 40 13 329 2 69 125 10 124Total 198 319 183 1 394 117 78 145 53 393 18
Great SouthernAlbany (C) 354 819 73 1 400 110 77 232 21 421 48Remaining LGAs 242 503 40 405 10 248 317 30 245 14Total 596 1 322 113 1 805 120 325 549 51 666 62
KimberleyBroome (S) 34 34 136 539 74 0 0 8 104 5Wyndham-EastKimberley (S) 0 2 35 70 0 17 17 2 18 9Remaining LGAs 0 0 49 49 0 4 4 1 18 0Total 34 36 220 658 74 21 21 11 140 14
Mid-WestGeraldton (C) 219 350 138 338 4 9 9 5 37 0Greenough (S) 938 1 417 203 2 120 102 39 246 75 198 27Irwin (S) 90 125 51 381 0 7 13 16 70 2Remaining LGAs 15 15 205 490 14 57 62 4 181 38Total 1 262 1 907 597 3 329 120 112 330 100 486 67
Peel Region - remaining local government areasBoddington (S) 11 60 9 25 0 5 4 11 96 5Waroona (S) 9 7 85 87 3 11 9 99 179 22Total 20 67 94 112 3 16 13 110 275 27
PilbaraPort Hedland (T) 32 68 0 127 8 2 2 0 4 1Roebourne (S) 73 98 402 658 78 2 2 0 4 2Remaining LGAs 2 571 2 6 0 0 0 0 55 0Total 107 737 404 791 86 4 4 0 63 3
South-WestAugusta-Margaret River (S) 703 710 70 873 84 15 17 24 176 9Bunbury (C) 174 685 170 702 33 22 22 84 135 57Busselton (S) 290 391 83 2 623 154 140 200 106 582 48Capel (S) 134 219 404 1 317 59 2 6 7 64 0Dardanup (S) 30 99 15 929 108 28 35 3 122 3Harvey (S) 177 549 339 1 742 138 8 0 11 166 9Remaining LGAs 244 354 71 279 86 133 425 39 750 39Total 1 752 3 007 1 152 8 465 662 348 705 274 1 995 165
WheatBeltBeverley (S) 2 0 2 2 3 23 45 4 19 0Brookton (S) 0 0 0 4 0 16 17 8 11 0Chittering (S) 7 56 0 56 0 91 272 4 403 34Gingin (S) 9 147 4 138 2 71 80 35 631 4Northam (S) 17 17 0 0 0 46 116 6 0 3Northam (T) 149 213 30 325 0 4 91 0 65 15Toodyay (S) 377 377 8 19 2 8 8 8 169 5York (S) 33 47 10 42 55 8 18 8 11 3Remaining LGAs 45 120 38 1 002 205 114 177 189 454 37Total 639 977 92 1 588 267 381 824 262 1 763 101Country 4 757 8 470 2 940 18 691 1 449 1 292 2 600 901 5 923 470
Note: (C) for City, (T) for Town, and (S) for Shire andLGAs for local government areas
15 Selected regional local government area summary
September quarter 2006Final
approvals
All current
preliminary
approvals
Preliminary
approvals
Applications
received
Lots
Proposed lots
up to end of
Sep 2006
Proposed
lots
Proposed lots
up to end of
Sep 2006
Proposed
lots
Final
approvals
All current
preliminary
approvals
Preliminary
approvals
Applications
pending
Applications
received
Lots
Proposed lots
up to end of
Sep 2006
Proposed
lots
Proposed lots
up to end of
Sep 2006
Proposed
lots
Residential Non-residential
Applications
pending
Western Australian Planning Commission Page 16 State Lot Activity September quarter 2006

Western Australian Planning Commission Page 17 State Lot Activity September quarter 2006
16 State lot approvals
State residential lot approvals
State rural-residential/special residential lotapprovals
State industrial lot approvals
State commercial lot approvals
Preliminary Final Preliminary Final Preliminary Final Preliminary Final
Metropolitan Country StatePeel sector
16.1 Residential
1995–96 11 251 7 043 2 240 598 3 857 1 482 17 348 9 1231996–97 11 945 5 894 1 599 506 4 799 1 357 18 343 7 7571997–98 16 304 6 593 2 509 517 5 337 1 845 24 150 8 9551998–99 19 257 8 819 1 558 590 5 001 2 174 25 816 11 5831999–00 12 713 10 047 1 347 752 3 522 2 012 17 582 12 8112000–01 14 313 7 136 2 093 499 3 976 1 283 20 382 8 9182001–02 15 555 8 918 3 121 900 5 343 1 539 24 019 11 3572002–03 16 421 11 677 2 868 1 301 4 246 1 651 23 535 14 6292003–04 24 264 13 049 3 064 1 952 4 676 1 797 32 004 16 7982004–05 16 264 13 726 3 561 1 781 8 384 3 098 28 209 18 6052005–06 21 842 14 605 3 006 1 694 8 667 4 390 33 515 20 689
Jul 06 to Sep 06 4 813 3 133 777 407 2 940 1 449 8 530 4 989
Preliminary Final Preliminary Final Preliminary Final Preliminary Final
Metropolitan Country StatePeel sector
1995–96 233 103 10 7 59 22 302 1321996–97 301 132 18 6 108 38 427 1761997–98 232 159 95 5 85 56 412 2201998–99 229 127 5 45 170 60 404 2321999–00 262 155 6 8 69 99 337 2622000–01 183 226 26 8 90 46 299 2802001–02 145 175 10 17 98 42 253 2342002–03 278 84 26 8 100 74 404 1662003–04 397 129 33 3 82 83 512 2152004–05 303 134 20 17 88 47 411 1982005–06 381 143 17 12 75 38 473 193
Jul 06 to Sep 06 69 172 3 13 30 70 102 255
Preliminary Final Preliminary Final Preliminary Final Preliminary Final
Metropolitan Country StatePeel sector
1995–96 696 246 48 2 377 160 1 121 4081996–97 731 384 8 74 377 185 1 116 6431997–98 503 281 3 1 570 202 1 076 4841998–99 661 233 17 4 419 116 1 097 3531999–00 578 314 16 6 440 159 1 034 4792000–01 279 243 4 2 441 75 724 3202001–02 298 110 6 0 97 107 401 2172002–03 546 171 27 14 318 67 891 2522003–04 654 202 15 17 356 114 1 025 3332004–05 771 270 8 8 244 156 1 023 4342005–06 563 308 75 10 233 172 871 490
Jul 06 to Sep 06 89 31 1 0 206 77 296 108
Preliminary Final Preliminary Final Preliminary Final Preliminary Final
Metropolitan Country StatePeel sector
1995–96 1 211 474 133 79 1 403 792 2 747 1 3451996–97 961 344 100 105 1 302 759 2 363 1 2081997–98 1 002 357 42 30 2 016 561 3 060 9481998–99 666 586 66 96 1 212 690 1 944 1 3721999–00 1 393 450 36 36 1 644 806 3 073 1 2922000–01 738 392 19 47 1 336 450 2 093 8892001–02 420 303 20 12 804 320 1 244 6352002–03 796 267 11 11 1 125 487 1 932 7652003–04 762 412 30 32 1 602 751 2 394 1 1952004–05 1 594 343 22 39 873 594 2 489 9762005–06 408 307 21 62 1 607 909 2 036 1 278
Jul 06 to Sep 06 69 135 4 2 174 179 247 316
16.2 Rural-residential and special residential
16.3 Industrial
16.4 Commercial
5000
10 000
15 000
20 000
25 000
30 000
0
500
1000
1500
2000
2500
3000
3500
0
250
500
750
1000
1250
0
100
200
300
400
500
600
1995-96
1996-97
1997-98
1998-99
1999-00
2000-01
2001-02
2002-03
2003-04
2004-05
preliminary approvals final approvals
35 000
2005-06
Jul 06 to Sep 06
1995-96
1996-97
1997-98
1998-99
1999-00
2000-01
2001-02
2002-03
2003-04
2004-05
2005-06
Jul 06 to Sep 06
1995-96
1996-97
1997-98
1998-99
1999-00
2000-01
2001-02
2002-03
2003-04
2004-05
2005-06
Jul 06 to Sep 06
1995-96
1996-97
1997-98
1998-99
1999-00
2000-01
2001-02
2002-03
2003-04
2004-05
2005-06
Jul 06 to Sep 06
Western Australian Planning Commission Page 18 State Lot Activity September quarter 2006
Introduction
This publication contains statisticaldetails of subdivision activity in WesternAustralia.
Coverage
1. Lot creation statistics are compiledfrom subdivision (including surveystrata and vacant strata)applications lodged with the WAPCfor approval.
2. These statistics relate to lots forresidential and non-residentialpurposes; for urban residential lotsless than 3000 sq m, and all non-residential and residential stratalots irrespective of size. The non-residential component of thesestatistics includes counts of rural-residential and special residentiallots.
3. Strata lot statistics provided includeall survey strata lots, and vacantstrata lots that require determinationby the WAPC. Some categories ofbuilt strata lots may be createdwithout WAPC endorsementpursuant to the Strata Titles GeneralRegulations 1996 (requiring onlylocal government approval), andsuch lots are beyond the scope ofthese statistics.
4. From March 1998, country regionstatistics include lots produced bythe State Land Services of theDepartment for Planning andInfrastructure (formerly done by theDepartment of Land Information).
Definitions
Applications received refers to thoseapplications received by the WAPC forthe purpose of subdivision.
Applications pending is the number ofapplications under assessment forpreliminary approval by the WAPC andincludes those which have beendeferred.
Preliminary approval is conditionalapproval granted by the WAPC forsubdivision development to begin. Theapproval is preceded by an assessmentof the proposed subdivision plan inconsultation with servicing agencies.On receipt of preliminary approval, theproponent may commence subdivisiondevelopment in accordance with theconditions of approval within four yearsof the approval date. These approvalconditions are based on outcomes fromthe consultative assessment.
Current preliminary approvals areALL those approvals not older than fouryears from the date of preliminaryapproval not having proceeded to finalapproval. Preliminary approvals olderthan four years have expired and areno longer valid.
Formerly, development of lots was to becompleted within three years, thisperiod has been extended to four yearsby the Planning and Development Act2005 proclaimed on 9 April 2006. Statelot activity statistics for the June quarter2006 and later reflect the newlegislation.
Final approval is the WAPCendorsement of the proponent’ssubmitted deposited plan orstrata/survey strata plan describing thenow complete subdivision constructedin accordance with the conditions setdown in the preliminary approval.Finally approved deposited plans/strataplans then are registered with Landgate(formerly Department of LandInformation) where certificates of titlesfor the newly created lots can beissued. The characteristic difference inlot numbers seen between preliminaryand final approvals arises fromproponents choosing not to proceedwith the subdivision in the specified four- year period in accordance with theconditions of the preliminary approval;either at all, only in part, or via anotherpreliminary approval incorporating anew plan for the subject land.
‘Green Title’ lot is a conventional landparcel shown on a deposited planregistered with Landgate (formerly theDepartment of Land Information). Thepurpose of the lot is determined by anappropriate zoning under the relevantlocal government local planningscheme.
Strata lots are created under theStrata Titles Act 1985. In a strata plan,each owner holds some of the propertyindividually (a strata lot), and theremainder is held jointly by all owners(common property) although in a surveystrata scheme, common property is notnecessary. By their nature, all lots in astrata plan share responsibilities andbenefits through an ongoingrelationship with each other.
Built or Strata Scheme
A residential “built” strata or stratascheme is the original form of strata titlein the State. Simply, it definesownership of a floor area within abuilding envelope, and since 30 June1985 can also incorporate land areaassociated with the building. A buildingmust be shown on the strata plan, andthe boundaries of the strata lots(including height) are shown inreference to the building. Prior to 30June 1985, lots could only be within abuilding. After that date, part of the lotscould also be outside the building andcould include the building structure. TheWAPC only appears as an approvingauthority in built or strata schemecreations of primarily six or moreresidential lots, in conjunction withcertain other conditions. Built strata lotsrequiring WAPC approval are not withinthe scope of the residential land supplysurvey.
Survey Strata
The Strata Titles Amendment Act 1995created a new form of strata known asa survey-strata scheme. Simply, itdefines ownership of a land parcelwithout reference to a building, eventhough buildings exist or will beconstructed on all parcels. Survey-strata schemes are either all vacant orall developed, excluding those lotswhere ownership is shared as commonproperty. The lots on a survey-strataplan look much the same as lots thatare shown on plans and diagrams for“green” titles.
Notes

Western Australian Planning Commission Page 19 State Lot Activity June quarter 2006
Vacant Strata
The creation of a vacant strata lot is thesubdivision of a lot containing an existingdwelling. Upon coming into existence thestrata plan will comprise a mix ofdeveloped and vacant lots, of which atleast one will contain a dwelling.
Estimated median lot size is calculatedfrom a count of created lots grouped withinlot size intervals that have becomestandards of the department's applicationprocessing. Thus this remains an estimateonly, as an accurate median needs to becalculated from counts using the specificsize of each created lot.
Contact
For more information regarding the data,please contact the Applied Research andModelling branch at the department on 089264 7750.
Caveat
Any statement, opinion or advice,expressed or implied in this publication ismade in good faith but on the basis thatthe WAPC, its agents and employees arenot liable to any person for any damage orloss whatsoever which has occurred ormay occur in relation to that person takingor not taking action in respect of anystatement, or advice referred to in thisdocument.
Reproduction of these statistics, either inpart or full, is permitted. However,acknowledgement of the source would beappreciated.

Western Australian Planning Commission Page 20 State Lot Activity September quarter 2006
© State of Western AustraliaPublished by the Western Australian Planning CommissionAlbert Facey House, 469 Wellington StreetPerth, Western Australia 6000
Published March 2007ISSN 1446-5108Website: www.wapc.wa.gov.auemail: [email protected]: (08) 9264 7777, Fax: (08) 9264 7566TTY: (08) 9264 7535, Infoline: 1800 626 477
Copies of this document are available in alternative formats on application to the WAPC Communication Services branch