labview based measurement system design for …511152/fulltext01.pdflabview based measurement system...
TRANSCRIPT
Degree project in
LabView Based MeasurementSystem Design for Data Acquisition
During HTOL Tests at TranSIC AB
MATTIAS MILLBRO
Stockholm, Sweden 2011
XR-EE-MST 2011:009
Electrical Measurement TechnologySecond level, 30 HEC

LabView Based Measurement System Design forData Acquisition During HTOL Tests at TranSIC
AB
LabView based measurement system designed for controlling, monitoring and loggingcollector-emitter voltages and temperatures when conducting High Temperature
Operating Life tests on up to 48 silicon carbide transistors at once.
MATTIAS MILLBRO
Master’s Thesis at Microsystem TechnologyExaminer and Supervisor: Associate Professor Hans Sohlström
Supervisor at TranSIC: Anders Lindgren
December 16, 2011

AbstractTranSIC AB needs to conduct High Temperature Operating Life (HTOL)tests on silicon carbide transistors in order to ensure product reliabil-ity and gather information for development purposes. The goal of thismaster thesis was to select measurement related hardware and developLabView software capable of controlling and monitoring up to 48 tran-sistors during HTOL tests. National Instruments cDAQ and Agilent34972A were compared for data acquisition purposes. Calculations andhardware requirements resulted in the purchase and system integrationof a Agilent 34972A data logger with three 34901A 20 channel mul-tiplexer expansion cards. LabView software was programmed using aextended Producer/Consumer Design Pattern as the main structure.Software requirements was fulfilled using SubVIs for both user visiblewindows and functionality related data handling. The finished softwarefulfilled all initial requirements but several possible future improvementsare suggested. The system is now in full scale use at TranSIC AB.
Contents
1 Introduction 1
2 Method 32.1 HTOL Tests . . . . . . . . . . . . . . . . . . . . . . . . . . . . . . . . 32.2 HTOL Tests on Silicon Carbide Transistors . . . . . . . . . . . . . . 32.3 LabView . . . . . . . . . . . . . . . . . . . . . . . . . . . . . . . . . . 5
2.3.1 Example Code . . . . . . . . . . . . . . . . . . . . . . . . . . 62.3.2 Data Types . . . . . . . . . . . . . . . . . . . . . . . . . . . . 82.3.3 Structures . . . . . . . . . . . . . . . . . . . . . . . . . . . . . 92.3.4 SubVIs . . . . . . . . . . . . . . . . . . . . . . . . . . . . . . 92.3.5 Producer/Consumer Design Pattern (PCDP) . . . . . . . . . 10
2.4 Measurement Uncertainty . . . . . . . . . . . . . . . . . . . . . . . . 112.4.1 Combined Uncertainties . . . . . . . . . . . . . . . . . . . . . 13
3 Problem Definition 153.1 Hardware Requirements . . . . . . . . . . . . . . . . . . . . . . . . . 153.2 Software Requirements . . . . . . . . . . . . . . . . . . . . . . . . . . 16
4 Hardware Choice 174.1 Measuring Equipment . . . . . . . . . . . . . . . . . . . . . . . . . . 17
4.1.1 National Instruments Compact DAQ . . . . . . . . . . . . . . 174.1.2 Agilent Technologies 34972A Data Logger . . . . . . . . . . . 184.1.3 Comparrison . . . . . . . . . . . . . . . . . . . . . . . . . . . 204.1.4 Hardware Choice . . . . . . . . . . . . . . . . . . . . . . . . . 21
4.2 Base Current Supply Control . . . . . . . . . . . . . . . . . . . . . . 21
5 Software Design 235.1 Main VI . . . . . . . . . . . . . . . . . . . . . . . . . . . . . . . . . . 23
5.1.1 GUI . . . . . . . . . . . . . . . . . . . . . . . . . . . . . . . . 245.1.2 The Main Producer Loop . . . . . . . . . . . . . . . . . . . . 265.1.3 Main Consumer Loop . . . . . . . . . . . . . . . . . . . . . . 275.1.4 Measurement Data Producer Loop . . . . . . . . . . . . . . . 285.1.5 Data Consumer Loop . . . . . . . . . . . . . . . . . . . . . . 285.1.6 PCDP Queue . . . . . . . . . . . . . . . . . . . . . . . . . . . 28
5.1.7 Clusters and Controls . . . . . . . . . . . . . . . . . . . . . . 295.2 Windowed SubVIs . . . . . . . . . . . . . . . . . . . . . . . . . . . . 30
5.2.1 mm_hardwareconfig.vi . . . . . . . . . . . . . . . . . . . . . . 305.2.2 mm_settings.vi . . . . . . . . . . . . . . . . . . . . . . . . . . 325.2.3 mm_register.vi . . . . . . . . . . . . . . . . . . . . . . . . . . 335.2.4 mm_graph.vi . . . . . . . . . . . . . . . . . . . . . . . . . . . 345.2.5 mm_advancedpreferences.vi . . . . . . . . . . . . . . . . . . . 355.2.6 mm_exittimer.vi . . . . . . . . . . . . . . . . . . . . . . . . . 365.2.7 mm_about.vi . . . . . . . . . . . . . . . . . . . . . . . . . . . 37
5.3 Functionality SubVIs . . . . . . . . . . . . . . . . . . . . . . . . . . . 375.3.1 mm_timehandle.vi . . . . . . . . . . . . . . . . . . . . . . . . 375.3.2 mm_measure.vi . . . . . . . . . . . . . . . . . . . . . . . . . 395.3.3 mm_filehandle.vi . . . . . . . . . . . . . . . . . . . . . . . . . 405.3.4 mm_indicator.vi . . . . . . . . . . . . . . . . . . . . . . . . . 415.3.5 QPX1200_Manager.vi . . . . . . . . . . . . . . . . . . . . . . 425.3.6 34972_manager.vi . . . . . . . . . . . . . . . . . . . . . . . . 43
5.4 Log Files . . . . . . . . . . . . . . . . . . . . . . . . . . . . . . . . . 445.5 Main VI Example Usage . . . . . . . . . . . . . . . . . . . . . . . . . 45
5.5.1 Start the HTOL Test program . . . . . . . . . . . . . . . . . 455.5.2 Configure the Hardware . . . . . . . . . . . . . . . . . . . . . 455.5.3 Load and Edit Settings . . . . . . . . . . . . . . . . . . . . . 475.5.4 Register Transistors . . . . . . . . . . . . . . . . . . . . . . . 485.5.5 Start Measurement . . . . . . . . . . . . . . . . . . . . . . . . 485.5.6 View Graph of Measured Data . . . . . . . . . . . . . . . . . 495.5.7 Stop the Measurement . . . . . . . . . . . . . . . . . . . . . . 505.5.8 Close the Program . . . . . . . . . . . . . . . . . . . . . . . . 50
6 Results and Conclusions 516.1 Data Acquisition Unit Results . . . . . . . . . . . . . . . . . . . . . . 516.2 Software Results . . . . . . . . . . . . . . . . . . . . . . . . . . . . . 536.3 Possible Improvements . . . . . . . . . . . . . . . . . . . . . . . . . . 546.4 Final Conclusions . . . . . . . . . . . . . . . . . . . . . . . . . . . . . 56
Bibliography 57
Appendices 57
A Data File 59

Chapter 1
Introduction
TranSIC AB develops and sells silicon carbide transistors for high power appli-cations. There is a need to conduct stress tests on these transistors in order toensure the customer that the product can preform as specified throughout its life-time. These are called High Temperature Operating Life (HTOL) tests and theyare conducted by keeping the collector-emitter current on the maximum level whilemaintaining a very high temperature and doing so for a specified time. HTOL testsis also used for development purposes. TranSIC has conducted HTOL tests on asmaller scale for some time, without continuously monitoring the tests. A transistorfailure results in a huge strain on the broken transistor which will be destroyed ifthe test is not stopped in time. This makes it impossible to examine what causedthe initial failure.
The goal of this master thesis is to select hardware and develop software in order toconduct, control and monitor HTOL tests for silicon carbide high power transistors,at TranSIC AB.
This report explains the methods used to conduct HTOL tests, design a measure-ment program and evaluate hardware options. All hardware and software require-ments are thereafter given. The choice of hardware is motivated. This is thenfollowed by a detailed explanation of the structure of the program. The results arefinally presented along with several improvement suggestions.
1

Chapter 2
Method
There are a few things that need to be explained to fully grasp the content ofthis thesis: The concept of HTOL tests on transistors, the LabView programmingenvironment and uncertainty calculations for data acquisition hardware.
2.1 HTOL Tests
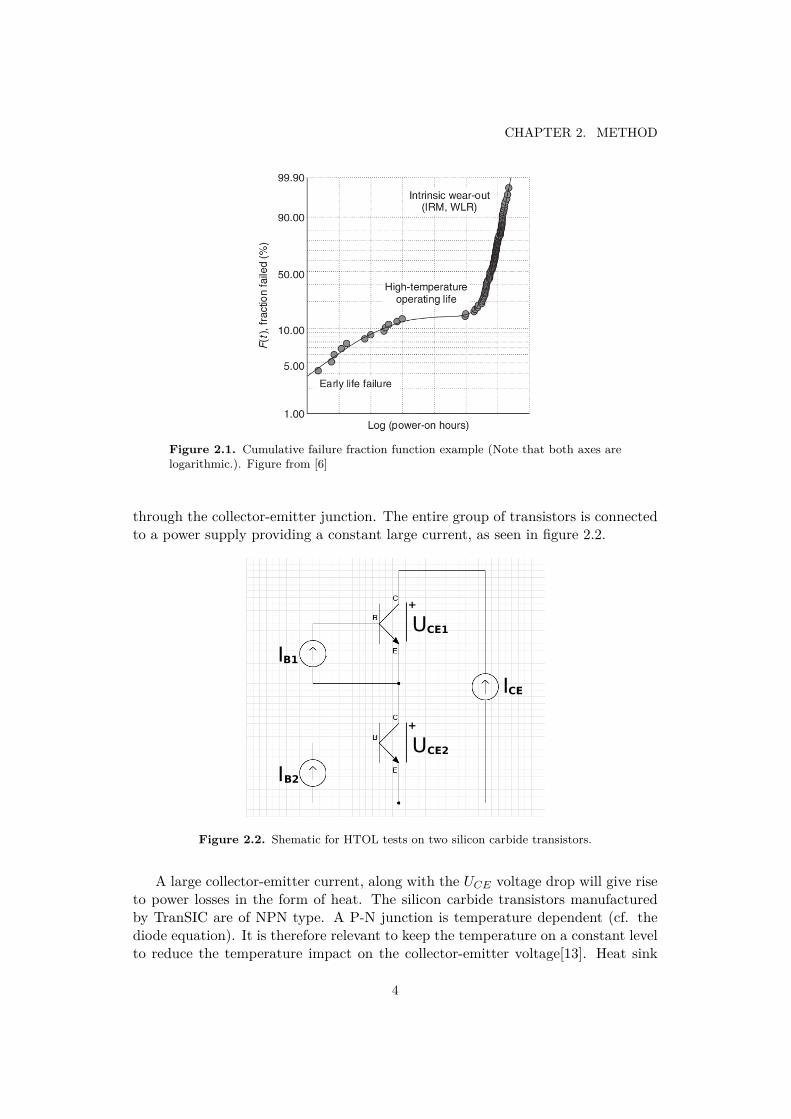
High Temperature Operating Life (HTOL) tests are used for many different typesof products. It is a concept with the basic purpose to evaluate the long termperformance of a product by stress testing it under high temperature conditions.The lifetime of some products, such as silicon carbide transistors, can be dividedinto three regions: early life failure, HTOL, and intrinsic wear-out[6]. This meansthat a component will either fail initially, after a relatively short period of time,or after a full lifetime. The period in between is called the High TemperatureOperating Life. A example of a function describing how the failures of componentsare distributed over time, called the "cumulative failure fraction function"[6], canbe seen in figure 2.1 where a large amount of components is tested throughout theirlifetime. Hardware failures is marked by circles.
If this function is modeled correctly, it can be used, along with HTOL test datafrom the early life time span of a specific component, to ensure the customer thatthe specific component will not fail until the end of the modeled high temperatureoperating life time span. This requires an accurate model which needs to be basedon several full life time HTOL tests on components of the same type. The theorybehind this is however beyond the scope of this thesis.
2.2 HTOL Tests on Silicon Carbide Transistors
HTOL tests on silicon carbide transistors is conducted at TranSIC by mountingseveral transistors, connected in series, on a heat sink. Each transistor is connectedto a regulated base-current circuit that makes it possible for a current to flow
3
CHAPTER 2. METHOD
Figure 2.1. Cumulative failure fraction function example (Note that both axes arelogarithmic.). Figure from [6]
through the collector-emitter junction. The entire group of transistors is connectedto a power supply providing a constant large current, as seen in figure 2.2.
I
I
IU
U
CE
CE1
CE2
B1
B2
+
+
Figure 2.2. Shematic for HTOL tests on two silicon carbide transistors.
A large collector-emitter current, along with the UCE voltage drop will give riseto power losses in the form of heat. The silicon carbide transistors manufacturedby TranSIC are of NPN type. A P-N junction is temperature dependent (cf. thediode equation). It is therefore relevant to keep the temperature on a constant levelto reduce the temperature impact on the collector-emitter voltage[13]. Heat sink
4
2.3. LABVIEW
temperature is kept on a constant, high level by a external circuit that regulatesthe speed of cooling fans.
By continually monitoring the UCE voltage and the temperature during extremeconditions, one can estimate how well the transistor will preform during its lifetime.It is also a benefit to be able to provide the customer with data, showing thatthe specific transistors has passed a short HTOL test indicating that the specificcomponent has passed the early life failure timespan.
2.3 LabViewTranSIC requires that the software is built with the use of National InstrumentsLabView (Laboratory Virtual Instrumentation Engineering Workbench). LabViewis a graphical programming environment with support for a wide range of hardware.It has become somewhat of a industry standard for its ease of use and versatility.TranSIC have several licenses and a number of previous tools that has been writtenin LabView. There are several good reasons to use LabView:
• Hardware SupportMost hardware manufacturers ensures LabView compatibility and providesLabView drivers. There is also possibilities to build drivers for non supportedhardware within the LabView framework. [2]
• Ease of useGraphical programming languages is easier to understand by people not fa-miliar to programming and software development. This makes it possible for aengineer, without previous programming experience, to build a measurementsystem in a short amount of time.
• Platform IndependentLabView is available for most versions of Microsoft Windows, Linux and OSx.
Disadvantages
• Platform Dependent Instrument DriversSome instrument drivers can be platform dependent despite LabView com-patibility. One of the reasons is the use of IVI drivers with limited Linux andOSx support. [3]
• Complex Programs Require LabView ExperienceSmall LabView programs can be easily created by almost anyone, however pre-vious LabView experience is required as complexity increases. A programmerwith previous text based programming experience (such as C, Java, Python,etc) needs quite some time to familiarize with to the graphical nature of theprogramming environment.
5
CHAPTER 2. METHOD
• Vendor Lock InClosed source platforms creates a software and, to some extent, a hardwaredependency.
LabView code is called Virtual Instruments (VIs). A VI is created with the useof two different perspectives; the "Front Panel" and the "Block Diagram". A VIs"Front Panel" is what the end user will use as a GUI, when the program is executed.Its "Block Diagram" contains the relations between the different elements, found inthe GUI as well as code related structures and constants.
2.3.1 Example Code
The following examples provide a brief introduction to LabView programming. Thefirst example explains how to make a simple VI that adds the number 1 each secondto a user defined number.
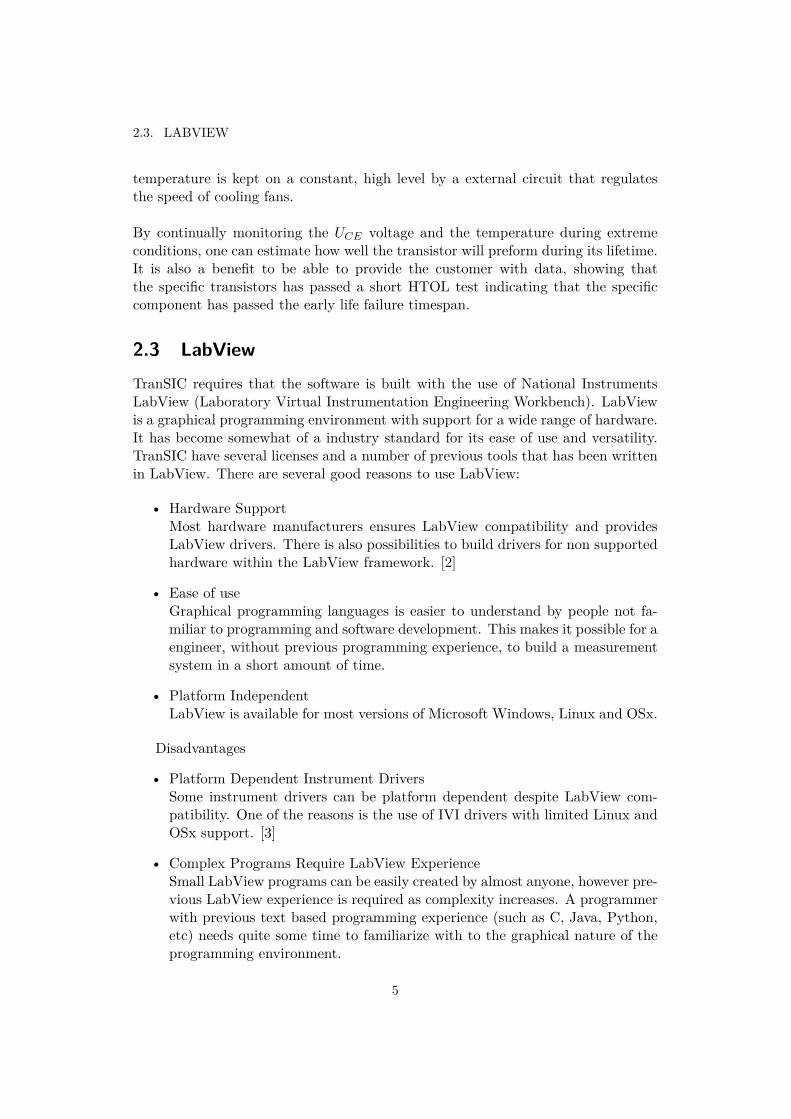
The GUI will contain two objects. One numeric control called "X" and one nu-meric indicator called "Result". The numeric control can, as the name implies, becontrolled by the user. A indicator can however only present data to the user. Thecontrol and the indicator is represented in the "Block Diagram" as well as in the"Front Panel". The first step, as seen in figure 2.3, is to wire the items in the blockdiagram. The figure shows how to add the number 1 to X and present the resultin the "Result" indicator. This program will stop after presenting the value 1+X tothe user.
Figure 2.3. Second counter step 1.
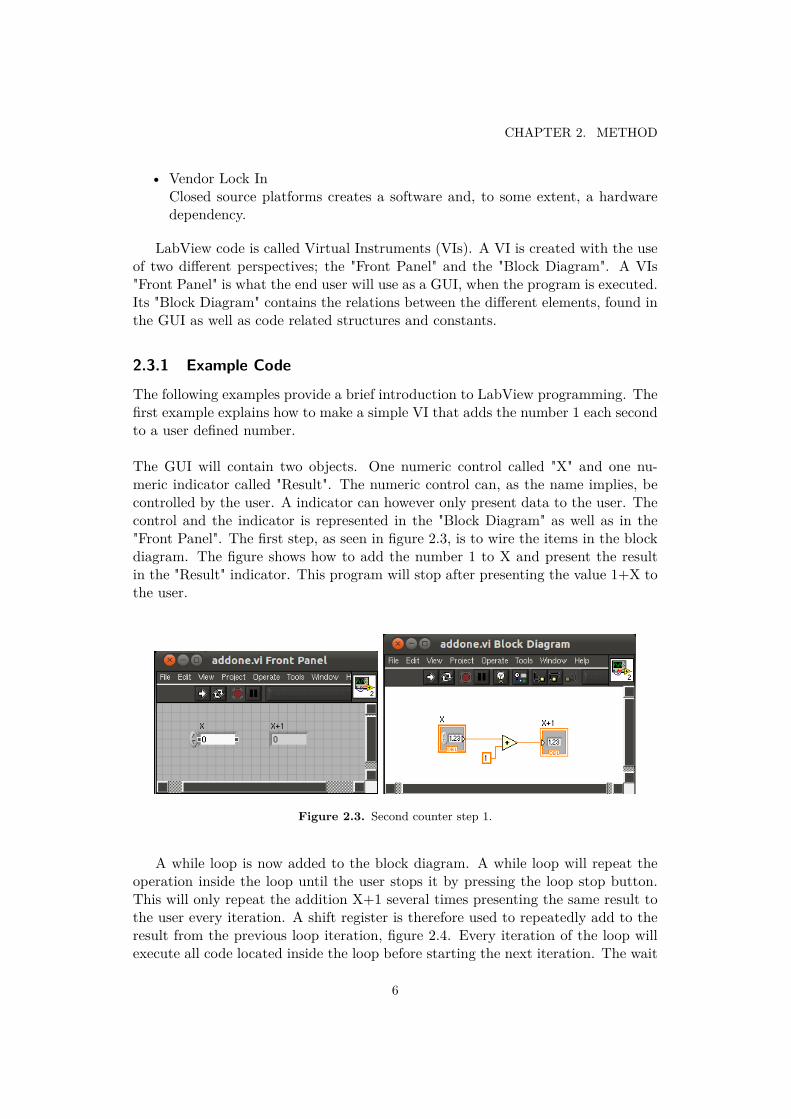
A while loop is now added to the block diagram. A while loop will repeat theoperation inside the loop until the user stops it by pressing the loop stop button.This will only repeat the addition X+1 several times presenting the same result tothe user every iteration. A shift register is therefore used to repeatedly add to theresult from the previous loop iteration, figure 2.4. Every iteration of the loop willexecute all code located inside the loop before starting the next iteration. The wait
6
2.3. LABVIEW
1000ms code is introduced in order to repeat the iteration each second.
Figure 2.4. Second counter step 2.
Change of Data Type
There are several different data types in the LabView programming language. Eachdata type has the same set of versions as the numeric data type; Control, Indicator,Array and Constant.
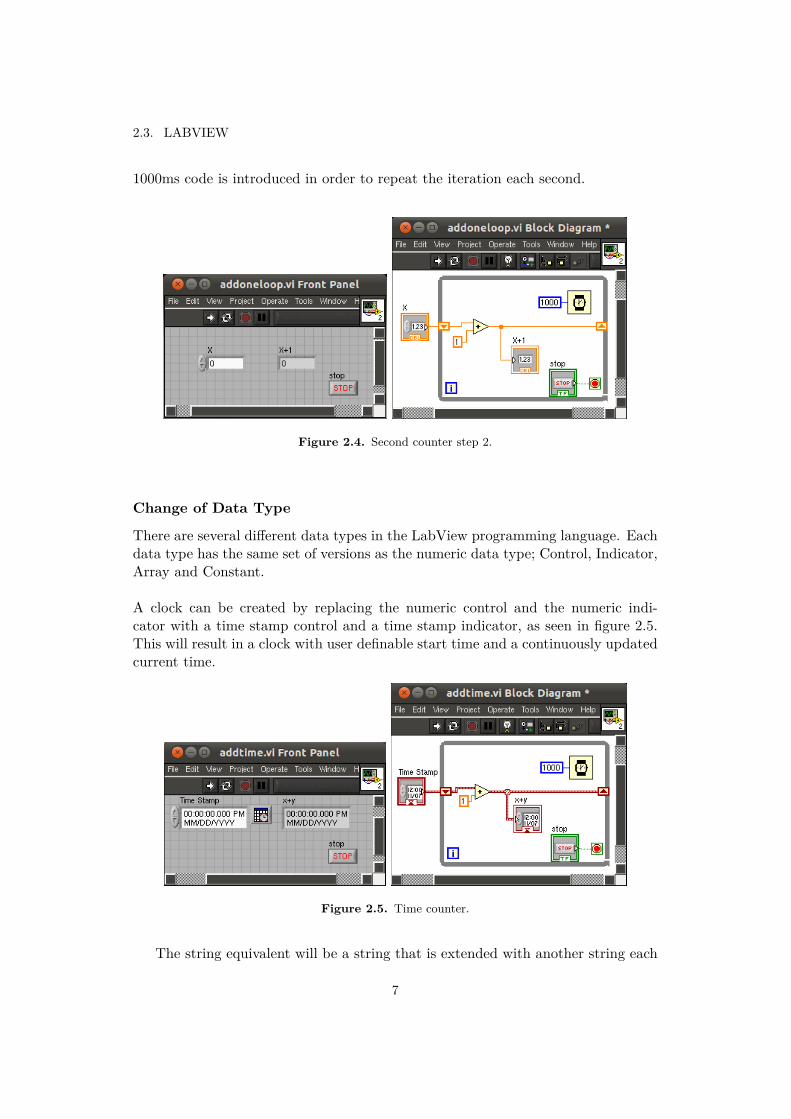
A clock can be created by replacing the numeric control and the numeric indi-cator with a time stamp control and a time stamp indicator, as seen in figure 2.5.This will result in a clock with user definable start time and a continuously updatedcurrent time.
Figure 2.5. Time counter.
The string equivalent will be a string that is extended with another string each
7
CHAPTER 2. METHOD
iteration, resulting in a longer and longer string.
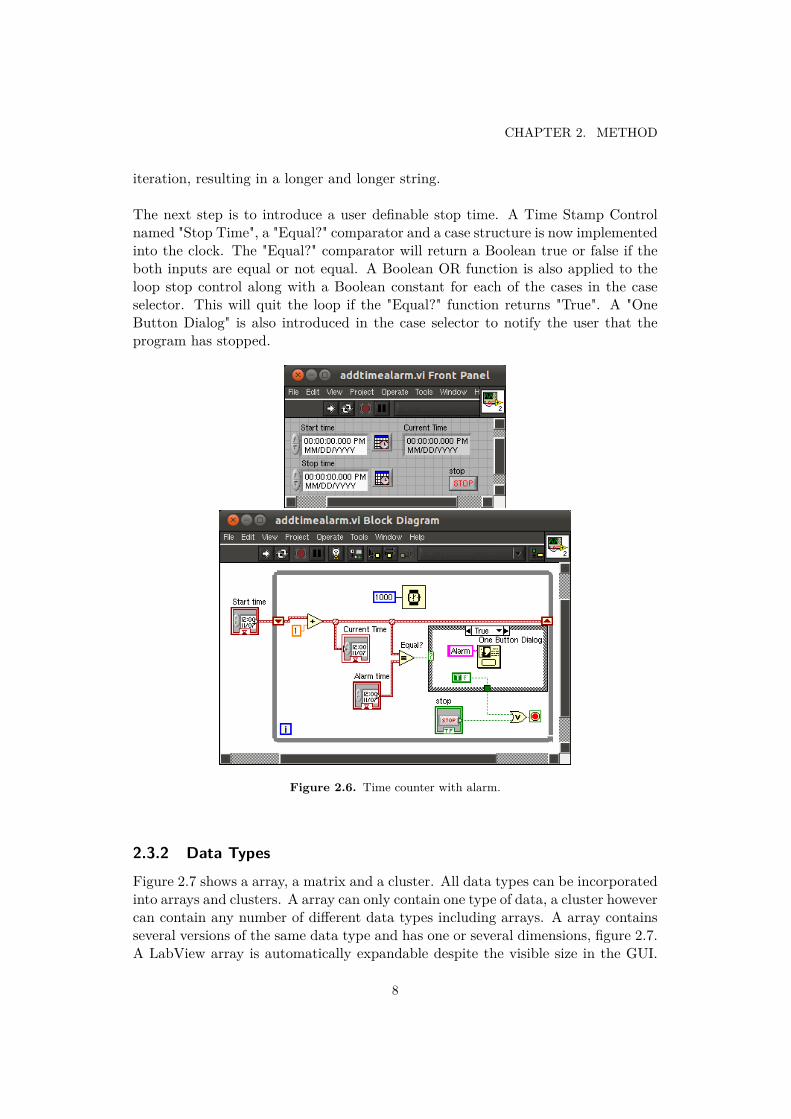
The next step is to introduce a user definable stop time. A Time Stamp Controlnamed "Stop Time", a "Equal?" comparator and a case structure is now implementedinto the clock. The "Equal?" comparator will return a Boolean true or false if theboth inputs are equal or not equal. A Boolean OR function is also applied to theloop stop control along with a Boolean constant for each of the cases in the caseselector. This will quit the loop if the "Equal?" function returns "True". A "OneButton Dialog" is also introduced in the case selector to notify the user that theprogram has stopped.
Figure 2.6. Time counter with alarm.
2.3.2 Data Types
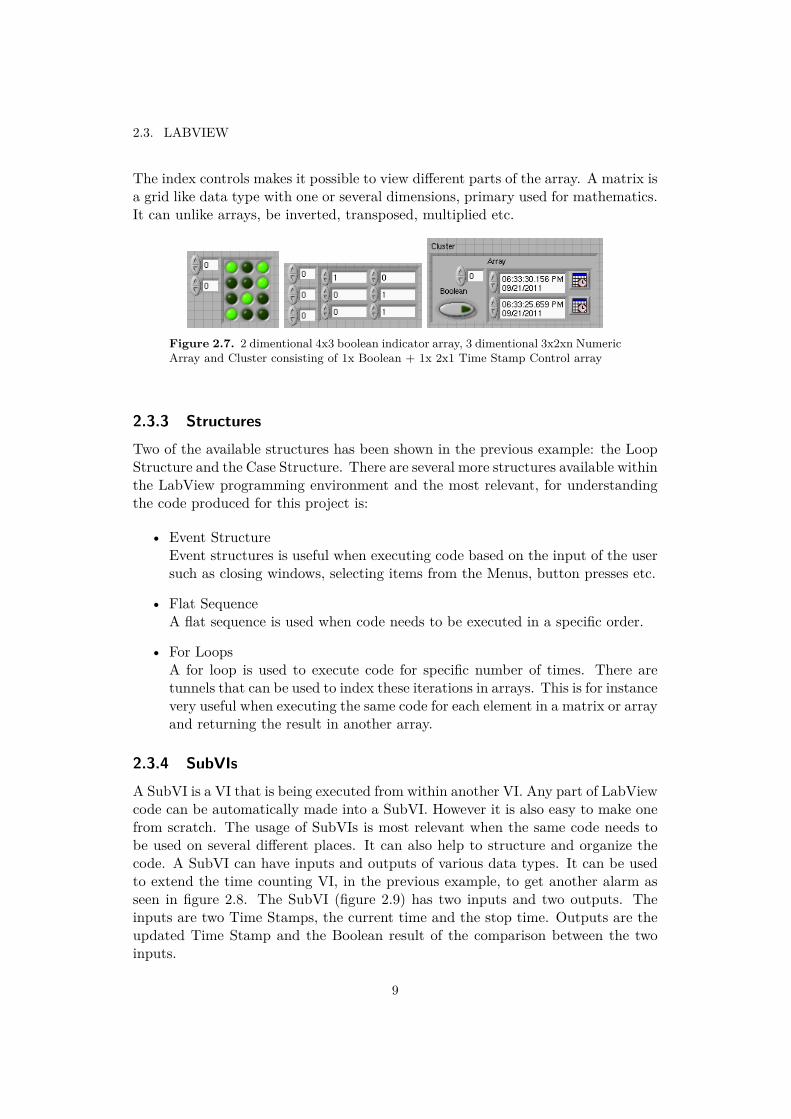
Figure 2.7 shows a array, a matrix and a cluster. All data types can be incorporatedinto arrays and clusters. A array can only contain one type of data, a cluster howevercan contain any number of different data types including arrays. A array containsseveral versions of the same data type and has one or several dimensions, figure 2.7.A LabView array is automatically expandable despite the visible size in the GUI.
8
2.3. LABVIEW
The index controls makes it possible to view different parts of the array. A matrix isa grid like data type with one or several dimensions, primary used for mathematics.It can unlike arrays, be inverted, transposed, multiplied etc.
Figure 2.7. 2 dimentional 4x3 boolean indicator array, 3 dimentional 3x2xn NumericArray and Cluster consisting of 1x Boolean + 1x 2x1 Time Stamp Control array
2.3.3 StructuresTwo of the available structures has been shown in the previous example: the LoopStructure and the Case Structure. There are several more structures available withinthe LabView programming environment and the most relevant, for understandingthe code produced for this project is:
• Event StructureEvent structures is useful when executing code based on the input of the usersuch as closing windows, selecting items from the Menus, button presses etc.
• Flat SequenceA flat sequence is used when code needs to be executed in a specific order.
• For LoopsA for loop is used to execute code for specific number of times. There aretunnels that can be used to index these iterations in arrays. This is for instancevery useful when executing the same code for each element in a matrix or arrayand returning the result in another array.
2.3.4 SubVIsA SubVI is a VI that is being executed from within another VI. Any part of LabViewcode can be automatically made into a SubVI. However it is also easy to make onefrom scratch. The usage of SubVIs is most relevant when the same code needs tobe used on several different places. It can also help to structure and organize thecode. A SubVI can have inputs and outputs of various data types. It can be usedto extend the time counting VI, in the previous example, to get another alarm asseen in figure 2.8. The SubVI (figure 2.9) has two inputs and two outputs. Theinputs are two Time Stamps, the current time and the stop time. Outputs are theupdated Time Stamp and the Boolean result of the comparison between the twoinputs.
9

CHAPTER 2. METHOD
Figure 2.8. A dual alarm VI using a SubVI to add and compare time.
2.3.5 Producer/Consumer Design Pattern (PCDP)
National Instruments provides design patterns that can be used as a base structurewhen programming in LabView. One of those is the "Producer/Consumer designpattern" (PCDP). National Instruments states: "The Producer/Consumer designpattern is based on the Master/Slave pattern, and is geared towards enhanced datasharing between multiple loops running at different rates."[8]. The structure of themost basic version of the PCDP can be seen in figure 2.10.
The basic functionality of the PCDP can be explained with the following exam-ple. Consider a GUI consisting of two buttons; Button A and Button B. A user isto be presented with a dialog box indicating which button that was pressed. Thebase programming structure of the PCDP is based on two while loops and a dataqueue. The first loop, called the producer loop, queues the strings "A" and "B"based on the user events "Button A Value Change" and "Button B Value Change".
10

2.4. MEASUREMENT UNCERTAINTY
Figure 2.9. The SubVI used in the dual alarm VI
Producer Loop
Consumer Loop
Enqueue
Dequeue
Figure 2.10. Producer Consumer Design Pattern
The second loop, called the consumer loop, checks the queue and presents the userwith the corresponding dialog box.
No new events can be handled by the consumer loop as long as the dialog boxis waiting for the user to press OK. This means that the design pattern must beextend in order to multitask as required. The PCDP is not limited to one producerand one consumer loop and the design can therefore be extended to fit the needsfor the HTOL application[8].
2.4 Measurement Uncertainty
Uncertainty calculations is used to determine how accurate measured values reallyare. If the display of a Volt meter shows a measured value of 0.424821 V, it barleymeans that the instrument has determined it to be 0.424821 V with some degree ofuncertainty. The uncertainty of these kind of measurements are often assumed tobe normal distributed. The Guide to the Expression of Uncertainty in Measurement(GUM) recommends usage of standard uncertainties[1]. Standard uncertainties isdefined to be normal distributed within a confidence interval of 68.3% from themeasured value µ. The coverage factor k is used to extend the coverage of theconfidence interval so that the calculated uncertainty has a higher probability toinclude the actual value of the quantity as µ±kσ. k = 1 k = 2 and k = 3 represents aconfidence interval 68.4%, 95.5% and 99.7%. This can be described mathematicallyaccording to equation 2.1[4]:
11

CHAPTER 2. METHOD
x = xm ± k · u(xm) (2.1)Where xm is the measured value of the quantity, k is the coverage factor and
u(xm) is the standard uncertainty of the quantity. Presenting uncertainty data witha coverage factor of k = 2 is common for measuring equipment[4]. This means thatthe actual measured quantity will, with 95.5% probability, be within the range pro-vided by the manufacturer[4]. All serious hardware manufacturers provide standarduncertainty data for common operating conditions. However the amount of detailvaries.
Voltage acquisition uncertainty is, mainly, dependent on: quantisation uncertain-ties, zero level uncertainties, scale uncertainties and linearization uncertainties[5].Many of these uncertainties are dependent on factors such as temperature, gain, off-set, noise and time since last calibration[5]. Some manufacturers provide equationsand data for calculating the standard uncertainty for each small sub uncertaintywhile others only provides a single value. Due note that these dependencies doesnot take system specific parameters into consideration, such as the cable used toconnect the instrument to the source.
A common way for instrument manufacturers to express the uncertainty of theirhardware is by providing data for %reading and %range. The standard uncertaintyof a measurement can now be calculated with the use of the measured value andthe range setting used to measure it. This is done according to equation 2.2[9][7][4]:
k · u(x) = xreading ·%reading
100 + xrange ·%range
100 (2.2)
Where:
• k is assumed to be 2 if no other information is provided.
• xreading is the reading of the measured quantity presented by the equipment.
• %reading is the reading dependent error probability expressed in %.
• xrange is the operating range used to acquire the reading.
• %range is the range dependent error probability expressed in %.
Assume that a voltage is measured with a volt meter and that the display showsa measured voltage of U = 1.2345 V using the 5 V range. The datasheet specifiesthat k = 2, %reading = 0.05 and %range = 0.02. Equation 2.2 makes it possible tocalculate the uncertainty of the measurement as:
2 · u(U) = 1.2345 V · 0.05100 + 5 V · 0.02
100 = 1.6 mV (2.3)
u(U) = 1.6 mV2 = 0.8 mV (2.4)
12
2.4. MEASUREMENT UNCERTAINTY
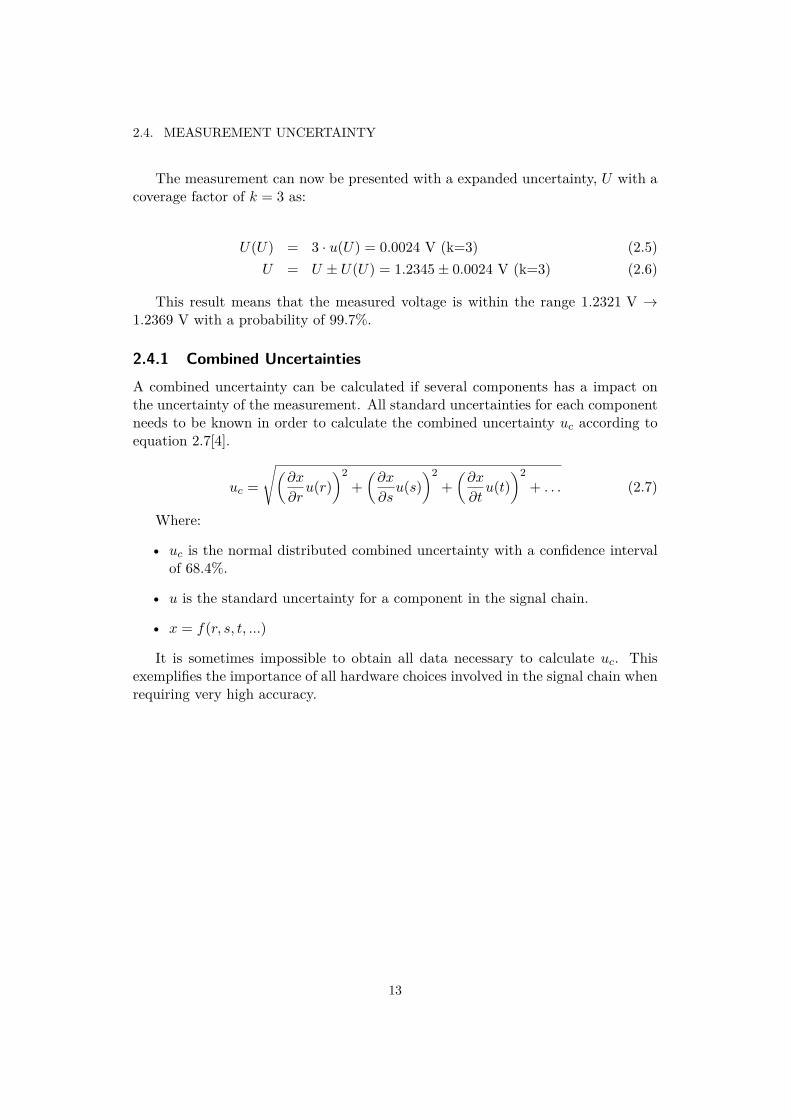
The measurement can now be presented with a expanded uncertainty, U with acoverage factor of k = 3 as:
U(U) = 3 · u(U) = 0.0024 V (k=3) (2.5)U = U ± U(U) = 1.2345± 0.0024 V (k=3) (2.6)
This result means that the measured voltage is within the range 1.2321 V →1.2369 V with a probability of 99.7%.
2.4.1 Combined UncertaintiesA combined uncertainty can be calculated if several components has a impact onthe uncertainty of the measurement. All standard uncertainties for each componentneeds to be known in order to calculate the combined uncertainty uc according toequation 2.7[4].
uc =
√(∂x
∂ru(r)
)2+(∂x
∂su(s)
)2+(∂x
∂tu(t)
)2+ . . . (2.7)
Where:
• uc is the normal distributed combined uncertainty with a confidence intervalof 68.4%.
• u is the standard uncertainty for a component in the signal chain.
• x = f(r, s, t, ...)
It is sometimes impossible to obtain all data necessary to calculate uc. Thisexemplifies the importance of all hardware choices involved in the signal chain whenrequiring very high accuracy.
13


Chapter 3
Problem Definition
There are two types of requirements specified within the scope of this project.Hardware requirements and software requirements.
3.1 Hardware RequirementsThe hardware needed for this project involves the measuring part of a system devel-oped by TranSIC. It consists of a test rig, a base current power supply and a voltagesupply. The test rig can fit 12 transistors and is made up of a large heat sink, afan and circuitry regulating the temperature of the heat sink by controlling the fanspeed. A rack mountable base current supply has been developed to provide correctbase current. TranSIC has used TTi QPX1200 power supplies for other purposesand wish to be able to use the same power supplies for this project as well.
The hardware setup consist of one computer, one data acquisition unit, four basecurrent supplies with emergency stop relays, control circuitry for the emergency stoprelays, four temperature regulated test rigs and four QPX1200 power supplies. Thecomplete system is capable of conducting HTOL tests on a total of 48 transistorsat once.
Data Acquisition Unit Requirements
1. 4x12 voltage and 4x1 temperature inputs = 52 input channels.
2. At least 1/20 S/s sample rate.
3. Each voltage input must be able to withstand a maximum of 60 V withoutbreaking the hardware.
4. At least 10-20 mV measurement precision in the range 0.3 V - 2 V
5. A temperature precision of at least ±3 ◦C.
6. USB communication.
15
CHAPTER 3. PROBLEM DEFINITION
7. LabView compatibility.
8. Reasonable price.
3.2 Software RequirementsThere shall be four individually controllable test setups. Each test setup shall,independently, meet these requirements:
1. Be start and stop-able
2. Have user defined Voltage and Current settings for the QPX1200 power supply.
3. Have user defined sample rates for each group consisting of 6 transistors.
4. Have variable voltage warning and emergency stop levels.
5. Have user definable temperature warning and emergency stop levels
6. Warn the operator when a emergency level is exceeded.
7. Stop ongoing measurement, disable the power supply and base current outputwhen one or several of these criteria are fulfilled:- Emergency voltage limit exceeded.- Emergency temperature limit exceeded.- No current flowing from the power supply.
8. Allow naming of transistors based on serial numbers.
9. Save log data files for each individual transistor named after the serial num-bers.
10. Continue adding measurement data to already existing files if a file with thesame transistor number already exists in the specified folder.
11. Show graphs for any transistor during measurements based on user selection.
12. Fulfill reasonable stability and usability requirements.
16
Chapter 4
Hardware Choice
Hardware was bought and implemented into the system after careful considera-tions. The comparison between two types of hardware and the resulting purchaseis presented in this chapter.
4.1 Measuring Equipment
Two different types of measurement equipment was compared: National InstrumentsCompact DAQ system and Agilent 34972A data logger. Both systems are modularand can be configured to fit TranSICs needs. The choice of these two instrumentsis based on recommendations from National Instruments and Agilent Technologies,two of the biggest hardware manufacturers in the industry.
4.1.1 National Instruments Compact DAQ
National Instruments, the creators of LabView, was contacted and provided, basedon the hardware requirements, a data acquisition solution. The suggested setupis based on the modular National Instruments Compact DAQ (NI cDAQ) system.The suggested system consists of:
• NI cDAQ-9174Chassis for the modular system. Fits four I/O modules and includes a USBinterface.
• NI 9205Analog Input Module with 32 single-ended or 16 differential analog inputswith a range from ±200 mV to ±10 V. Has a 16-Bit resolution at 250 kS/s.
• NI 92114-Ch temperature module with a ±80 mV measuring range a sample rate of14 S/s.
17
CHAPTER 4. HARDWARE CHOICE
• AccessoriesNational Instruments also suggest a large amount of accessories. Some of theseare needed such as an AC adapter and some unnecessary such as a carryingcase and a desktop mount.
Measurement Uncertainty
Uncertainty for voltage and temperature measurements can be calculated accord-ing to the datasheet for each module. The voltage uncertainty can be calculated,for a confidence interval of 99.7% (k = 3), according to equation 4.1[9]. It is aabsolute value version of equation 2.2, extended with noise uncertainty which somemanufacturers include in the gain error and offset error. The datasheet providesthe following equation:
U = Reading ·GainError+Range ·OffsetError+NoiseUncertainty[10] (4.1)
Where:NoiseUncertainty = RandomNoise · 3√
100[10] (4.2)
The uncertainty data is now calculated for the HTOL test conditions at TranSICAB. Measured voltage will vary between 0.3 V and 2 V[13]. The highest uncertaintyduring these test conditions is when the measured voltage is exactly 1 V, measuredin the 1 V range and 2 V, measured in the 5 V range. Results from calculationsaccording to equation 4.1 is presented below:
U(U) = 1 V · 155 ppm + 1 V · 25 ppm + 26 ppm · 3√100
= 0.1878 mV (k = 3) (4.3)
U(U) = 2 V · 135 ppm + 5 V · 20 ppm + 116 ppm · 3√100
= 0.4048 mV (k = 3) (4.4)
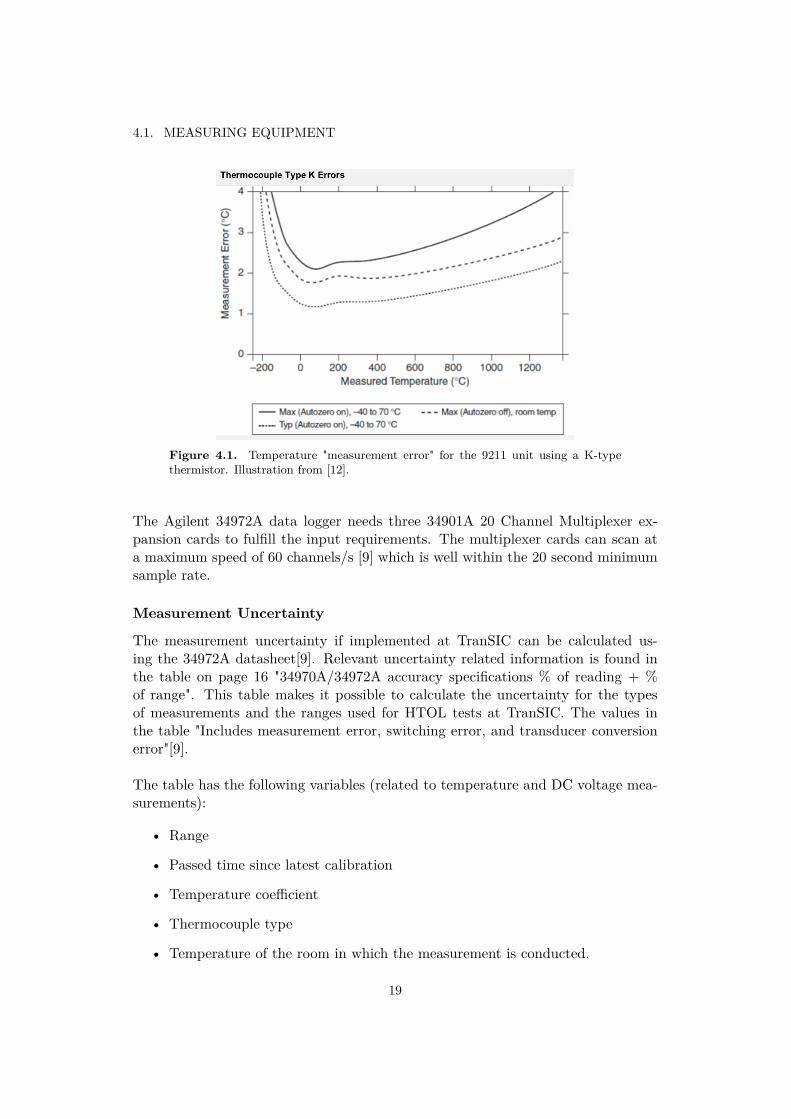
The temperature uncertainty for a K-type thermocouple can be obtained fromthe NI 9211 datasheet. Figure 4.1 shows the 9211 accuracy and does not takethe uncertainty of the thermocouple into consideration[12]. Temperatures duringHTOL tests vary between 25 ◦C and 260 ◦C depending on transistor type. Themeasurement accuracy can, from figure 4.1, be determined to be approximatly u =1.3 ◦C (k = 3).
4.1.2 Agilent Technologies 34972A Data LoggerThe use of a data logger is a different approach. Wile the NI cDAQ can measureall inputs at once, the data logger is only capable of measuring one input at a time.The data logger of choice is Agilent 34972A due to its well known accuracy, USBcommunication abilities and expansion card slots.
18
4.1. MEASURING EQUIPMENT
Figure 4.1. Temperature "measurement error" for the 9211 unit using a K-typethermistor. Illustration from [12].
The Agilent 34972A data logger needs three 34901A 20 Channel Multiplexer ex-pansion cards to fulfill the input requirements. The multiplexer cards can scan ata maximum speed of 60 channels/s [9] which is well within the 20 second minimumsample rate.
Measurement Uncertainty
The measurement uncertainty if implemented at TranSIC can be calculated us-ing the 34972A datasheet[9]. Relevant uncertainty related information is found inthe table on page 16 "34970A/34972A accuracy specifications % of reading + %of range". This table makes it possible to calculate the uncertainty for the typesof measurements and the ranges used for HTOL tests at TranSIC. The values inthe table "Includes measurement error, switching error, and transducer conversionerror"[9].
The table has the following variables (related to temperature and DC voltage mea-surements):
• Range
• Passed time since latest calibration
• Temperature coefficient
• Thermocouple type
• Temperature of the room in which the measurement is conducted.
19
CHAPTER 4. HARDWARE CHOICE
Temperature and DC-voltage uncertainty is relevant information when conduct-ing HTOL tests. Voltage uncertainty can be calculated according to equation 4.5[9]which is a version of equation 2.2 but with extracted temperature dependencies:
U(U) = Ureading
(%reading
100 + %readingtemp
100
)+Urange
(%range
100 + %rangetemp
100
)(k=3)(4.5)
Where Ureading and Urange is the measured voltage and the range when measur-ing that voltage. %reading and %range is the voltage error percentage, provided bythe manufacturer. %readtemp and %rangetemp is the range dependent temperatureuncertainty percentage.
In further calculations it is assumed that TranSIC has the longest calibration cycleavailable in the table, one year. The UCE voltage varies between 0.3 V and 2 Vwhich results in two worst case scenarios. When measuring 1 V in the 1V rangeand when measuring 2 V in the 10 V range. Room temperature is assumed to staywithin the range 23 ◦C ±5 ◦C and results in %readingtemp = %rangetemp = 0 [9].
For for the 1 V DC range the following data can be found: ± (0.0040% of reading+ 0.0007% of range) and ± (0.0035% or reading + 0.0005% of range) for the 10 Vrange. This data is inserted into the simplified version of equation 4.5:
U(U) = Ureading%reading
100 + Urange%range
100 (4.6)
U(1) = 1 V 0.0040100 + 1 V 0.0007
100 = 0.047 mV (k = 3) (4.7)
U(2) = 2 V 0.0035100 + 10 V 0.0005
100 = 0.12 mV (k = 3) (4.8)
The hardware related temperature accuracy can be found in the same table. Aone year calibration cycle and a K-type thermocouple element results in a hardwareaccuracy of U(T ) = 1 ◦C (k=3). Due note that this does not take the inaccuracyof the thermocouple into consideration.
4.1.3 Comparrison
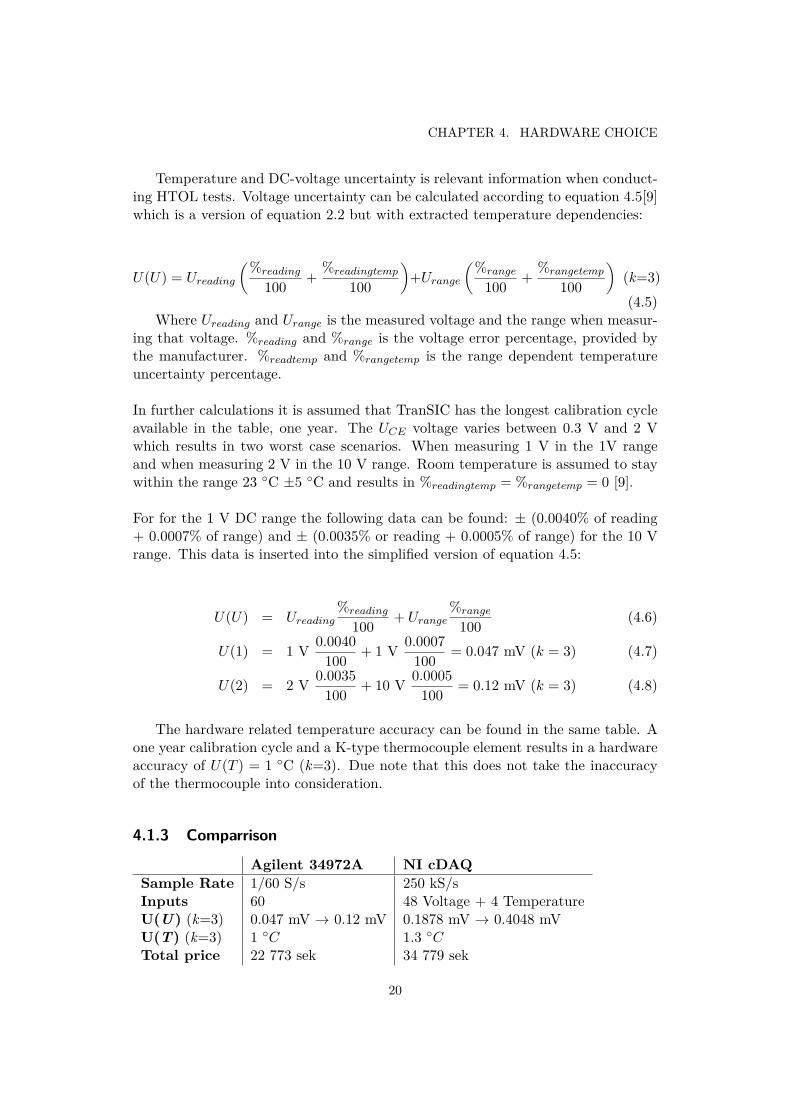
Agilent 34972A NI cDAQSample Rate 1/60 S/s 250 kS/sInputs 60 48 Voltage + 4 TemperatureU(U ) (k=3) 0.047 mV → 0.12 mV 0.1878 mV → 0.4048 mVU(T) (k=3) 1 ◦C 1.3 ◦CTotal price 22 773 sek 34 779 sek
20
4.2. BASE CURRENT SUPPLY CONTROL
4.1.4 Hardware ChoiceThe Agilent 34972A data logger was purchased and incorporated into the HTOLtest system due to the following reasons:
• Sufficient sample rateThe NI cDAQ system has a far superior sample rate compared to the Agi-lent 34972A. This higher sample rate is however unnecessary for the intendedapplication at TranSIC. Logging data faster than once every 20 seconds willresult in a unnecessary amount of data when running tests for several thousandhours.
• Lower priceThe lower price of the Agilent 34972A is a definite selling point.
• Lower UncertaintyAgilent 34972A has lower temperature and voltage uncertainty. The voltageuncertainty is far better than the requirements on both hardware but thetemperature uncertainty is important and favors the Agilent 34972A.
4.2 Base Current Supply ControlThe hardware requirements specify that the system should stop any setup that hasexceeded an emergency level. This prevents transistors from being destroyed com-pleatly after failing, making it possible to find out why the failure occurred. TheQPX1200 power supplies is controllable from LabView, however the base currentsupplies are not. The circuits that generate the base currents can not be controlledfrom a computer due to the lack of remote control functionality. A solution to thisproblem is a relay, connected to the internal power supply of each Base CurrentSupply. The relays are connected so that the power supply to the Base CurrentSupplies can be cut by closing a switch. These switches needs to be controllablefrom LabView using the USB bus.
A NI USB-6525 with 8 solid-state relays was purchased and incorporated in thesystem.
21


Chapter 5
Software Design
All HTOL test software was designed using LabView 10 on a Windows XP basedPC on-site at TranSIC AB in Kista.
5.1 Main VI
The software needs to be able to handle user events, the measuring process andthe produced measurement data independently of each other. All these processesare running at different speeds and it is not acceptable for some processes to bedependent on any other. The measuring process should not be paused when, forinstance, a certain window is opened, or for the GUI to be delayed by the mea-surement process. National Instruments recommends usage of their pre-made "Pro-ducer/Consumer Design Pattern (PCDP)" for these type of program[8].
The main VI is the base of the application. It contains the main GUI consist-ing of buttons, menus and indicators incorporated in a PCDP. It needs to be ableto queue all user events as well as execute three events at the same time. These are:displaying windows and handle the related data, collect measurement data and savethe measured data. The PCDP was therefore extend with two more loops. Oneproducer loop that conducts the measuring process and one consumer loop thathandles the queued measurement data as seen in figure 5.1.
The Main VI thus contains four loops: the Main Producer Loop (MPL), the MainConsumer Loop (MCL), the Measurement Loop (ML) and the Data Consumer Loop(DCL). A drawback with the PCDP, when structured like above, is that the soft-ware can’t handle several menu windows at once. This occurs because the windowedsubVI keeps the main consumer loop busy while it is opened. However it is not con-sidered necessary to, for instance, be able to configure settings for several setupsat once. The only occurrence where this limitation can be a problem is if the userwish to launch two, or more, graph windows at the same time.
23

CHAPTER 5. SOFTWARE DESIGN
Main Producer Loop
Main Consumer Loop
En
qu
eu
eD
eq
ueu
e
Measurement Loop
Data Consumer Loop
Figure 5.1. Extended Producer Consumer Design Pattern
5.1.1 GUI
"HTOL Tester main.vi" front panel contains all necessary menus, controls and indi-cators for running HTOL tests. It is used as a base to start Menu SubVIs such asthe Hardware Configuration or settings windows. There are four versions of eachset of indicators and controls in the GUI, one for each of the four setups as seen infigure 5.2.
Figure 5.2. GUI of HTOL Tester Main.vi at runtime
Each setup has a GUI consisting of 12 spaces, one for each transistor in thesetup. Each space contains the serial number of the connected transistor, the
24
5.1. MAIN VI
last measured collector-emitter voltage of that transistor and a three colored LED(Green/Yellow/Red) that indicates if a warning or emergency stop level has beenpassed as seen in figure 5.3.
GUI Design
Each setup has a total of 16 indicators and buttons that are used in the blockdiagram. Those are, in order from the bottom to the top:
• 1 x Transistor Number ArrayThe main base of each setup is a 6x2 numeric indicator array. It contains theframe and has been modified to add extra space for other indicators.
• Warning LED arrayAbove the transistor number is a similar 6x2 Boolean indicator array designedto fit at the bottom of each transistor number frame. The warning led hastwo colors: False = Dark green and True = Yellow. The yellow color indicatesthat a warning level has been passed.
• Emergency LED arrayOn top of the Warning LED array is a similar emergency LED array. Thecolors are False = Transparent and True = Red. The totally transparent Falsestate makes it possible to see the warning indicator resulting in a three coloredLED, a functionality not existing in LabView.
• 2 x Voltage Data ArraysBeneath each transistor number is the numerical indicators for the last mea-sured voltage data. It is divided into two columns due to the possibility tohave different sample rates on the right and the left side of the setup. Theseindicators are modified to have a transparent background, making it possibleto see the transistor numbers and LEDs behind it.
• 1 x graph button arrayOn the very top of the transistor indicator stack is a invisible 6x2 Booleanbutton array that is used to activate the graphs for each individual transistor.Each element has two states (true/false) where only the true state is visibleto the user. This button grid overlaps the frames in the GUI separating thetransistors. A user can click anywhere inside a frame to display the graphwindow related to that transistor.
• 2 x temperature warning/emergency LEDsSimilar both color- and function-wise to the voltage-related LEDs.
• 1 x Temp indicatorNumeric indicator with a transparent background that shows the last mea-sured heat-sink temperature for the setup.
25

CHAPTER 5. SOFTWARE DESIGN
• 2 x QPX indicatorsTwo numeric indicators with transparent background that shows the voltageand current provided by the QPX1200 power supply at the time of the lastmeasurement.
• 1 x Start time indicatorShows the time and date when the last measurement was started.
• 4 x ButtonsButtons for starting a measurement, entering the "setup" and "register" SubVIsas well as resetting the LEDS and the base current supply.
Transistor SerialNumber
Collector-EmitterVoltage
Voltage Warning &Emergency LED
Setup NumberHeatsink TemperatureTemperature Warning& Emergency LED
QPX Voltage
QPX Current
Measurement Start Time
Launch Settings Window
Launch Register Window
Reset indicator LEDs andbase current supplyStart/Stop Measurement
Invisible GraphButton Array
Figure 5.3. GUI of HTOL Tester Main.vi at runtime
5.1.2 The Main Producer LoopThe Main Producer Loop handles all user related events, enqueues the correspondingclusters, present a small amount of dialog windows and executes minor event relatedcode. The user events are:
• Pressed buttonsSuch as the Start, Register and Reset button value changes.
• Run-time menu selectionsSuch as opening advanced settings and reentering the hardware configurationmenu.
• Press of the "X" button in the top right corner of the main window. I.e. closingthe main window.
26

5.1. MAIN VI
5.1.3 Main Consumer LoopThe main consumer loop handles the execution of all enqued user events from theMain Producer Loop. It also enqueues the command for measurement start, han-dled by the measurement loop.
The Consumer Loop handles these enqueued elements:
"Configure Hardware"
Displays the Hardware Configuration menu, appends the instrument handles to thesettings clusters and enables the settings buttons. It also enqueues the "Initialize"command.
"Initialize"
Initializes the configured hardware and activates the indicator LEDs as well as thereset buttons for the active setups.
"Advanced Preferences"
Makes it possible for the user to customize the input channels for the data logger.Can be extended for further settings such as selection of thermocouple type.
"Settings"
Displays the settings menu and applies the changes to the corresponding settingsclusters. It also enqueues the "Sample rate change" cluster.
"Register"
Displays the register menu and applies the changes to the corresponding registerclusters.
"Sample rate change"
Updates the timehandle VI with new sample rates as configured in the settingsmenu.
"Start and stop"
Enables or disables the QPX1200 power supply assosiated with the setup whwerethe Start button was pressed.
"Graph"
Displays the graph window for the corresponding transistor.
27

CHAPTER 5. SOFTWARE DESIGN
"closehw"
De-initializes all hardware handles. Is used before configuring new hardware or priorto the "exit" command, ensuring that all hardware handles are properly closed.
"exit"
Stops the loop.
5.1.4 Measurement Data Producer Loop
The MDP’s only purpose is to periodically communicate with the data logger sothat it measures the proper channels at the proper times. It enqueues this datatogether with information regarding when the measurement was conducted aftereach iteration of the loop, assuming that at least one of the setups has been set tostart measuring.
5.1.5 Data Consumer Loop
The DCL handles the measured data, enqueued by the MDL. It updates the indi-cators in the GUI based on the data and saves it to the proper files in the properformat. The data is also compared to the emergency stop levels and stops thecorresponding setup as soon as possible and present the user with a dialog widowexplaining what caused the stop.
5.1.6 PCDP Queue
A queue in LabView can contain any data type. The queue used in the main VIconsists of a a cluster containing a string and a numeric array. This makes it possi-ble to use one single queue for all events in the program. The string is always usedas command to other loops and the numeric array can sometimes be empty, givefurther information regarding the user event or contain measurement data.
The following strings and arrays are bundled and enqueued by the specified loopsin the main VI:
28

5.1. MAIN VI
Queued by Event String ArrayMPL Settings value changed Settings Setup number
Register value changed Register Setup numberGraph value changed Graph Setup numberSTART value changed start and stop Button statesMenu: Advanced Prefs Advanced Preferences emptyMenu: Hardware Config closehw Exit noMenu: Exit closehw Exit: YesPanel close? closehw Exit: YesRe-enqueue on exit exit empty
MCL Initiate measuring measure emptyclosehw exit: no Configure Harware emptyclosehw exit: yes exit emptyHardware Config changed initialize emptySample rate settings changed Sample rate change empty
ML New data acquired data Measured dataRe-enqueue on exit exit empty
5.1.7 Clusters and Controls
Several different clusters and controls are used in the Main VI to handle relevantrun-time data. The most important are:
• "Settings data X" ClusterThere are four settings clusters in the Main VI, one for each setup. Theseclusters contain the data configured in the settings menus and is constantlyreferred to through out the program. Each settings cluster contain one direc-tory, eight numeric controls and one QPX1200 instrument handle.
• "Register data X" ClusterSimilar to the settings clusters there are also four register clusters. Thesecontain one numeric array with all transistor numbers configured by the user inthe register menu. It also contains a second "Time passed" numeric array thatkeeps track on how long time (in seconds) each transistor has been measuredbefore the last measurement was started.
• "Voltage in X" ControlNumeric array containing the voltage input channels for each setup. Thesearrays are referred to when writing, sorting and reading voltage data enqueuedby the measurement loop.
• "Temperature in" ControlNumeric array containing the temperature input channel for each setup. Thesearrays are referred to when writing, sorting and reading temperature dataenqueued by the measurement loop.
29
CHAPTER 5. SOFTWARE DESIGN
• "Channel Lists" ClusterIs built from the "Voltage in" and "Temperature in" arrays and contains fourvoltage related and four temperature related input channel names in stringformat. It uses the same formatting as the data logger driver requires whenmeasuring temperature and voltage on several channels.
• "HW ports" ClusterCluster containing all instrument handles as configured by the user at startup. Used when configuring the hardware handles.
• "Enabled Setups" ControlA Boolean array indicating which setups that are enabled by the user.
• "Measure Control" ClusterCluster containing Boolean START button positions and start times for eachsetup. This cluster is updated each iteration of the Measurement Data Pro-ducer Loop in order to have access to a snapshot of the button positions eachiteration.
• "Busy" ControlBoolean control indicating if a measurement is being conducted. This makesit possible to wait before a measurement is complete before making changesthat can have a impact on the measurement.
5.2 Windowed SubVIs
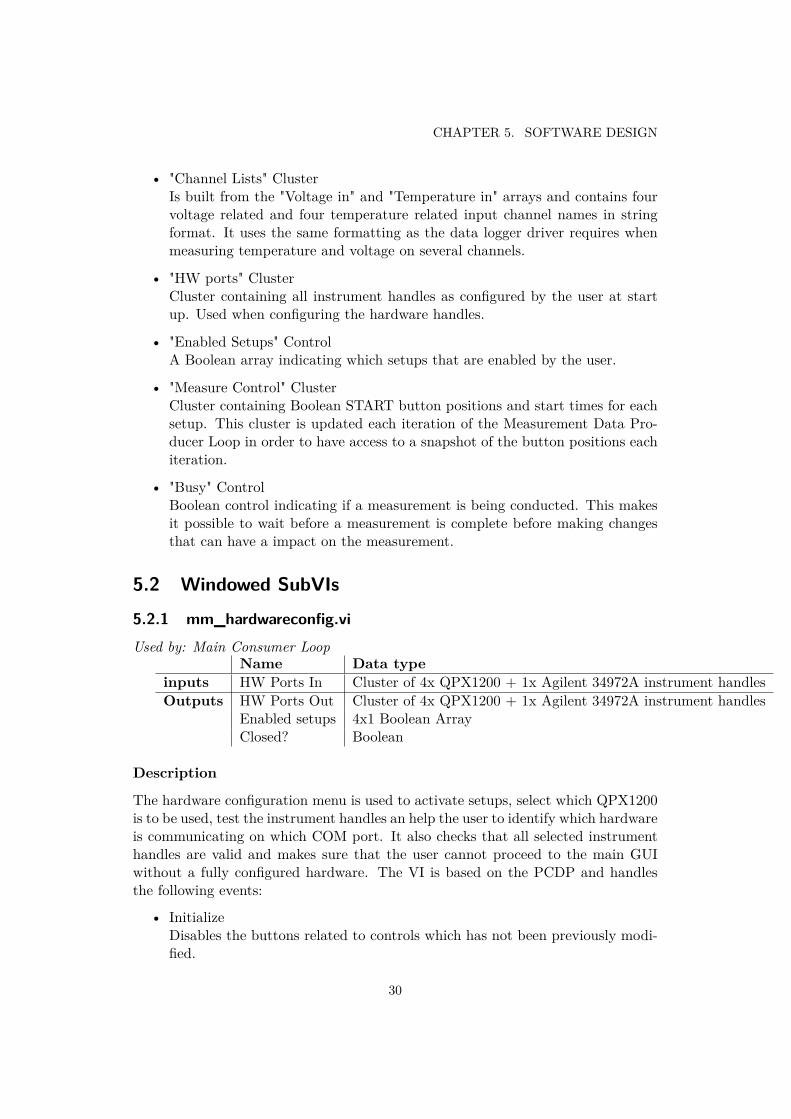
5.2.1 mm_hardwareconfig.viUsed by: Main Consumer Loop
Name Data typeinputs HW Ports In Cluster of 4x QPX1200 + 1x Agilent 34972A instrument handlesOutputs HW Ports Out Cluster of 4x QPX1200 + 1x Agilent 34972A instrument handles
Enabled setups 4x1 Boolean ArrayClosed? Boolean
Description
The hardware configuration menu is used to activate setups, select which QPX1200is to be used, test the instrument handles an help the user to identify which hardwareis communicating on which COM port. It also checks that all selected instrumenthandles are valid and makes sure that the user cannot proceed to the main GUIwithout a fully configured hardware. The VI is based on the PCDP and handlesthe following events:
• InitializeDisables the buttons related to controls which has not been previously modi-fied.
30

5.2. WINDOWED SUBVIS
Figure 5.4. Run time GUI of mm_hardwareconfig.vi with four active setups andapproved instrument handles.
• Test QPX #Tests the user selected instrument handle for setup #. The "Show" button willbe activated, along with the green OK led, if there is no error after openingand closing the selected handle.
• Test Logger #Works the same way as "Test QPX #" but is used for the Agilent 34972Ainstrument handle.
• Show QPX #Makes it posible to see which QPX unit that is communicated with using theselected instrument handle. It does this by alternating between the settings1.234V OA and 0V 1.234A with a one second interval. These settings areshown on the front display of the QPX related to that instrument handle.
• Test RelayRuns a communication test with the NI USB 6525 relay controller.
• OKQuits the consumer loop.
Example usage
The initialize command is enqueued as soon as the VI is started. It disables the"ShoW" and instrument handle selector along with the OK led, for all setups with
31
CHAPTER 5. SOFTWARE DESIGN
empty instrument handles. This VI is the first dialog to appear when launchingthe software and will therefore be empty at launch time but contain the previousinstrument handles when launched again from the run time menu. All selectors areinitially "Disabled and Grayed Out" and remains so until the corresponding checkboxis checked. This enables the LED and the instrument handle selector for the setup.A validity check is initialized as soon as the user has selected a instrument handle.The OK LED will be lit and the "Show" button will be activated for that setup. Theuser can now see what QPX has been approved and change the instrument handleof necessary. If so, the led will be set False until the new handle is considered valid.The same procedure is used for the data handler selection for the data logger. Apress on the "Test" button for the switch unit will test the communication and setthe corresponding LED true if valid. A press of the OK button will start a check ofthe hardware configuration. The following criteria must be met in order to continuefurther:
• All active setups, the switch unit and the data logger must be successfullyvalidated (i.e. all OK LEDS must be lit)
• None of the active setups can have the same instrument handle.
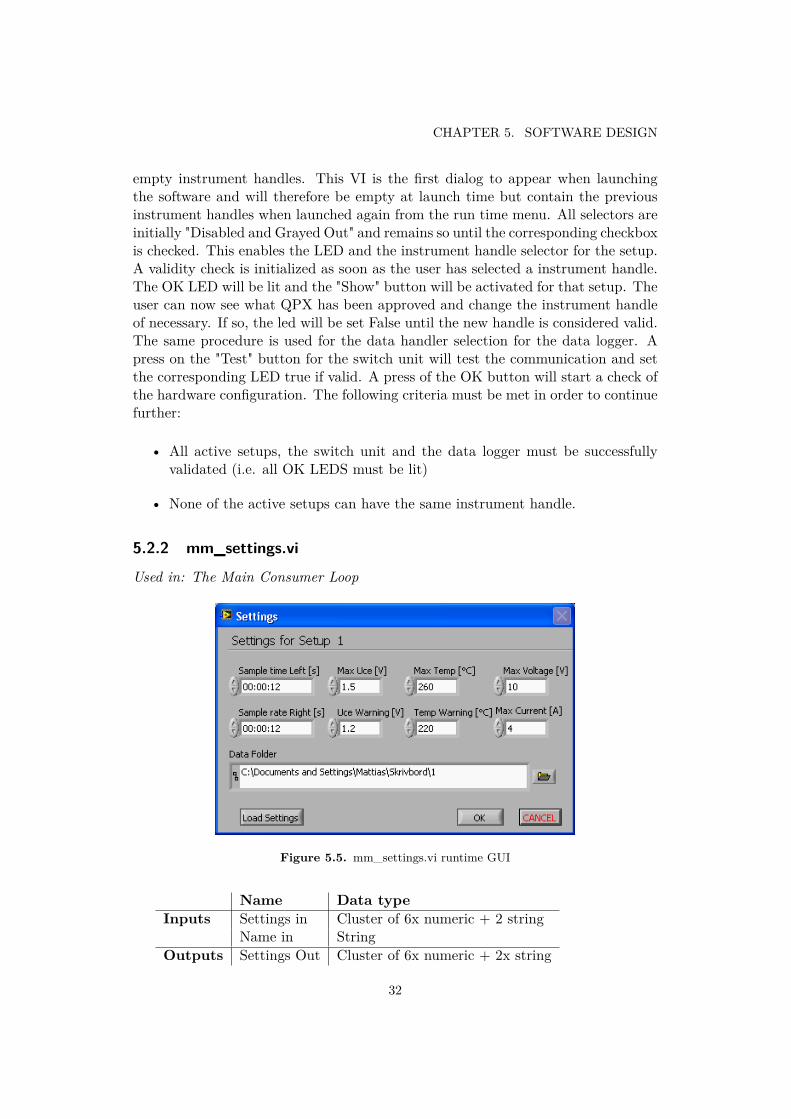
5.2.2 mm_settings.vi
Used in: The Main Consumer Loop
Figure 5.5. mm_settings.vi runtime GUI
Name Data typeInputs Settings in Cluster of 6x numeric + 2 string
Name in StringOutputs Settings Out Cluster of 6x numeric + 2x string
32
5.2. WINDOWED SUBVIS
Description
The settings VI is based on a simple 2 loop PCDP. It handles three user eventsbased on the "Value Change" of the three buttons in the GUI: "OK", "Cancel" and"Load Settings" as seen in figure 5.5. The consumer loop also handles one additionalqueued element called "Initialize" which applies the previous settings to the numericcontrols in the GUI.
Example usage
The "initialize" command is enqueued as soon as the VI is launched. This loads thenumeric controls and the path with the values from the "settings in" cluster. A pressof the "Load Settings" displays a dialog box for the user to select an existing settingsfile. The loaded settings are then applied to the numeric controls by replacing the"Settings In" cluster and enqueueing the "initialize" command once more. Changescan now be made to the loaded settings. They will be saved to the same file afterthe press of "ok" and the window will then be closed.
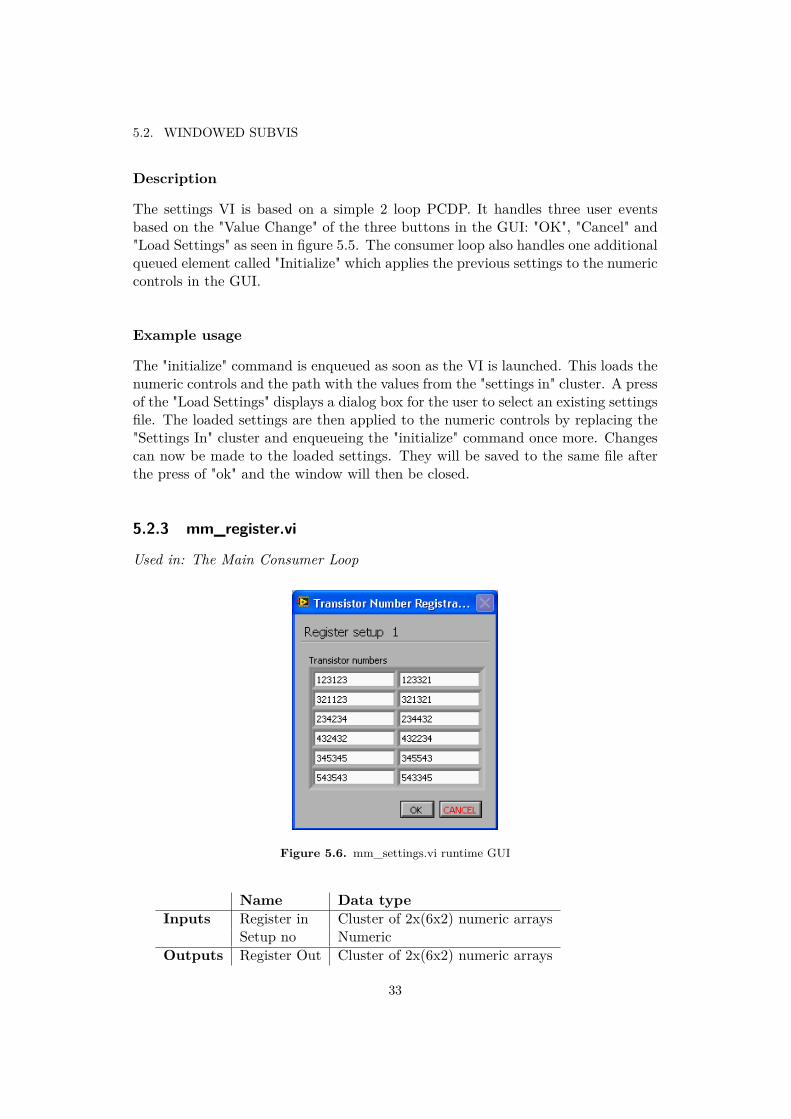
5.2.3 mm_register.vi
Used in: The Main Consumer Loop
Figure 5.6. mm_settings.vi runtime GUI
Name Data typeInputs Register in Cluster of 2x(6x2) numeric arrays
Setup no NumericOutputs Register Out Cluster of 2x(6x2) numeric arrays
33

CHAPTER 5. SOFTWARE DESIGN
Description
The register VI is based on a single while loop with an included user event structure.That handles three user events:
• "OK" value change?Checks if any doubles exists in the register array.
• "Cancel" value change?Ignores the current register array and sets the original input register clusteras the output register cluster.
• Panel CloseIgnores the current register array and sets the original input register clusteras the output register cluster.
Example usage
The user fills the array with serial numbers on the corresponding position wherethe transistor is placed on the test rig.
5.2.4 mm_graph.vi
Used in: The Main Consumer Loop
Figure 5.7. mm_graph.vi runtime GUI
34
5.2. WINDOWED SUBVIS
Name Data typeInputs Settings in Cluster of 6x numeric + 2 string
Transistor noumber NumericOutputs Settings out Cluster of 6x numeric + 2 string
Changed? Boolean
Description
The graph VI is based on a single while loop, continuously loading new data fromthe file, with the transistor number name, in the folder specified in the settings incluster. The loading process is handled by a "Load from spreadsheet file" VI includedin LabView. It returns a numeric array containing all data in the measurement file.Three columns are extracted from the array representing time in seconds, collector-emitter voltage and temperature. The voltage and temperature data is indexedand bundled into two clusters. Four more clusters representing the warning andemergency stop levels are also bundled into clusters along with the time array.Clusters that is to be presented in each graph is thereafter merged into a clusterarray witch is then sent to the XY-plot function, presenting the data to the user.Zoom, trace and export functions is included into the xy-graph VI.
Example usage
The graphs are continuously updated when the graph window is first launched. Thereloading process can however be stopped by pressing the reload/static button. Itwill at the same time remove graphics previously hiding trace and scale buttonsunderneath the graphs. This makes it possible to re-size, trace and export graphs.
5.2.5 mm_advancedpreferences.vi
Used in: The Main Consumer LoopName Data type
Outputs Channels Out Cluster of 5x numeric array
Description
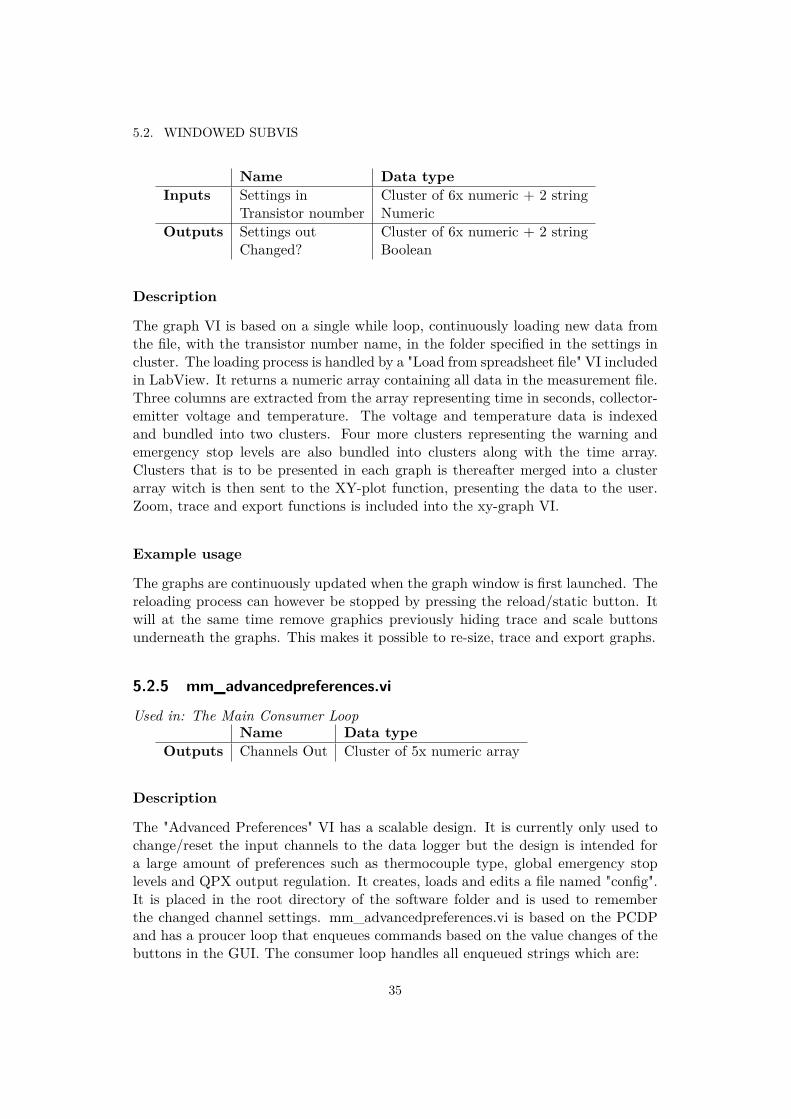
The "Advanced Preferences" VI has a scalable design. It is currently only used tochange/reset the input channels to the data logger but the design is intended fora large amount of preferences such as thermocouple type, global emergency stoplevels and QPX output regulation. It creates, loads and edits a file named "config".It is placed in the root directory of the software folder and is used to rememberthe changed channel settings. mm_advancedpreferences.vi is based on the PCDPand has a proucer loop that enqueues commands based on the value changes of thebuttons in the GUI. The consumer loop handles all enqueued strings which are:
35
CHAPTER 5. SOFTWARE DESIGN
Figure 5.8. mm_advancedpreferences.vi runtime GUI
• "init"Loads the "config" file and appends the data to the numeric controls in theGUI. It creates a "config" file with default channels if no file exists.
• "reset"Loads the default input channels from the "Default Channels" cluster andappend the results to the numeric controls in the GUI.
• "ok"Saves the current state of the numeric controls to the "config" file, applies itto the "Channels Out" cluster and quits the loop.
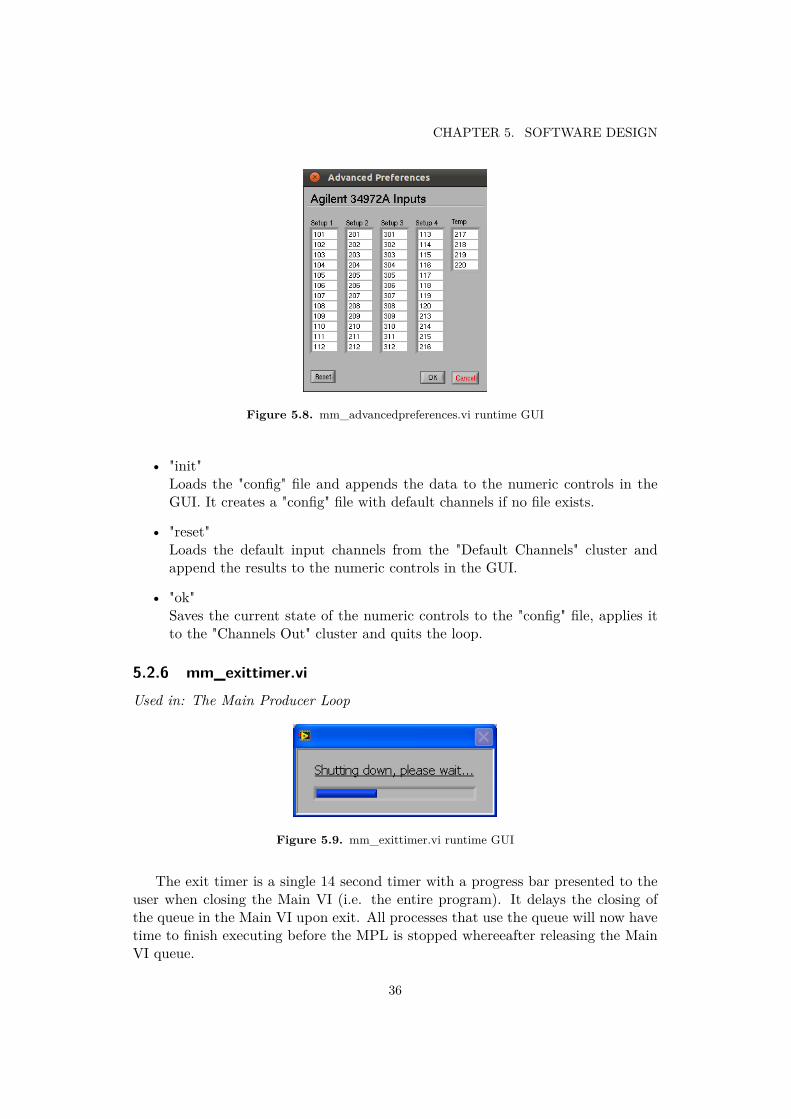
5.2.6 mm_exittimer.viUsed in: The Main Producer Loop
Figure 5.9. mm_exittimer.vi runtime GUI
The exit timer is a single 14 second timer with a progress bar presented to theuser when closing the Main VI (i.e. the entire program). It delays the closing ofthe queue in the Main VI upon exit. All processes that use the queue will now havetime to finish executing before the MPL is stopped whereeafter releasing the MainVI queue.
36

5.3. FUNCTIONALITY SUBVIS
mm_exittimer.vi is based on a single shift register while loop with a counter and acomparator. The code is very similar to the alarm clock example in section 2.3.
5.2.7 mm_about.vi
Used in: The Main Producer Loop
Figure 5.10. mm_about.vi runtime GUI
The about window containins software version and general information. It isbased on a single while loop that is stopped by the press of the "OK" button.
5.3 Functionality SubVIs
Presented below are the most important SubVIs, without a GUI, that is usedthroughout the HTOL tester software.
5.3.1 mm_timehandle.vi
Used in: Consumer Loop, Measure Loop and Data Loop
Name Data typeInputs START in 4x1 Boolean cluster
Sample rates 8x1 numeric arrayCommand StringEnabled setups 4x1 Boolean arraySetup no. Numeric
Outputs Sample rates 8x1 numeric arrayMin Value NumericMeasure? BooleanTo be saved 2x1 Boolean array
37

CHAPTER 5. SOFTWARE DESIGN
Description
The timehandle VI is used to keep track of timing for measuring and saving themeasured data. It is based on a single while loop with shift registers and a caseselector. The timing is based on normalized sample rates and keeps track on whento measure what each 12 second measurement cycle.
The case selector accepts the following input arguments:
• RefreshUpdates and resets the timehandle VI with new sample rates. Requires awired "Sample Rates" input.
• Cycle countCycles the counter one step and returns the new "Measure?" array, telling thesoftware which setup is to be measured next.
• Save?Requires the "Setup no." input to be wired and returns a 2x1 Boolean arrayindicating if that setup is to be saved.
Example Usage
Consider refreshing the timehandle VI with the input array [1 1 2 2 3 3 4 4]’ thismeans that the user wants to measure setup 1 once every cycle, setup 2 once everyother cycle, setup 3 once every third cycle and so on. Repeated cycling will returna Boolean output according to the table below.
Cycle no. 1 2 3 4 5 · · ·Setup 1 1 1 1 1 1 · · ·
1 1 1 1 1 · · ·Setup 2 1 0 1 0 1 · · ·
1 0 1 0 1 · · ·Setup 3 1 0 0 1 0 · · ·
1 0 0 1 0 · · ·Setup 3 1 0 0 0 1 · · ·
1 0 0 0 1 · · ·
The timehandle VI will return a Boolean array with the values [0 0]’ if the "Save?"command and the number "2" is used as inputs when the VI is in the cycle 2 state.This is used in the main VI to tell the Data Consumer Loop that setup 2 has notbeen measured this cycle and that no data shall therefore be saved related to setup2.
38
5.3. FUNCTIONALITY SUBVIS
5.3.2 mm_measure.vi
Used by: The Measure Loop
Name Data typeInputs Channel Lists Cluster of 8x string
Save/Measure? 8x Boolean ArrayMeasure Control Cluster of 4x Boolean array + 4x TimestampError in Error cluster
Outputs Data out Numeric arrayError out Error cluster
Description
The "measure" VI handles the measurement communication with the data loggerand returns outputs the acquired data. It ensures that only active setups is beingmeasured and that no setup is being measured unnecessarily. It is based on a casestructure inside a while loop, avoids the Agilent driver limitations and creates adata array.
The Data Array
The Data Array is designed to easily keep track of all measurement data. The con-cept is simple: data from channel X is saved at index X in the output data array. Aindexing loop is used to sort all measured data into the right positions in the dataarrat. To do this it uses the channel lists input and the output data array from theAgilent driver VIs.
Driver Limitations
The Channel Lists cluster contains all inputs for each setup. This is four stringscontaining the voltage inputs and four containing the temperature inputs. The Ag-ilent A34972 driver only accepts 30 input channels at once (the maximum amountof inputs of the biggest available module). Therefore, three new channel lists arebuilt based on the cluster and the state of the "Save/Measure?" Boolean input array.The voltage inputs for Setup 1 and 2 are merged, Setup 3 and 4 are merged and alltemperature inputs are merged. These are then used to first measure the voltagesof Setup 1 and 2, then all temperatures and finally the voltages of setup 3 and 4.The data is then merged and sorted into an data array based on the channel listsaccording to the above defined criteria.
One important discovery is that the Agilent driver VI returns the measured datain numerical order. This means that if the input channel list is "102,101" then thedata output will contain the results in the opposite order.
39
CHAPTER 5. SOFTWARE DESIGN
Example Usage
Assume that the Measure/Save? Boolean array is set to [True True True True FalseFalse False False]’ and the START button states in the "Measure Control" clusteris in state [True False False False]. This means that only setup 1 shall be measureddue to the START 2 button False state. The mm_measure VI will create one stringcontaining the voltage inputs from Setup 1, ignoring the measure command due tothe false state of START 2. It will also build one temperature input string basedon the temperature input for setup 1 and one empty string (due to the False stateof START 2). The resulting measured data is then merged in to one numeric arraywith temperature data first and voltage data second. The data is then sorted intothe correct channel numbered positions in the output data array.
5.3.3 mm_filehandle.viUsed by: The Consumer Loop and The Data loop
Name Data typeInputs Duration time Numeric
Subset Voltage Numeric ArraySettings In Cluster of 6x numeric + 2x StringRegister In Cluster of 6x2 boolean array + 6x2 Numeric arrayControl StringG LEDs 12x1 Boolean array + 2x BooleanError in Error cluster
Outputs Register out Cluster of 6x2 boolean array + 6x2 Numeric arrayCanceled BooleanError out Error cluster
Description
The file handle SubVI creates, saves, opens and updates measurement and settingsfiles. It also updates the time passed part of the register clusters that handles thetime count for each transistor, which is saved in the measurement files. The VI isbased on a single while loop with a case selector controlled with the "control" input.The "control" string selector has the following options:
• Open settingsOpens the settings file in the folder specified in the settings cluster input.
• Save settingsCreates or appends the input settings to a new or already existing settingsfile in the directory specified in the input settings cluster.
• Save data left/rightAppends the input measurement data to the files whose path is specified by
40

5.3. FUNCTIONALITY SUBVIS
the settings input and whose names are specified in the register input’s leftor right side. This assumes that the files already exists in the settings clusterfolder.
• Initialize RegisterChecks the settings folder for measurement files as with the names from theregister cluster array. It creates a file with a header if a file with the registeredname does not exist. If it does the VI will update the time array in the registercluster with the passed time of from that file in the proper place in the registertime passed array.
Example usage
Saving and loading settings only requires the input of the case selector and a settingscluster, containing the directory of the settings file. Loading provides an outputconsisting of a settings cluster containing the data that has been loaded.Saving data is a bit more complicated. Save data left/right selects the left or theright column of the time passed and register arrays in the register cluster. Thewarning and emergency numbers along with the file path is unbundled from thesettings cluster. The measured data is indexed along with the other arrays andis thereafter saved in the proper columns together with a Boolean version of thewarning indicator LED, QPX voltage/current and the current time. More detailedinformation regarding the content and structure of the saved data files can be foundin section 5.4
5.3.4 mm_indicator.vi
Used by: The User Event Loop and the Data Loop
Name Data typeInputs Data in 13x1 numeric array
Command StringOutputs Ind Setup 1 Cluster of 2x(2x6) Boolean arr + 2x Boolean
Ind Setup 2 Cluster of 2x(2x6) Boolean arr + 2x BooleanInd Setup 3 Cluster of 2x(2x6) Boolean arr + 2x BooleanInd Setup 4 Cluster of 2x(2x6) Boolean arr + 2x Boolean
Description
The indicator SubVI handles all voltage and temperature related indicator diodesfound in the main VI GUI. The VI is based on a single while loop with a caseselector and shift registers, one for each setup. A single case structure is locatedinside the loop in order to execute commands. The output consists of clusterswith Boolean indicators for each setup. There are two kinds of LEDs used foreach setup: the green/yellow for displaying if the warning level has been passed
41

CHAPTER 5. SOFTWARE DESIGN
and the transparent/red diodes whom indicates which transistor/temp caused themeasurement to stop.The state of each diode is set in the data loop where the comparison between themeasured data and the diode trigger levels are made. The "Data in" input requiresa numeric value 0,1 or 2 for each of the 13 elements. The first 12 is used for the 12transistors and the last for the temperature indicator. 0 represents a green state, 1a yellow and 2 a red.There are two options for each set of indicators; Update and Reset. Update setsthe corresponding LEDs based on the input state plus the previous state. This isdue to the nature of trigger levels. They shall, ones set ’true’, remain in the truestate even if the measured value fall below the trigger level and thereby results in afalse state. The update option resets all LEDs to false.
Example usage
To reset the setup 1 indicators, select "Reset 1" and all outputs in the "Ind Setup 1"cluster will be set false. To set the fist four indicators green, the next four yellow,the last four red and the temperature yellow one needs to input this numeric array:[0 0 0 0 1 1 1 1 2 2 2 2 1]’. The indicator subVI will return the last state if no inputis provided. The VI will return eight yellow and five red LEDs if setup 1 is updatedonce more with the array [1 1 1 1 0 0 0 0 0 0 0 2]’.
5.3.5 QPX1200_Manager.vi
Used by: Main Consumer Loop, Data Loop
Name Data typeInputs Data Numeric
Command StringResource name IVI Session of ClassChannel name StringError In Error Cluster
Outputs Voltage Out NumericCurrent Out NumericError Out Error Cluster
Description
The QPX1200 Manager VI is a very simple VI which is only used to simplify thecontrol of the QPX1200 units. It is based on a single loop with a case selector foreach QPX1200 Driver VI that is used by the main program. The VI is originallydesigned with shift registers to prevent the constant need for a resource name input,however this is not usable when several QPX1200 handles are being used at once.One can argue that it is possible to feed this VI with a shift registered cluster offour instrument handles. This is of course a possibility and will be considered in
42
5.3. FUNCTIONALITY SUBVIS
future versions of the software. It would also improve the understandability of thecode.
The case selector has the following options:
• InitializeInitializes the hardware handle, configures the power supply to regulate thevoltage and keep a constant current, enables the over voltage protection andmakes sure that the output of the power supply is disabled.
• Set max VSets the maximum voltage to the level specified in the numeric "data" input.
• Set ISets the current to the level specified in the numeric "data" input.
• Get VSends the present voltage level to the "voltage out" output.
• Get ISends the present current level to the "current out" output.
• Enable OutputEnables the output of the power supply.
• Disable OutputDisables the output of the power supply.
• CloseCloses the hardware handle.
5.3.6 34972_manager.viUsed by: Main Consumer Loop
Name Data typeInputs Data Numeric
Command StringVISA resource name VISA resource nameScan List StringError In Error Cluster
Outputs Output Data Numeric ArrayError Out Error Cluster
Description
The 34972_manager.vi is used to communicate with the Agilent 34972A data logger.It includes all necessary commands to measure 48 voltages and 4 temperatures. It
43
CHAPTER 5. SOFTWARE DESIGN
is based on a single while loop with shift registers and a case selector, controlledby the command string. This VI, in contrast to QPX1200_Manager.vi, only needsto be sent a instrument handle resource name once. The shift register will keepthe resource name making it possible to control the data logger with a minimumamount of inputs. The "Command" string has the following options:
• InitializeInitializes the data logger and shows the string "TRANSIC" on the hardwaredisplay.
• Set ResourceFeeds the shift register with a new resource name.
• Get VoltagesMeasures voltages on the channels specified in the "Scan List" string and sendsreturns a data array containing the results.
• Get TemperaturesMeasures temperatures on the channels specified in the "Scan List" string andsends returns a data array containing the results.
• CloseDeinitializes the specified instrument handle.
5.4 Log FilesAll relevant data is saved to .txt log files in the directory specified in the settingsmenu. There will be one file for each transistor number specified in the registermenu. Each file contains two parts:
• HeaderThe header consists of a description of the transistor number of the measuredtransistor as well as the name of each column. The names are: Time passed |Time (s) | Uce Voltage | Stop Lvl | Warning Lvl | Warned (1,0) | Temperature| QPX Voltage | QPX Current | Date/time of day
• Logged dataThe data is divided into ten columns and each measurement adds a new rowcontaining one entry for each column.
The data is saved using the Write Spreadsheet String VI designed by NationalInstruments. Both the header and the data rows are using tab as a delimiterbetween columns and "." as decimal delimiter. A example log file can be found inthe appendix.
44

5.5. MAIN VI EXAMPLE USAGE
5.5 Main VI Example UsageThis section will, in detail, explain typical usage of the HTOL Test software andexplain how the PCDP, SubVIs and clusters are working together to full-fill thesoftware requirements.
In a typical usage situation, a user will most likely follow these steps:
1. Start the HTOL Test program
2. Configure the hardware
3. Load and edit settings
4. Register Transistors
5. Start a measurement
6. View a graph
7. Stop the measurement
8. Close the program
5.5.1 Start the HTOL Test programThe software will, at start up, open the main window with all controls grayed out. Itwill then create the PCDP-queue, and thereafter enqueue a cluster consisting of thestring "Configure hardware" and a empty numeric array. The "Configure hardware"command is then handled by the case structure in the "Main Consumer Loop".
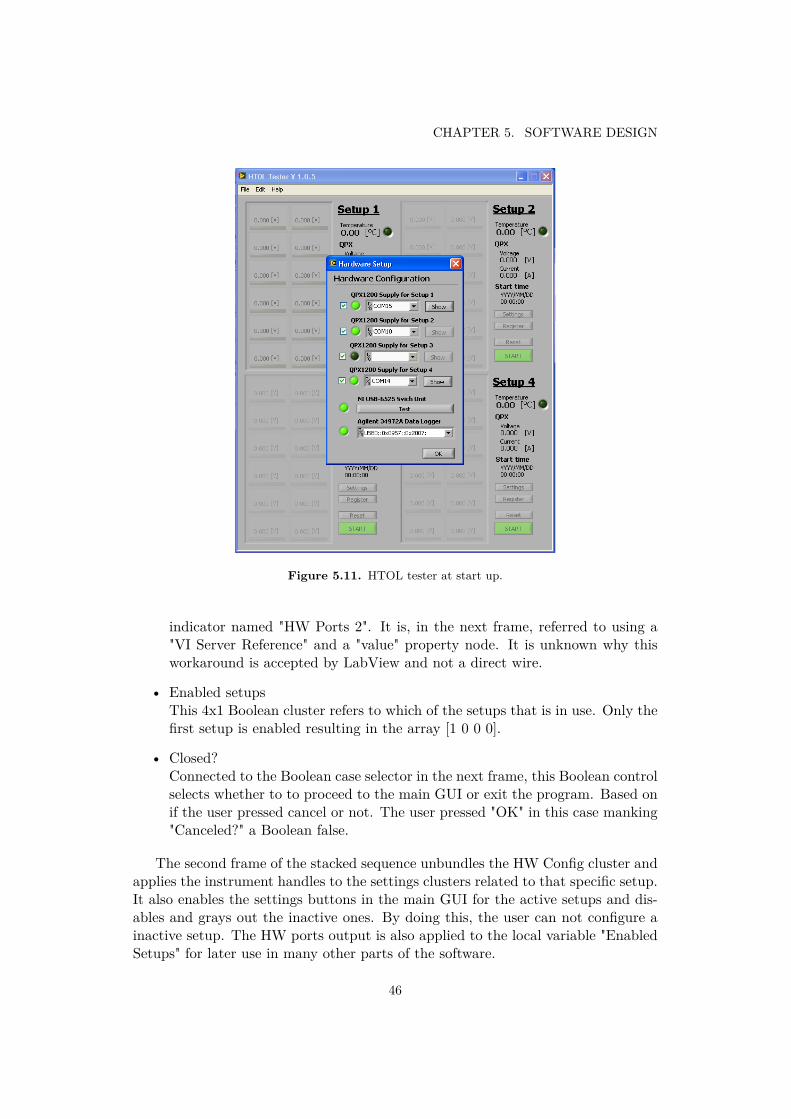
5.5.2 Configure the HardwareThe "configure hardware" case consists of a three framed stacked sequence and aBoolean case selector. The stacked sequence is used because of the need to executethe stacked events in order. The first frame launches the "Configure Hardware"dialog SubVI, appearing to the user immediately at start-up. The user selectsa QPX1200 voltage supply, tests the NI USB 6525 unit and a Agilent 34972Adata logger and thereafter presses the OK button. This will close the "ConfigureHardware" window. The three outputs from the SubVI is handled accordingly:
• HW Ports OutThis output cluster consists of five instrument handles as selected by the user.In this case, only the first power supply and the data logger will have validinstrument handles. This cluster was intended to be connected to the nextframe in the sequence, however it resulted in a ’invalid instrument handle’error. This illogical error can be avoided by connecting the output to a cluster
45
CHAPTER 5. SOFTWARE DESIGN
Figure 5.11. HTOL tester at start up.
indicator named "HW Ports 2". It is, in the next frame, referred to using a"VI Server Reference" and a "value" property node. It is unknown why thisworkaround is accepted by LabView and not a direct wire.
• Enabled setupsThis 4x1 Boolean cluster refers to which of the setups that is in use. Only thefirst setup is enabled resulting in the array [1 0 0 0].
• Closed?Connected to the Boolean case selector in the next frame, this Boolean controlselects whether to to proceed to the main GUI or exit the program. Based onif the user pressed cancel or not. The user pressed "OK" in this case manking"Canceled?" a Boolean false.
The second frame of the stacked sequence unbundles the HW Config cluster andapplies the instrument handles to the settings clusters related to that specific setup.It also enables the settings buttons in the main GUI for the active setups and dis-ables and grays out the inactive ones. By doing this, the user can not configure ainactive setup. The HW ports output is also applied to the local variable "EnabledSetups" for later use in many other parts of the software.
46

5.5. MAIN VI EXAMPLE USAGE
Finally the "initialize" command is enqueued. This will start the hardware ini-tialization case which also handled by the Main Consumer Loop.
Hardware Initialization
The "Initialize" case of the Main Consumer Loop initializes the selected hardware,setting the QPX1200 voltage supply to a disabled output state with 0V and 0A asvoltage and current. It will reset the indicator diodes, enable the reset button andensure that the Graph array and the register and start buttons are disabled andgrayed out.
5.5.3 Load and Edit Settings
The user can now press the settings button for the enabled and initialized setup.The "Settings X" button value change event is identified by the Main Producer Loopand it will enqueue a cluster consisting of a "settings" string and a numeric arrayindicating which of the four settings buttons that was pressed. In this example, theuser pressed the settings button for setup 1, resulting in a numeric array with thevalue "1".
The Main Consumer Loop handles the settings case and feeds the settings win-dow SubVI with the correct "Settings data" cluster based on the numeric array. Italso provides a numeric constant telling the SubVI which setup the settings clusterbelongs to. The user is now presented with the Settings window, presses the "LoadSettings" button and selects a settings file from a previous measurement. The folderwhere the loaded settings file is located is however not the folder where the newmeasurements shall be placed. The user will therefore select a different folder andthereafter klick the OK button. This will save the settings in the new directory,apply the Voltage and Current limits to the power supply and thereafter close thewindow.
The settings menu will output the settings data cluster which has been saved and itwill will now be assigned to the local variable "Settings data 1". The LEDs for setup1 will be reset once more and the Register button will be enabled. Finally, a "Samplerate change" command is enqueued based on if the sample rate has changed.
Sample rate change
The sample rate case, also handled by the main consumer loop, divides all configuredsample rates with 12 and feeds the mm_timehandle SubVI with the data. It onlyconsists of integers due to the fact that the settings window only allows multiplesof 12 second intervals.
47

CHAPTER 5. SOFTWARE DESIGN
5.5.4 Register TransistorsThe same type of event handling, as for settings buttons, is used for a value changeof a Register button. It will be handled by the "Register" case in the main consumerloop and will, based on the numeric array provide the register window SubVI withthe register data cluster for setup 1.
Assume that the user is only measuring 10 transistors and therefore leaves thelast row empty. The window will close after the OK button is pressed and the startand graph array will now be enabled. The main VI will provide the filehandle VIwith the file path and the transistor names. It will create unexisting files and ignorethe empty file names or existing files. mm_filehandle returns a updated version ofthe Register cluster and it will be assigned to the local variable "Register data 1".The transistor names array, displayed to the user in the main VI, is updated withthe transistor numbers. The "Start" button for setup 1s now enabled. The programis now ready to start a HTOL test.
5.5.5 Start MeasurementThe user event loop will enqueue a numeric version of all start button states togetherwith the "start and stop" string as soon as the start button is pressed. This queuedelement is also handled by the Main Consumer Loop. It will, assuming that themeasurement loop "busy" control is false, initially compare the current start buttonstates from the previous time the "start and stop" element was enqueued. Thismakes it possible to know which button that was pressed and what it changed to.In this case, the "Start" button of setup 1 was pressed and this will result in thepower output for the corresponding QPX1200 supply being enabled. It also disablesand grays out the Settings and Register buttons, updates the start time for setup 1and updates the time passed array in the register cluster. It will thereafter enqueuethe "measure" string, handled by the measurement loop.
Measurement
The Measurement Data Producer Loop only handles the "measure" command. Itwill, as long as at least one of the start buttons is in "True" state, use the mm_timehandleVI to "Cycle count" each 12:th second . It does this to determine when to measurewhat. The measurement data is then enqueued together with the string "data"under condition that something was measured that cycle. It will in this examplemeasure every cycle and will continue to do so until the user presses the stop buttonfor setup 1.
The enqueued data is handled by the data loop. It will, based on the "Save?" func-tionality from the timehandle VI determine that only setup 1 has updated data. Allindicators in the GUI will be updated, providing the user with new measurementdata and QPX1200 voltage and current status. It updates the indicator LEDs, by
48

5.5. MAIN VI EXAMPLE USAGE
checking if any warning or emergency levels has been passed and saves the datato the corresponding files. The data saving is divided into two parts. On part forthe left side of the setup and one for the left side. This makes it possible to havedifferent sample rates on each side. A dialog will warn the user if a emergency levelis exceeded and a emergency loop will thereafter be entered. It will wait until the"busy" control is set to false by the measurement loop and thereafter stop the basecurrent supply using the NI USB 6525 unit, disable the output of the QPX1200unit and set the corresponding "Start" button to "False".
5.5.6 View Graph of Measured Data
The graph window for setup 1 is launched by a press on the invisible 6x2 "Graph1" button array, placed on top of the transistor names, data results and indicatorLEDs. This makes it possible to press anywhere inside the array frame of the tran-sistor whose graph the user would like to view.
Lets assume that the user would like to view the graphs based on the data forthe top left transistor and thereby klicks in the top left corner of the array. Thiswill execute the "Graph 1, Graph 2, Graph.... Value Change" event in the userevent loop. All element in the button array is kept in a False state. This meansthat all elements of all arrays is False but the element where the user has pressed.It identifies which setup that was pressed and enqueues the string "graph" alongwith the numeric array [1 0 0 0 0 0 0 0 0 0 0 0 1]’ where the last element representsthe setup number, and the first 12 elements is the numeric version of the Booleanstates of the 12 elements of that array.
After receiving the "graph" command, the consumer loop selects the settings andregister clusters based on the last element in the received array. It is also used toidentify the name of that transistor based on the rest of the array and the registercluster. It thereafter and launches the graph window.
At start-up, the "Graph" SubVI loads the measurement file and plots the measureddata along with the warning and emergency levels. The emergency and warning lev-els will be applied to the numeric controls beneath each graph. Making it possiblefor by the user to adjust these levels. The Graph window is at start-up auto-scaledand the auto update function is on. This means that the data will be continuouslyloaded from the measurement file to update the graphs.
The user now adjusts the warning level for the temperature. Changing the in-dicator level used for plotting the horizontal indicator lines. The warning levelchange will set the "Changed?" Boolean output to "True" and the changes will alsobe applied to the settings out cluster. The settings will be saved to the settings fileat the path specified by the settings cluster after the Graph SubVI is been closed.
49
CHAPTER 5. SOFTWARE DESIGN
5.5.7 Stop the MeasurementAnother press at the Setup 1 START/STOP button will stop the measuring processby once more enqueuing the status of the start buttons together with the string"start and stop". The "start and stop" case will once the "measure" loop is indicatingthat it’s not busy, identify that setup 1 has changed it’s value to stop. It willthereafter inactivate the output of the power supply for setup 1 and re-enable theSettings and Register buttons. The measurement loop will stop as soon as theongoing measurement is finished and the data has been enqueued.
5.5.8 Close the ProgramThe main GUI is now closed by a press of the X in the top right corner of the win-dow. This will invoke the user event "Panel Close?" in the user event loop which willinitially display a dialog window with the question: "Are you sure that you wantto exit and stop all ongoing measurements?". A cluster with the string "closehw"and the array [1] will be enqueued when the user presses yes. The user event loopwill thereafter open the mm_exittimer SubVI with a 14 second progress bar beforestopping the loop and killing the queue.
The "closehw" command is handled by the Main Consumer Loop where all activeinstrument handles is closed. The array indicates that the user would like to exit theprogram, not just close the previously initiated hardware. It will therefore enqueue"exit" and stop the loop. The Measure Loop is at this point already stopped dueto the false state of all START/Stop buttons. The data loop however handles thelast "exit" command causing it to stop. The main producer loop will, after the endof the 14 second exit timer, stop the main producer loop and close LabView.
50
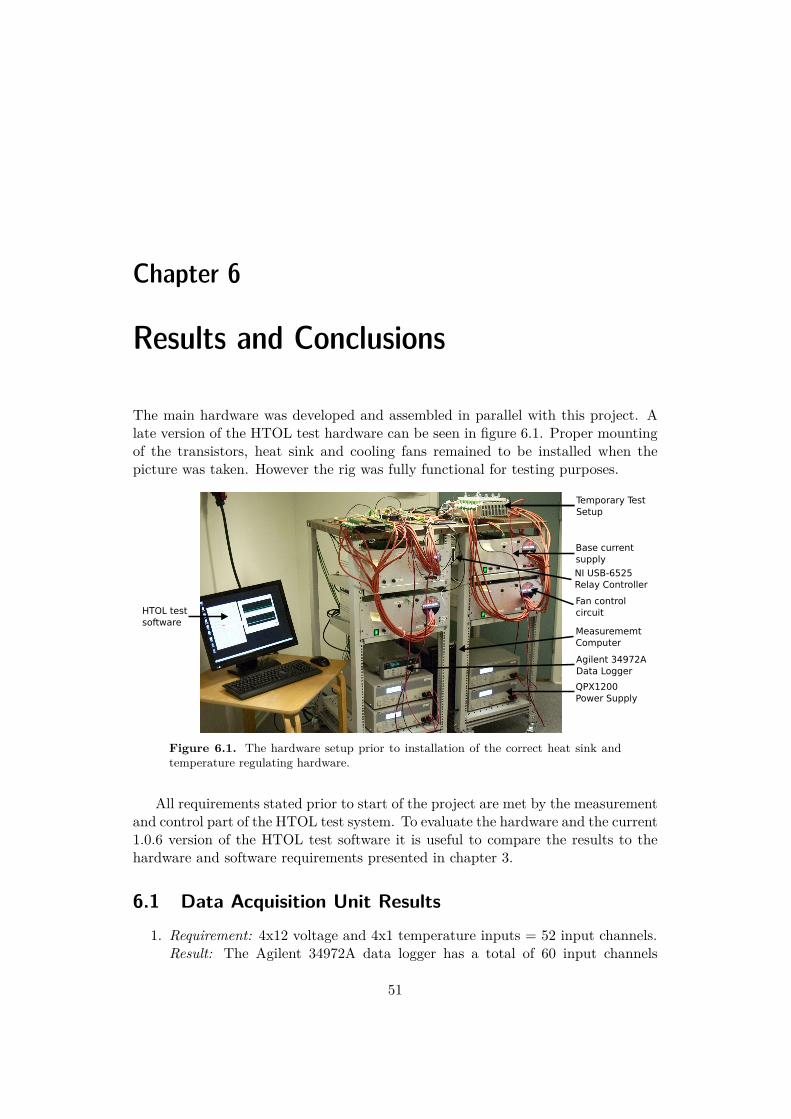
Chapter 6
Results and Conclusions
The main hardware was developed and assembled in parallel with this project. Alate version of the HTOL test hardware can be seen in figure 6.1. Proper mountingof the transistors, heat sink and cooling fans remained to be installed when thepicture was taken. However the rig was fully functional for testing purposes.
HTOL testsoftware
Base currentsupply
Fan controlcircuit
Agilent 34972AData Logger
MeasurememtComputer
QPX1200Power Supply
Temporary TestSetup
NI USB-6525Relay Controller
Figure 6.1. The hardware setup prior to installation of the correct heat sink andtemperature regulating hardware.
All requirements stated prior to start of the project are met by the measurementand control part of the HTOL test system. To evaluate the hardware and the current1.0.6 version of the HTOL test software it is useful to compare the results to thehardware and software requirements presented in chapter 3.
6.1 Data Acquisition Unit Results1. Requirement: 4x12 voltage and 4x1 temperature inputs = 52 input channels.
Result: The Agilent 34972A data logger has a total of 60 input channels
51

CHAPTER 6. RESULTS AND CONCLUSIONS
divided on three 34901A multiplexer cards.
2. Requirement: At least 1/20 S/s sample rate.Result: A sample rate of 52/20=2.6 S/s is required to be able to measure 52cannels each 20 seconds. Each 34901A multiplexer card has a specified "60ch/s" maximum scan speed[9]. During testing it was found that the longesttime for measuring 48 voltages and 4 temperatures are 12 seconds. This resultin a maximum sample speed of 52/12=4.33 ch/s.
3. Requirement: Each voltage input must be able to withstand a maximum of60 V without breaking the hardware.Result: Maximum input voltage to the 34901A multiplexer card is 300V[9].
4. Requirement: At least 10-20 mV measurement precision in the range 0.3 V -2 VResult: Calculations in section 4.1.2 show that the measurement accuracy ofthe Agilent 34972A is, at worst, U(U) = 0.047 mV (k=3) to U(U) = 0.12 mV(k=3) depending on if the range is 1 V or 10 V.
5. Requirement: A temperature precision of at least ±3 ◦C.Result: The uncertainty for a temperature measurement can be calculatedaccording to equation 2.7. A temperature measurement is affected by theaccuracy of three individual components. These are: a thermocouple element(t), a 2 meter long equalising conductor cable (e) and the data logger (d).The thermocouple is a Type K Class 1 thermocouple with the specified uncer-tainty Ut(T ) = 1.5 ◦C (k=2) according to IEC 584-2. The uncertainty of theequalizing conductor cable is unknown and no data can be found. A seller ofthe two meeter long cable assumes that Ue(T ) = 2 ◦C (k assumed to be =2).As described in section 4.1.2, the data logger has a temperature uncertaintyof: Ud(T ) = 1 ◦C (k=3).
All components are connected in series and x can therefore be determinedto be:
x = Tmeasured = T ± δt(T )± δe(T )± δd(T ) (6.1)
x is now inserted into equation 2.7 to calculate the combined uncertainty:
uc =
√(∂x
∂tut(T )
)2+(∂x
∂eue(T )
)2+(∂x
∂dud(T )
)2(6.2)
=
√(Ut(T )kt
)2+(Ue(T )ke
)2+(Ud(T )kd
)2(6.3)
=
√(1.52
)2+(2
2
)2+(1
3
)2≈ 1.3 ◦C (6.4)
Uc = 1.3 · 2 = 2.6 ◦C (k=2) (6.5)
52

6.2. SOFTWARE RESULTS
A uncertainty of 2.6 ◦C is acceptable and well within the requirements.
6. Requirement: USB communication.Result: The purchased Agilent 34972A is the USB version of the 34970A.
7. Requirement: LabView compatibility.Result: Agilent has excellent LabView drivers installable from within Lab-View.
8. Requirement: Reasonable price.Result: Retail price of 22 773 sek is considered reasonable.
6.2 Software ResultsEach setup shall, independently:
1. Requirement: Be start and stop-ableResult: Each setup is individually start and stop-able
2. Requirement: Have user defined Voltage and Current settings for the QPX1200power supply.Result: Current and Voltage limit is set in the "settings" window.
3. Requirement: Have user defined sample rates for each group consisting of 6transistors.Result: Sample rate for the right and left side of the setup can be set in thesettings menu.
4. Requirement: Have variable voltage warning and emergency stop levels.Result: Warning and emergency stop levels is initially set in the settings menuand can be adjusted during a measurement in the graph window.
5. Requirement: Have user definable temperature warning and emergency stoplevelsResult: Warning and emergency stop levels is initially set in the settings menuand can be adjusted during a measurement in the graph window.
6. Requirement: Warn the operator when a emergency level is exceeded.Result: A dialog is presented to the user when a emergency level is passed.
7. Requirement: Stop ongoing measurement, disable the power supply and basecurrent output when one or several of these criteria are fulfilled:- Emergency voltage limit exceeded.- Emergency temperature limit exceeded.- No current flowing from the power supply.Result: The listed criteria is included in the emergency stop functionality.
53
CHAPTER 6. RESULTS AND CONCLUSIONS
8. Requirement: Allow naming of transistors based on serial numbers.Result: All transistor numbers can be configured in the register menu.
9. Requirement: Save log data files for each individual transistor named after theserial numbers.Result: The requirements is accomplished by creating files named after thearray in the register window.
10. Requirement: Continue adding measurement data to already existing files if afile with the same transistor number already exists in the specified folder.Result: No new file is created if a file with the transistor number already existsin the specified folder. The data is later on added normally to the alreadyexisting file.
11. Requirement: Show graphs for any transistor during measurements based onuser selection.Result: A graph window, displaying all relevant information, is opened byclicking on the corresponding frame in the GUI.
12. Requirement: Fulfill reasonable stability and usability requirements.Result: The software has been thoroughly tested for a longer period of timeresulting in several bug fixes.
6.3 Possible ImprovementsThe first version of the HTOL test system and software fulills the requirementsset in a early stage of the project. However some things can be improved andrequirements change over time. Presented in this section is a list of improvementsuggestions both related to the software and the hardware.
• SubVI designSome SubVIs could be using a simpler design pattern such as the State Ma-chine in stead of the PCDP. It would result in a sometimes more light weightcode and avoid sometimes unnecessary complexity.
• Measure base currentMost variables is saved to the log files during HTOL tests. However the basecurrent is not, despite the multiplexer capability of measuring currents up to1A. It might be valuable to route one base current supply for each setup via thedata logger, measure the current and include the results in the measurementfiles.
• Measure More temperaturesThere are a total of 12 multiplexer inputs available for temperature measure-ments. Only four of them is currently in use. It might be a wise to utilize
54
6.3. POSSIBLE IMPROVEMENTS
the unused inputs to measure a total of three temperatures for each heat sinkresulting in a better temperature approximation.
• Calibration CycleMaintain a annual calibration cycle in order to ensure sustainable measure-ment accuracy.
• Utilize a databaseSaving all measurement data to a database instead of .txt log files will easethe handling large quantities of data generated over a longer period of time.
• Eliminate unnecessary measurementsSome inputs are currently being measured more often than they have to. Atthe present, all 12 voltages is being measured at the same time even if one sideof the setup has a lower sample rate. This issue can be resolved by increasingthe complexity of the measure VI and deviding the voltage channel list, foreach setup, into two channel lists.
• Extended error handling.A big weakness in the main VI is the error handling. A error will causethe loop, where the error occurred, to stop. However nothing else happens.No user events will be handled if the main consumer loop is stopped, nomeasurements will be conducted if the measure data producer loop is stoppedand no data will be saved if the data consumer loop is stopped. The user willmost likely close the program if it does not work properly and will thereafter bepresented with a error dialog window. The vast majority of all error handlingis connected and routed properly. A edit of the "error" case in each loop canresolve this issue.
• Extended system monitoringEmergency stops only occur when the data consumer loop is handling newmeasured data. This means that quite a long time can pass before the hard-ware is stopped if the sample rate is very low. Some emergency stop levelsdoes not require measurements from the data logger. These can therefore bechecked more often to ensure that the hardware is stopped as soon as possible.
• More efficient graph VIThe update process of the graph VI reloads data from the measurement fileevery 0.5 seconds even if there is no new data. A more resource efficient wayof updating the graphs would be to send a signal from the main VI to thegraph VI each time new data is saved, eliminating unnecessary updates.
• Save/load register dataManual input of transistor numbers in the register VI is time consuming. Auseful improvement to the register VI is to include the possibility to load previ-ous register arrays. This can be accomplished by saving a "register" file in the
55
CHAPTER 6. RESULTS AND CONCLUSIONS
specified file directory and include a "load register" button in the register VI.This improvement makes it fast and easy to resume a previous measurementwithout having to, once more, input all transistor numbers manually.
6.4 Final ConclusionsIt is wise to develop systems like the HTOL test system at TranSIC in severalphases. Requirements will likely change over time and if big changes are incorpo-rated during the project, there is a a risk for delays. However if minor changesis modestly integrated into the system during development and major changes issaved for later evaluation, then a first version of the system will likely be completedin time. After completing the first version of the HTOL test system, fulfilling allthe initial requirements, new requirements, changes and improvements can be eval-uated. A first version of the of the system is now completed and is in full scale useat TranSIC AB.
56

Bibliography
[1] Guide to the expression of uncertainty in measurement. , International Organi-sation for Standardisation, First ed., ISBN 92-67-10188-9, Switzerland, 1995.
[2] National Instruments Instrument Driver Development Tools and Resources.http://www.ni.com/devzone/idnet/development.htm, 2011.
[3] VT Instruments Knowledge Base.http://www.vtiinstruments.com/SupportBx4Qans.aspx?FaqID=79, 2011.
[4] Hans Sohlström Metrologi - läran om matt. Department of Microsystem Tech-nology, Royal Institute Of Technology, Stockholm, 2011.
[5] Per Carlson, Staffan Johansson Modern Elektronisk Mätteknik. Addison Wesley,Massachusetts, 1st Edition, 1997.
[6] John M. Carulli Jr. and Thomas J. Anderson The Impact of Multiple FailureModes on Estimating Product Field Reliability. Texas Instruments, 2006.
[7] National Instruments Accuracy Calculator.http://www.ni.com/advisor/accuracy/acc_support.htm, 2011.
[8] National Instruments Application Design Patterns: Producer/Consumer.http://zone.ni.com/devzone/cda/tut/p/id/3023, 2011.
[9] Agilent Technologies Data Acquisition/ Switch Unit Family 34970A/34972Adatasheet, 2010.
[10] National Instruments NI 9205 datasheet.http://sine.ni.com/ds/app/doc/p/id/ds-190/lang/en, 2011.
[11] Agilent Technologies HP 34970A User’s Guide.http://cp.literature.agilent.com/litweb/pdf/34970-90003.pdf, 2011.
[12] National Instruments NI 9211 datasheet.http://sine.ni.com/ds/app/doc/p/id/ds-197/lang/en, 2011.
[13] Personal communication with Gustav Bergquist, consultant at TranSIC AB,2011.
57


Appendix A
Data File
Logged data for Transistor number: 123123
Time Time (s) Uce Voltage Hi Warning Lo Warning Warned (1.0) Temperature QPX Voltage QPX Current Date/time of day00:00:02 00000002 0.412979 1.000000 0.600000 0.000000 33.185000 6.075000 3.999000 2011-07-12 11:4900:00:14 00000014 0.414538 1.000000 0.600000 0.000000 32.906000 6.089000 3.999000 2011-07-12 11:4900:00:26 00000026 0.414712 1.000000 0.600000 0.000000 32.745000 6.091000 3.999000 2011-07-12 11:4900:00:38 00000038 0.414764 1.000000 0.600000 0.000000 32.949000 6.094000 3.999000 2011-07-12 11:5000:00:50 00000050 0.414858 1.000000 0.600000 0.000000 33.019000 6.097000 3.998000 2011-07-12 11:5000:01:02 00000062 0.414943 1.000000 0.600000 0.000000 33.187000 6.101000 4.001000 2011-07-12 11:5000:01:14 00000074 0.415087 1.000000 0.600000 0.000000 33.290000 6.103000 4.000000 2011-07-12 11:5000:01:40 00000100 0.415221 1.000000 0.600000 0.000000 33.354000 6.109000 3.999000 2011-07-12 11:5100:01:52 00000112 0.415363 1.000000 0.600000 0.000000 33.568000 6.111000 4.000000 2011-07-12 11:5100:02:04 00000124 0.415475 1.000000 0.600000 0.000000 33.710000 6.114000 4.000000 2011-07-12 11:5100:02:16 00000136 0.415562 1.000000 0.600000 0.000000 33.714000 6.116000 4.000000 2011-07-12 11:5100:02:28 00000148 0.415725 1.000000 0.600000 0.000000 33.823000 6.118000 4.002000 2011-07-12 11:5100:02:43 00000163 0.415800 1.000000 0.600000 0.000000 33.809000 6.119000 4.000000 2011-07-12 11:5200:02:52 00000172 0.415909 1.000000 0.600000 0.000000 34.191000 6.122000 3.999000 2011-07-12 11:5200:03:16 00000196 0.416153 1.000000 0.600000 0.000000 33.913000 6.126000 3.999000 2011-07-12 11:5200:03:28 00000208 0.416293 1.000000 0.600000 0.000000 34.265000 6.126000 3.998000 2011-07-12 11:5200:03:46 00000226 0.416505 1.000000 0.600000 0.000000 34.520000 6.131000 4.000000 2011-07-12 11:5300:03:53 00000233 0.416596 1.000000 0.600000 0.000000 33.977000 6.131000 4.001000 2011-07-12 11:5300:04:04 00000244 0.416703 1.000000 0.600000 0.000000 34.238000 6.132000 3.999000 2011-07-12 11:5300:04:16 00000256 0.416856 1.000000 0.600000 0.000000 34.545000 6.134000 3.998000 2011-07-12 11:5300:04:28 00000268 0.416984 1.000000 0.600000 0.000000 34.534000 6.136000 3.999000 2011-07-12 11:5300:04:40 00000280 0.417153 1.000000 0.600000 0.000000 34.763000 6.137000 3.999000 2011-07-12 11:5400:04:52 00000292 0.417248 1.000000 0.600000 0.000000 34.974000 6.140000 4.000000 2011-07-12 11:5400:05:04 00000304 0.417390 1.000000 0.600000 0.000000 35.292000 6.141000 3.998000 2011-07-12 11:5400:05:16 00000316 0.417568 1.000000 0.600000 0.000000 35.347000 6.144000 3.998000 2011-07-12 11:5400:05:28 00000328 0.417761 1.000000 0.600000 0.000000 35.440000 6.148000 3.999000 2011-07-12 11:5400:05:40 00000340 0.417981 1.000000 0.600000 0.000000 35.386000 6.148000 3.999000 2011-07-12 11:5500:05:52 00000352 0.418144 1.000000 0.600000 0.000000 35.588000 6.147000 3.998000 2011-07-12 11:5500:06:04 00000364 0.418265 1.000000 0.600000 0.000000 35.501000 6.146000 3.998000 2011-07-12 11:5500:06:16 00000376 0.418390 1.000000 0.600000 0.000000 35.076000 6.147000 3.998000 2011-07-12 11:5500:06:28 00000388 0.418397 1.000000 0.600000 0.000000 35.251000 6.148000 4.000000 2011-07-12 11:5500:06:40 00000400 0.418565 1.000000 0.600000 0.000000 35.596000 6.150000 3.999000 2011-07-12 11:5600:06:52 00000412 0.418667 1.000000 0.600000 0.000000 35.789000 6.153000 4.000000 2011-07-12 11:5600:07:05 00000425 0.418834 1.000000 0.600000 0.000000 36.059000 6.156000 4.000000 2011-07-12 11:5600:07:16 00000436 0.419009 1.000000 0.600000 0.000000 35.968000 6.158000 3.999000 2011-07-12 11:5600:07:29 00000449 0.419120 1.000000 0.600000 0.000000 36.131000 6.160000 3.998000 2011-07-12 11:5600:07:41 00000461 0.419231 1.000000 0.600000 0.000000 35.906000 6.158000 4.000000 2011-07-12 11:5700:07:53 00000473 0.419294 1.000000 0.600000 0.000000 35.944000 6.159000 4.000000 2011-07-12 11:5700:08:05 00000485 0.419309 1.000000 0.600000 0.000000 36.170000 6.161000 4.001000 2011-07-12 11:5700:08:17 00000497 0.419447 1.000000 0.600000 0.000000 36.032000 6.163000 4.000000 2011-07-12 11:5700:08:29 00000509 0.419561 1.000000 0.600000 0.000000 36.126000 6.165000 4.000000 2011-07-12 11:5700:08:41 00000521 0.419605 1.000000 0.600000 0.000000 36.172000 6.167000 3.999000 2011-07-12 11:58
59