laboratory tests and field investigations of dnapl source ... · laboratory tests and field...
TRANSCRIPT

Laboratory Tests and Field Investigations of
DNAPL Source Zone Remediation Using Granular Iron
Laboratory Tests and Laboratory Tests andField Investigations of Field Investigations of
DNAPL Source Zone Remediation DNAPL Source Zone Remediation Using Granular IronUsing Granular Iron
Sharon L.S. Wadley and Robert W. GillhamSharon L.S. Wadley and Robert W. Gillham
Department of Earth SciencesDepartment of Earth Sciences University of WaterlooUniversity of Waterloo
Waterloo, Ontario, CanadaWaterloo, Ontario, Canada
RTDF Meeting October 15RTDF Meeting October 15--16, 200316, 2003

DNAPL Remediation Using Isolation Technology and Granular Iron
DNAPL Remediation Using Isolation DNAPL Remediation Using IsolationTechnology and Granular IronTechnology and Granular Iron
•• SoilSoil--mixing augers used to mix mixing augers used to mix ironiron--bentonitebentonite slurries slurries inin situsitu
•• BentoniteBentonite –– Initially, a lubricant and Initially, a lubricant and viscosiferviscosifer to to
facilitate injectionfacilitate injection –– Subsequently, reduces hydraulic Subsequently, reduces hydraulic
conductivity of mixed zoneconductivity of mixed zone
•• Mixing homogenizes Mixing homogenizes contaminated contaminated
•• Contaminant diffuses to iron Contaminant diffuses to iron surface within mixed zone surface within mixed zone dechlorinationdechlorination takes placetakes place
regionregion
wherewhere

Research ObjectivesResearch ObjectivesResearch Objectives
•• To determine, through laboratory testing, To determine, through laboratory testing, whether mixing granular iron,whether mixing granular iron, bentonitebentonite and saturated materials contaminated with and saturated materials contaminated with freefree--phase chlorinatedphase chlorinated ethenesethenes would would prove an effective remediation methodprove an effective remediation method
•• To demonstrate the concept in a field To demonstrate the concept in a field setting, to evaluate the remediation setting, to evaluate the remediation potential and installation methodpotential and installation method

ExperimentsExperimentsExperiments
1. 1.
2. 2.
3. 3.
Preliminary Batch ExperimentPreliminary Batch Experiment
Field DemonstrationField Demonstration
Laboratory ExperimentLaboratory Experiment

Experimental Preparation Experimental Preparation Experimental Preparation
Hypovials contained: Hypovials contained: (Wt%)(Wt%)
Master Builders Iron (medMaster Builders Iron (med--fine): fine): BaroidBaroid BensealBenseal®® Bentonite: Bentonite: 3.5 3.5 Borden Sand:Borden Sand: 23.5 23.5 Distilled water:Distilled water: 49.3 49.3 mLmL (average)(average) FreeFree--phase TCE: phase TCE: 0.11 g 0.11 g
Periodically, hypovials were sacrificed to measure aqueous concentrations of TCE and potential
degradation products
Periodically, hypovials were sacrificed to measure Periodically, hypovials were sacrificed to measure aqueous concentrations of TCE and potential aqueous concentrations of TCE and potential
degradation productsdegradation products
(5%)g 1.3 (5%) g 1.3 (12%)g (12%) g (83%)g (83%) g
(2x solubility)(2x solubility)

0
500
1000
1500
2000
2500
0 50 100 150
0
500
1000
1500
2000
TCE and Chloride ConcentrationsTCE and Chloride ConcentrationsTCE and Chloride Concentrations
Elapsed Time (days)
TCE
Con
cent
ratio
n (m
g/l)
Chl
orid
e C
once
ntra
tion
(mg/
l)
SolubilitySolubility
tt½½ = 11.1 hrs= 11.1 hrs (normalized to (normalized to
1 m1 m22 Fe / ml solution)Fe / ml solution)
Max Max ClCl--

0.00
2.00
4.00
6.00
8.00
10.00
0 50 100 150 200
VC 11DCE tDCE cDCE
Organic Degradation Products Organic Degradation Products Organic Degradation Products
Elapsed Time (days)
Con
cent
ratio
n (m
g/l)
Total organic degradation products Total organic degradation products < 1% original TCE< 1% original TCE

Field Demonstration: ObjectivesField Demonstration: ObjectivesField Demonstration: Objectives
•• To determine whether mixing slurries of To determine whether mixing slurries of granular iron and bentonite into granular iron and bentonite into contaminated geological material promotes contaminated geological material promotes in situin situ removal of DNAPLremoval of DNAPL
•• To test the feasibility of producing uniform To test the feasibility of producing uniform iron/bentonite/soil/DNAPL mixtures iron/bentonite/soil/DNAPL mixtures

CFB Borden: GeologyCFB Borden: GeologyCFB Borden: Geology
Surface Aquifer (Beach sand)Surface Aquifer (Beach sand)
Upper Aquitard (Silty clay)Upper Aquitard (Silty clay) Stiff Blocky TextureStiff Blocky Texture Soft Plastic TextureSoft Plastic Texture
Lower Aquitard (Lower Aquitard (DiamictDiamict))
Lower Aquifer (Silty sand)Lower Aquifer (Silty sand)
9x9 m Cell9x9 m Cell
Forested SiteForested Site
(m(m bgsbgs)) 00
3 3 –– 44
7.57.5
11.511.5

Site HistorySite HistorySite History
•• 19911991 9x9m sheet9x9m sheet--piling cell constructed inpiling cell constructed in Borden aquifer and keyed intoBorden aquifer and keyed into aquitardaquitard -- 771 L PCE released to monitor migration771 L PCE released to monitor migration -- 39 days later 39 days later –– PCE was found inPCE was found in aquitardaquitard
•• 19911991--33 425 L DNAPL removed425 L DNAPL removed
•• 19981998 KMnOKMnO44 experimentexperiment
Estimated PCE remaining 1998:Estimated PCE remaining 1998: 350 L (200 L in aquifer and 150 in350 L (200 L in aquifer and 150 in aquitardaquitard))
9x9 m Cell9x9 m Cell

9x9 m Cell Borden, ON 9x9 m Cell9x9 m Cell
Borden, ONBorden, ON

81 cm81 cm
61 cm61 cm

Iron-Bentonite(IB) Slurry
IronIron--BentoniteBentonite (IB) Slurry(IB) Slurry

Iron-BentoniteMixing Process IronIron--BentoniteBentonite Mixing ProcessMixing Process
•• IB slurry delivered IB slurry delivered to subsurface to subsurface through drill rodsthrough drill rods
•• Mixing blades were Mixing blades were raised and lowered raised and lowered several times to several times to homogenize regionhomogenize region
•• Tapered blades Tapered blades prevented materials prevented materials from surfacingfrom surfacing

Location of Mixed ZonesLocation of Mixed ZonesLocation of Mixed Zones
MZ1 (5% IB)MZ1 (5% IB)
MZ2 (10% IB)MZ2 (10% IB)
MZ3 (5% Ben.)MZ3 (5% Ben.)
MZ4 (5% IB)MZ4 (5% IB)
(m(m bgsbgs)) 00
3 3 –– 44
7.57.5
11.511.5 Sand Microbeds
Fractures
9x9 m Cell9x9 m Cell
Surficial Aquifer
Aquitard
Lower Aquifer
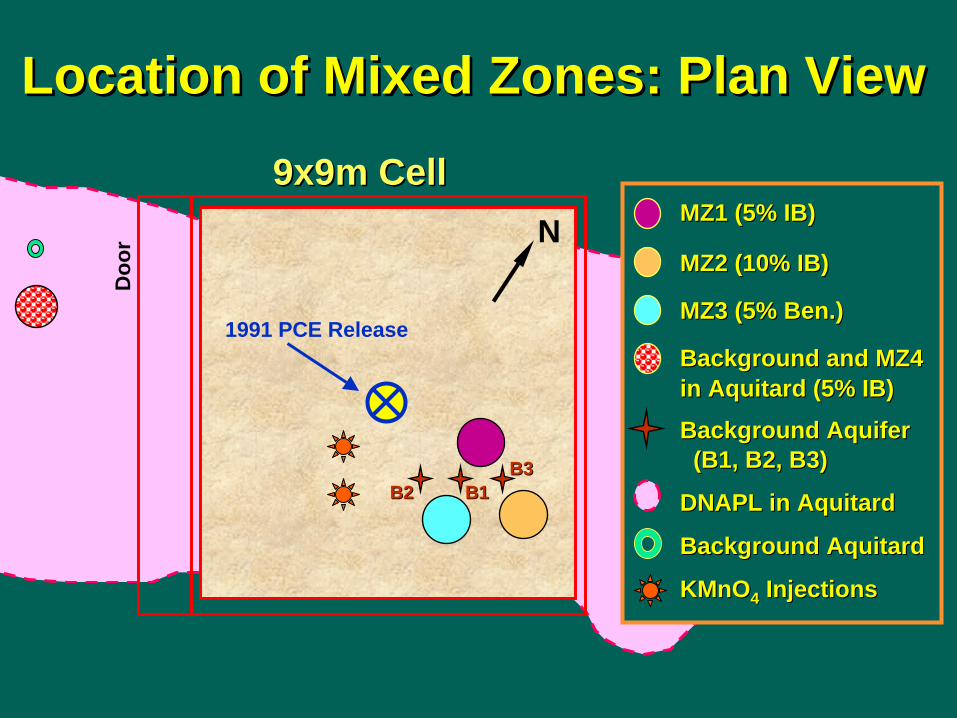
Location of Mixed Zones: Plan ViewLocation of Mixed Zones: Plan ViewLocation of Mixed Zones: Plan View
9x9m Cell9x9m Cell D
oor
MZ1 (5% IB)MZ1 (5% IB)
MZ2 (10% IB)MZ2 (10% IB)
MZ3 (5% Ben.)MZ3 (5% Ben.)
Background and MZ4 Background and MZ4 in Aquitard (5% IB)in Aquitard (5% IB)
Background AquiferBackground Aquifer (B1, B2, B3)(B1, B2, B3)
DNAPL in AquitardDNAPL in Aquitard
Background AquitardBackground Aquitard
KMnOKMnO44 InjectionsInjections
N
B2B2 B1B1 B3B3
1991 PCE Release

Field Sampling & AnalysesField Sampling & AnalysesField Sampling & Analyses Coring at SiteCoring at Site •• Soil samples were Soil samples were
stored in methanol and stored in methanol and acetonitrileacetonitrile
Laboratory AnalysesLaboratory Analyses •• GC/ECD analyses for GC/ECD analyses for
PCE and TCEPCE and TCE
•• GC/PID analyses for GC/PID analyses for VC and DCE isomersVC and DCE isomers
•• Combination electrode Combination electrode for Clfor Cl- analysesanalyses

Iron Distribution in AquiferIron Distribution in AquiferIron Distribution in Aquifer
Mixing Zone 2Mixing Zone 2 (10% Iron(10% Iron--bentonite)bentonite)
⇒⇒ wellwell--mixed but not homogenizedmixed but not homogenized
6.5 ft6.5 ft 7.0 ft7.0 ft

0.0
0.5
1.0
1.5
2.0
2.5
3.0
3.5
0 1 10 100 1,000 10,000
B1
B2
B3
Aquifer PCE ConcentrationsAquifer PCE ConcentrationsAquifer PCE ConcentrationsD
epth
(m b
gs)
Dep
th (m
bgs
)
Concentration (Concentration (µµg PCE / g soil)g PCE / g soil)
(Background)(Background)(Background)
DNAPL
B1B1
B2B2 B3B3
B2 nearB2 near centrecentre of of 9x9m Cell9x9m Cell
B3 near sheetB3 near sheet--piling wallpiling wall

0.0
0.5
1.0
1.5
2.0
2.5
3.0
3.5
0 1 10 100 1,000 10,000
Day 0
Day 39
Day 101
Day 404
Mixing Zone #1 Mixing Zone #1 Mixing Zone #1 D
epth
(m b
gs)
Dep
th (m
bgs
)(5% Iron-bentonite)(5% Iron(5% Iron--bentonite)bentonite)
Mixing Lim
itsM
ixing Limits
DNAPL
Concentration (Concentration (µµg PCE / g soil)g PCE / g soil)
tt½½ = 368 hrs= 368 hrs (normalized to (normalized to
1 m1 m22 Fe / ml solutionFe / ml solution
PCE ConcentrationsPCE ConcentrationsPCE Concentrations

0.0
0.5
1.0
1.5
2.0
2.5
3.0
3.5
0 1 10 100 1,000
Day 0
Day 35
Day 97
Day 400
Mixing Zone #2 Mixing Zone #2 Mixing Zone #2 (10% Iron-bentonite)(10% Iron(10% Iron--bentonite)bentonite)
Dep
th (m
bgs
)D
epth
(m b
gs)
Mixing Lim
itsM
ixing Limits
DNAPL
Concentration (Concentration (µµg PCE / g soil)g PCE / g soil)
PCE ConcentrationsPCE ConcentrationsPCE Concentrations

0.0
0.5
1.0
1.5
2.0
2.5
3.0
3.5
0 1 10 100 1,000 10,000
Day 0
Day 35
Day 97
Day 400
Mixing Zone #3 Mixing Zone #3 Mixing Zone #3 (Control - 0% Iron, 5% Bentonite)(Control (Control -- 0% Iron, 5% Bentonite)0% Iron, 5% Bentonite) D
epth
(m b
gs)
Dep
th (m
bgs
)
Mixing Lim
itsM
ixing Limits
DNAPL
Concentration (Concentration (µµg PCE / g soil)g PCE / g soil)
PCE ConcentrationsPCE ConcentrationsPCE Concentrations

Degradation Products in the AquiferDegradation Products in the AquiferDegradation Products in the Aquifer TCE and DCE isomersTCE and DCE isomers •• Total DCE in ironTotal DCE in iron--mixed zones < 0.5 mixed zones < 0.5 µµgg VOC / g soilVOC / g soil •• TCE was detected in background and mixedTCE was detected in background and mixed--zoneszones
ChlorideChloride •• Uncontaminated aquifer measures 1Uncontaminated aquifer measures 1--3 mg/L3 mg/L •• Background cores in 9x9m Cell 100Background cores in 9x9m Cell 100--300 mg/L300 mg/L •• Amounts detected in ironAmounts detected in iron--mixed zones did not mixed zones did not
correspond to PCE degradationcorrespond to PCE degradation –– Possibly due to nearby KMnOPossibly due to nearby KMnO44 experimentexperiment
•• Therefore, could not confirm PCE degradationTherefore, could not confirm PCE degradation

Cell Experiment: ObjectivesCell Experiment: ObjectivesCell Experiment: Objectives
•• Examine DNAPL disappearance Examine DNAPL disappearance using a substantial amount of freeusing a substantial amount of free--phase PCE, and under conditions in phase PCE, and under conditions in which the degradation process which the degradation process could be examined more reliably could be examined more reliably than the field demonstrationthan the field demonstration

ConstructionConstructionConstruction GasGas--ventingventing
valvevalve
Composition:Composition: PVC pipe andPVC pipe and plate weldedplate welded
10 side ports10 side ports (1.5 cm diameter)(1.5 cm diameter)
28 c
m28
cm
30 cm ID30 cm ID

AssemblyAssemblyAssembly •• Borden sand, Borden sand, BaroidBaroid
BensealBenseal®® bentonite, and bentonite, and Master Builder mediumMaster Builder medium--fine granular ironfine granular iron
•• Distilled water mixed Distilled water mixed until saturateduntil saturated
•• FreeFree--phase PCE (dyed phase PCE (dyed red with Sudan IV)red with Sudan IV)
•• Cell was packed and Cell was packed and sealed as quickly as sealed as quickly as possiblepossible
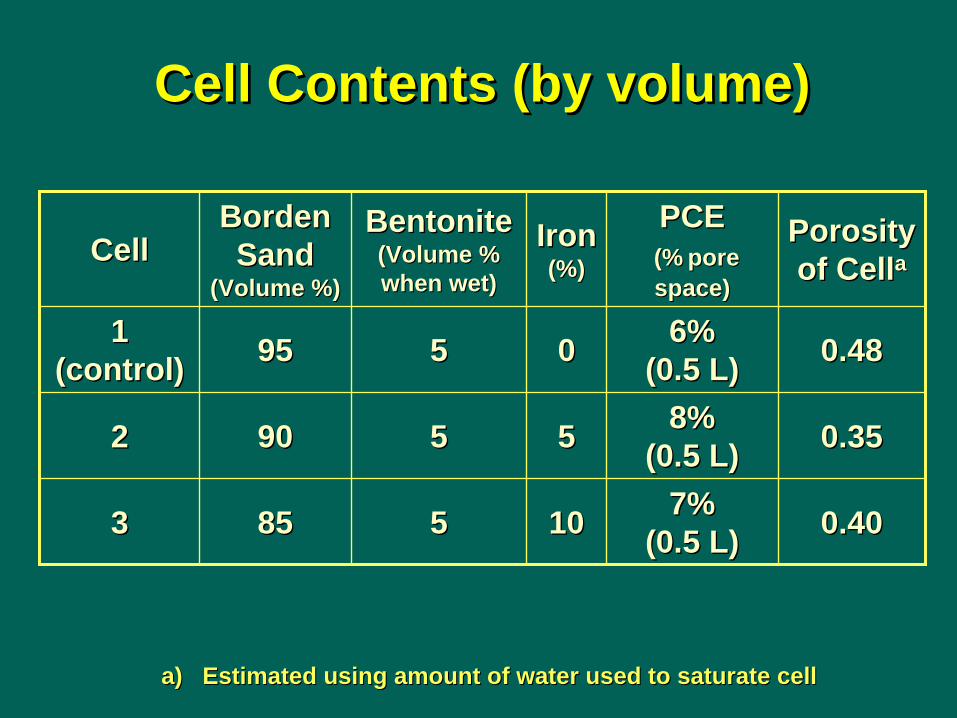
Cell Contents (by volume)Cell Contents (by volume)Cell Contents (by volume)
0.400.407%7% (0.5 L)(0.5 L)101055858533
8%8% (0.5 L)(0.5 L)
6%6% (0.5 L)(0.5 L)
PCE PCE (%(% pore pore space)space)
0.350.355555909022
0.480.48005595951 1 (control)(control)
Porosity Porosity of of CellCellaa
Iron Iron (%)(%)
BentoniteBentonite (Volume % (Volume % when wet)when wet)
Borden Borden SandSand
(Volume %)(Volume %) CellCell
a) a) Estimated using amount of water used to saturate cellEstimated using amount of water used to saturate cell

Sampling ProcedureSampling ProcedureSampling Procedure
Cored from Cored from side:side:
Shallow, Central Shallow, Central and Deep portsand Deep ports
1 2
3
4
5
6 7
8
9
1030 cm30 cm 28 cm28 cm

Sampling ProcedureSampling ProcedureSampling Procedure
Cored from Cored from side:side:
Shallow, Central Shallow, Central and Deep portsand Deep ports
1 2
3
4
5 30 cm30 cm
4 samples taken from each port:4 samples taken from each port:
28 cm28 cm
Analyses:Analyses: PCE, TCE PCE, TCE
DCE isomersDCE isomers Vinyl ChlorideVinyl Chloride
ChlorideChloride 11stst & 3& 3rdrd stored in methanolstored in methanol
22ndnd & 4& 4thth stored in acetonitrilestored in acetonitrile
11 3322 44

0
5,000
10,000
15,000
20,000
25,000
0 200 400 600 800 1000 1200
Shallow Port (18 cm*) Central Port (11 cm*) Deep Port (3 cm*) Average
Cell 1 (Control) PCE Concentrations
Cell 1 (Control) Cell 1 (Control)PCE ConcentrationsPCE Concentrations
Elapsed Time (days)Elapsed Time (days)
Con
cent
ratio
n (
Con
cent
ratio
n ( µµ
g PC
E / g
soi
l)g
PCE
/ g s
oil)
DNAPL
* Port height above base* Port height above base

0
5,000
10,000
15,000
20,000
25,000
0 200 400 600 800 1000 1200
Shallow Port (17 cm*) Central Port (11 cm*) Deep Port (4 cm*) Average
Cell 2 (5% Fe) PCE Concentrations
Cell 2 (5% Fe) Cell 2 (5% Fe)PCE ConcentrationsPCE Concentrations
Elapsed Time (days)Elapsed Time (days)
DNAPL
Con
cent
ratio
n (
Con
cent
ratio
n ( µµ
g PC
E / g
soi
l)g
PCE
/ g s
oil)
70% removed70% removed70% removed
* Port height above base* Port height above base

0
5,000
10,000
15,000
20,000
25,000
0 200 400 600 800 1000 1200
Shallow Port (18 cm*) Central Port (11 cm*) Deep Port (4 cm*) Average
Cell 3 (10% Fe)PCE Concentrations
Cell 3 (10% Fe)Cell 3 (10% Fe)PCE ConcentrationsPCE Concentrations
Elapsed Time (days)Elapsed Time (days)
DNAPL Con
cent
ratio
n (
Con
cent
ratio
n ( µµ
g PC
E / g
soi
l)g
PCE
/ g s
oil)
96% removed96% removed96% removed
* Port height above base* Port height above base

0
10,000
20,000
30,000
40,000
50,000
0 200 400 600 800 1000 1200
Cell 1 Cell 2 Cell 3
Chloride ConcentrationsChloride ConcentrationsChloride Concentrations
Elapsed Time (days)Elapsed Time (days)
Con
cent
ratio
n (
Con
cent
ratio
n ( m
g/l
mg/
l ))
0% iron0% iron
5% iron5% iron
10% iron10% iron

Organic Degradation ProductsOrganic Degradation ProductsOrganic Degradation Products
•• Total degradation products measured less than Total degradation products measured less than 1% of original PCE added to cells1% of original PCE added to cells
•• TCE was main product detected (<100 TCE was main product detected (<100 µµg/g soil)g/g soil)
•• DCE isomers generally less than 2 DCE isomers generally less than 2 µµg/g soil, but g/g soil, but showed regular trendsshowed regular trends
•• VC only detected briefly in cells with ironVC only detected briefly in cells with iron –– None detected at end of experimentNone detected at end of experiment

Conclusions: Laboratory Experiments
Conclusions:Conclusions: Laboratory ExperimentsLaboratory Experiments
Batch experiment:Batch experiment: •• Batch experiment showed that concept is Batch experiment showed that concept is
viableviable
•• HalfHalf--life was relatively low, possibly due to life was relatively low, possibly due to continuous mixing ofcontinuous mixing of hypovialshypovials
Cell experiment:Cell experiment:
•• Experiment using larger cells showed Experiment using larger cells showed removal of more significant amounts of freeremoval of more significant amounts of free--phase PCEphase PCE

Conclusions: Field Demonstration
Conclusions:Conclusions: Field DemonstrationField Demonstration
•• Degradation of PCE was apparent, despite Degradation of PCE was apparent, despite limited DNAPL and irregularity of limited DNAPL and irregularity of degradation productsdegradation products
•• Longer halfLonger half--life due to static conditions of life due to static conditions of testtest
•• Field testing at a larger scale with Field testing at a larger scale with commercial soilcommercial soil--mixing equipment mixing equipment appears to be warrantedappears to be warranted
AcknowledgementsAcknowledgementsAcknowledgements
NSERC / Motorola / EnviroMetal TechnologiesNSERC / Motorola / EnviroMetal Technologies Industrial Research Chair in Groundwater RemediationIndustrial Research Chair in Groundwater Remediation
GeomatrixGeomatrix Graduate ScholarshipGraduate Scholarship
The Gillham GroupThe Gillham Group Greg Friday, Wayne NobleGreg Friday, Wayne Noble
Others in the field and laboratoryOthers in the field and laboratory Paul Johnson, Paul Johnson, IngletonIngleton, Mike , Mike PollicePollice, Sam Vales, Sam Vales
Iain Iain McIlwraithMcIlwraith, , AlpaAlpa JadejaJadeja, Geoffrey , Geoffrey OkwiOkwi Bob Bob