laboration in automatic control · · 2018-04-25laboration in automatic control control of an...
TRANSCRIPT

Laboration in Automatic Control
Control of an inverted pendulum
This version: March 9, 2012
REGLERTEKNIK
AUTOMATIC CONTROL
LINKÖPING
Name:
P-number:
Date:
Passed:


Contents1 Introduction 1
2 Description of the system 3
3 Simulation environment 43.1 Model . . . . . . . . . . . . . . . . . . . . . . . . . . . . . . . 43.2 Using the simulation model . . . . . . . . . . . . . . . . . . . 43.3 Limitations . . . . . . . . . . . . . . . . . . . . . . . . . . . . 5
4 Simulation without feedback 6
5 State feedback 7
6 Feedback from cart position 8
7 Robusthetsanalys 107.1 Theoretical robustness analysis . . . . . . . . . . . . . . . . . 117.2 Robustness-analysis through simulation . . . . . . . . . . . . . 11
8 Feedback from cart position and pendulum angle 12
9 Non minimum phase system 14
10 Extra assignment: LQ-optimization 15
11 Preparation Assignments 16
A Useful Matlab commands 19
B Derivation of the state space model 20

1 IntroductionThe aim with this laboratory exercise is to show that state-space modelsand state feedback are useful, and sometimes even necessary, to control somesystems.
As an example of a control problem that is very difficult without state-space models, this lab session will use a simulation model of a so-calledinverted pendulum. An example of an inverted pendulum is shown in Fig-ure 1. This problem is indeed motivated from real life. The systems shownin Figure 2 can both be seen as examples of the problem with inverted pen-dulums. If the output is the angle of the pendulum relative to the verticalaxis (in upright position), we realize that the system is unstable, since thependulum will fall down if we release it with a small angle. To stabilize thesystem, i.e., to keep the pendulum in upright position, a feedback controlsystem must be used.
The goal with this lab session is to design a control system that keepsthe pendulum in upright position. In the first part of the lab session we willassume that all the states can be measured, while in the second part, onlythe cart position is measurable. In the last part it is assumed that both cartposition and pendulum angle can be measured.
Figure 1: Inverted pendulum.
1

(a) MAXUS 1, Kiruna (b) Segway R© PT
Figure 2: Examples of real systems that behave as inverted pendulums.Figure 2(a): Rocket MAXUS 1 in starting position, Esrange Space Cen-ter, Kiruna, picture from the open image gallery of Rymdbolagetfoto, SSC[2011]. Figure 2(b): Segway R© Personal Transporter (PT), a self-balancingvehicle, picture from the open image gallery of Segway Inc. [2011].
2

2 Description of the systemThe inverted pendulum can be described with the figure below.
x=0 x
FM
l
m
θ
Figure 3: Description of the inverted pendulum.
With the notation x – cart position, θ – pendulum angle and F – appliedforce, the system can be described with the equations
(M +m)x+mlθ cos θ −mlθ2 sin θ = F (1)lθ + x cos θ − g sin θ = −fθθ (2)
where M and m denotes the cart and pendulum mass, respectively, l thependulum length, g the gravitational constant and fθ the friction coefficientfor the link where the pendulum is attached to the cart. A short derivationof the equations can be found in Appendix B.
With the following state variablesx1 = x, x2 = x, x3 = θ, x4 = θ
and some calculations, this yields the state space equationsx1 = x = x2
x2 = x = −mg sin x3 cosx3 +mlx24 sin x3 + fθmx4 cosx3 + F
M + (1− cos2 x3)mx3 = θ = x4
x4 = (M +m)(g sin x3 − fθx4)− (lmx24 sin x3 + F ) cosx3
l(M + (1− cos2 x3)m)
(3)
3

3 Simulation environment
3.1 ModelThe system will be simulated in Simulink, and the simulation model to usein the first part of the lab session is shown in Figure 4.
States
L0
ScalingReference signal
F
x
v
th
w
Fapp
Pendulum Input
−L
Feedbackgain
Figure 4: Simulink model.
3.2 Using the simulation model• Start Matlab and type
initcourse TSRTXX (with XX=12, 15 or 19)syst1in the command window in order to set the correct search path andopen the Simulink model.
• Write load penddata to load the necessary variables.
• The simulation is started by selecting Start from the Simulationmenu.
• As the simulation starts, an animation that shows the motion of thependulum and the cart is started. See Figure 5.
• The simulation time can be modified using Configuration Parame-ters in the Simulation menu. The initial simulation time is 10 sec-onds.
• The initial state of the system is
x(0) = (0 0 0.2 0)T
4

i.e., at t = 0 the cart is resting at x = 0 while the pendulum has aslope of 0.2 radians. The initial values of the cart position and pen-dulum position can be modified by changing the variables x0 and th0,respectively.
−0.5 −0.4 −0.3 −0.2 −0.1 0 0.1 0.2 0.3 0.4 0.5
Figure 5: Animation of the movement of the cart and pendulum.
The simulation model uses the nonlinear differential equations, i.e., thesimulated system is nonlinear. The feedback will however be calculated fromthe linearized model from Preparation Assignment 1 and 2. The matrices A,B and C are among the variables loaded above.
3.3 LimitationsThe simulation model has two additional nonlinearities, namely limitationson the cart movement and the applied force. For the cart position we havethat
−xlim ≤ x1(t) ≤ xlim
where xlim is 0.5. In practice this means that the cart can only move betweentwo stops as in Figure 5. The control signal to the system is the applied force,and in practice it will be generated by, e.g., an electric motor. From physicalreasons the force that can be applied is limited,
−Fsat ≤ F (t) ≤ Fsat
where Fsat has the value 24. This means that the calculated and the appliedcontrol signal will be different when the calculated control signal is outsidethe interval above. The block Input in the simulation model shows theapplied control signal.
5

4 Simulation without feedbackIn this section the pendulum will be simulated without any feedback. Theaim is to understand the physical meaning of the state variables. Initially allelements of the feedback vector L are zero. This means that no feedback isapplied.
Assignment:
• Simulate the model using the given initial states and compare the ani-mation and the graphs that are generated by the block States. Com-bine the four graphs and the variables cart position, cart velocity, pen-dulum angle and pendulum angular velocity.
• Modify the initial states and see how this affects the behavior of thesystem. The initial values of the states can be chosen by assigning val-ues to the variables x0, v0, th0 and w0 respectively. Try, for example,to start the system in one of its equilibrium points.
• The matrix A has been obtained by linearization of the nonlinear modelwhen the pendulum is in the upright position. Compute the eigenvaluesof the matrix and compare the result to the behavior of the system.Similarly the matrix A2 has been obtained by linearization when thependulum is in the down position. Compare the eigenvalues and thebehavior of the system.
Hints:
• Use Preparation Assignments 1-3.
Summary of results and observations:
6
5 State feedbackIn this section it is assumed that all state variables can be measured exactly,i.e. without any measurement disturbances. The aim is to design a stabilizingfeedback under these conditions.
Assignment:
• Design a stabilizing controller by directly placing the poles of the feed-back system.
• Determine the limitations that affect the performance of the closed loopsystem.
Hints:
• The only variable that has to be modified is the state feedback vectorL.
• A pole placement feedback can be computed with the Matlab commandacker. Use help acker to see the syntax.
• Place, for example, all poles in −α. Try different values of α in orderto obtain different performance of the closed loop system.
• In this case it is enough to place all poles on the real axis.
• Check that the system has the original initial states.
• Use preparation assignment 4.
Summary of results and observations:
7

6 Feedback from cart positionIn this part, the pendulum is to be stabilized when only the state x1 canbe measured, i.e., the cart position. Intuitively this means that the pendu-lum must be kept in upright position without ”knowing” which angle thependulum has.
The simulation model to use is shown in Figure 6 and it is opened bytyping syst2. The model has been modified to include an observer, wherethe available measured signal x1 and the applied control signal are used toestimate the states of the system. The measurement of the cart positionalso includes a measurement disturbance, which is created by the block de-noted Measurement disturbance. The measurement disturbance consistsof identically distributed random numbers in the interval [−10−3, 10−3]. Apossible source for the disturbance would be a limited resolution in the sensorthat measures the cart position. The block denoted Sensor contains a scalefactor, representing the transformation from position to voltage. The scalefactor is initially set to one.
1.0
Sensor
L0
ScalingReference signal
F
x
v
th
w
Fapp
Pendulum
x’ = Ax+Bu y = Cx+Du
Observer
Mux
Measurementdisturbance
Input
−L
Feedbackgain
Estimation error
Demux
Figure 6: Simulink model with feedback from the cart position.
8

Assignment:
• Design a stabilizing controller where only the cart position is used inthe feedback.
• Determine the limitations in the achievable performance of the observerand how these affect the closed loop system.
Hints:
• Change the initial pendulum angle th0 to 0.1 rad.
• Use a state feedback vector L that corresponds to closed loop poles inthe “middle” of the interval for λ that was determined in the previoussection.
• Place, for example, the poles of the observer in −µ. Try different valuesof µ in order to get different performance of the observer.
• The observer gain can be computed with the acker function, by writ-ing K=acker(A’,C’,p)’ where the row vector p contains the desiredeigenvalues for the observer.
• The properties of the estimation error can be studied by opening theblock Estimation error which plots the vector x(t).
• Use preparation assignment 5.
Summary of results and observations:
9

7 RobusthetsanalysIn this section the robustness of the designed control system will be analyzed.This means that we will investigate how much the model and the true systemcan differ before the true closed loop system becomes unstable. The problemwill be studied for the case when the properties of the sensor measuring thecart position are not known exactly. In the model it has been assumed thatthe constant that converts position to voltage is equal to one, and the goalhere is to investigate how much the true constant can deviate from this value.
Mathematically, we have matrices A, B och C, and associated transferfunction G(s)
Y (s) = G(s)U(s)
where U represent force on the cart and Y is position according to the sensor.An error in this sensor means that the true system is represented by
Y (s) = G0(s)U(s) = (1 + α)G(s)U(s)
where α represent the deviation of the sensor constant from the value 1.The feedback previously derived based on state-feedback is based on es-
timated states and can be described in state-space form as
U(s) = Fr(s)R(s)− Fy(s)Y (s)
whereFy(s) = L(sI − A+KC +BL)−1K
andFr(s) = 1− L(sI − A+KC +BL)−1B
and A,B och C are the matrices in the state-space model and L och Khave been computed using pole-placement. The task now is to investigaterobustness with respect to the error in the sensor constant.
10

7.1 Theoretical robustness analysisUppgifter:
• Use MATLAB to derive the transfer function G(s) from A, B och C.
• Use MATLAB to derive the transfer function Fy(s) based on A, B, C,K och L.
• Derive how large the error in the sensor constant can be, while stillguaranteeing stability according to the robustness criteria.
Hints:
• Use Preparation Assignments 6 and 7.
Result:
7.2 Robustness-analysis through simulationUppgifter:
• Decide, by simulation, an upper bound on how large the error in thesensor constant can be.
Tips:
• The sensor constant in the model syst2 can be modified by changingthe constant in the block denoted Sensor.
Result:
11
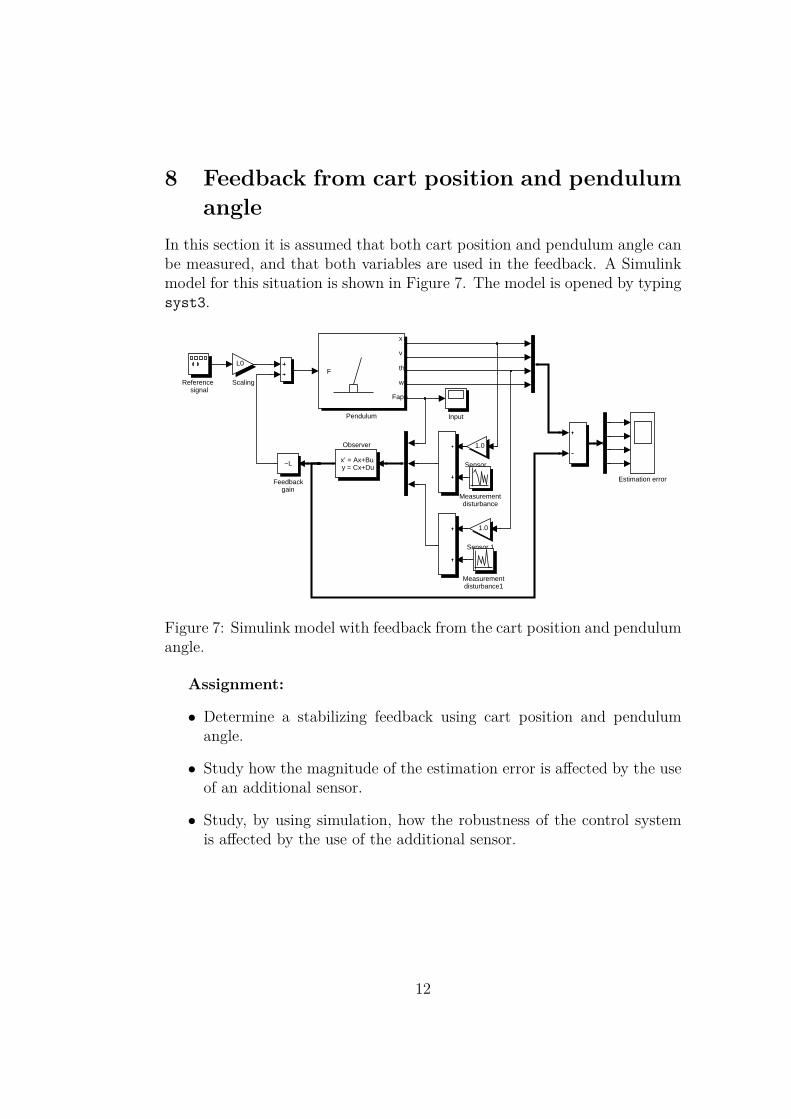
8 Feedback from cart position and pendulumangle
In this section it is assumed that both cart position and pendulum angle canbe measured, and that both variables are used in the feedback. A Simulinkmodel for this situation is shown in Figure 7. The model is opened by typingsyst3.
1.0
Sensor 1
1.0
Sensor
L0
ScalingReference signal
F
x
v
th
w
Fapp
Pendulum
x’ = Ax+Bu y = Cx+Du
Observer
Measurementdisturbance1
Measurementdisturbance
Input
−L
Feedbackgain
Estimation error
Demux
Figure 7: Simulink model with feedback from the cart position and pendulumangle.
Assignment:
• Determine a stabilizing feedback using cart position and pendulumangle.
• Study how the magnitude of the estimation error is affected by the useof an additional sensor.
• Study, by using simulation, how the robustness of the control systemis affected by the use of the additional sensor.
12

Hints:
• The pendulum system will now have two outputs. The C-matrix musttherefore be modified. Use preparation assignment 8.
• The gain in an observer using more than one measured signal can becomputed using the function place. The function requires that thepoles of the observer are different.
Summary of results and observations:
13

9 Non minimum phase systemThis assignment is compulsory for TSRT12 and optional for TSRT15and TSRT19.
Assume here that all state variables can be measured, i.e. use the Simu-link model syst1.
Assignment:Verify that the closed loop system, if the cart position is the output, is
non-minimum phase.Hints:
• What are the characteristics of a non-minimum phase system?
Summary of results and observations:
14

10 Extra assignment: LQ-optimizationThis assignment is compulsory for TSRT12 and optional for TSRT15and TSRT19.
Assume here that all state variables can be measured, i.e. use the Simu-link model syst1.
Assignment:
• Determine a state feedback using linear quadratic optimization. Trydifferent weight matrices in the quadratic criterion and observe howthe choice affects the properties of the closed loop system.
• Investigate how the poles of the closed loop system are affected by thechoice of weight matrices.
Hints:
• The state feedback vector obtained using LQ-optimization can be com-puted using the function lqr.
• Try, initially, to put weight on the cart position and input signal only.
15

11 Preparation AssignmentsTo complete the laboration, the following assigments must be completed.Also study the connection between these assignments and the assignmentsin the laboration using the “hints” that are given on the previous pages.
1. For a nonlinear system given by the state space model
x = f(x, u)
all points (x0, u0) that satisfy
f(x0, u0) = 0
are denoted stationary points (equilibrium points). Verify that allpoints
x0 =
00
n · π0
u0 = F = 0
where n is an integer, are stationary points for the nonlinear systemgiven by Equation (3).
2. The nonlinear state-space equations can be found in Equation (3). Asan alternative to the normal linearization procedure, the linear modelcan in this case be obtained by introducing the approximations
sin x3 = x3, cosx3 = 1, x24 = 0, x3x4 = 0
Verify that this results in a feedback model of the form
x = Ax+Bu
where
A =
0 1 0 00 0 −a b0 0 0 10 0 c −d
, B =
0e0−f
3. Use the linearized model in the previous exercise. Insert the numerical
values
M = 2.4, m = 0.23, l = 0.36, fθ = 0.1, g = 9.81
What is A and B?
16

4. For a controllable system, state feedback can place the poles of thefeedback system arbitrarily. What will in practice prevent you frommaking the feedback system arbitrarily fast?
5. For an observable system, the poles of the observer can be placed ar-bitrarily. What will in practice prevent you from making the observerarbitrarily fast?
6. Suppose that a system is described by the model G(s), while the truesystem is given by
G0(s) = (1 + α)G(s)where α is a constant, with | α |< αmax. What relative model error doesthis correspond to, and what requirement according to the robustnesscriterion does this give for the absolute value of the complementarysensitivity function of the feedback system? How can this criterion bechecked using Matlab?
7. (a) Assume that a state-space model is given by
x(t) = Ax(t) +Bu(t)y(t) = Cx(t)
The transfer function G(s) is then
G(s) = C(sI − A)−1B
Write down how you derive the transfer function by the Matlabfunctions ss and tf.
(b) State-space control based on estimated states can, for the caser(t) = 0, be written
˙x(t) = (A−KC −BL)x(t) +Ky(t)u(t) = −Lx(t)
and in transfer function form
U(s) = −Fy(s)Y (s)
whereFy(s) = L(sI − A+KC +BL)−1K
Write down how you derive the transfer function Fy(s) by theMatlab functions ss tf. (Hint: compare to the form in (a). Canyou see what the different matrices corresponds to here?)
17

8. Assume that both cart position and pendulum angle can be measured,i.e. the measurement signals are given by
y1(t) = x1(t)
andy2(t) = x3(t)
respectively. Assume that the measured signal are collected in thevector
y(t) =(y1(t)y2(t)
)Determine the matrix C in the expression
y(t) = Cx(t)
9. What do the Matlab commands in Appendix A do?
18

A Useful Matlab commands
eig Compute eigenvaluesacker Compute a pole placement feedback vectorss Generate a state-space LTI objecttf Generate a transfer function LTI objectbode Draw a bode diagrambodemag Draw the amplitude curve of the bode diagramnyquist Draw a Nyquist diagrampole Compute polestzero Compute zerosplace Compute a pole placement feedback matrix
19

B Derivation of the state space modelThe state space equations of the inverted pendulum can be derived from theLagrange-equation
d
dt
[∂
∂qL]− ∂
∂qL = τ
where L denotes the Lagrange-function L = K − V with K and V being thekinetic and potential energy, respectively. For the inverted pendulum, thekinetic energy is given by
K = 12Mx2 + 1
2m((x+ lθ cos θ
)2+(lθ sin θ
)2)
while the potential energy is given byV = mgl cos θ
This gives the equations(M +m)x+mlθ cos θ −mlθ2 sin θ = F
lθ + x cos θ − g sin θ = −fθθwhere the term fθθ describes the friction in the rotational link of the pendu-lum.
By selecting the state variables asx1 = x, x2 = x, x3 = θ, and x4 = θ
we get the equationsx1 = x = x2
x2 = x = ml
M +m
(x2
4 sin x3 − x4 cosx3)
+ F
M +m
x3 = θ = x4
x4 = θ = 1l
(− x2 cosx3 − fθx4 + g sin x3
)(4)
These equations contain a so-called algebraic loop, since x2 depends on x4and x4 in turn depends on x2. By eliminating this dependence, we finally getthe nonlinear state equations
x1 = x = x2
x2 = x = −mg sin x3 cosx3 +mlx24 sin x3 + fθmx4 cosx3 + F
M + (1− cos2 x3)mx3 = θ = x4
x4 = (M +m)(g sin x3 − fθx4)− (lmx24 sin x3 + F ) cosx3
l(M + (1− cos2 x3)m)
(5)
20

ReferencesSegway Inc. Rymdbolaget (Swedish Space Cooperation), bilddatabasen,2011. URL: http://www.segway.com/about-segway/media-center/product-photos.php, nedladdad 2011-03-11.
SSC. Rymdbolaget (Swedish Space Cooperation), bilddatabasen, 2011. URL:http://www.ssc.se/images.aspx, nedladdad 2011-03-11.
21