labor market outcomes - wvhepc.org · labor market outcomes this report provides a snapshot of the...
TRANSCRIPT

Dropout Prevention through
Early Warning Indicators:
A Current Distribution in
West Virginia Schools
Robert Balfanz
Vaughan Byrnes
November 2010
Labor Market Outcomes

2
Labor Market Outcomes TABLE OF CONTENTS
1. Prior Research ...............................................................................3
2. Methods & Data.............................................................................5
3. Sixth Grade ....................................................................................7
4. Ninth Grade .................................................................................17
5. Twelfth Grade Diplomas ............................................................27
6. Districts ........................................................................................28
7. References ....................................................................................30

3
Labor Market Outcomes This report provides a snapshot of the 2008-09 school year‟s individual student level data
for the 6th
and 9th
graders across the state of West Virginia. In particular, it focuses on indicators
of students‟ academic behaviors: attendance rates, behavioral problems (e.g., suspension, other
disciplinary actions), and course marks (course failure or GPA). It then examines how 6th
and 9th
grade students exhibiting key behavioral warning signs that have been shown by research in
other states and districts to be good predictors of future dropout are distributed across the state‟s
schools in concentration and number. The purpose of examining the distribution of students with
these academic behaviors is to identify which schools most need additional resources in order to
reduce the number of dropouts state-wide. In addition, we identify the high schools where the
lowest proportions of 12th
graders receive diplomas. Finally, the report examines the
concentration of students with early warning indicators at the district level. The research in this
report was funded by and conducted in conjunction with the National Governors Association
Center for Best Practices dropout prevention and recovery state grants.
PRIOR RESEARCH
This study was theory-driven, building on prior research on the predictors of a dropout
outcome. While dropout rates are considerably higher among some demographic groups than
others (e.g., high poverty, Hispanic and Black, those with parents who did not complete high
school, those with siblings who have dropped out), Gleason and Dynarski (2002) have shown
that demographic factors do not efficiently predict which students will drop out. A more
promising focus for developing early warning indicators relies on the theoretical construct of
student engagement in schooling (e.g., Fredricks, Blumenfeld, & Paris, 2004) that has guided
much of the research on dropping out. Engagement has emotional, behavioral, and cognitive
components, which are sometimes classified as social and academic engagement (e.g., Wehlage,
et al., 1989). Engagement is itself influenced by individual student background, as well as by the
institutions (family and community, as well as the school itself) within which the individual
student is placed (Rumberger & Lim, 2008).
A variety of factors may influence the student to begin a process of disengagement with
schooling, a psychological process that generally manifests itself behaviorally in absenteeism,
failure to complete assignments, and failure to pass courses. While many of the factors leading to
student disengagement are not school-related, the behavioral indicators of student disengagement
leading to a dropout outcome, such as attendance and course failure, manifest themselves
directly at school and can be more readily influenced by school practitioners. In the nation‟s
“dropout factories” (Balfanz & Legters, 2004), mostly minority student U.S. high schools where
50 percent or more of students do not make it from ninth to twelfth grade on time, average daily
attendance rates of 80 percent or less are an overwhelming daily reality. Low levels of
attendance are a strong predictor of course failure, and course failure in ninth grade is a strong
predictor of dropping out (Allensworth & Easton, 2007; Finn, 1989; Lan & Lanthier, 2003; Lee
& Burkham, 2003; Neild & Balfanz, 2006a, 2006b; Neild, 2009; Roderick & Camburn, 1999;
Schargel & Smink, 2001). Balfanz, Herzog, and Mac Iver (2007) have shown that these
4
Labor Market Outcomes behaviors manifested in sixth grade (attendance, a record of misbehavior, or course failure in
English or mathematics) predict roughly half of eventual dropouts.
Early indicators of dropout are powerful tools at the K-12 level because they can
potentially alert educators to students who need some level of intervention to stay on track to
graduation. Identifying the relevant indicators is just a first step, and the step that is arguably the
easiest. Indicators do no good if they are not followed up by action and further assessment to see
whether the actions taken have helped to keep students on-track to graduation. However,
appropriate action depends in part on a robust set of early warning indicators. A strong indicator
set has several characteristics:
1. They are empirically created. Powerful indicators are identified based on
analysis of longitudinal data that tracks individual student progress over time. In
essence, indicators use the experience of previous cohorts to intervene when
students in subsequent cohorts begin to show behaviors associated with dropout
among their elder siblings.
2. They are simple and easily collected. Early warning indicators use readily
available data that are typically maintained by schools – variables such as grades,
attendance, and behavior in the classroom. They do not necessarily require
complex statistical modeling techniques or access to data from surveys or
interviews.
3. The set of indicators has been refined to include a few key variables. In
indicator systems, a few key indicators are easier for teachers to monitor than a
large set of predictors. K-12 analyses have demonstrated that although the
underlying issues that produced the poor grade or weak attendance may be
complex and may vary from student to student, there are a small number of flags
that alerts educators to a student potentially falling off-track. By extension, a
good indicator system also identifies variables that are not the strongest predictors
of eventual dropout.
4. They capture the majority of students who eventually become dropouts. A
good indicator system avoids the “1% problem,” or indicators that are highly
predictive but only identify a small percentage of dropouts.

5
Labor Market Outcomes The research cited above has identified several key indicators across multiple districts
and states. For 9th
grade these typically include:
Attendance below 85%;
Two or more suspensions or serious disciplinary incidents;
Two or more semester course failures;
Failing a Mathematics course; and/or
Failing an English Language Arts course.
For the 6th
grade these typically include:
Attendance below 90%;
One or more suspensions or serious disciplinary incidents;
One or more semester course failures;
Failing a Mathematics course; and/or
Failing an English Language Arts course.
Indicators at the 9th
grade level require lower cut-off levels given that all students tend to
struggle more when making the transition to the 9th
grade and high school. For example, 9th
graders have lower attendance and more course failures, on average, than 6th graders. Thus in
the middle grades where most students remain on-track, students who are the most likely to
dropout in later years can be identified by more modest signs of disengagement.
METHODS & DATA
The research cited above employed model based methods, such as logistic regression
modeling, to determine which factors were the most related to the outcome of a dropout event on
the part of students. Using longitudinal analyses that tracked cohorts of students (first time 9th
graders, 8th
graders, or as early as 6th
grade in some samples), these studies determined which
factors were the most significant in predicting future dropout events and what the effects were on
a student‟s odds (or odds-ratio) of dropping out versus graduating on-time if a student should fall
below a specific threshold level for several key factors. These studies have consistently
determined that students‟ in-school behaviors (attendance, discipline, and course marks) were
more predictive than either demographic factors or achievement scores from standardized tests.
As a result of these findings, many districts and states are developing Early Warning Systems
using administrative data to identify students who exhibit these key off-track indicators in order
to target them for intervention programs in efforts to stem the dropout problem in their regions.
The descriptive summaries below were based upon student level data taken from the
2008-09 school year for the state of West Virginia. The data were provided by the West Virginia

6
Labor Market Outcomes Department of Education from their state-wide management information system that serves all
schools and school districts in the state. The sample included data for 21,244 6th
grade students,
25,315 9th
grade students, as well as 20,315 12th
graders, for a total of 66,874 students across the
three grades. For all tables below listing schools and districts by name, institutional educational
programs and schools for the deaf and the blind were excluded.
The majority of tables in the report list the 25 schools with the most students displaying a
given indicator. The rationale behind such tables was to show what percent of students with the
various early warning signs are a) concentrated in a relatively few schools, b) how this varied by
indicator, and c) the extent to which these were the same or different schools for each indicator,
all of which provides important insights for planning an effective and efficient response. Some
tables additionally list some smaller schools where fewer numbers of students displayed a given
indicator but where the overall percentages of students with the indicator were high enough to
consider the school as being „at risk‟.

7
Labor Market Outcomes ACADEMIC BEHAVIOR INDICATORS IN THE 6
TH GRADE
The sample of data for 6th
grade included 21,244 6th
grade students, as well as 223
schools with the 6th
grade. For each of the key indicators, Table 1 shows the overall percentage
of students state-wide with that indicator during the 2008-09 school year. The table also shows
the percentage of all 223 schools to have certain numbers of students with each indicator. For
schools where fewer numbers of students are exhibiting early warning indicators, ie: 10-50
students, this represents schools where problems are small enough that interventions could be
handled by one to two dedicated staff members. However in schools where 50 or more students
exhibit early warning signs, this represents a challenge large enough in scope to require the
implementation of whole school reforms.
Table 1 – Overall State-Wide Rates of 6th
Grade Students with Key Indicators
Attendance
<90%
>=1
ISS/OSS
Fail >=1
Courses
Fail
Math
Fail
English
>=2 of all
Indicators
% of all 6th
Grade
Students (N = 21,244) 20% 18% 10% 5% 4% 13%
% of All Schools with
0 students with
Indicator
9% 10% 29% 39% 93% 17%
% of All Schools with
10 or more students
with Indicator
59% 54% 28% 13% 12% 38%
% of All Schools with
25 or more students
with Indicator
29% 27% 13% 4% 3% 16%
% of All Schools with
50 or more students
with Indicator
8% 8% 4% 1% 0% 4%
% of All Schools with
75 or more students
with Indicator
1% 1% 1% 0% 0% 1%
% of All Schools with
100 or more students
with Indicator
0% <1% 0% 0% 0% 0%
8
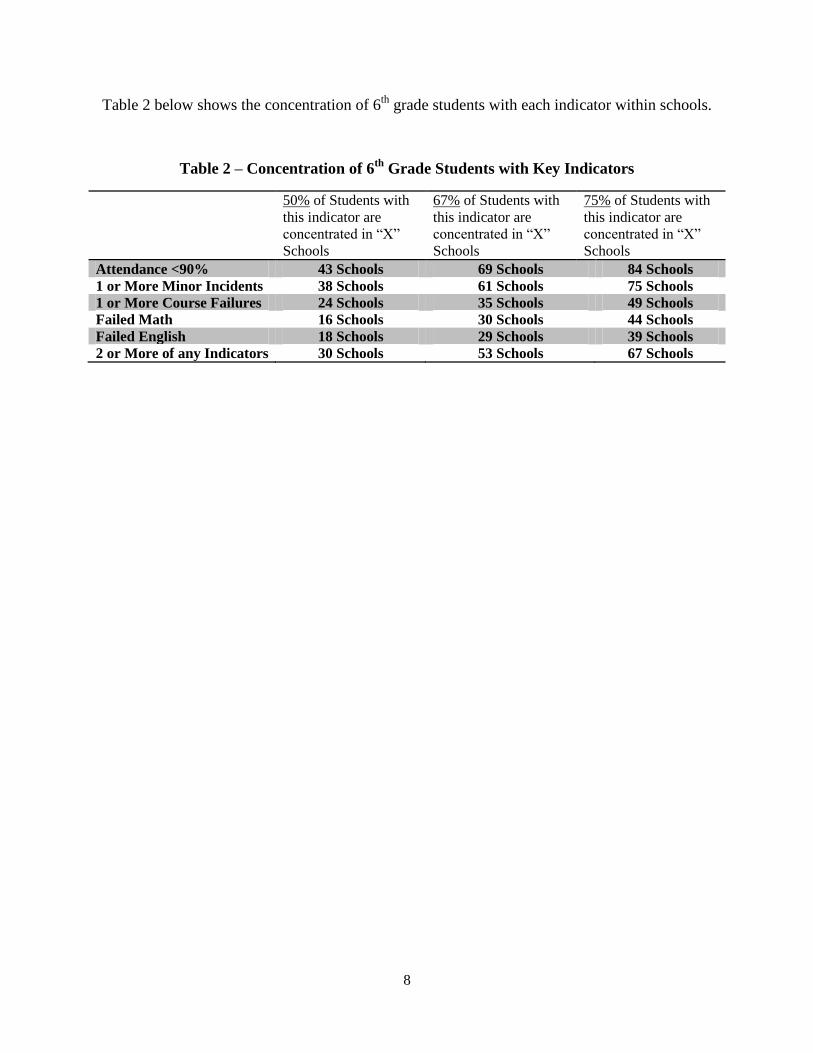
Labor Market Outcomes Table 2 below shows the concentration of 6
th grade students with each indicator within schools.
Table 2 – Concentration of 6th
Grade Students with Key Indicators
50% of Students with
this indicator are
concentrated in “X”
Schools
67% of Students with
this indicator are
concentrated in “X”
Schools
75% of Students with
this indicator are
concentrated in “X”
Schools Attendance <90% 43 Schools 69 Schools 84 Schools
1 or More Minor Incidents 38 Schools 61 Schools 75 Schools
1 or More Course Failures 24 Schools 35 Schools 49 Schools
Failed Math 16 Schools 30 Schools 44 Schools
Failed English 18 Schools 29 Schools 39 Schools
2 or More of any Indicators 30 Schools 53 Schools 67 Schools

9
Labor Market Outcomes Attendance has proven to be the driving factor in getting students back on-track to
graduation, ahead of other academic indicators. When students attend school more, their
behavior improves and their failures rates decrease with increased class attendance and work
completion. Thus, efforts directed towards attendance rates can also lead to indirect
improvements in the other indicators of behavior and course marks.
Table 3 – 25 Schools with the Most Students Attending Under 90%
SCHOOL DISTRICT NUMBER OF
STUDENTS
% OF
STUDENTS
6th
GRADE
ENROLLMENT
MOUNT VIEW HS MCDOWELL COUNTY 62 48% 128 ROBERT BLAND MS LEWIS COUNTY 66 36% 185 MAN MS LOGAN COUNTY 43 35% 124 MADISON MS BOONE COUNTY 71 31% 226 COLLINS MIDDLE FAYETTE COUNTY 58 29% 202 BLUEFIELD MS MERCER COUNTY 57 29% 197 WAYNE MS WAYNE COUNTY 48 28% 170 BECKLEY-STRATTON MS RALEIGH COUNTY 65 27% 241 HUNTINGTON MS CABELL COUNTY 58 27% 217 RIPLEY MS JACKSON COUNTY 67 26% 260 PRINCETON MS MERCER COUNTY 56 26% 215 SUMMERSVILLE MS NICHOLAS COUNTY 51 26% 199 HORACE MANN MS KANAWHA COUNTY 45 26% 172 SISSONVILLE MS KANAWHA COUNTY 43 26% 168 MARTINSBURG SOUTH BERKELEY COUNTY 80 25% 324 ELKVIEW MS KANAWHA COUNTY 61 25% 246 WASHINGTON IRVING HARRISON COUNTY 60 24% 253 BEVERLY HILLS MS CABELL COUNTY 47 23% 204 MUSSELMAN MS BERKELEY COUNTY 97 22% 451 MARTINSBURG NORTH BERKELEY COUNTY 50 22% 225 LOGAN MS LOGAN COUNTY 45 21% 211 ANDREW JACKSON MS KANAWHA COUNTY 53 19% 281 B-U MS UPSHUR COUNTY 51 19% 267 EDISON MS WOOD COUNTY 45 19% 236 EASTERN GREENBRIER GREENBRIER COUNTY 43 16% 270
ADDITIONAL AT RISK SCHOOLS (FEWER NUMBERS OF STUDENTS BUT HIGH OVERALL PERCENTAGES)
FORT GAY MS WAYNE COUNTY 22 37% 59 GLADE MS WEBSTER COUNTY 19 37% 52 SANDY RIVER MS MCDOWELL COUNTY 32 33% 97 DUVAL PK-8 LINCOLN COUNTY 25 33% 75 FAYETTEVILLE ES FAYETTE COUNTY 34 32% 106 CEDAR GROVE MS KANAWHA COUNTY 22 32% 69 ASHTON ES MASON COUNTY 17 32% 53 WHEELING MS OHIO COUNTY 20 31% 64 SOUTHSIDE K-8 MCDOWELL COUNTY 17 31% 55

10
Labor Market Outcomes
Behavioral indicators are often the first sign of falling off-track, emerging before drops in
attendance rate or increase in course failures. Students often begin to show behavioral issues,
such as increase in suspensions, years prior to dropping out, whereas their attendance and course
marks tend not to experience dramatic declines until the year(s) immediately preceding a dropout
event. Increases in disciplinary incidents can represent the beginning of a student‟s
disengagement from school, where a student whose attendance and course marks begin to slide
may already be highly disengaged from the system.
Table 4 – 25 Schools with the Most Students with 1 or More In-School or Out-of-School
Suspensions
SCHOOL DISTRICT NUMBER OF
STUDENTS
% OF
STUDENTS
6th
GRADE
ENROLLMENT
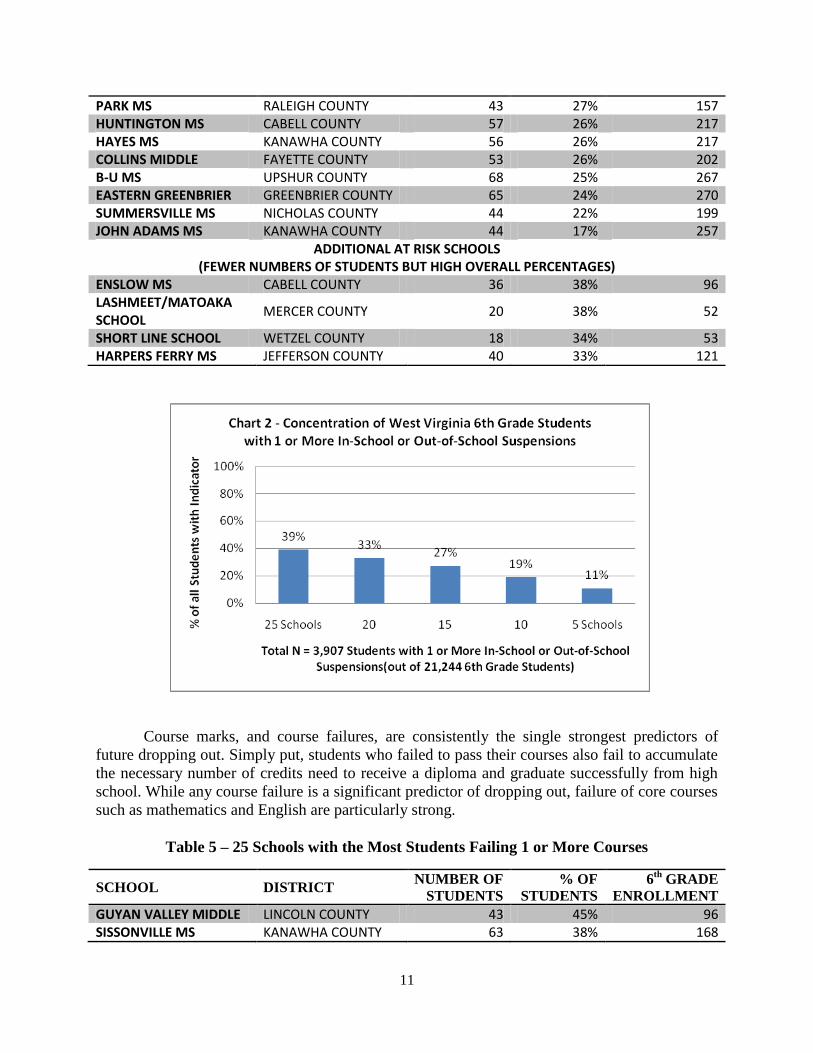
EAST BANK MS KANAWHA COUNTY 71 51% 139 VAN DEVENDER MS WOOD COUNTY 54 41% 133 MOUNT VIEW HS MCDOWELL COUNTY 51 40% 128 BLUEFIELD MS MERCER COUNTY 75 38% 197 WEIR MS HANCOCK COUNTY 57 38% 151 WESTERN GREENBRIER GREENBRIER COUNTY 47 38% 123 SISSONVILLE MS KANAWHA COUNTY 60 36% 168 MAN MS LOGAN COUNTY 45 36% 124 STONEWALL JACKSON KANAWHA COUNTY 56 33% 169 CAPON BRIDGE MS HAMPSHIRE COUNTY 46 32% 146 MOUNTAINEER MS HARRISON COUNTY 43 31% 140 MADISON MS BOONE COUNTY 66 29% 226 MARTINSBURG SOUTH BERKELEY COUNTY 91 28% 324 MARTINSBURG NORTH BERKELEY COUNTY 64 28% 225 MUSSELMAN MS BERKELEY COUNTY 124 27% 451 WASHINGTON IRVING HARRISON COUNTY 68 27% 253 BECKLEY-STRATTON MS RALEIGH COUNTY 66 27% 241
11
Labor Market Outcomes PARK MS RALEIGH COUNTY 43 27% 157 HUNTINGTON MS CABELL COUNTY 57 26% 217 HAYES MS KANAWHA COUNTY 56 26% 217 COLLINS MIDDLE FAYETTE COUNTY 53 26% 202 B-U MS UPSHUR COUNTY 68 25% 267 EASTERN GREENBRIER GREENBRIER COUNTY 65 24% 270 SUMMERSVILLE MS NICHOLAS COUNTY 44 22% 199 JOHN ADAMS MS KANAWHA COUNTY 44 17% 257
ADDITIONAL AT RISK SCHOOLS (FEWER NUMBERS OF STUDENTS BUT HIGH OVERALL PERCENTAGES)
ENSLOW MS CABELL COUNTY 36 38% 96 LASHMEET/MATOAKA SCHOOL
MERCER COUNTY 20 38% 52
SHORT LINE SCHOOL WETZEL COUNTY 18 34% 53 HARPERS FERRY MS JEFFERSON COUNTY 40 33% 121
Course marks, and course failures, are consistently the single strongest predictors of
future dropping out. Simply put, students who failed to pass their courses also fail to accumulate
the necessary number of credits need to receive a diploma and graduate successfully from high
school. While any course failure is a significant predictor of dropping out, failure of core courses
such as mathematics and English are particularly strong.
Table 5 – 25 Schools with the Most Students Failing 1 or More Courses
SCHOOL DISTRICT NUMBER OF
STUDENTS
% OF
STUDENTS
6th
GRADE
ENROLLMENT
GUYAN VALLEY MIDDLE LINCOLN COUNTY 43 45% 96 SISSONVILLE MS KANAWHA COUNTY 63 38% 168

12
Labor Market Outcomes BECKLEY-STRATTON MS RALEIGH COUNTY 87 36% 241 MARTINSBURG NORTH BERKELEY COUNTY 69 31% 225 ROBERT BLAND MS LEWIS COUNTY 56 30% 185 MOUNT VIEW HS MCDOWELL COUNTY 39 30% 128 WASHINGTON IRVING HARRISON COUNTY 69 27% 253 HUNTINGTON MS CABELL COUNTY 57 26% 217 BEVERLY HILLS MS CABELL COUNTY 53 26% 204 PARK MS RALEIGH COUNTY 40 25% 157 HORACE MANN MS KANAWHA COUNTY 37 22% 172 HAYES MS KANAWHA COUNTY 46 21% 217 B-U MS UPSHUR COUNTY 50 19% 267 INDEPENDENCE MS RALEIGH COUNTY 36 19% 189 RIPLEY MS JACKSON COUNTY 48 18% 260 MADISON MS BOONE COUNTY 40 18% 226 COLLINS MIDDLE FAYETTE COUNTY 37 18% 202 MUSSELMAN MS BERKELEY COUNTY 76 17% 451 MARTINSBURG SOUTH BERKELEY COUNTY 54 17% 324 WEST FAIRMONT MS MARION COUNTY 30 17% 172 HAMILTON MS WOOD COUNTY 30 17% 181 MILTON MS CABELL COUNTY 30 14% 216 ANDREW JACKSON MS KANAWHA COUNTY 37 13% 281 HEDGESVILLE MS BERKELEY COUNTY 31 13% 238 ELKVIEW MS KANAWHA COUNTY 28 11% 246
13
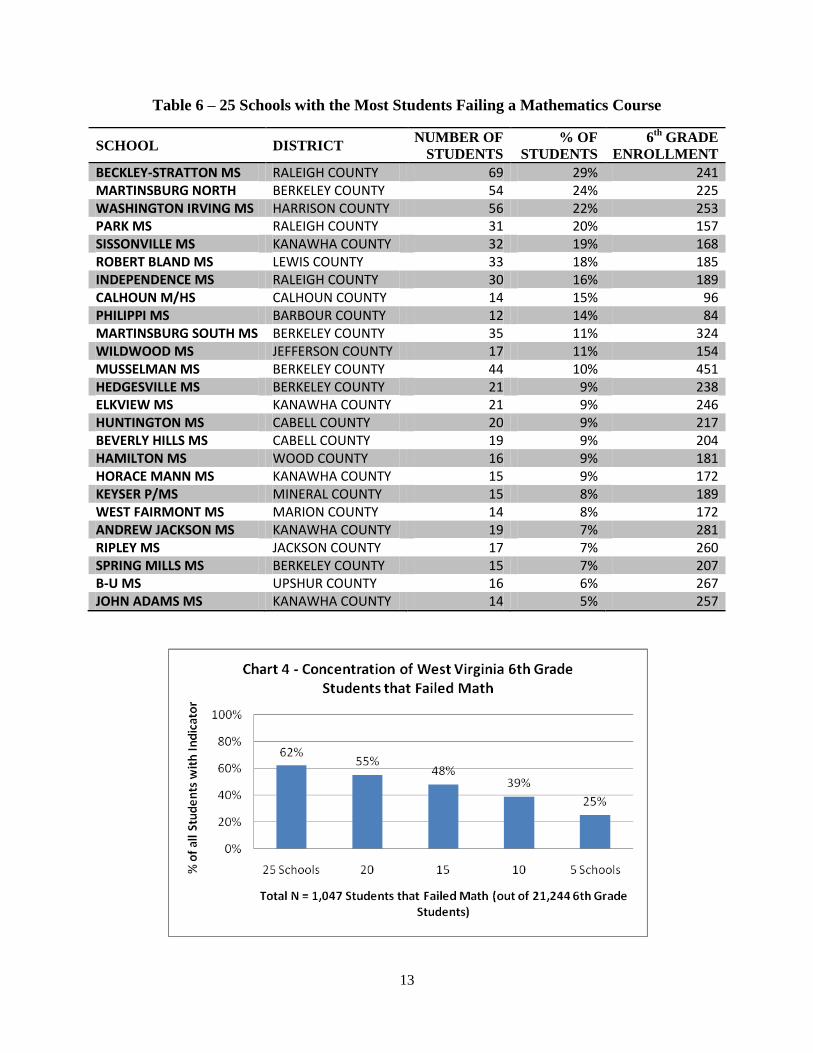
Labor Market Outcomes Table 6 – 25 Schools with the Most Students Failing a Mathematics Course
SCHOOL DISTRICT NUMBER OF
STUDENTS
% OF
STUDENTS
6th
GRADE
ENROLLMENT
BECKLEY-STRATTON MS RALEIGH COUNTY 69 29% 241 MARTINSBURG NORTH BERKELEY COUNTY 54 24% 225 WASHINGTON IRVING MS HARRISON COUNTY 56 22% 253 PARK MS RALEIGH COUNTY 31 20% 157 SISSONVILLE MS KANAWHA COUNTY 32 19% 168 ROBERT BLAND MS LEWIS COUNTY 33 18% 185 INDEPENDENCE MS RALEIGH COUNTY 30 16% 189 CALHOUN M/HS CALHOUN COUNTY 14 15% 96 PHILIPPI MS BARBOUR COUNTY 12 14% 84 MARTINSBURG SOUTH MS BERKELEY COUNTY 35 11% 324 WILDWOOD MS JEFFERSON COUNTY 17 11% 154 MUSSELMAN MS BERKELEY COUNTY 44 10% 451 HEDGESVILLE MS BERKELEY COUNTY 21 9% 238 ELKVIEW MS KANAWHA COUNTY 21 9% 246 HUNTINGTON MS CABELL COUNTY 20 9% 217 BEVERLY HILLS MS CABELL COUNTY 19 9% 204 HAMILTON MS WOOD COUNTY 16 9% 181 HORACE MANN MS KANAWHA COUNTY 15 9% 172 KEYSER P/MS MINERAL COUNTY 15 8% 189 WEST FAIRMONT MS MARION COUNTY 14 8% 172 ANDREW JACKSON MS KANAWHA COUNTY 19 7% 281 RIPLEY MS JACKSON COUNTY 17 7% 260 SPRING MILLS MS BERKELEY COUNTY 15 7% 207 B-U MS UPSHUR COUNTY 16 6% 267 JOHN ADAMS MS KANAWHA COUNTY 14 5% 257
14
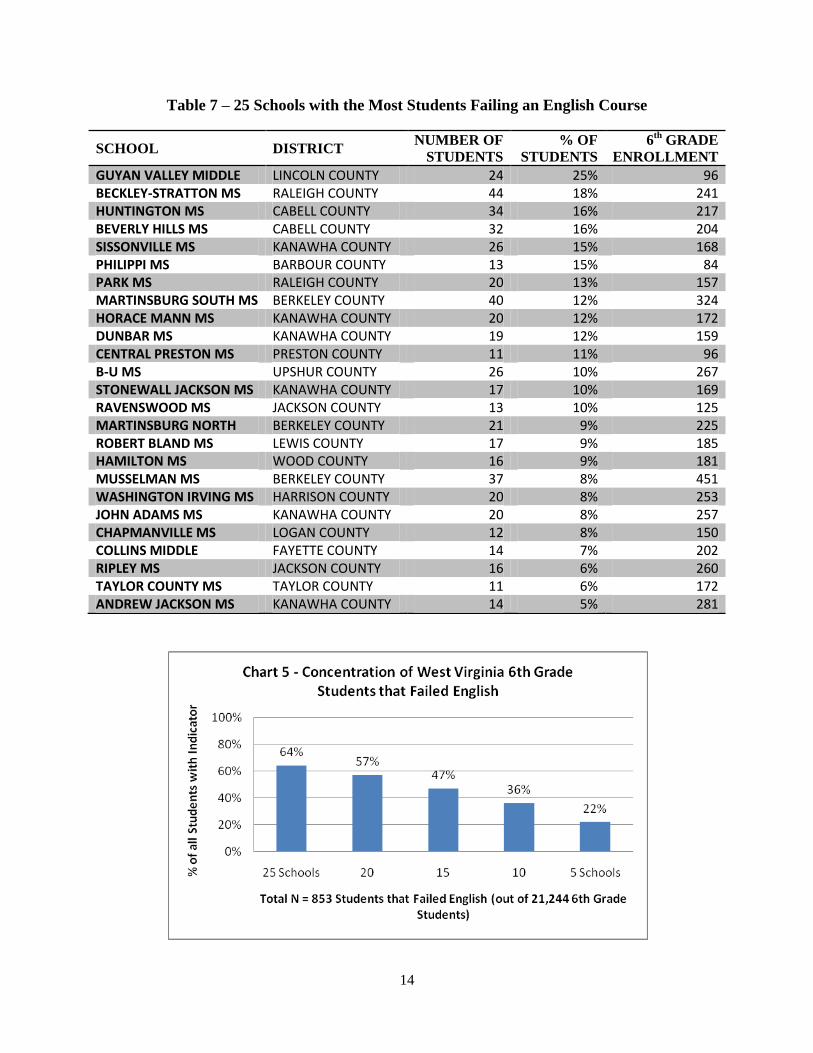
Labor Market Outcomes Table 7 – 25 Schools with the Most Students Failing an English Course
SCHOOL DISTRICT NUMBER OF
STUDENTS
% OF
STUDENTS
6th
GRADE
ENROLLMENT
GUYAN VALLEY MIDDLE LINCOLN COUNTY 24 25% 96 BECKLEY-STRATTON MS RALEIGH COUNTY 44 18% 241 HUNTINGTON MS CABELL COUNTY 34 16% 217 BEVERLY HILLS MS CABELL COUNTY 32 16% 204 SISSONVILLE MS KANAWHA COUNTY 26 15% 168 PHILIPPI MS BARBOUR COUNTY 13 15% 84 PARK MS RALEIGH COUNTY 20 13% 157 MARTINSBURG SOUTH MS BERKELEY COUNTY 40 12% 324 HORACE MANN MS KANAWHA COUNTY 20 12% 172 DUNBAR MS KANAWHA COUNTY 19 12% 159 CENTRAL PRESTON MS PRESTON COUNTY 11 11% 96 B-U MS UPSHUR COUNTY 26 10% 267 STONEWALL JACKSON MS KANAWHA COUNTY 17 10% 169 RAVENSWOOD MS JACKSON COUNTY 13 10% 125 MARTINSBURG NORTH BERKELEY COUNTY 21 9% 225 ROBERT BLAND MS LEWIS COUNTY 17 9% 185 HAMILTON MS WOOD COUNTY 16 9% 181 MUSSELMAN MS BERKELEY COUNTY 37 8% 451 WASHINGTON IRVING MS HARRISON COUNTY 20 8% 253 JOHN ADAMS MS KANAWHA COUNTY 20 8% 257 CHAPMANVILLE MS LOGAN COUNTY 12 8% 150 COLLINS MIDDLE FAYETTE COUNTY 14 7% 202 RIPLEY MS JACKSON COUNTY 16 6% 260 TAYLOR COUNTY MS TAYLOR COUNTY 11 6% 172 ANDREW JACKSON MS KANAWHA COUNTY 14 5% 281

15
Labor Market Outcomes Table 8 below shows the schools with the largest number of students to have two or more
of any of the five key indicators: Attendance under 90%; one or more suspensions; failed one or
more courses; failed math; and failed English.
Table 8 – 25 Schools with the Most Students with 2 or More Key Indicators
SCHOOL DISTRICT NUMBER OF
STUDENTS
% OF
STUDENTS
6th
GRADE
ENROLLMENT
BECKLEY-STRATTON MS RALEIGH COUNTY 93 39% 241 SISSONVILLE MS KANAWHA COUNTY 59 35% 168 MOUNT VIEW HS MCDOWELL COUNTY 45 35% 128 MARTINSBURG NORTH BERKELEY COUNTY 72 32% 225 WASHINGTON IRVING HARRISON COUNTY 77 30% 253 ROBERT L. BLAND MS LEWIS COUNTY 51 28% 185 PARK MS RALEIGH COUNTY 43 27% 157 HUNTINGTON MS CABELL COUNTY 56 26% 217 HORACE MANN MS KANAWHA COUNTY 42 24% 172 BEVERLY HILLS MS CABELL COUNTY 47 23% 204 MADISON MS BOONE COUNTY 47 21% 226 COLLINS MIDDLE FAYETTE COUNTY 43 21% 202 MUSSELMAN MS BERKELEY COUNTY 91 20% 451 MARTINSBURG SOUTH BERKELEY COUNTY 65 20% 324 B-U MIDDLE SCHOOL UPSHUR COUNTY 54 20% 267 INDEPENDENCE MS RALEIGH COUNTY 38 20% 189 WILDWOOD MS JEFFERSON COUNTY 31 20% 154 RIPLEY MS JACKSON COUNTY 47 18% 260 HAYES MS KANAWHA COUNTY 40 18% 217 WEST FAIRMONT MS MARION COUNTY 31 18% 172 BLUEFIELD MS MERCER COUNTY 31 16% 197 ANDREW JACKSON S KANAWHA COUNTY 42 15% 281 HEDGESVILLE MS BERKELEY COUNTY 33 14% 238 ELKVIEW MS KANAWHA COUNTY 33 13% 246 JOHN ADAMS MS KANAWHA COUNTY 33 13% 257
ADDITIONAL AT RISK SCHOOLS (FEWER NUMBERS OF STUDENTS BUT HIGH OVERALL PERCENTAGES)
GUYAN VALLEY MIDDLE LINCOLN COUNTY 30 31% 96

16
Labor Market Outcomes
Table 9 below highlights which schools appear most frequently across all of the above
Tables 3-8 showing those with the largest numbers of students with each key indicator. The
schools listed below are probably those where intervention efforts in general could most
effectively lead to a future reduction of the dropout rate, given that they have the most students
now showing signs of disengagement of school, and most likely to dropout in the years ahead.
Table 9 – Schools that Appear Most Frequently Across All Tables
SCHOOL DISTRICT NUMBER OF
TABLES SPECIFIC TABLES
B-U MS UPSHUR COUNTY 6 A, S, F1, FM, FE, Any HUNTINGTON MS CABELL COUNTY 6 A, S, F1, FM, FE, Any MARTINSBURG NORTH BERKELEY COUNTY 6 A, S, F1, FM, FE, Any MARTINSBURG SOUTH BERKELEY COUNTY 6 A, S, F1, FM, FE, Any MUSSELMAN MS BERKELEY COUNTY 6 A, S, F1, FM, FE, Any SISSONVILLE MS KANAWHA COUNTY 6 A, S, F1, FM, FE, Any WASHINGTON IRVING HARRISON COUNTY 6 A, S, F1, FM, FE, Any ANDREW JACKSON KANAWHA COUNTY 5 A, F1, FM, FE, Any BECKLEY-STRATTON RALEIGH COUNTY 5 A, F1, FM, FE, Any BEVERLY HILLS MS CABELL COUNTY 5 A, F1, FM, FE, Any HORACE MANN MS KANAWHA COUNTY 5 A, F1, FM, FE, Any RIPLEY MS JACKSON COUNTY 5 A, F1, FM, FE, Any ROBERT BLAND MS LEWIS COUNTY 5 A, F1, FM, FE, Any PARK MS RALEIGH COUNTY 5 S, F1, FM, FE, Any COLLINS MIDDLE FAYETTE COUNTY 5 A, S, F1, FE, Any ELKVIEW MS KANAWHA COUNTY 4 A, F1. FM, Any MADISON MS BOONE COUNTY 4 A, S, F1, Any MOUNT VIEW HS MCDOWELL COUNTY 4 A, S, F1, Any

17
Labor Market Outcomes ACADEMIC BEHAVIOR INDICATORS IN THE 9
th GRADE
The sample of data for 9th
grade included 25,315 9th
grade students, as well as 162
schools with the 9th
grade. Table 10 shows the overall percent of students state-wide to have each
key indicator during the 2008-09 school-year. The table also shows the percent of all 162 schools
to have certain numbers of students with each indicator. For schools where fewer numbers of
students are exhibiting early warning indicators, ie: 10-50 students, this represents schools where
problems are small enough that interventions could be handled by one to two dedicated staff
members. However in schools where 50 or more students exhibit early warning signs, this
represents a challenge large enough in scope to require the implementation of whole school
reforms.
Table 10 – Overall State-Wide Rates of 9th
Grade Students with Key Indicators
Attendance
<85%
>=2
ISS/OSS
Fail >=2
Courses
Fail
Math
Fail
English
>=2 of all
Indicators
% of all 9th
Grade
Students (N = 25,315) 17% 15% 15% 16% 12% 19%
% of All Schools with
0 students with
Indicator
14% 9% 10% 11% 11% 9%
% of All Schools with
10 or more students
with Indicator
65% 57% 54% 52% 50% 64%
% of All Schools with
25 or more students
with Indicator
43% 31% 36% 30% 29% 43%
% of All Schools with
50 or more students
with Indicator
19% 12% 15% 17% 12% 22%
% of All Schools with
75 or more students
with Indicator
7% 8% 6% 9% 4% 10%
% of All Schools with
100 or more students
with Indicator
3% 5% 4% 4% 1% 5%
18
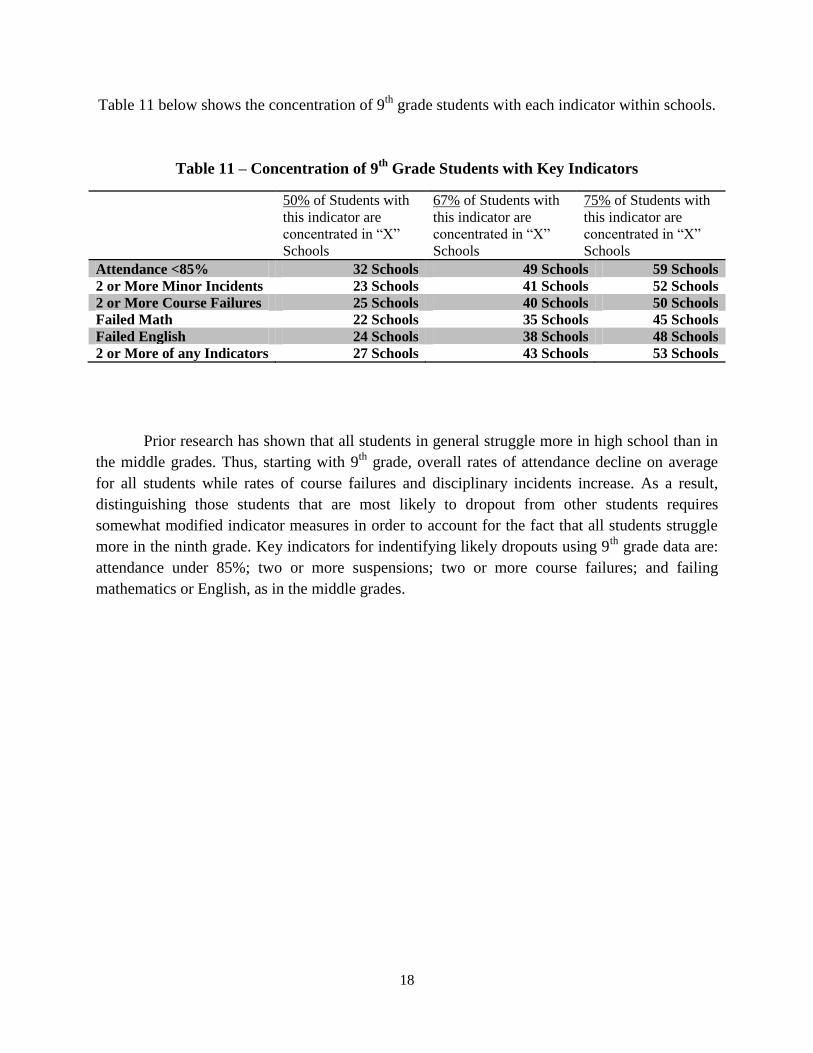
Labor Market Outcomes Table 11 below shows the concentration of 9
th grade students with each indicator within schools.
Table 11 – Concentration of 9th
Grade Students with Key Indicators
50% of Students with
this indicator are
concentrated in “X”
Schools
67% of Students with
this indicator are
concentrated in “X”
Schools
75% of Students with
this indicator are
concentrated in “X”
Schools Attendance <85% 32 Schools 49 Schools 59 Schools
2 or More Minor Incidents 23 Schools 41 Schools 52 Schools
2 or More Course Failures 25 Schools 40 Schools 50 Schools
Failed Math 22 Schools 35 Schools 45 Schools
Failed English 24 Schools 38 Schools 48 Schools
2 or More of any Indicators 27 Schools 43 Schools 53 Schools
Prior research has shown that all students in general struggle more in high school than in
the middle grades. Thus, starting with 9th
grade, overall rates of attendance decline on average
for all students while rates of course failures and disciplinary incidents increase. As a result,
distinguishing those students that are most likely to dropout from other students requires
somewhat modified indicator measures in order to account for the fact that all students struggle
more in the ninth grade. Key indicators for indentifying likely dropouts using 9th
grade data are:
attendance under 85%; two or more suspensions; two or more course failures; and failing
mathematics or English, as in the middle grades.

19
Labor Market Outcomes Attendance has proven to be the driving factor in getting students back on-track to
graduation, ahead of other academic indicators. When students attend school more, their
behavior improves and their failures rates decrease with increased class attendance and work
completion. Thus, efforts directed towards attendance rates can also lead to indirect
improvements in the other indicators of behavior and course marks.
Table 12 – 25 Schools with the Most Students Attending Under 85%
SCHOOL DISTRICT NUMBER OF
STUDENTS
% OF
STUDENTS
9th
GRADE
ENROLLMENT
SCOTT HS BOONE COUNTY 75 35% 214 WESTSIDE HS WYOMING COUNTY 64 35% 183 WAYNE HS WAYNE COUNTY 57 29% 196 RIVERSIDE HS KANAWHA COUNTY 109 26% 412 LINCOLN COUNTY HS LINCOLN COUNTY 85 25% 342 CAPITAL HS KANAWHA COUNTY 88 24% 369 LIBERTY HS HARRISON COUNTY 55 24% 230 HERBERT HOOVER HS KANAWHA COUNTY 63 23% 275 LOGAN SENIOR HS LOGAN COUNTY 55 23% 239 HUNTINGTON HS CABELL COUNTY 111 22% 495 MARTINSBURG HS BERKELEY COUNTY 136 21% 646 PRESTON HS PRESTON COUNTY 83 20% 412 ROBERT C. BYRD HS HARRISON COUNTY 55 20% 274 CABELL MIDLAND HS CABELL COUNTY 105 19% 563 PARKERSBURG HS WOOD COUNTY 102 19% 532 BROOKE HS BROOKE COUNTY 60 19% 323 SAINT ALBANS HS KANAWHA COUNTY 66 18% 369 MUSSELMAN HS BERKELEY COUNTY 78 17% 452 SPRING VALLEY HS WAYNE COUNTY 58 17% 349 SOUTH CHARLESTON KANAWHA COUNTY 57 17% 334 PARKERSBURG SOUTH WOOD COUNTY 71 16% 437 PRINCETON SENIOR HS MERCER COUNTY 53 16% 327 HEDGESVILLE HS BERKELEY COUNTY 85 15% 573 WHEELING PARK HS OHIO COUNTY 65 13% 490 MORGANTOWN HS MONONGALIA COUNTY 55 12% 474
ADDITIONAL AT RISK SCHOOLS (FEWER NUMBERS OF STUDENTS BUT HIGH OVERALL PERCENTAGES)
KANAWHA COUNTY SCHOOLS ACADEMY
KANAWHA COUNTY 40 60% 67
BIG CREEK HS MCDOWELL COUNTY 28 47% 59 TUG VALLEY HS MINGO COUNTY 52 41% 127 IAEGER HS MCDOWELL COUNTY 39 35% 110 MOUNT VIEW HS MCDOWELL COUNTY 47 33% 141 SHERMAN HS BOONE COUNTY 47 33% 142 WYOMING COUNTY EAST HS
WYOMING COUNTY 43 32% 133
MAN SENIOR HS LOGAN COUNTY 33 32% 103

20
Labor Market Outcomes
Behavioral indicators are often the first sign of falling off-track, emerging before drops in
attendance rate or increase in course failures. Students often begin to show behavioral issues,
such as increase in suspensions, years prior to dropping out, whereas their attendance and course
marks tend not to experience dramatic declines until the year(s) immediately preceding a dropout
event. Increases in disciplinary incidents can represent the beginning of a student‟s
disengagement from school, where a student whose attendance and course marks begin to slide
may already be highly disengaged from the system.
Table 13 – 25 Schools with the Most Students with 2 or More In-School or Out-of-School
Suspensions
SCHOOL DISTRICT
NUMBER
OF
STUDENTS
% OF
STUDENTS
9th
GRADE
ENROLLMENT
BLUEFIELD HS MERCER COUNTY 80 33% 239 MOUNT VIEW HS MCDOWELL COUNTY 45 32% 141 BUCKHANNON UPSHUR UPSHUR COUNTY 108 31% 349 JEFFERSON HS JEFFERSON COUNTY 102 31% 331 RAVENSWOOD HS JACKSON COUNTY 46 30% 155 RIVERSIDE HS KANAWHA COUNTY 120 29% 412 POINT PLEASANT HS MASON COUNTY 65 29% 226 WHEELING PARK HS OHIO COUNTY 137 28% 490 WASHINGTON HS JEFFERSON COUNTY 97 28% 343 LIBERTY HS HARRISON COUNTY 58 25% 230 HEDGESVILLE HS BERKELEY COUNTY 137 24% 573 CABELL MIDLAND HS CABELL COUNTY 136 24% 563 PRINCETON SENIOR HS MERCER COUNTY 78 24% 327

21
Labor Market Outcomes SISSONVILLE HS KANAWHA COUNTY 43 23% 191 SCOTT HS BOONE COUNTY 48 22% 214 MARTINSBURG HS BERKELEY COUNTY 134 21% 646 HUNTINGTON HS CABELL COUNTY 103 21% 495 WOODROW WILSON RALEIGH COUNTY 88 21% 424 CAPITAL HS KANAWHA COUNTY 79 21% 369 INDEPENDENCE HS RALEIGH COUNTY 45 20% 221 RIPLEY HS JACKSON COUNTY 61 17% 350 MUSSELMAN HS BERKELEY COUNTY 68 15% 452 JOHN MARSHALL HS MARSHALL COUNTY 54 15% 371 PARKERSBURG HS WOOD COUNTY 64 12% 532 UNIVERSITY HS MONONGALIA COUNTY 52 12% 425
ADDITIONAL AT RISK SCHOOLS (FEWER NUMBERS OF STUDENTS BUT HIGH OVERALL PERCENTAGES)
KANAWHA COUNTY SCHOOL ACADEMY
KANAWHA COUNTY 37 55% 67
Course marks, and course failures, are consistently the single strongest predictors of
future dropping out. Simply put, students who failed to pass their courses also fail to accumulate
the necessary number of credits need to receive a diploma and graduate successfully from high
school. While any course failure is a significant predictor of dropping out, failure of core courses
such as mathematics and English are particularly strong.
Table 14 – 25 Schools with the Most Students Failing 2 or More Courses
SCHOOL DISTRICT
NUMBER
OF
STUDENTS
% OF
STUDENTS
9th
GRADE
ENROLLMENT
CAPITAL HS KANAWHA COUNTY 106 29% 369

22
Labor Market Outcomes LINCOLN HS HARRISON COUNTY 55 27% 202 RIVERSIDE HS KANAWHA COUNTY 108 26% 412 SAINT ALBANS HS KANAWHA COUNTY 96 26% 369 SOUTH CHARLESTON KANAWHA COUNTY 85 25% 334 EAST FAIRMONT HS MARION COUNTY 63 25% 250 HUNTINGTON HS CABELL COUNTY 109 22% 495 NORTH MARION HS MARION COUNTY 56 22% 249 CABELL MIDLAND HS CABELL COUNTY 120 21% 563 HERBERT HOOVER HS KANAWHA COUNTY 57 21% 275 UNIVERSITY HS MONONGALIA COUNTY 86 20% 425 ROBERT C. BYRD HS HARRISON COUNTY 54 20% 274 MARTINSBURG HS BERKELEY COUNTY 124 19% 646 BUCKHANNON UPSHUR UPSHUR COUNTY 66 19% 349 ELKINS HS RANDOLPH COUNTY 55 19% 294 HEDGESVILLE HS BERKELEY COUNTY 106 18% 573 GREENBRIER EAST HS GREENBRIER COUNTY 67 18% 363 PRESTON HS PRESTON COUNTY 68 17% 412 GEORGE WASHINGTON KANAWHA COUNTY 58 17% 344 WASHINGTON HS JEFFERSON COUNTY 54 16% 343 MORGANTOWN HS MONONGALIA COUNTY 71 15% 474 SPRING VALLEY HS WAYNE COUNTY 53 15% 349 PARKERSBURG HS WOOD COUNTY 77 14% 532 PARKERSBURG SOUTH WOOD COUNTY 55 13% 437 WHEELING PARK HS OHIO COUNTY 50 10% 490

23
Labor Market Outcomes Table 15 – 25 Schools with the Most Students Failing a Mathematics Course
SCHOOL DISTRICT
NUMBER
OF
STUDENTS
% OF
STUDENTS
9th
GRADE
ENROLLMENT
ROBERT C. BYRD HS HARRISON COUNTY 87 32% 274 SAINT ALBANS HS KANAWHA COUNTY 111 30% 369 CAPITAL HS KANAWHA COUNTY 109 30% 369 SOUTH CHARLESTON KANAWHA COUNTY 97 29% 334 RIVERSIDE HS KANAWHA COUNTY 110 27% 412 HUNTINGTON HS CABELL COUNTY 119 24% 495 BUCKHANNON UPSHUR UPSHUR COUNTY 84 24% 349 EAST FAIRMONT HS MARION COUNTY 57 23% 250 HEDGESVILLE HS BERKELEY COUNTY 126 22% 573 CABELL MIDLAND HS CABELL COUNTY 122 22% 563 PARKERSBURG SOUTH WOOD COUNTY 97 22% 437 GEORGE WASHINGTON KANAWHA COUNTY 71 21% 344 MARTINSBURG HS BERKELEY COUNTY 131 20% 646 UNIVERSITY HS MONONGALIA COUNTY 85 20% 425 HERBERT HOOVER HS KANAWHA COUNTY 56 20% 275 MORGANTOWN HS MONONGALIA COUNTY 89 19% 474 HURRICANE HS PUTNAM COUNTY 67 19% 350 PARKERSBURG HS WOOD COUNTY 97 18% 532 WASHINGTON HS JEFFERSON COUNTY 63 18% 343 WHEELING PARK HS OHIO COUNTY 81 17% 490 GREENBRIER EAST HS GREENBRIER COUNTY 60 17% 363 SPRING VALLEY HS WAYNE COUNTY 59 17% 349 PRESTON HS PRESTON COUNTY 64 16% 412 WOODROW WILSON RALEIGH COUNTY 65 15% 424 MUSSELMAN HS BERKELEY COUNTY 58 13% 452

24
Labor Market Outcomes
Table 16 – 25 Schools with the Most Students Failing an English Course
SCHOOL DISTRICT NUMBER OF
STUDENTS
% OF
STUDENTS
9th
GRADE
ENROLLMENT
RAVENSWOOD HS JACKSON COUNTY 41 26% 155 CAPITAL HS KANAWHA COUNTY 85 23% 369 EAST FAIRMONT HS MARION COUNTY 57 23% 250 CABELL MIDLAND HS CABELL COUNTY 117 21% 563 SAINT ALBANS HS KANAWHA COUNTY 77 21% 369 LINCOLN HS HARRISON COUNTY 42 21% 202 HUNTINGTON HS CABELL COUNTY 97 20% 495 RIVERSIDE HS KANAWHA COUNTY 84 20% 412 SOUTH CHARLESTON HS KANAWHA COUNTY 67 20% 334 HERBERT HOOVER HS KANAWHA COUNTY 55 20% 275 ELKINS HS RANDOLPH COUNTY 57 19% 294 MARTINSBURG HS BERKELEY COUNTY 114 18% 646 NORTH MARION HS MARION COUNTY 45 18% 249 PARKERSBURG HS WOOD COUNTY 92 17% 532 GEORGE WASHINGTON KANAWHA COUNTY 56 16% 344 PRESTON HS PRESTON COUNTY 60 15% 412 GREENBRIER EAST HS GREENBRIER COUNTY 56 15% 363 BUCKHANNON UPSHUR UPSHUR COUNTY 53 15% 349 LINCOLN COUNTY HS LINCOLN COUNTY 50 15% 342 WASHINGTON HS JEFFERSON COUNTY 50 15% 343 MORGANTOWN HS MONONGALIA COUNTY 64 14% 474 UNIVERSITY HS MONONGALIA COUNTY 61 14% 425 SPRING VALLEY HS WAYNE COUNTY 44 13% 349 HEDGESVILLE HS BERKELEY COUNTY 63 11% 573 PARKERSBURG SOUTH WOOD COUNTY 40 9% 437

25
Labor Market Outcomes
Table 17 below shows the schools with the largest number of students to have two or
more of any of the five key indicators: Attendance under 85%; two or more suspensions; failed
two or more courses; failed math; and failed English.
Table 17 – 25 Schools with the Most Students with 2 or More Key Indicators
SCHOOL DISTRICT NUMBER OF
STUDENTS
% OF
STUDENTS
9th
GRADE
ENROLLMENT
RIVERSIDE HS KANAWHA COUNTY 143 35% 412 CAPITAL HS KANAWHA COUNTY 121 33% 369 SAINT ALBANS HS KANAWHA COUNTY 104 28% 369 BUCKHANNON UPSHUR UPSHUR COUNTY 93 27% 349 SOUTH CHARLESTON HS KANAWHA COUNTY 91 27% 334 ROBERT C. BYRD HS HARRISON COUNTY 75 27% 274 LIBERTY HS HARRISON COUNTY 63 27% 230 CABELL MIDLAND HS CABELL COUNTY 146 26% 563 HUNTINGTON HS CABELL COUNTY 130 26% 495 EAST FAIRMONT HS MARION COUNTY 66 26% 250 MARTINSBURG HS BERKELEY COUNTY 164 25% 646 HERBERT HOOVER HS KANAWHA COUNTY 68 25% 275 HEDGESVILLE HS BERKELEY COUNTY 139 24% 573 WASHINGTON HS JEFFERSON COUNTY 78 23% 343 ELKINS HS RANDOLPH COUNTY 64 22% 294 PRESTON HS PRESTON COUNTY 86 21% 412 PARKERSBURG HS WOOD COUNTY 109 20% 532 UNIVERSITY HS MONONGALIA COUNTY 87 20% 425 GEORGE WASHINGTON KANAWHA COUNTY 67 19% 344 PRINCETON SENIOR HS MERCER COUNTY 61 19% 327 WHEELING PARK HS OHIO COUNTY 88 18% 490 GREENBRIER EAST HHS GREENBRIER COUNTY 66 18% 363 MORGANTOWN HS MONONGALIA COUNTY 81 17% 474 PARKERSBURG SOUTH WOOD COUNTY 74 17% 437 MUSSELMAN HS BERKELEY COUNTY 62 14% 452
ADDITIONAL AT RISK SCHOOLS (FEWER NUMBERS OF STUDENTS BUT HIGH OVERALL PERCENTAGES)
KANAWHA COUNTY SCHOOLS ACADEMY
KANAWHA COUNTY 38 57% 67
RAVENSWOOD HS JACKSON COUNTY 53 34% 155

26
Labor Market Outcomes
Table 18 below highlights which schools appear most frequently across all of the above
Tables 12-17 showing those with the largest numbers of students with each key indicator. The
schools listed below are probably those where intervention efforts in general could most
effectively lead to a future reduction of the dropout rate, given that they have the most students
now showing signs of disengagement of school, and most likely to dropout in the years ahead.
Table 18 – Schools that Appear Most Frequently Across All Tables
SCHOOL DISTRICT NUMBER OF
TABLES
SPECIFIC TABLES
CABELL MIDLAND HS CABELL COUNTY 6 A,I, F2, FM, FE, Any CAPITAL HS KANAWHA COUNTY 6 A,I, F2, FM, FE, Any HEDGESVILLE HS BERKELEY COUNTY 6 A,I, F2, FM, FE, Any HUNTINGTON HS CABELL COUNTY 6 A,I, F2, FM, FE, Any MARTINSBURG HS BERKELEY COUNTY 6 A,I, F2, FM, FE, Any PARKERSBURG HS WOOD COUNTY 6 A,I, F2, FM, FE, Any RIVERSIDE HS KANAWHA COUNTY 6 A,I, F2, FM, FE, Any UNIVERSITY HS MONONGALIA COUNTY 6 A,I, F2, FM, FE, Any HERBERT HOOVER HS KANAWHA COUNTY 5 A, F2, FM, FE, Any MORGANTOWN HS MONONGALIA COUNTY 5 A, F2, FM, FE, Any PARKERSBURG SOUTH WOOD COUNTY 5 A, F2, FM, FE, Any PRESTON HS PRESTON COUNTY 5 A, F2, FM, FE, Any SAINT ALBANS HS KANAWHA COUNTY 5 A, F2, FM, FE, Any SOUTH CHARLESTON HS KANAWHA COUNTY 5 A, F2, FM, FE, Any WHEELING PARK HS OHIO COUNTY 5 A, I, F2, FM, Any WASHINGTON HS JEFFERSON COUNTY 5 I, F2, FM, FE, Any BUCKHANNON UPSHUR UPSHUR COUNTY 5 I, F2, FM, FE, Any GREENBRIER EAST HS GREENBRIER COUNTY 4 F2, FM, FE, Any ROBERT C. BYRD HS HARRISON COUNTY 4 A, F2, FM, Any MUSSELMAN HS BERKELEY COUNTY 4 A, I, FM, Any SPRING VALLEY HS WAYNE COUNTY 4 A, F2, FM, FE

27
Labor Market Outcomes PROPORTION OF 12
th GRADERS RECEIVING DIPLOMAS
The sample of data for 12th
grade included 20,315 12th
grade students, as well as 144
schools with the 12th
grade. The table below shows the high schools with the lowest percentages
of 12th
grade students enrolled in the fall that managed to receive diplomas the following spring.
Overall, 87% of 12th
grade students enrolled in 2008-09 received diplomas in the spring of the
school year.
Table 19 – 25 Schools with the Lowest Proportions of 12th
Graders Receiving Diplomas
SCHOOL DISTRICT % OF
STUDENTS
12th
GRADE
ENROLLMENT
PHILIP BARBOUR HS COMPLEX BARBOUR COUNTY 75% 210 CAPITAL HS KANAWHA COUNTY 76% 292 BLUEFIELD HS MERCER COUNTY 77% 133 MAN SENIOR HS LOGAN COUNTY 79% 118 SISSONVILLE HS KANAWHA COUNTY 79% 162 RICHWOOD HS NICHOLAS COUNTY 80% 124 SAINT ALBANS HS KANAWHA COUNTY 80% 259 PIKEVIEW HS MERCER COUNTY 80% 164 FAIRMONT SENIOR HS MARION COUNTY 81% 204 NITRO HS KANAWHA COUNTY 81% 238 SUMMERS COUNTY HS SUMMERS COUNTY 81% 112 MOUNT VIEW HS MCDOWELL COUNTY 81% 102 BUCKHANNON UPSHUR HS UPSHUR COUNTY 82% 268 GREENBRIER WEST HS GREENBRIER COUNTY 82% 111 CAMERON HS MARSHALL COUNTY 82% 73 HUNTINGTON HS CABELL COUNTY 82% 367 JAMES MONROE HS MONROE COUNTY 83% 141 LOGAN SENIOR HS LOGAN COUNTY 83% 189 WEBSTER COUNTY HS WEBSTER COUNTY 83% 114 GREENBRIER EAST HS GREENBRIER COUNTY 84% 280 MONTCALM HS MERCER COUNTY 84% 61 EAST FAIRMONT HS MARION COUNTY 84% 196 SOUTH HARRISON HS HARRISON COUNTY 84% 92 CLAY COUNTY HS CLAY COUNTY 84% 154 LEWIS COUNTY HS LEWIS COUNTY 84% 192

28
Labor Market Outcomes DISTRIBUTION OF ACADEMIC BEHAVIOR INDICATORS ACROSS DISTRICTS
The table below shows the districts in which the largest number of students displayed two or
more of the five key indicators. The numbers include students from grades 6, 9, and 12, and use
the high school level indicators: Attendance under 85%; two or more suspensions; failed two or
more courses; failed math; and failed English.
Table 20 – 25 Districts with the Most Students with 2 or More Key Indicators
DISTRICT NUMBER OF
STUDENTS
% OF
STUDENTS
6th
, 9th
, & 12th
GRADE
ENROLLMENT
CABELL COUNTY 510 18% 2903 KANAWHA COUNTY 1173 17% 6885 UPSHUR COUNTY 152 17% 884 BARBOUR COUNTY 99 16% 602 BERKELEY COUNTY 638 15% 4257 LEWIS COUNTY 96 15% 634 MARION COUNTY 259 14% 1893 JACKSON COUNTY 172 14% 1249 HARRISON COUNTY 365 13% 2730 BOONE COUNTY 133 13% 1052 RALEIGH COUNTY 328 12% 2787 JEFFERSON COUNTY 232 12% 1872 FAYETTE COUNTY 192 12% 1625 LOGAN COUNTY 176 12% 1481 MCDOWELL COUNTY 102 12% 840 MERCER COUNTY 246 11% 2201 GREENBRIER COUNTY 140 11% 1272 PRESTON COUNTY 114 11% 1064 WOOD COUNTY 321 10% 3099 MONONGALIA COUNTY 247 10% 2552 WAYNE COUNTY 178 10% 1816 OHIO COUNTY 133 10% 1337 HANCOCK COUNTY 109 10% 1045 RANDOLPH COUNTY 99 10% 1002 PUTNAM COUNTY 143 7% 2071
29
Labor Market Outcomes
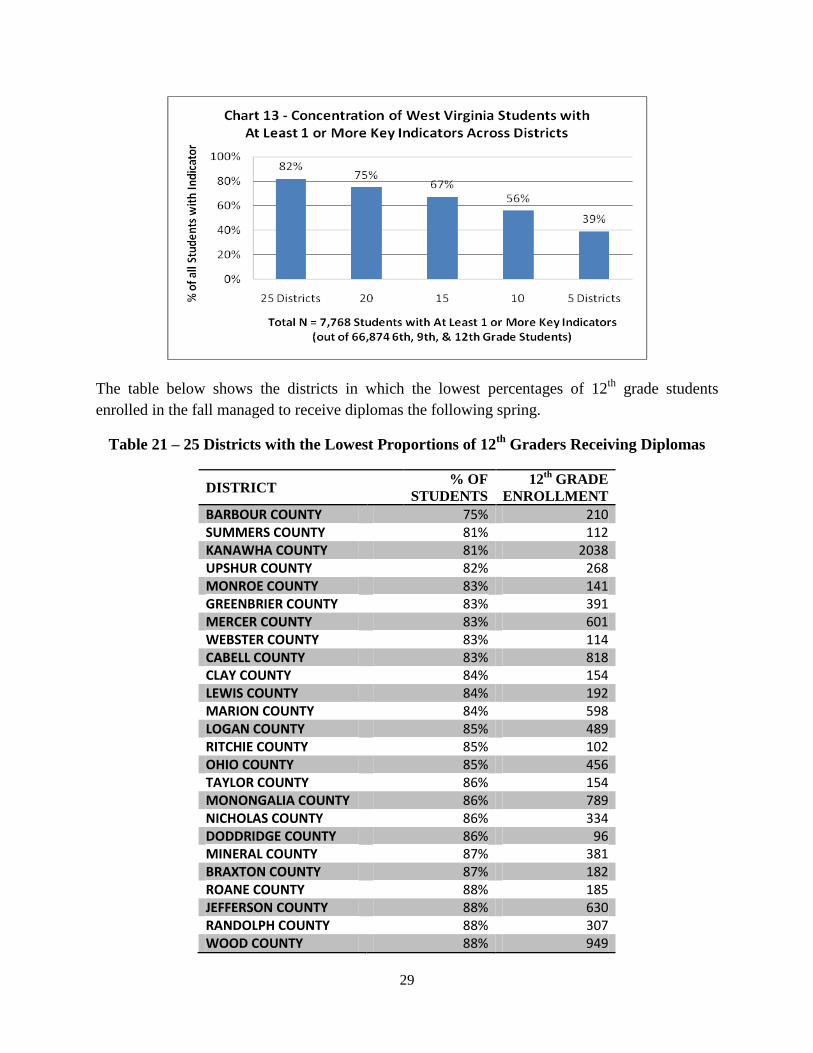
The table below shows the districts in which the lowest percentages of 12th
grade students
enrolled in the fall managed to receive diplomas the following spring.
Table 21 – 25 Districts with the Lowest Proportions of 12th
Graders Receiving Diplomas
DISTRICT % OF
STUDENTS
12th
GRADE
ENROLLMENT
BARBOUR COUNTY 75% 210 SUMMERS COUNTY 81% 112 KANAWHA COUNTY 81% 2038 UPSHUR COUNTY 82% 268 MONROE COUNTY 83% 141 GREENBRIER COUNTY 83% 391 MERCER COUNTY 83% 601 WEBSTER COUNTY 83% 114 CABELL COUNTY 83% 818 CLAY COUNTY 84% 154 LEWIS COUNTY 84% 192 MARION COUNTY 84% 598 LOGAN COUNTY 85% 489 RITCHIE COUNTY 85% 102 OHIO COUNTY 85% 456 TAYLOR COUNTY 86% 154 MONONGALIA COUNTY 86% 789 NICHOLAS COUNTY 86% 334 DODDRIDGE COUNTY 86% 96 MINERAL COUNTY 87% 381 BRAXTON COUNTY 87% 182 ROANE COUNTY 88% 185 JEFFERSON COUNTY 88% 630 RANDOLPH COUNTY 88% 307 WOOD COUNTY 88% 949

30
Labor Market Outcomes REFERENCES
Allensworth, E., & Easton, J. (2007). What matters for staying on-track indicator and graduating in
Chicago public high schools. Chicago: Consortium on Chicago School Research.
Balfanz, R. & Legters, N. (2004). Locating the dropout crisis. CRESPAR Report #70. Baltimore, MD and
Washington, DC: Center for Research on the Education of Students Placed at Risk.
Balfanz, R., Herzog, L. & Mac Iver, D.J. (2007). Preventing student disengagement and keeping students
on the graduation path in urban middle-grades schools: Early identification and effective interventions.
Educational Psychologist, 42, 4, 223-235.
Finn, J.D. (1989) Withdrawing from school. Review of Educational Research, 59, 117–142.
Fredricks, J. A., Blumenfeld, P. C., & Paris, A. H. (2004). School engagement: Potential of the concept,
state of the evidence. Review of Educational Research, 74, 59-109.
Gleason, P. & Dynarski, M. (2002). Do we know whom to serve? Issues in using risk factors to identify
dropouts. Journal of Education for Students Placed at Risk, 7, 25-41.
Lan, W., & Lanthier, R. (2003). Changes in students‟ academic performance and perceptions of school
and self before dropping out of schools. Journal of Education for Students Placed at Risk, 8(3), 309–332.
Lee, V.E., & Burkam, D.T. (2003). Dropping out of high school: The role of school organization and
structure. American Journal of Education, 100, 420-453.
Neild, R. C., & Balfanz, R. (2006a). An extreme degree of difficulty: The educational demographics of
urban neighborhood high schools. Journal of Education for Students Placed at Risk, 11, 131-141.
Neild, R. C. & Balfanz, R. (2006b). Unfulfilled promise: The dimensions and characteristics of
Philadelphia’s dropout crisis, 2000-2005. Philadelphia, PA: Philadelphia Youth Transitions
Collaborative.
Neild, R.C. (2009a). Falling off track during the transition to high school: What we know and what can be
done. The Future of Children 19, 53-76.
Roderick, M., & Camburn, E. (1999). Risk and recovery from course failure in the early years of high
school. American Educational Research Journal, 36, 303–344.
Rumberger, R., & Lim, S. (2008). Why students drop out of school: A review of 25 years of research.
California Dropout Research Project Report #15. Santa Barbara, CA: California Dropout Research
Project.
Schargel, F., & Smink, J. (2001). Strategies to help solve our school dropout problem. Larchmont, NY:
Eye on Education.
Wehlage, G., Rutter, R., Smith, G., Lesko, N., & Fernandez, R. (1989). Reducing the risk: Schools as
communities of support. New York: Falmer Press.

31
Labor Market Outcomes
© 2010, The Johns Hopkins University, on behalf of the Everyone Graduates Center. All Rights Reserved.
Suggested citation:
Balfanz, R., & Byrnes, V. (2010). Current Distribution of Early Warning Indicators Analysis: West Virginia.
Baltimore: Johns Hopkins University Center for Social Organization of Schools.