l gaul
DESCRIPTION
Damping identificationTRANSCRIPT

Uni
vers
ität S
tuttg
art
IMAC XXVII 2009
Institute für Angewandte und Experimentelle Mechanik, Universität Stuttgart
Lothar Gaul, Sergey Bograd, André Schmidt
Pfaffenwaldring 9, 3. OG
Allmandring 5B, EG
February 9-12, 2009, Orlando, Fl
Damping Identification and Joint Modeling with Thin Layer Elements

Uni
vers
ität S
tuttg
art
IMAC XXVII 2009
Motivation
Joint damping parameters
Test structure
FE – model description
Comparison between FE simulation and experiment
Overview

Uni
vers
ität S
tuttg
art
IMAC XXVII 2009
• Prediction of damping in a structure before the prototype is available
• Estimation of a structure independent joint parameters
• Constant hysteretic damping
• Application of damping locally at the joint interface
Motivation

Uni
vers
ität S
tuttg
art
IMAC XXVII 2009
Joint patch damping – measurement set-up
11aMFt =
∫∫∫∫ −=Δ dtdtadtdtax 21
max2D
t
WU
F c x
χπ
=
= Δ
Loss factor and stiffness determination from hysteresis diagram

Uni
vers
ität S
tuttg
art
IMAC XXVII 2009
Stiffness of the generic jointCalculation of shear modulus from the experiment
Experimentally determined shear modulus

Uni
vers
ität S
tuttg
art
IMAC XXVII 2009
Joint patch damping – experiment
Interchangeable patch samples
Parameter estimation at different frequencies
Careful alignment of the masses is necessary in order to avoid bending in the joint

Uni
vers
ität S
tuttg
art
IMAC XXVII 2009
Joint patch damping – experiment with a leaf spring (resonator system)
Allows to achieve good excitation in axial direction; bending in the joint is reduced
Joint parameters can be measured only for one frequency

Uni
vers
ität S
tuttg
art
IMAC XXVII 2009
Joint patch damping – resonator system
Measurement of the hysteresis for small contact pressure Contact pressure – 33 N/cm2
-1.5 -1 -0.5 0 0.5 1 1.5
x 10-7
-2.5
-2
-1.5
-1
-0.5
0
0.5
1
1.5
2
2.5Hysterisis Loop
Relative Displacement dx (m)
Tran
salti
onal
For
ce (N
)
Fex = .7 NFex = 1.5 NFex = 2.1 NFex = 3.7 N
Macro and micro slip behavior
Varied stiffness and dissipation

Uni
vers
ität S
tuttg
art
IMAC XXVII 2009
No sliding occurs –only micro slip behavior
Constant stiffness and dissipation
-4 -3 -2 -1 0 1 2 3 4
x 10-7
-80
-60
-40
-20
0
20
40
60
80
Relative displacement (m)
Tran
smitt
ed F
orce
(N)
.25V
.5V1V2V4V3V5V
Joint patch damping
Measurement of the hysteresis for high contact pressureContact pressure – 1.2 kN/cm2

Uni
vers
ität S
tuttg
art
IMAC XXVII 2009
Joint patch damping Measurement of Hysteresis at variable frequencies for high contact pressureContact pressure – 2 kN/cm2
-4 -3 -2 -1 0 1 2 3 4
x 10-7
-150
-100
-50
0
50
100
150
Displacement (m)
Forc
e (N
)
Hysterisis Loop
200 Hz
450 Hz
1500 Hz
Stiffness and damping are nearly frequency independent in the measurment range
0.06490 /c kN mm
χ ≈≈

Uni
vers
ität S
tuttg
art
IMAC XXVII 2009
Experimental modal analysis – test structure 1
Mounting torque: 14 Nm
Roughness of the joint surface:Rz 6.3
Boundary conditions: free-free

Uni
vers
ität S
tuttg
art
IMAC XXVII 2009
Experimental modal analysis – test structure Mode with the highest measured damping

Uni
vers
ität S
tuttg
art
IMAC XXVII 2009
Experimental modal analysis – test structure Mode with the lowest measured damping

Uni
vers
ität S
tuttg
art
IMAC XXVII 2009
Implementation of the local damping modeling in the FE-simulation
Modeling of damping with the thin layer elements

Uni
vers
ität S
tuttg
art
IMAC XXVII 2009
Implementation of the local damping modeling in the FE-simulation
Modeling of damping with the thin layer elements

Uni
vers
ität S
tuttg
art
IMAC XXVII 2009
Brick or penta elements with up to 1:1000 thickness to length ratio
Implementation of the local damping modeling in the FE-simulation – thin layer elements

Uni
vers
ität S
tuttg
art
IMAC XXVII 2009
MSC.Nastran 2005, Quick Reference Guide
Nastran Material Parameter GE = Loss factor χ
E3 – Normal stiffness
E5, E6 – Tangential stiffness
Other matrix elements are ignored
Implementation of the local damping modeling in the FE-simulation – orthotropic material behavior in the joint

Uni
vers
ität S
tuttg
art
IMAC XXVII 2009
Mode Nr
Experimental Freq (Hz)
Simulated Freq (Hz)
Difference (%)
Experimental Damping (%)
Simulated Damping (%)
Difference (%)
1 1063 1057 -0,5 0,110 0,107 -2,5
2 1348 1339 -0,7 0,191 0,204 6,9
3 1441 1406 -2,4 0,107 0,114 7,1
4 1558 1567 0,6 0,147 0,178 21,6
5 2149 2155 0,3 0,143 0,179 25,1
6 2307 2244 -2,7 0,077 0,072 -6,1
7 2447 2428 -0,8 0,086 0,065 -24,9
8 2559 2531 -1,1 0,062 0,026 -58,0
9 3372 3363 -0,3 0,116 0,110 -5,3
10 3713 3742 0,8 0,076 0,009 -87,7
Implementation of the local damping modeling in the FE-simulation – comparison between experiment and simulation
Uni
vers
ität S
tuttg
art
IMAC XXVII 2009
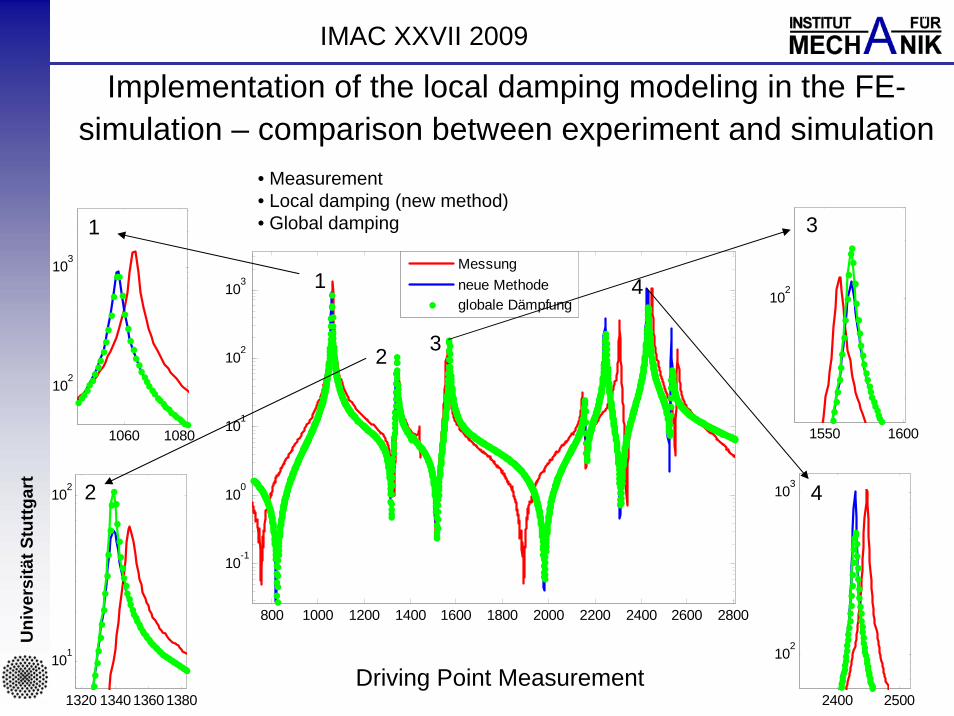
Implementation of the local damping modeling in the FE-simulation – comparison between experiment and simulation
800 1000 1200 1400 1600 1800 2000 2200 2400 2600 2800
10-1
100
101
102
103
Messungneue Methodeglobale Dämpfung
Driving Point Measurement
1060 1080
102
103
1
1
1320 1340 1360 1380
101
102
2
2
1550 1600
102
3
3
2400 2500
102
103
4
4
• Measurement • Local damping (new method)• Global damping

Uni
vers
ität S
tuttg
art
IMAC XXVII 2009
Simulation of Cylinder Block with Oilpan

Uni
vers
ität S
tuttg
art
IMAC XXVII 2009
Cylinder Block – Oilpan Meshing of the contact surfaces with conformed FE-Mesh

Uni
vers
ität S
tuttg
art
IMAC XXVII 2009
Mode Nr
Experimental Freq (Hz)
Simulated Freq (Hz)
Difference (%)
Experimental Damping (%)
Simulated Damping (%)
Difference (%)
1 1011 1008 -0,29 0,157 0,152 -3,2
2 1287 1317 2,34 0,214 0,117 -45,4
3 1305 1276 -2,26 0,049 0,060 22,1
4 1399 1403 0,25 0,143 0,130 -9,0
5 1558 1574 1,02 0,197 0,068 -65,46 1667 1674 0,45 0,191 0,099 -48,3
7 1849 1859 0,56 0,258 0,110 -57,38 1874 1900 1,38 0,196 0,083 -57,89 1910 1953 2,26 0,116 0,063 -45,5
10 1998 2059 3,09 0,174 0,125 -27,8
11 2052 2058 0,33 0,094 0,096 1,3
12 2226 2211 -0,65 0,096 0,126 30,3
13 2320 2300 -0,89 0,200 0,169 -15,5
14 2389 2415 1,08 0,198 0,127 -36,1
15 2493 2476 -0,67 0,128 0,091 -28,8
Implementation of the local damping modeling in the FE-simulation – comparison between experiment and simulation

Uni
vers
ität S
tuttg
art
IMAC XXVII 2009
Simulation of Cylinder Block with Oilpan
Uni
vers
ität S
tuttg
art
IMAC XXVII 2009
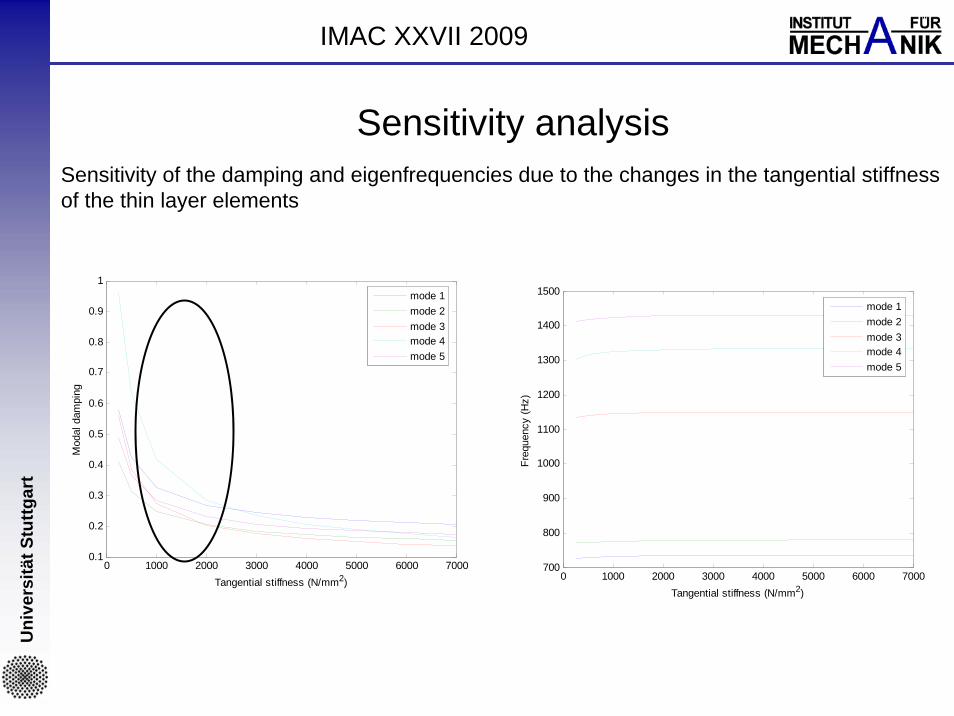
Sensitivity analysis
0 1000 2000 3000 4000 5000 6000 70000.1
0.2
0.3
0.4
0.5
0.6
0.7
0.8
0.9
1
Tangential stiffness (N/mm2)
Mod
al d
ampi
ng
mode 1mode 2mode 3mode 4mode 5
0 1000 2000 3000 4000 5000 6000 7000700
800
900
1000
1100
1200
1300
1400
1500
Tangential stiffness (N/mm2)
Freq
uenc
y (H
z)
mode 1mode 2mode 3mode 4mode 5
Sensitivity of the damping and eigenfrequencies due to the changes in the tangential stiffness of the thin layer elements

Uni
vers
ität S
tuttg
art
IMAC XXVII 2009
0 10 20 30 40 50 60 70 800.25
0.3
0.35
0.4
0.45
0.5
0.55
0.6
0.65
0.7
Normal stiffness (kN/mm2)
Mod
al d
ampi
ng
mode 1mode 2mode 3mode 4mode 5
0 10 20 30 40 50 60 70 80700
800
900
1000
1100
1200
1300
1400
1500
Normal stiffness (kN/mm2)
Freq
uenc
y (H
z)
mode 1mode 2mode 3mode 4mode 5
Sensitivity analysisSensitivity of the damping and eigenfrequencies due to the changes in the normal stiffness of the thin layer elements
Uni
vers
ität S
tuttg
art
IMAC XXVII 2009
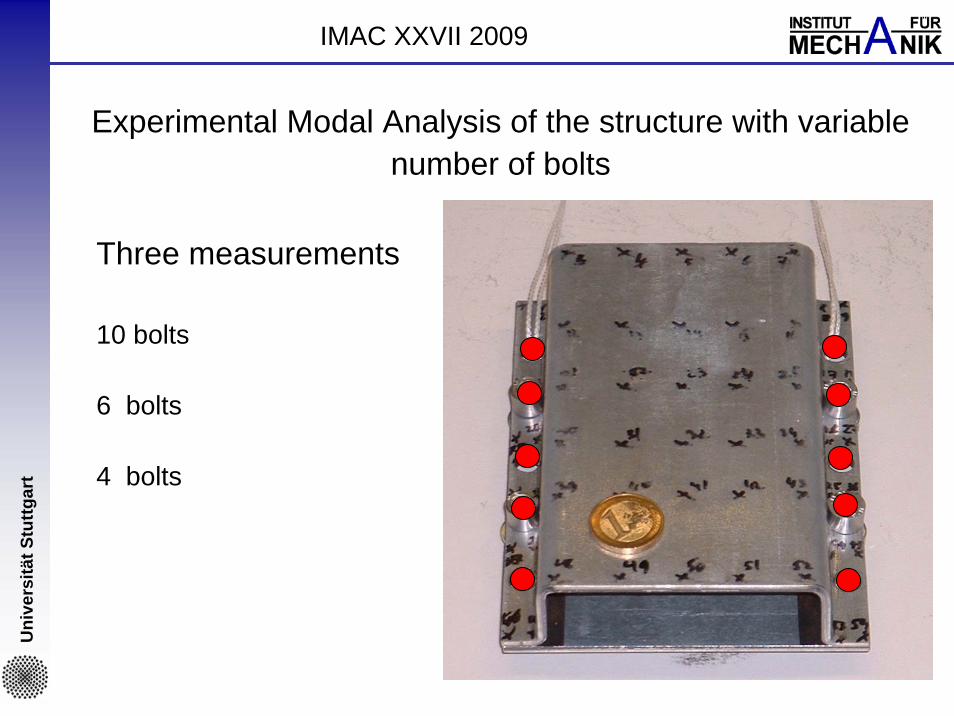
Experimental Modal Analysis of the structure with variable number of bolts
Three measurements
10 bolts
6 bolts
4 bolts

Uni
vers
ität S
tuttg
art
IMAC XXVII 2009
Bolts # 10 6 4
ModeNr.
Freq (Hz)
Damping(%)
Freq(Hz)
Damping(%)
Difference (%
Damping)
Freq(Hz)
Damping(%)
Difference (%
Damping)
1 1063 0,1099 1060 0,127 16 1030 0,219 992 1348 0,1911 1320 0,266 39 1100 1,69 7843 1441 0,1066 1430 0,147 38 1260 0,691 5484 1558 0,1466 1520 0,189 29 1380 0,167 145 2149 0,1428 2100 0,17 19 1800 1,53 9716 2307 0,0766 2320 0,0966 26 2280 0,341 3457 2447 0,0863 2450 0,0974 13 2410 0,138 608 2559 0,0619 2550 0,0653 5 2550 0,161 1609 3372 0,1162 3300 0,137 18 2680 0,644 454
Experimental Modal Analysis of the structure with variable number of bolts

Uni
vers
ität S
tuttg
art
IMAC XXVII 2009
Conclusions
Joint patch damping shows only small frequency dependence, which allows the use of the constant hysteresis method
FE-simulation with the thin layer elements containing orthotropic material properties shows good correlation with experimental results
Method works for the joints with regularly distributed contact pressure; objective classification of the pressure distribution in the joints and applicability of the method should be investigated