krishi karman awards 2013-14 department of agriculture, a. p., hyderabad 1 government of andhra...
TRANSCRIPT

Krishi Karman Awards 2013-14
DEPARTMENT OF AGRICULTURE, A. P., HYDERABAD 1
GOVERNMENT OF ANDHRA PRADESH
NDRK SARMAState Consultant (NFSM)

II. New Innovations/Initiatives adopted in A.P.
IV. Inter Departmental Coordination with Power, Irrigation, Fertilizers, Credit etc. during 2013-14
VI. Future Prospects for Food grains Production
STRUCTURE
I. Crop wise Production during 2013-14 - Andhra Pradesh
2
III. Expenditure under NFSM, RKVY and INSIMP for 2013-14
V. Online updating of data on NFSM website

S.No YearAll India
ProductionA.P
Production%
1 2008-09 234.47 20.42 8.72 2009-10 218.20 * 15.60 7.13 2010-11 235.88 20.31 8.64 2011-12 250.42 18.40 7.35 2012-13 250.14 18.75 7.49
(Million Tons)
* Severe Drought YearSource: DES / Statistical Abstract, Government of India 3
Food Grains Production - All India Vs Andhra Pradesh
During 2013-14 the food grain production is 22.44 Million MTs

4
Year PaddyCoarse Grains
Total Pulses
Total Oilseeds
2008-09 4387 1270 1771 2622
2009-10 3441 1283 1933 2119
2010-11 4752 1136 2131 2367
2011-12 4096 1255 1930 1994
2012-13 3628 1405 1949 1998
2013-14 4592 1472 1671 2022
2008-09 2009-10 2010-11 2011-12 2012-13 2013-140
500
1000
1500
2000
2500
3000
3500
4000
4500
5000
(Area in '000 Ha)
Paddy Coarse GrainsTotal Pulses Total Oilseeds
Area of Important Crops

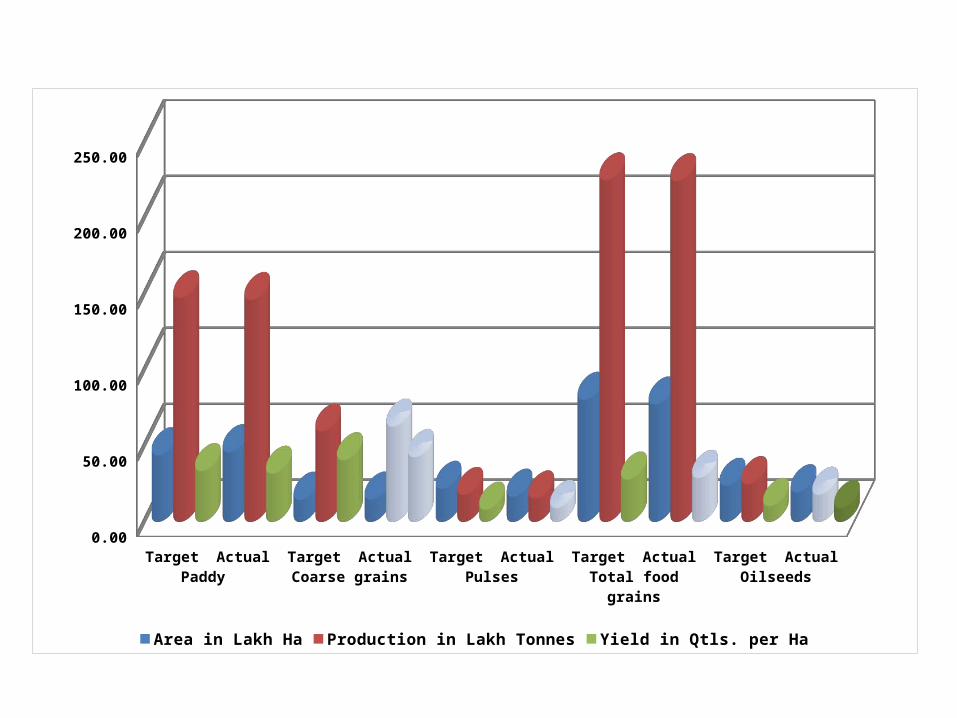
CropArea (Lakh Ha) Production (Lakh MTs) Yield (Qtls/Ha)
Target Actual covered Target Actual
production Target Actual
Paddy 44.00 45.92 147.39 146.15 33.50 31.83
Coarse grains 14.66 14.72 59.70 62.81 40.72 42.66
Pulses 21.85 16.71 17.77 15.49 8.13 9.27
Total food grains 80.51 77.35 224.96 224.46 27.91 29.02
Oilseeds 23.86 19.63 25.00 17.97 10.47 9.15
Area, Production and Yield Targets & Achievements during 2013-14
Target Actual Target Actual Target Actual Target Actual Target ActualPaddy Coarse grains Pulses Total food grains Oilseeds
0.00
50.00
100.00
150.00
200.00
250.00
Area in Lakh Ha Production in Lakh Tonnes Yield in Qtls. per Ha

Damage due to natural calamities during 2013-14
Paddy Total coarse cereals
Total pulses
Total oilseeds
Area sown during 2013-14 in lakh ha 45.92 14.72 16.71 20.22Area damaged more than 50% in lakh ha 5.70 0.65 0.20 7.32Production loss (in lakh tons) 9.35 1.01 0.05 2.32% of damage (area) 12.42 4.44 1.21 36.22
Paddy Total coarse cereals Total pulses Total oilseeds05
101520253035404550
Area sown during 2013-14 in lakh ha Area damaged more than 50% in lakh haProduction loss (in lakh tonns) % of damage

8
Year Area ('000 Ha)
Yield (Kgs/Ha)
Production ('000 Mts)
2008-09 7442 2744 204212009-10 6667 2340 155992010-11 8029 2530 203142011-12 7289 2525 184022012-13 6990 2681 18737Mean 7283 2567 18695
2013-14 7735 2902 22446
TOTAL FOOD GRAINS
2008-09 2009-10 2010-11 2011-12 2012-13 Mean 2013-140
5000
10000
15000
20000
25000
7442 66678029 7289 6990 7283.4 7735
2744 2340 2530 2525 2681 2567 2902
20421
15599
2031418402 18737 18695
22446
Area ('000 Ha) Yield (Kgs/Ha) Production ('000 Mts)
I. Crop wise Production during 2013-14 - Andhra Pradesh

9
YearArea
('000 Ha)Yield
(Kgs/Ha)Production ('000 Mts)
2008-09 4387 3246 142412009-10 3441 3150 108382010-11 4752 3035 144202011-12 4096 3147 128922012-13 3628 3173 11511Mean 4061 3150 12780
2013-14 4592 3183 14615
Paddy
2008-09 2009-10 2010-11 2011-12 2012-13 Mean 2013-140
2000
4000
6000
8000
10000
12000
14000
16000
43873441
47524096
3628 4060.84592
3246 3150 3035 3147 3173 3150.2 3183
14241
10838
14420
12892
11511
12780
14615
Area ('000 Ha) Yield (Kgs/Ha) Production ('000 Mts)

Active campaign by extension staff in all the districts for promoting SRI, SMSRI, Drum seeder cultivation and automatic transplantation of rice except in command areas and problematic soils
Intensive training to extension staff, farmers and Labour.
Supply of suitable farm machinery on subsidy and establishment of CHC & IHS
Promotion of SMSRI :
S. No
Year
(Area in ha)
Area covered under
SMSRI
% increase over previous
year
1 2006-07 2078 - 2 2007-08 5447 262.1
3 2008-09 10514 193.0
4 2009-10 49000 466.0
5 2010-11 91000 185.7
6 2011-12 121815 133.9
7 2012 -13 283000 150.0
8 2013-14 394795 139.5
10

DRUM SEEDING Inter cultivation with Conoweeder
Mini translator Mechanized SRI Mechanized SRI - Nursery
12
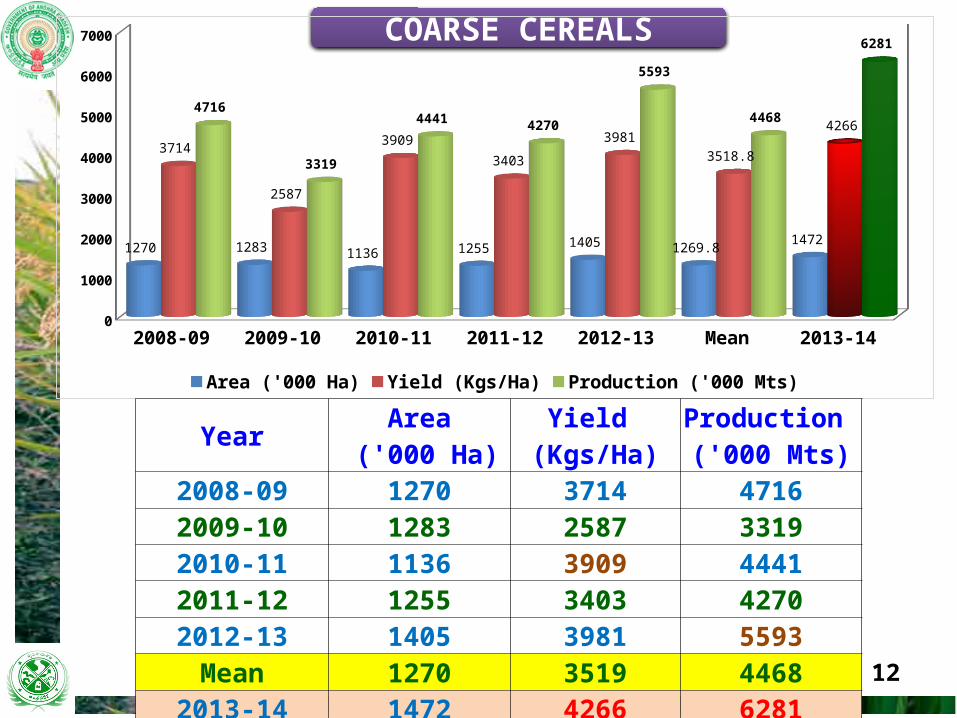
COARSE CEREALS
2008-09 2009-10 2010-11 2011-12 2012-13 Mean 2013-140
1000
2000
3000
4000
5000
6000
7000
1270 1283 1136 1255 1405 1269.81472
3714
2587
3909
3403
39813518.8
42664716
3319
4441 4270
5593
4468
6281
Area ('000 Ha) Yield (Kgs/Ha) Production ('000 Mts)
YearArea
('000 Ha)Yield
(Kgs/Ha)Production ('000 Mts)
2008-09 1270 3714 47162009-10 1283 2587 33192010-11 1136 3909 44412011-12 1255 3403 42702012-13 1405 3981 5593Mean 1270 3519 4468
2013-14 1472 4266 6281

13
MAIZE
YearArea
('000 Ha)Yield
(Kgs/Ha)Production ('000 Mts)
2008-09 852 4874 41522009-10 783 3528 27612010-11 744 5317 39532011-12 864 4232 36562012-13 972 4994 4855Mean 843 4589 3875
2013-14 1104 5197 5738
2008-09 2009-10 2010-11 2011-12 2012-13 Mean 2013-140
1000
2000
3000
4000
5000
6000
852 783 744 864 972 8431104
4874
3528
5317
4232
49944589
5197
4152
2761
39533656
4855
3875
5738
Area ('000 Ha) Yield (Kgs/Ha) Production ('000 Mts)

14
YearArea
('000 Ha)Yield
(Kgs/Ha)Production ('000 Mts)
2008-09 1771 818 14482009-10 1933 741 14322010-11 2131 676 14402011-12 1930 637 12292012-13 1949 833 1624Mean 1943 741 1435
2013-14 1671 927 1549
2008-09 2009-10 2010-11 2011-12 2012-13 Mean 2013-140
500
1000
1500
2000
2500
17711933
2131
1930 1949 1942.8
1671
818741 676 637
833741
927
1448 1432 1440
1229
1624
14351549
Area ('000 Ha) Yield (Kgs/Ha) Production ('000 Mts)
TOTAL PULSES

Intercrop of Maize with Red gram Intercrop of Red gram with Soybean
Red gram on rice bunds Intercrop of Cotton with Red gram
15

16
Year Area ('000 Ha)
Yield (Kgs/Ha)
Production ('000 Mts)
2008-09 502 455 2022009-10 463 438 2032010-11 638 416 2652011-12 481 303 1462012-13 480 523 251Mean 513 427 213
2013-14 448 545 244
REDGRAM
2008-09 2009-10 2010-11 2011-12 2012-13 Mean 2013-140
100
200
300
400
500
600
700
502463
638
481 480512.8
448455 438 416
303
523
427
545
202 203265
146
251213 244
Area ('000 Ha) Yield (Kgs/Ha)Production ('000 Mts)
Year Area ('000 Ha)
Yield (Kgs/Ha)
Production ('000 Mts)
2008-09 607 1413 8572009-10 647 1309 8472010-11 584 1233 7192011-12 565 921 5202012-13 681 1119 762Mean 617 1199 741
2013-14 586 1439 843
2008-09 2009-10 2010-11 2011-12 2012-13 Mean 2013-140
200
400
600
800
1000
1200
1400
1600
607 647 584 565681 616.8 586
14131309
1233
921
11191199
1439
857 847719
520
762 741843
Area ('000 Ha) Yield (Kgs/Ha)Production ('000 Mts)
BENGALGRAM

17
TOTAL OIL SEEDS
YearArea Yield Production
('000 Ha) (Kgs/Ha) ('000 Mts)
2008-09 2600 618 16082009-10 2074 724 15012010-11 2319 866 20082011-12 1945 658 12802012-13 1944 853 1659Mean 2176 744 1611
2013-14 1963 915 1797
2008-09 2009-10 2010-11 2011-12 2012-13 Mean 2013-140
500
1000
1500
2000
2500
3000
Area ('000 Ha) Yield (Kgs/Ha) Production ('000 Mts)

18
GROUNDNUT
Year Area ('000 Ha)
Yield (Kgs/Ha)
Production ('000 Mts)
2008-09 1766 551 9732009-10 1301 774 10072010-11 1622 898 14572011-12 1307 646 8452012-13 1345 829 1115Mean 1468 740 1079
2013-14 1386 892 1236
SOYBEAN
Year Area ('000 Ha)
Yield (Kgs/Ha)
Production ('000 Mts)
2008-09 142 1365 1942009-10 156 824 1292010-11 128 1704 2182011-12 130 1616 2112012-13 159 1818 289Mean 143 1465 208
2013-14 245 1612 395
2008-09 2009-10 2010-11 2011-12 2012-13 Mean 2013-140
200
400
600
800
1000
1200
1400
1600
18001766
1301
1622
1307 13451468.2
1386
551
774898
646
829739.6
892973 1007
1457
845
1115 10791236
Area ('000 Ha) Yield (Kgs/Ha)Production ('000 Mts)
2008-09 2009-10 2010-11 2011-12 2012-13 Mean 2013-140
200400600800
100012001400160018002000
142 156 128 130 159 143245
1365
824
17041616
1818
1465.41612
194 129218 211 289 208
395
Area ('000 Ha) Yield (Kgs/Ha)Production ('000 Mts)
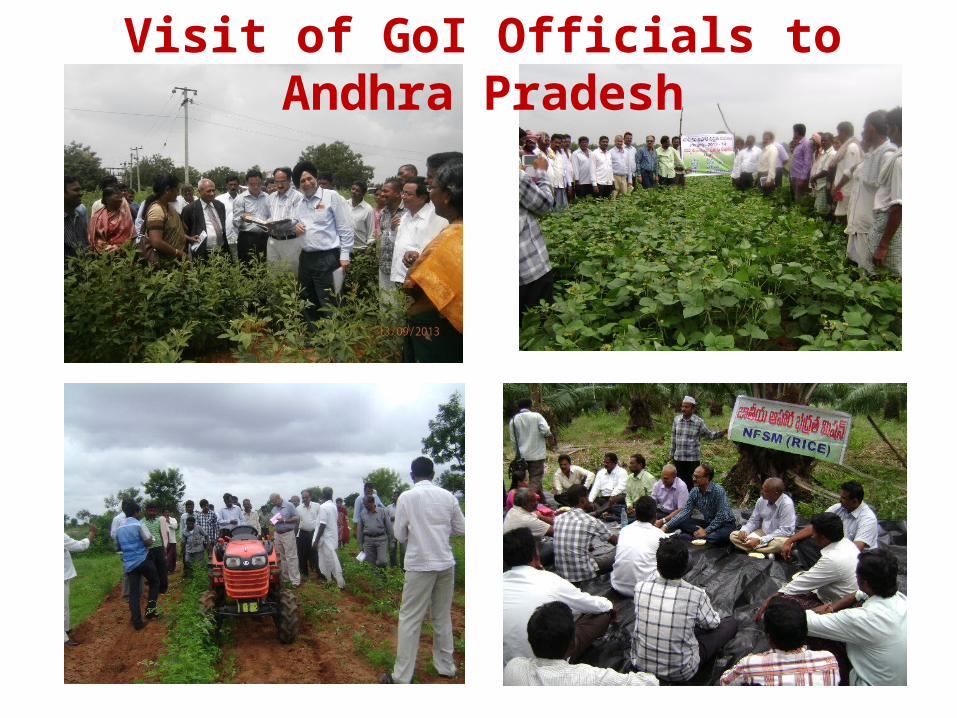
Visit of GoI Officials to Andhra Pradesh

New innovations/initiatives adopted to increase paddy Productivity and
Production
•In light soils growing green manure and incorporation
To improve the soil organic matter content
•Direct seeding or drum seeding or SMSRI methods for
timely sowing, save time in raising nurseries and
transplantation and reduction in labour cost.
•Weed management through weedicides
application & weeders
•Majority of the soils are deficient in Zinc and also
micronutrients like Boron, Iron, etc,. Rectification
through foliar application.
II. New Innovations/Initiatives adopted in A.P.

• Introducing high yielding location specific new varieties in Pulses.• Increasing the area under pulses in Rice fallows. • Popularizing intercropping of Red gram with other
pulses and.• Increasing the area of Green gram & Black gram during
summer.•Growing short duration varieties of millets and pulses
for double cropping under rainfed kharif. • Spraying of Neem oil before flowering on redgram
Critical Interventions to increase Pulses Productivity and Production

Critical interventions in Coarse Cereals
• Popularization of recently Released HYVs• Double cropping system with Pulses/Oilseeds• Area Expansion in Rice fallow during rabi, Zero
tillage and rice fallow ragi.• Encouraging organic farming in Tribal mandals• Post Harvesting & processing for value addition

CRITICAL INTERVENTIONS TO INCREASE OILSEED PRODUCTIVITY AND PRODUCTION
• Seed and varietal replacement• Popularization of short duration varieties in water scarcity areas
and popularization of resistant varieties.• Promoting intercropping with redgram and other crops.• Adopting appropriate cropping sequence for increasing area• Popularization of pre emergence weedicides for effective
control of weeds.• Effective use of water through sprinkler sets and water carrying
pipes in low water available areas• Capacity building: On farm training through Farmer Field
Schools.• Increasing oilseeds area in rice fallow during rabi.

24
Assuring Quality Supply of Inputs through Quality Control
S.No
Name of the Input
Annual Target
No. of samples
drawn and analyzed
No. of samples found
substandard
No. of dealers
inspected
Stocks detained
Value in Lakhs of
Rs.
1 Seed 14450 14256 258 6300 9682(Qtls)
406.00
2 Fertilizer 15400 15573 499 12310
11135.27 (MTS)
2060.80
3 Pesticide 9000 8797 83 157529.2
(lts/Mts) 59.06
25
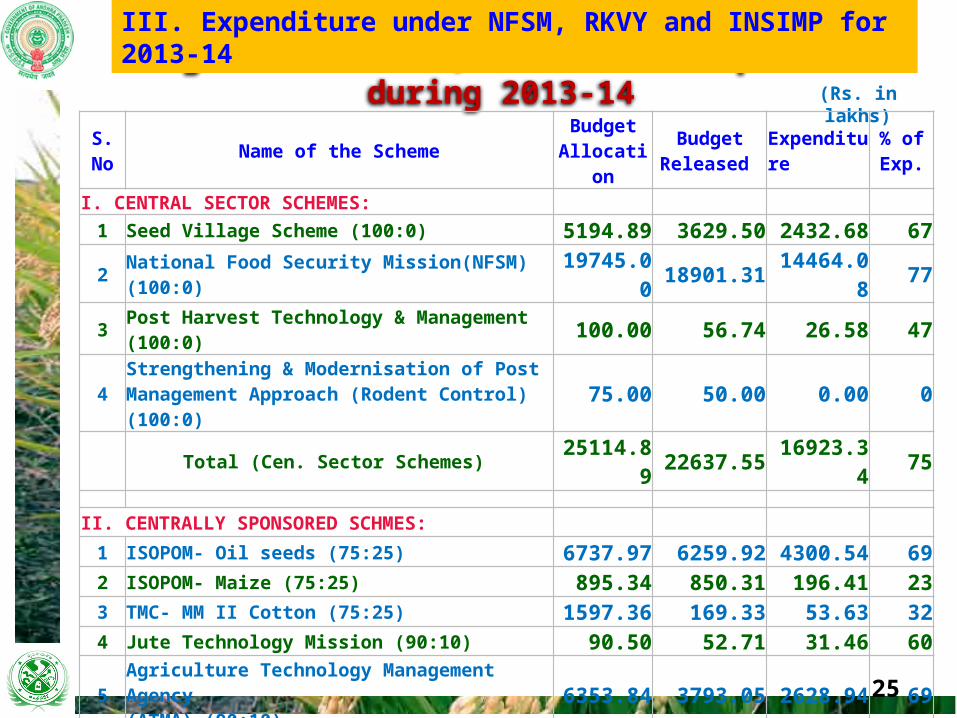
Budget Allocation, Releases & Expenditure during 2013-14 (Rs. in lakhs)
S.No Name of the Scheme Budget
AllocationBudget
Released Expenditure % of Exp.
I. CENTRAL SECTOR SCHEMES: 1 Seed Village Scheme (100:0) 5194.89 3629.50 2432.68 672 National Food Security Mission(NFSM) (100:0) 19745.00 18901.31 14464.08 773 Post Harvest Technology & Management (100:0) 100.00 56.74 26.58 47
4 Strengthening & Modernisation of Post Management Approach (Rodent Control) (100:0) 75.00 50.00 0.00 0
Total (Cen. Sector Schemes) 25114.89 22637.55 16923.34 75
II. CENTRALLY SPONSORED SCHMES: 1 ISOPOM- Oil seeds (75:25) 6737.97 6259.92 4300.54 692 ISOPOM- Maize (75:25) 895.34 850.31 196.41 233 TMC- MM II Cotton (75:25) 1597.36 169.33 53.63 324 Jute Technology Mission (90:10) 90.50 52.71 31.46 60
5 Agriculture Technology Management Agency (ATMA) (90:10) 6353.84 3793.05 2628.94 69
6 National Project on Management of Soil Health & Fertility (NPMSHF)(90:10) 2314.38 301.87 299.44 99
Total (Centrally Sponsored Schemes) 17989.39 11427.19 7510.42 66
III. STATE PLAN SCHEMES: 1 Rashtriya Krishi Vikas Yojana (RKVY)(100%GOI) 72441.00 45687.00 37670.00 82
III. Expenditure under NFSM, RKVY and INSIMP for 2013-14

Power & Irrigation
• Close coordination with electricity department for quality and timely of power.
• Free power to 32.04 lakh agricultural consumers in the state for betterment of the farming community.
• Assured minimum seven hours of power supply to agriculture.
• Agricultural services are extended to consumers on priority.
• Continuous interaction with district and state irrigation officials for timely release of water.
• Advising farmers for preparatory cultivation and raising nurseries depending on the time of release of water.
26
IV. Inter Departmental Coordination with Power, Irrigation, Fertilizers, Credit etc. during 2013-14

27
Credit
Coordination with Bankers at SLBC meeting for agricultural loans and monitoring insuranceThe Andhra Pradesh Land Licensed Cultivators Act 2011• The Andhra Pradesh is the 1st state in the country to promulgate an Act No. 18 of
2011 dt. 23.12.2011 (The Andhra Pradesh Land Licensed Cultivators Act 2011) to provide loan and other benefits eligibility cards to the land licensed cultivators.
Sl. No Year
No. of LECs
issued to Tenant farmers
Amount of loan
sanctioned (Crores)
No.of LECs
1 2013-14 443155 342.06 164781
2009-10 2010-11 2011-12 2012-13 2013-140
10000
20000
30000
40000
50000
60000
70000
80000
2484530229
36451
50157 51955
37574
47930
58510
73648 73494Crop Loan (Achv.)Total Agriculture (including Allied activities (Achv.)
Interest Free Crop Loans: • Interest free crop loans to all the farmers up to Rs. 1.00 lakh • Pavala Vaddi (3%) for crop loans from Rs.1.00 lakh to 3.00 lakhs, if repaid in time
• During 2013-14, an amount of Rs.429.61 Crores was provided to 36.55 lakh farmers in the state.
Rs. In Crores

Regular persuasion with all the manufacturers/suppliers for ensuring supplying of stocks to the needy areas in time
Soil test based recommendation to avoid excessive use of fertilizers
Taking up issues of supply, distribution and availability of fertilizers with the Department of Fertilizers, GoI on daily basis and also in the weekly Video Conferences.
Coordination with Revenue, Vigilance & Enforcement Department in Checking cross border movement of fertilizers to other states.
Fertilizers
28

29
Pesticide Consumption from 2004-05 to 2013-14 in Andhra Pradesh
YearConsumption in MTs./ Lts
(Active Ingredient)
2004-05 110002005-06 100002006-07 99002007-08 84222008-09 83742009-10 81452010-11 88692011-12 92892012-13 81522013-14 8065

• Online updating of data pertaining to NFSM is updated for 2012-13
V. Online updating of data on NFSM website
30

The objectives of the Mission on Primary Sector :
• Increasing the productivity of primary sector (Agriculture & allied)
• Mitigating the impact of drought through water conservation and Micro irrigation
• Popularization of climate resilient crop production technologies
• Conserving natural resources and preserving soil health
• Post harvest management to reduce wastages and establishment of processing, value addition capacity and supply chain of the identified crops.
Government of Andhra Pradesh has launched the Mission on Primary Sector (one of the 7 missions) on the 6th of October, 2014
in the presence of Hon’ble former President of India Dr. A.P.J. Abdul Kalam

• Identify the major gaps in important crops and appropriate interventions to increase the productivity at Village level.
• Soil analysis and soil test based nutrient recommendations. • Cropping system based demonstrations of profitable crop
sequences. • Convergence of Central and State Schemes at Village level. • All 661 Mandals are selected and out of 13040 villages of
1/3rd (4346 villages) are selected for 2014-15 the remaining villages will covered in next 2 years.
• Regular monitoring by Department Officials.• Capacity building through FFS and Cropping System
based Training Programme.
Village Action Plan

POLAM PILUSTHONDHI
• The main objective of “Polam Pilusthondhi” programme is to strengthen the extension reach to the farmers doorstep, to increase the productivity in agriculture and allied sectors.
• The Programme is being organized in all the mandals of the state on every Tuesday and Wednesday, covering two villages on each day.
• The Programme have been implemented in the state since 12th August 2014 , to cover 31,728 villages in 661 mandals in a period of 3 months .
• So far, the Programme was organized in 15,585 villages covering 6,34,449 farmers (including 1,01,382 women farmers)
• The Major issues raised by the farmers during the programme are being addressed by the concerned Departments.

34
Soil Health Management Programs in AP:
1. Productivity Enhancement through BHUCHETANA• The Dept is implementing BHUCHETANA in 13 districts of A.P.
covering an area of 132200 ha in Kharif 2014 @ 200ha/ mandal and 49575 ha in Rabi 2014-15 @75ha/ mandal under RKVY with an outlay of Rs.14.0 crores.
• 2-3 villages identified in each mandal & stratified soil sampling was done by collecting 10 representative soil samples from the targetted area. These samples were analysed for macro and micro nutrients and fertilizer recommendations were given.
• The secondary and micronutrients were supplied to the farmers on 50% subsidy as per the soil test based recommendations for the proposed area.
• In order to converge good management practices, different schemes namely organic farming, seed village programme, Farmer Field School, NFSM, Promoting fodder production, farm ponds and machineries (individuals as well as hiring centres) will be implemented in the Project area.

Critical Interventions to increase paddy Productivity and Production•In light soils growing green manure and incorporation
improves the soil organic matter content
•Direct seeding or drum seeding or SMSRI methods to ensure timely
sowing, saving time in raising nurseries and transplantation.
FLDs with new varieties : Swarna sub1 – 125 ha , BPT 5204 sub1 – 45ha and Sabhagi Dhan – 100ha.
Cropping sequence : Increase the area of ID crops like pulses, oil seeds and millets during rabi in Paddy – Paddy cropping system through Cluster demonstrations.
•Weed management through weedicides application & Weeders.
•Majority of the soils are deficient in Zinc and also micronutrients like
Boron, Iron, etc,. Rectification through soil and foliar application.
VI. Future Prospects for Food grains Production

Productivity enhancement in Coarse Cereals
Efforts to increase area of Millets by appropriate cropping sequence with either pulses or Oil seeds under rainfed conditions. Cropping sequence : Bajra – Ragi Miner Millets – Groundnut Ragi – Horsegram Pulses- Maize Ragi/Korra – Rajma Paddy- Maize Ragi/Korra – Niger
Seed replacement: Maize– DHM-117 Jowar – CSV 23,MJ – 278
Ragi – Srichaitanya, Vakula, Hima, Bharathi Korra – SIA-3085, Surnandi(short duration), Srilaxmi, Bajra- PHV-3
Demonstrations of improved package in 6873 ha.

• Introducing high yielding location specific new varieties in Pulses.• Increasing the area under pulses in Rice fallows • Popularizing intercropping of Red Gram with other
pulses and.• Increasing the area of Green gram & Black gram during
summer.• Raising Red gram on Rice bunds. •Growing short duration varieties of millets and pulses in
remain unsown during kharif 2014 as contingent crop. FLDs with new varieties : Redgram- ICPH 2671 & ICPH 2740 (Hybrid) Blackgram- PU 31, LBG 787 Greengram – TM 96-2, LGG 486
Bengalgram – JAKI 9218, KAK 2
Critical Interventions to increase Pulses Productivity and Production
•GOI has allocated additional 9.8 crores
funds for increasing pulse area in rabi/summer.
•It is proposed to cover an area of 11000 ha
in Srikakulam,Vizianagaram, Eastgodavari,
West Godavari districts during summer.
•It is also planned for increasing pulses
area in rice fallows in all districts.
Increasing pulses area during rabi/summer

CRITICAL INTERVENTIONS TO INCREASE OILSEED PRODUCTIVITY AND PRODUCTION
• Seed and varietal replacement• Popularization of short duration varieties in water scarcity areas
and popularization of resistant varieties.• Promoting intercropping with redgram and cash crops.• Adopting appropriate cropping sequence for increasing area• Popularization of pre emergence weedicides for effective control
of weeds.• Effective use of water through sprinkler sets and water carrying
pipes in low water available areas• Capacity building: On farm training through Farmer Field Schools.• Increasing oilseeds area in rice fallow during rabi.

40
Custom Hiring Centers
S.No Name of CHC No of CHC supplied in the state till 2013
No of CHC in 2014-15
Financial projection in Rs.
crores
1 CHC PADDY
aConversion of traditional paddy into slightly modified SRI system (SMSRI)
64 5 125.000
b Mini SMSRI centers 24 8 100.000
c Nursery Package 3 11 11.000
2 Adapting Sugarcane cultivation to Mechanization(SSI) 7 1 75.000
3 CHC on Cotton 467 35 140.000
4 CHC on Maize 13 6 90.000
5 CHC on Ground nut 197 20 150.000
6 CHC on harvesting package 1 19 236.500
Total 776 105 927.50
The CHC’s are supplied to a group of 3-5 farmers with 50% subsidy . The group of farmers are gaining income by hiring the implements of CHC to other farmers in the
surrounding villages right from land preparation to harvesting.

AGRISNET
AGRISNET – The department portal in Telugu language is enriched with latest technical knowledge in Agriculture with lot of photos and videos.
The soil test based fertilizer recommendations are made online and sent to farmer instantly through SMS. Till date more than 15+ lakh samples made online.
Online License Management System – The process of issue of Fertilizer licenses of Manufacturer, wholesale and retail dealers is automated and for every user specific time period is fixed for processing the applications, thus bringing lot of transparency in the system.
The workflow process in the fertilizer and pesticide testing laboratories is automated and the process of bar-coding of samples drawn is introduced to maintain utmost secrecy. The application is recently launched and is under trial run.
Farmers Portal – Kisan SMS - 12,000+ No. SMS sent to farmers on timely advisories on Agriculture
National Optical Fiber Network (NOFN) – Farmers Empowerment programme of digital learning for famers is being taken up through Video Conference for farmers of Parwada mandal of Visakhapatnam district for a period of 3 months Till now 7 sessions were conducted successfully involving Agriculture & allied departments.
www.apagrisnet.gov.in
41

Other Software Applications
Mee-Seva Center
Application for Subsidized Farm Implements by
farmers
Application by Dealers/ Manufacturers Fertilizer
for issue of Input Licences
Seeds Licence Issuing
Pesticide Licence Issuing
Apps in pipeline
Agricultural Services through Mee Seva Centers
All Proceedings/
orders Licences, etc.
generated online are
Digitally Signed by
respective officers

THANK YOU
43

44
CROP WISE TARGETS FOR 2014-15
S.No Crop
Normal AreaTarget
(Lakh ha.)
Kharif Rabi
Area (Lakh ha.) Yield (Kg/ Ha)Production
(Lakh Tonnes)
Kharif Rabi Total Kharif Rabi Total Kharif Rabi Total
1 Paddy 16.42 8.13 18.55 8.29 26.84 5992 7644 6529 49.62 34.9 84.512 Jowar 0.32 1.03 0.37 1.41 1.78 4813 6594 6584 0.7 3.73 4.433 Bajra 0.4 0.02 0.45 0.05 0.5 3184 3323 3180 0.75 0.07 0.834 Maize 0.75 1.92 1.1 1.87 2.97 8425 19071 13865 4.65 17.7 22.375 Ragi 0.35 0.05 0.4 0.08 0.48 2550 3833 2817 0.41 0.15 0.56Minor Millets 0.28 0.01 0.34 0.01 0.35 1994 1900 2002 0.34 0.01 0.35
Total Coarse grain 2.11 3.04 2.42 3.42 5.84 5236 11355 9078 6.85 21.7 28.536 Horse gram 0.08 0.27 0.09 0.3 0.39 1252 1285 1268 0.04 0.18 0.237 Greengram 0.28 1.03 0.32 1.31 1.63 1006 1269 1177 0.13 0.83 0.968 Blackgram 0.2 3.55 0.22 4.29 4.51 1399 1564 1549 0.17 3.39 3.569 Redgram 2.04 0.03 2.31 0.01 2.31 1044 1709 1899 1.27 0.06 0.01
10 Bengalgram 0 5.07 0 5.5 5.5 0 1424 1424 0 7.84 7.8411 other pulses 0.62 0.08 0.7 0.08 0.78 986 1348 1304 0.03 0.07 0.1
Total Pulses 2.66 10.03 3 11.6 14.6 316 599 516 12.37 13.3 22.92Total Foodgrain 21.2 21.23 24 23.3 47.2 4810 5222 4969 58.11 68.9 127.112 Groundnut 10.9 1.11 12.32 0.74 13.06 795 2220 875 9.78 1.63 11.4113 Sesamum 0.35 0.25 0.4 0.07 0.47 0 498 498 0 0.03 0.0314 Sunflower 0.34 1.67 0.39 1.68 2.07 706 956 933 0.12 1.61 1.7315 Castor 0.87 0.45 0.98 0.47 1.45 0 138 148 0 0.07 0.0716 Soybean 0.02 0 0.02 0 0.02 1567 0 1567 0 0 0Total Oilseeds 12.5 3.22 14.1 2.54 16.6 793 1336 882 10.21 3.39 13.6
17 Cotton 4.82 0.05 5.45 0 5.45 994 0 994 21.2 0 21.218 Mesta 0.19 0 0.22 0 0.22 3194 0 3194 0.79 0 0.79
Total Area 38.71 24.5 43.77 25.84 69.47