kpmg global energy institute webcast - … gei shale webc… · kpmg global energy institute...
TRANSCRIPT

1
KPMG Global Energy Institute Webcast
Shale Development Global Update
October 24, 2013
Disclaimer
The information contained herein is of a general nature and is not intended to address the circumstances of any particular individual or entity. Although we endeavor to provide accurate and timely information, there can be no guarantee that such information is accurate as of the date it is received or that it will continue to be accurate in the future. No one should act upon such information without appropriate professional advice after a thorough examination of thesuch information without appropriate professional advice after a thorough examination of the particular situation.
© 2013 KPMG LLP, a Delaware limited liability partnership and the U.S. member firm of the KPMG network of independent member firms affiliated with KPMG International Cooperative (“KPMG International”), a Swiss entity. All rights reserved. NDPPS 220714
1

2
WelcomeSteve Estes
KPMG Partner, U.S. Shale Leader
KPMG LLP (U.S.)
Administrative
CPE regulations require online participants take part in online questions.
– You must respond to a minimum of four questions per 50 minutes in order to be eligible for CPE credit.
Polling questions will appear on your media player on top of the slides– Polling questions will appear on your media player on top of the slides.
– Results will be reviewed in aggregate and may be published as a “pulse survey” of the marketplace in the aggregate. Please note that no responses will be tracked back to any individual or organization.
To ask a question, use the “Ask A Question” icon on your media player.
Help Desk: 1-877-398-1471 or outside the United States at 1-954-969-3342
© 2013 KPMG LLP, a Delaware limited liability partnership and the U.S. member firm of the KPMG network of independent member firms affiliated with KPMG International Cooperative (“KPMG International”), a Swiss entity. All rights reserved. NDPPS 220714
3

3
Speakers
Richard Burnett, Partner, Transactions and Restructuring, KPMG LLP (U.S.)
Drew Koecher, Transactions and Restructuring Leader for Energy & Natural Resources, KPMG LLP (U.S.)
David Xu Partner China Energy Sector KPMG China David Xu, Partner, China Energy Sector, KPMG China
Anthony Lobo, Partner, Transaction Services, KPMG Europe LLP (U.K.)
© 2013 KPMG LLP, a Delaware limited liability partnership and the U.S. member firm of the KPMG network of independent member firms affiliated with KPMG International Cooperative (“KPMG International”), a Swiss entity. All rights reserved. NDPPS 220714
4
Agenda
U.S. Update – Maturing of the U.S. Landscape
ASPAC Update – Running for Second Place
U.K. Shale Gas Update – An Industry in Infancy
Audience Q&A
© 2013 KPMG LLP, a Delaware limited liability partnership and the U.S. member firm of the KPMG network of independent member firms affiliated with KPMG International Cooperative (“KPMG International”), a Swiss entity. All rights reserved. NDPPS 220714
5

4
U.S. Update – Maturing of the U.S. Landscape
U.S. shale
© 2013 KPMG LLP, a Delaware limited liability partnership and the U.S. member firm of the KPMG network of independent member firms affiliated with KPMG International Cooperative (“KPMG International”), a Swiss entity. All rights reserved. NDPPS 220714
7

5
U.S. shale – overview
Per Advanced Resources International’s (ARI) 2013 report, there are 41 countries with technically recoverable shale resources(a 21 percent increase from 2011).
Top 10 countries with technically recoverable shale oil resources
Rank Country Shale oil (billion barrels)
1 Russia 75
2 US* 58 (48)
Top 10 countries with technically recoverable shale gas resources
Rank Country Shale gas (trillion cubic meters (tcm))
1 China 31.6
2 A ti 22 72 US* 58 (48)
3 China 32
4 Argentina 27
5 Libya 26
6 Australia 18
7 Venezuala 13
8 Mexico 13
9 Pakistan 9
10 Canada 9
Total 345 (335)
2 Argentina 22.7
3 Algeria 20.0
4 US* 18.8 32.9
5 Canada 16.2
6 Mexico 15.4
7 Australia 12.4
8 South Africa 11
9 Russia 8.1
10 Brazil 6.9
Total 207 221
*EIA estimates used for ranking order. ARI estimates in parentheses.
Sources: EIA Technically Recoverable Shale Oil and Shale Gas Resources June 10 2013 accessed via http:/www eia gov/analysis/studies/worldshalegas/
© 2013 KPMG LLP, a Delaware limited liability partnership and the U.S. member firm of the KPMG network of independent member firms affiliated with KPMG International Cooperative (“KPMG International”), a Swiss entity. All rights reserved. NDPPS 220714
8
Hydraulic fracturing refined by Mitchell Energy in the Burnett Basin during the late 1990s has been at the forefront of the U.S. shale growth.
In 2000, shale gas accounted for less than 2 percent of U.S. gas production while this percentage rose to 40 percent during 2012.
The EIA estimates 827 TcF of unrisked, unconventional gas resources, which would exceed 100 years of supply at current production rates.
Sources: EIA Technically Recoverable Shale Oil and Shale Gas Resources, June 10, 2013 accessed via http:/www.eia.gov/analysis/studies/worldshalegas/
U.S. shale – overview (continued)
Impact of shale oil and gas
The newly found sources of U.S. domestic oil and natural gas, derived primarily from shale deposits, added more than $1,200 in 2012 to the discretionary income of the average U.S. family*.
D ti U S d ti tl t 1 2 illi j b d t d t t Domestic U.S. energy production currently supports 1.2 million jobs and expected to grow to 3.3 million by 2020*.
Shale production results in industrial natural gas costs approximately one-third the cost faced by European manufactures and one-fourth of what Asian companies are paying, driving a re-shoring and redevelopment of the manufacturing and chemical base within the United States.
Numerous data points support the fact that shale production was a key driving factor in the United States moving out of the recession.
Shale oil growth is projected to increase 15 percent to 7.47 million barrels a day by the end of
© 2013 KPMG LLP, a Delaware limited liability partnership and the U.S. member firm of the KPMG network of independent member firms affiliated with KPMG International Cooperative (“KPMG International”), a Swiss entity. All rights reserved. NDPPS 220714
9
2013.
Shale has led to the possibility of exporting liquid natural gas (LNG) from the United States with 4 LNG plants currently approved. Exports are forecasted to be 6.5 – 8.5 billion cubic feet by the end of the decade. Approximately 18 projects are currently awaiting permitting –Cheniere’s Sabine Pass, TX terminal is under construction with a projected completion date in 2015.
* - per IHS Herold report

6
U.S. shale – growth in the United States
Contributing factors to the growth of U.S. shale
The technology changes from 2-D seismic to 3-D seismic and micro-seismic fracturing mapping
Horizontal drilling and pad consolidation driving efficiencies
Technology advances in wellhead production including fluids, smart proppants, and various modifications to the underlying fracking methods themselves
Intangible drilling credits for capital put forth to drill new wells are a significant tax advantage for E&P companies
Higher initial production rates as a result of fracking
Eagle Ford Well Curve Barnett Well Curve
© 2013 KPMG LLP, a Delaware limited liability partnership and the U.S. member firm of the KPMG network of independent member firms affiliated with KPMG International Cooperative (“KPMG International”), a Swiss entity. All rights reserved. NDPPS 220714
10
U.S. shale – Investment return rates and price fluctuations
The significant increase in gas reserves associated with shale has largely contributed to the sustained downward pressure on prices while diversity in the basins (i.e., oil/liquid rich plays versus dry gas) and lack of adequate infrastructure has led to notable price differentials across the United States:
– At the current NYMEX (Strip), the IRRs for the Eagle Ford basin exceed 40 percent while IRRs of the dry gas associated with the Haynesville basin is less than 10 percent
The increase in shale gas production has led to an over supply of gas resulting in a lower price environment for gas; however, as oil prices have remained high, relative to history, the drilling associated with shale oil has continued to grow.
$6
$8
$10
$12
$14
$16
800
1,000
1,200
1,400
1,600
1,800
Price p
er m
Rig
co
un
t
$60
$80
$100
$120
$140
$160
600
800
1,000
1,200
1,400
1,600
Price p
er BOR
ig c
ou
nt
© 2013 KPMG LLP, a Delaware limited liability partnership and the U.S. member firm of the KPMG network of independent member firms affiliated with KPMG International Cooperative (“KPMG International”), a Swiss entity. All rights reserved. NDPPS 220714
11
$-
$2
$4
$6
0
200
400
600
cf
Natural gas rig count Henry Hub natural gas price
$-
$20
$40
$60
0
200
400
600 OER
Oil rig count WTI oil price
7
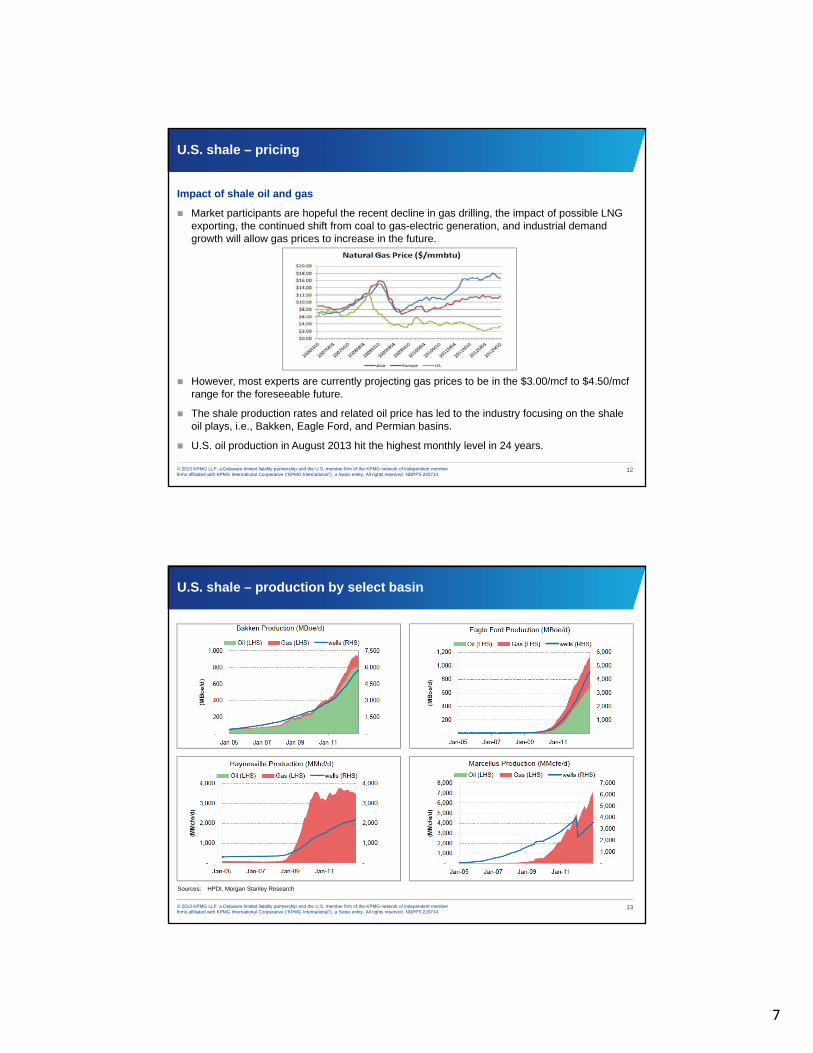
Impact of shale oil and gas
Market participants are hopeful the recent decline in gas drilling, the impact of possible LNG exporting, the continued shift from coal to gas-electric generation, and industrial demand growth will allow gas prices to increase in the future.
U.S. shale – pricing
© 2013 KPMG LLP, a Delaware limited liability partnership and the U.S. member firm of the KPMG network of independent member firms affiliated with KPMG International Cooperative (“KPMG International”), a Swiss entity. All rights reserved. NDPPS 220714
12
However, most experts are currently projecting gas prices to be in the $3.00/mcf to $4.50/mcf range for the foreseeable future.
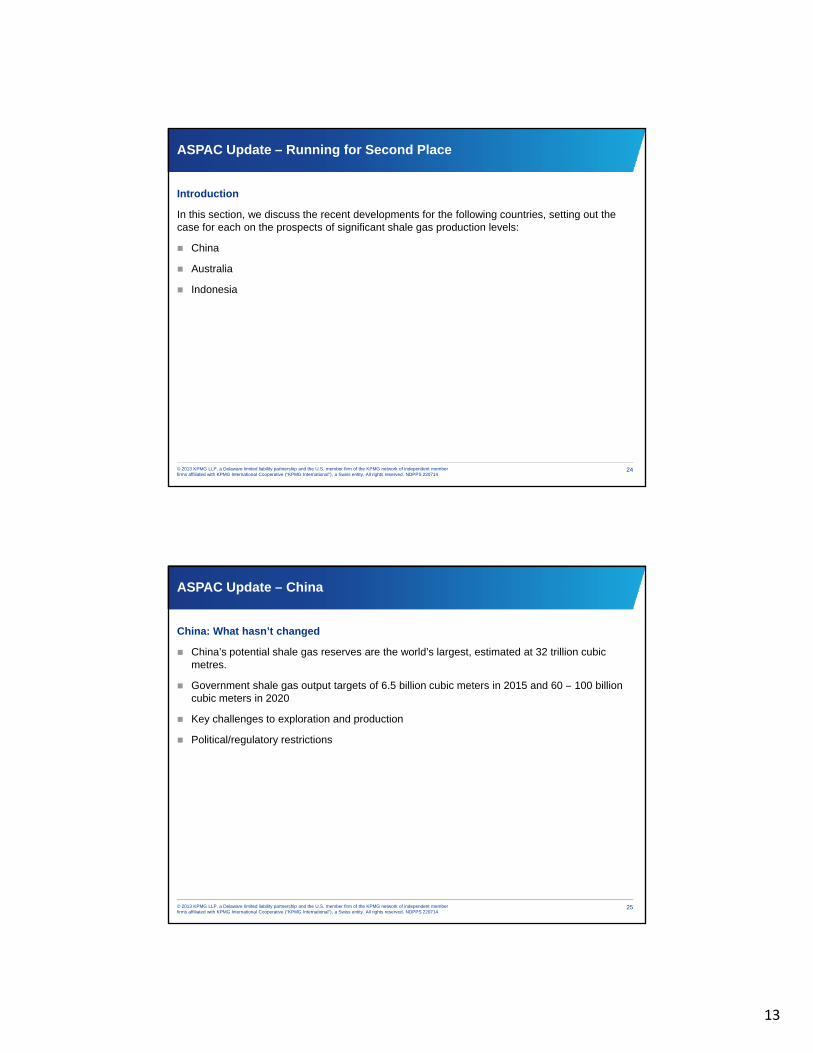
The shale production rates and related oil price has led to the industry focusing on the shale oil plays, i.e., Bakken, Eagle Ford, and Permian basins.
U.S. oil production in August 2013 hit the highest monthly level in 24 years.
U.S. shale – production by select basin
© 2013 KPMG LLP, a Delaware limited liability partnership and the U.S. member firm of the KPMG network of independent member firms affiliated with KPMG International Cooperative (“KPMG International”), a Swiss entity. All rights reserved. NDPPS 220714
13
Sources: HPDI, Morgan Stanley Research

8
Polling question # 1
Which basin is credited with being the first shale play?
A. Eagle Ford
B. Barnett
C. Mitchell
D. Devon
© 2013 KPMG LLP, a Delaware limited liability partnership and the U.S. member firm of the KPMG network of independent member firms affiliated with KPMG International Cooperative (“KPMG International”), a Swiss entity. All rights reserved. NDPPS 220714
14
U.S. shale – M&A overview
Shale has led to significant acquisitions
The size and scalability of shale has attracted the majors and significant foreign investment
U.S. shale gas M&A
Others, 78
Shale gas(a), 40
U.S. deals’ break-out by basins
118U.S. M&A deals
YTD July 15, 2013(66.1%)
(33.9%)
Shale Basin # Deals % of Total
Eagle Ford Shale 8 20.0%
Permian Shale 6 15.0%
Bakken Shale 4 10.0%
Utica Shale 2 5.0%
Mississippian Shale 2 5.0%
Marcellus Shale 2 5.0%
Barnett Shale 1 2.5%
Anadarko Shale 1 2.5%
Fort Worth Shale 1 2.5%
© 2013 KPMG LLP, a Delaware limited liability partnership and the U.S. member firm of the KPMG network of independent member firms affiliated with KPMG International Cooperative (“KPMG International”), a Swiss entity. All rights reserved. NDPPS 220714
15
Fort Worth Shale 1 2.5%
Others U.S. Shale basin 13 32.5%
Total 40 100.0%
Notes: Six-month period January 2013 to July 2013Sources: Capital IQ, IHS Herold, Wood Mackenzie, KPMG Analysis

9
U.S. shale – top five recent U.S. M&A deals
Top five M&A deals in the United States over the last six months
Deal values
Announced date
Target location Acquirer
Seller (of asset)/
target (corp) Deal levelTarget %
of gas Deal summary/target description
Total (U.S.$ mn)
Per boe of
reserve (U.S.$)
Per boe of daily
prod (U.S.$)
4,462 14.33
4 86 (3P)
99,369 21-Feb-13 California, Texas
Linn Energy,
Berry Petroleum
Corporate 25.8 As at 31-Dec-12, Berry had net proved reserves of 276 MMboe (74% oil/NGLs and 55% proved developed).4.86 (3P)
Permian, and Utah
gyLLC Co.
( p p )
Postcompletion of transaction, Berry will be converted into a limited liability company and then it will be contributed to Linn in exchange for Linn units.
860 22.48 n/a 05-Mar-13 Gulf of Mexico, Green Canyon
Undisclosed Anadarko Petroleum Corp.
Asset 8.0 Anadarko sold, 12.75% working interest in the Heidelberg development project in the deepwater Gulf of Mexico, for US$860 million in a drill carry commitment agreement.
Anadarko will continue as operator with a 31.5% working interest.
859 19.47 112,539 24-Jun-13 Oklahoma; Texas County
BreitBurn Energy Partners LP
Whiting Petroleum Corp.
Asset 1.9 The acquisition includes gathering Dry trail plant processing facilities, oil delivery pipeline, 60% interest in the 120-mile Transpetco-operated CO2 transportation pipeline, CO2 supply contracts and certain crude oil swaps.
Whiting will operate the properties under a transition services agreement until 31-Oct-13.
768 20.52 166,818 15-Mar-13 Permian Wolfcamp Shale
Rosetta Resource, Inc.
Comstock Resources Incorporated
Asset 24.3 The acquisition covers 53,306 net acres (87,373 gross) of producing assets in Reeves and Gaines counties in West Texas.
Comstock has 88 666 acres (54 355 net to Comstock) in West
© 2013 KPMG LLP, a Delaware limited liability partnership and the U.S. member firm of the KPMG network of independent member firms affiliated with KPMG International Cooperative (“KPMG International”), a Swiss entity. All rights reserved. NDPPS 220714
16
Delaware Basin
Comstock has 88,666 acres (54,355 net to Comstock) in West Texas, prospective in the Bone Spring and Wolfcamp shale's and the properties have proved reserves of 26.8 MMboe (76% oil; 18% developed).
733 n/a n/a 10-Jun-13 Raton Basin, New Mexico
Atlas Energy, LP
EP Energy, LLC
Asset 100.0 The transaction includes natural gas producing assets in the Raton basin in New Mexico and in the Black Warrior basin in Alabama.
The properties in the Raton and the Black Warrior basin represents ~466 Bcf of proved natural gas reserves (93% proved developed; 100% natural gas), of which 320 Bcf are in the Raton basin, 140 Bcf are in the Black Warrior basin, and 6 Bcf are in the County Line region of Wyoming.
Notes: Six month period refers to period starting on January 2013 to July 2013
Sources:IHS Herold, KPMG Analysis
U.S. shale – U.S. M&A deals summary
45
113
24
58
Others
Barnett
3
113
Do
mes
tic
(b)
Co
rpo
rate
(39.8%)
(2.7%)
During the last six months, M&A activity in the United States was dominated by asset-based transactions
Out of 113 deals in the United States, 97% were asset-based transactions:
– Less the largest deal, all of the total $9.4 billion transaction value, represented asset transactions with
d l $1 0 billi d l f $126
U.S. M&A deals by location, level, and basin (excluding top 5)
68
By location
9
8
4
322222
24
By basin
San Joaquin
Marcellus
Anadarko
Utica Shale
Mississippian
Bakken
Permian Basin
Eagle Ford
110
By levels
Inte
rnat
ion
al
(a)
Ass
et b
ased
(60.2%)
(97.3%)
no deals over $1.0 billion and an average value of $126 million.
– Besides the top deal, the period was characterized by midsize companies acquiring assets, a majority of which are located in the U.S. shale basins
Going forward, M&A activity in the United States is expected to pick up as the oil and gas majors with strong balance sheets look to acquire more shale-based assets:
– Despite the positive trends, the industry faces growing concerns about the environmental impact of hydraulic fracturing. The U.S. Environmental Protection Agency (EPA) is working to standardize and regulate activity at the federal level, including disclosure of fracking fluids
U til U S f d l li d h d li f t i
Key deal statistics in the United States
Parameter Value( )
© 2013 KPMG LLP, a Delaware limited liability partnership and the U.S. member firm of the KPMG network of independent member firms affiliated with KPMG International Cooperative (“KPMG International”), a Swiss entity. All rights reserved. NDPPS 220714
17
– Until U.S. federal policy around hydraulic fracturing becomes more clear, regulatory uncertainty will continue to influence M&A decisions about the viability of shale-gas investments in some basins
Total deal value ($ million)(c) 17,060
Average deal value(c) ($ million) 216
Highest deal value ($ million)(c) 4,462
Total Acreage Value ($ million)(d) 3,621
Average acreage value(d) ($ million) 157
Highest acreage deal ($ million)(d) 680
Note: Six-month period refers to period starting on January 2013 to July 2013(a) Domestic deals represent acquisition of U.S. assets by U.S. companies and international deals represent acquisition of U.S. assets by non-U.S. companies
(b) ‘Others’ includes the following shales – Anadarko, Piceance, East Texas, Woodbine, Niobrara, Barnett, Fayetteville, and others, bifurcation by basin includes all furl types in M&A deals in United States (c) Deal value figures are based on 79 deals with disclosed transaction values, out of a total of 118 U.S. deals
(d) Acreage value figures are based on 23 deals with disclosed acreage value, out of a total of 118 U.S. dealsSource: IHS Herold, KPMG Analysis

10
U.S. shale – challenges
Shale has not been without its critics and challenges
The fracking process takes a significant amount of water, i.e., a typical Pennsylvania well takes 4.4 million gallons.
Infrastructure: Infrastructure:
– The lack of pipelines in the Bakken has resulted in a significant amount of the production being delivered via rail. Today, rail is needed to get a significant portion of the production to market.
– Shale and the related makeup of production be it dry or wet gas has led to additional volatility at several major hubs.
– While the job growth has assisted the United States in exiting the recession, several shale areas simply do not have enough housing to support the current population growth.
© 2013 KPMG LLP, a Delaware limited liability partnership and the U.S. member firm of the KPMG network of independent member firms affiliated with KPMG International Cooperative (“KPMG International”), a Swiss entity. All rights reserved. NDPPS 220714
18
The increase in shale drilling has raised several environmental concerns, be it disposal wells, ground water, noise in populated areas, etc.
Continued political rancor at the federal and state levels and public activism has contributed to a patchwork of regulations and inconsistent regulatory standards across the states and various plays.
U.S. shale – outlook
During 2013, the United States has met 87 percent of its own energy needs, and current projections suggest the United States will no longer need to import oil in 10 years.
U.S. production is forecasted to grow through 2014, while production from OPEC countries is forecast to decline.
© 2013 KPMG LLP, a Delaware limited liability partnership and the U.S. member firm of the KPMG network of independent member firms affiliated with KPMG International Cooperative (“KPMG International”), a Swiss entity. All rights reserved. NDPPS 220714
19

11
Polling question # 2
The U.S. oil imports are projected to reach zero in 10 years.
A. True
B. False
© 2013 KPMG LLP, a Delaware limited liability partnership and the U.S. member firm of the KPMG network of independent member firms affiliated with KPMG International Cooperative (“KPMG International”), a Swiss entity. All rights reserved. NDPPS 220714
20
U.S. shale – outlook
Of all U.S. dry natural gas production, shale gas has the largest forecasted growth through 2040.
U.S. dry natural gas production (trillion cubic feet)
© 2013 KPMG LLP, a Delaware limited liability partnership and the U.S. member firm of the KPMG network of independent member firms affiliated with KPMG International Cooperative (“KPMG International”), a Swiss entity. All rights reserved. NDPPS 220714
21
Sources: EAI 2013 Annual Outlook

12
ASPAC Update – Running for Second Place
Polling question # 3
Which country do you believe will be the second largest producer to the United States of commercial shale gas in 10 years time?
A. China
B ArgentinaB. Argentina
C. Australia
D. United Kingdom
E. Other
© 2013 KPMG LLP, a Delaware limited liability partnership and the U.S. member firm of the KPMG network of independent member firms affiliated with KPMG International Cooperative (“KPMG International”), a Swiss entity. All rights reserved. NDPPS 220714
23
13
ASPAC Update – Running for Second Place
Introduction
In this section, we discuss the recent developments for the following countries, setting out the case for each on the prospects of significant shale gas production levels:
China China
Australia
Indonesia
© 2013 KPMG LLP, a Delaware limited liability partnership and the U.S. member firm of the KPMG network of independent member firms affiliated with KPMG International Cooperative (“KPMG International”), a Swiss entity. All rights reserved. NDPPS 220714
24
ASPAC Update – China
China: What hasn’t changed
China’s potential shale gas reserves are the world’s largest, estimated at 32 trillion cubic metres.
Government shale gas output targets of 6 5 billion cubic meters in 2015 and 60 100 billion Government shale gas output targets of 6.5 billion cubic meters in 2015 and 60 – 100 billion cubic meters in 2020
Key challenges to exploration and production
Political/regulatory restrictions
© 2013 KPMG LLP, a Delaware limited liability partnership and the U.S. member firm of the KPMG network of independent member firms affiliated with KPMG International Cooperative (“KPMG International”), a Swiss entity. All rights reserved. NDPPS 220714
25

14
ASPAC Update – China (continued)
China: Recent developments
To date, around USD1.6 billion has been spent to drill 130 shale gas wells, among which 23 wells have a daily output exceeding 10,000 cubic metres and 8 exceeding 100,000 cubic metres
Reduction in regulatory constraints:
– Government determination to cut carbon emissions, particularly coal
– JVs encouraged
– Government subsidies
Significant M&A activity, both inbound and outbound:
– Two invitations to bid for exploration rights since 2011, and a third expected in early 2014
© 2013 KPMG LLP, a Delaware limited liability partnership and the U.S. member firm of the KPMG network of independent member firms affiliated with KPMG International Cooperative (“KPMG International”), a Swiss entity. All rights reserved. NDPPS 220714
26
Two invitations to bid for exploration rights since 2011, and a third expected in early 2014
– Slow progress to date – most of the JVs have yet to start serious exploration programs
ASPAC Update – China (continued)
China: Summary
It is highly unlikely that the government’s 2015 target will be met.
The “how” to obtain China’s shale gas appears to be the biggest hurdle currently.
Further incentives and price controls are needed from the government to spur growth.
© 2013 KPMG LLP, a Delaware limited liability partnership and the U.S. member firm of the KPMG network of independent member firms affiliated with KPMG International Cooperative (“KPMG International”), a Swiss entity. All rights reserved. NDPPS 220714
27

15
ASPAC Update – Australia
Australia characteristics
Estimated to hold the world’s 7th largest reserves of shale gas at almost 11tcm. Reserves exist in most mainland states, no more so than the Cooper Basin (130,000km2) and the Canning Basin (470,000km2).
Basins are in largely remote locations.
Infrastructure is already in place and available in some areas.
Stable government
Export and LNG possibilities
High costs
© 2013 KPMG LLP, a Delaware limited liability partnership and the U.S. member firm of the KPMG network of independent member firms affiliated with KPMG International Cooperative (“KPMG International”), a Swiss entity. All rights reserved. NDPPS 220714
28
ASPAC Update – Australia (continued)
Developments in Australia
Australia’s first shale gas well came online in October 2012 in the Cooper Basin.
Operated by Santos Limited
Output currently services 40,000 homes in Adelaide and Sydney. Further supplies to be sent to LNG markets in partnership with Malaysia’s Petronas.
Inbound M&A activity confirms shale gas in Australia is no longer dormant in the eyes of the world. In the last 12 months, the following deals/JVs have been announced:
Chevron acquired a stake in Beach Energy’s Cooper Basin interests for USD349 million.
Hess Corp and PetroChina to develop in Western Australia
ConocoPhilips Shell and New Standard Energy in the Canning Basin
© 2013 KPMG LLP, a Delaware limited liability partnership and the U.S. member firm of the KPMG network of independent member firms affiliated with KPMG International Cooperative (“KPMG International”), a Swiss entity. All rights reserved. NDPPS 220714
29
ConocoPhilips Shell and New Standard Energy in the Canning Basin
Norway’s Statoil and Australia’s PetroFrontier JV to explore in Northern Australia as part of a USD210 million investment in the Georgina Basin
Buru Energy and Mitsubishi JV in the Canning Basin

16
ASPAC Update – Australia (continued)
Australia: Summary
Recent output on a commercial scale is promising.
Development on a large scale is in its infancy.
It is too early to speculate about when Australian shale gas will become commercially viable on a scale like the one in the United States, but the marked increase in activity over the past year by major, well-resourced, international entities suggests the push is underway.
© 2013 KPMG LLP, a Delaware limited liability partnership and the U.S. member firm of the KPMG network of independent member firms affiliated with KPMG International Cooperative (“KPMG International”), a Swiss entity. All rights reserved. NDPPS 220714
30
Polling question # 4
What have you heard about in the last 12 months with regard to shale gas in the ASPAC region?
A. M&A activity
B Green activists/protestsB. Green activists/protests
C. Commercial production figures
D. Exploration not feasible/too costly
E. Other
F. Heard very little to nothing
© 2013 KPMG LLP, a Delaware limited liability partnership and the U.S. member firm of the KPMG network of independent member firms affiliated with KPMG International Cooperative (“KPMG International”), a Swiss entity. All rights reserved. NDPPS 220714
31

17
ASPAC Update – Indonesia
Indonesia: Summary
In May 2013, the Indonesian government announced tenders for 21 oil and gas exploration blocks, 2 of these for shale gas.
Indonesia reportedly has shale gas reserves of around 16tcm making it one of the world’s Indonesia reportedly has shale gas reserves of around 16tcm making it one of the world s largest shale markets potentially.
State oil and gas company Petamina has the first shale gas concession in the country and has enlisted Canada’s Talisman Energy to deploy technical expertise.
Major international players such as Chevron, ConocoPhilips, and ExxonMobil have expressed interest in developing shale gas in Indonesia.
Biggest challenge is regulation, which is significantly burdensome:
Developers are obliged to sell 25 percent of proven reserves to Indonesia’s domestic
© 2013 KPMG LLP, a Delaware limited liability partnership and the U.S. member firm of the KPMG network of independent member firms affiliated with KPMG International Cooperative (“KPMG International”), a Swiss entity. All rights reserved. NDPPS 220714
32
– Developers are obliged to sell 25 percent of proven reserves to Indonesia’s domestic demand.
– There are few incentives linked to the development of shale gas in the country.
– The Indonesian government takes a majority shareholding in any gas block.
ASPAC Update – Wrap up
ASPAC key points
Recent broker and expert reports state Australia may be better placed than China to produce significant quantities of shale gas next.
However raw potential remains strong in China given the large recoverable estimates The However, raw potential remains strong in China given the large recoverable estimates. The key for China is how long it can get through the “learning” phase and move into scale production.
One thing with which everyone is in agreement is that China and Australia shale gas plans are still in their infancy.
© 2013 KPMG LLP, a Delaware limited liability partnership and the U.S. member firm of the KPMG network of independent member firms affiliated with KPMG International Cooperative (“KPMG International”), a Swiss entity. All rights reserved. NDPPS 220714
33

18
U.K. Shale Gas Update – An Industry in InfancyAnthony Lobo
London, United Kingdom
2013
Overall primary energy demand in the United Kingdom to remain roughly stable
35%
40%
45%
d
10%
15%
20%
25%
30%
Percentage
of P
rimary Energy Dem
and
Coal
Oil
Natural Gas
Renewables & Waste
Nuclear
© 2013 KPMG LLP, a Delaware limited liability partnership and the U.S. member firm of the KPMG network of independent member firms affiliated with KPMG International Cooperative (“KPMG International”), a Swiss entity. All rights reserved. NDPPS 220714
35
0%
5%
10%
2010 2012 2014 2016 2018 2020 2022 2024 2026 2028 2030
P
Source: Department of Energy and Climate Change

19
United Kingdom currently imports 50% gas rising to 76% by 2030
100
120
140
alen
t
20
40
60
80
100
million tonnes oil eq
uiva
Net Gas Imports
Net Gas Exports
Net Gas Production
© 2013 KPMG LLP, a Delaware limited liability partnership and the U.S. member firm of the KPMG network of independent member firms affiliated with KPMG International Cooperative (“KPMG International”), a Swiss entity. All rights reserved. NDPPS 220714
36
0
Declining tax revenues: £14 billion in 2008 down to under £4 billion in 2017
Status of the U.K. shale gas sector
Government support
Removal of moratorium
Tax incentives
Community compensation
Cuadrilla and IGas
Focus on Bowland shale
© 2013 KPMG LLP, a Delaware limited liability partnership and the U.S. member firm of the KPMG network of independent member firms affiliated with KPMG International Cooperative (“KPMG International”), a Swiss entity. All rights reserved. NDPPS 220714
37
Centrica investment
BUT
No current shale gas production

20
The case for......
Government is supportive of shale gas
U.S. investment approximately $26 billion in last five years
U.K. benefits:
Infrastructure, jobs, energy security, balance of trade
© 2013 KPMG LLP, a Delaware limited liability partnership and the U.S. member firm of the KPMG network of independent member firms affiliated with KPMG International Cooperative (“KPMG International”), a Swiss entity. All rights reserved. NDPPS 220714
38
….Jury still out on the impact on U.K. gas prices
And the case against.........
© 2013 KPMG LLP, a Delaware limited liability partnership and the U.S. member firm of the KPMG network of independent member firms affiliated with KPMG International Cooperative (“KPMG International”), a Swiss entity. All rights reserved. NDPPS 220714
39

21
Polling question # 5
Do you think that the United Kingdom will be an attractive place for investment into the shale gas industry?
A. Yes
B NoB. No
© 2013 KPMG LLP, a Delaware limited liability partnership and the U.S. member firm of the KPMG network of independent member firms affiliated with KPMG International Cooperative (“KPMG International”), a Swiss entity. All rights reserved. NDPPS 220714
40
Challenges for the United Kingdom
Characteristic
Geology Geology
Limited drill core data
Robust environmental regulation
© 2013 KPMG LLP, a Delaware limited liability partnership and the U.S. member firm of the KPMG network of independent member firms affiliated with KPMG International Cooperative (“KPMG International”), a Swiss entity. All rights reserved. NDPPS 220714
41
Infrastructure and service industry
Strong public opposition
Source: Modified from Professor Paul Stevens, Chatham House

22
Audience Q&A
Contacts
Today’s Presenters
Richard Burnett [email protected] 214-840-4031
Drew Koecher [email protected] 214-840-2576
David Xu [email protected] +86 108 508 7099
Anthony Lobo [email protected] +44 20 7311 8482
Steve Estes [email protected] 214-840-2448
© 2013 KPMG LLP, a Delaware limited liability partnership and the U.S. member firm of the KPMG network of independent member firms affiliated with KPMG International Cooperative (“KPMG International”), a Swiss entity. All rights reserved. NDPPS 220714
43

23
Thank you for joining us.
For more information on upcoming
events or to view a replay of this
Webcast, visit us at:
kpmgglobalenergyinstitute.com
Please send any questions to [email protected].
© 2013 KPMG International Cooperative (“KPMG International”), a Swiss entity. Member firms of the KPMG network of independent firms are affiliated with KPMG International. KPMG International provides no client services. No member firm has any authority to obligate or bind KPMG International or any other member firm vis-à-vis third parties, nor does KPMG International have any such authority to obligate or bind any member firm. All rights reserved NDPPS 219330
The KPMG name, logo and ‘cutting through complexity’ are registered trademarks or trademarks of KPMG International Cooperative (KPMG International).