korean fisheries and the korea-u.s. fish trade · korean fisheries and the korea-u.s. fish trade....
TRANSCRIPT

50,---------------,Foreign Fishery Developments • Current dollors 40 o 1980 dollors
Korean Fisheries and the Korea-U.S. Fish Trade
Introduction
The Republic of Korea (ROK), the world's fifth largest importer of u.s. fishery products in 1988, purchased over 16,000 metric tons (t), valued at nearly $46 million. The ROK, however, accounted for only about 2 percent of the total u.s. fishery products sold worldwide. The U.S. share of the ROK fisheries import market has fluctuated widely over the last decade. It decreased from nearly 80 percent in 1980 to only 18 percent in 1984, but rebounded to 30 percent in 1986. Conversely, the United States purchased about 61,000 t of fishery products, valued at $243 million, from the ROK in 1988. The United States has historically been the ROK's second largest market for fishery commodities, purchasing an average 11 percent of Korea's total fishery exports annually, from 1980 to 1986.
Background
The ROK has, in recent years, become one of the world's leading traders of fishery products. The country's tight import regulations have generally discouraged the importation of fish for domestic consumption, and have instead emphasized importing for the purpose of processing and re-exporting to earn foreign currency. Most of Korea's fishery imports from the United States were earmarked for re-export to Japan where they competed with U.S. fishery exports. Although the ROK still imports and re-exports a large quantity of fishery products, a booming domestic economy (with real GNP growth of about 10 percent in 1988) and a higher standard of living has greatly affected this pattern. Per capita disposable income in the ROK quadrupled between 1975 and 1986, from under $500 per year to $2,100 per year. This has resulted in a growing
51(3), 1989
Table 1.-Republlc of Korea flsherlea catch, 1980-87. (Source: FAO data.)
Year Quantity (t) Year Quantity (t)
1980 2.091,134 1984 2,477,080 1981 2.365,990 1985 2,650,026 1982 2.280,821 1986 3,103,468 1983 2,400.387 1987 2,876,367
Table 2.-The Korean flahery trade with the United Statea: Importa and exporta In current and real dollar values, 1980-88'.
Imports Exports (US$l,OOO) (US$l,OOO)
Inflation Year rate Current Rea" Current Real'
1980 13.5 27,679 27,679 69,793 69,793 1981 10.3 26,853 24,356 91,659 83,135 1982 6.2 21,639 18,478 89,218 76,192 1983 3.2 22,529 18,631 99,890 82,609 1984 4.3 12,288 9,744 101,451 80,451 1985 3.6 25,314 19,390 109,880 84,168 1986 1.9 32,728 24,579 165,196 124,062 1987 1988
3.6 NJA3
42,732 45,898
30,981 N/A
282,510 243,146
204,820 N/A
'Sources: U.S. Department of Commerce, Bureau of the Census, 1980-1988; Consumer Price Index, U.S. Bureau of Labor Statistics. '1980 constant dollars. 3N/A = Not available.
population and an increasing consumer demand for fish and processed fishery products. The ROK's fishing industry has not been able to keep pace with this demand; as a result, South Koreans have had to increase fishery imports to satisfy domestic consumption.
The Korean fisheries catch has averaged about 2.5 million t per year since 1980 (Table 1). In 1986, the ROK had a record catch of 3.1 million t, but the 1987 catch slipped back to 2.8 million tons l , primarily due to difficulties in obtaining access to distant-water fishing grounds. The Korean Government is hoping that the expansion of fishing grounds (particularly in the Bering Sea
IThe ROK's 1988 catch statistics were unavailable.
Figure I.-Korean fishery imports from the United States by value, 198088. Source: U.S. Bureau of the Census (Consumer Price Index inflation rate).
'" 300,---------------,
..2 250 _ Current dollors o 1980 dollors ~ 200
'0 150
'"a 100
~ 50
;:; 0 u,..Bo.L....I'..B,.L....I,LB2J........1'BL3'--"'BLJ4'----'aL.J5'----'aL.JG--'au1 --'aLJa
Yeor
Figure 2.-Korean fishery exports to the United States by value, 1980-88. Source: U.S. Bureau of the Census (Consumer Price Index inflation rate).
~ 250 • Current dollars
~ 200 0 1980 dollars
'0 150
~ .~
,. 100
Figure 3.-U.S. fisheries trade deficit with the Republic of Korea, 1980-88.
.Source: U.S. Bureau of the Census.
and the South Pacific), promotion of new harvesting and processing technology, replacement of older fishing vessels, renewed emphasis on aquaculture, and strengthening of marine pollution control regulations will boost the fishery catch back over the 3 million t mark.
Despite growing consumer demand in the ROK, the U.S. fisheries trade deficit with South Korea has steadily increased in this decade, both in real and current dollars (Fig. 1-3; Table 2). The trade deficit grew from $42 million in 1980 to nearly $240 million in 1987. Record U.S. fishery exports to the ROK in 1988, however, reduced the deficit to $197 million. From 1986 to 1988, the Korean
55

Table 3.-Korean fishery Imports and exports, all Tsble 4.-Korean fishery Imports from the United States, by commodity and quantity, 1980-88. Source: U,S. Depart· countries compared to the UnIted States, by vslue, ment of Commerce, Bureau of the Census. 1980·88'.
Imports (t) Imports (US$1,OOO) Exports (US$1,000)
Commodity 1960 1961 1962 1963 1964 1965 1966 1967 1968 Year Total' From U.S' Total' To U.S'
Edible 1980 35.070 27,679 (79) 759,524 69,793 (9) Fish 1961 56,Q10 26,653 (46) 931,666 91,659 (10) Frozen' 1962 56,372 21,639 (36) 661,171 89,216 (10) Whole' 3,666.9 9,173.2 7,043.1 6,364.5 6,276.0 6.946.0 10.223.0 10,630.0 5,271.1 1963 57,167 22,529 (39) 626.639 99,890 (12) Fillets 21.4 2,011.6 1,556.5 1,257.1 236.5 156.9 799.2 631.0 1,622.0 1964 66,044 12.266 (16) 877,516 101,451 (12) Canned 3.4 5.6 9.6 5.2 0.1 0.9 14.3 20.5 1.2 1965 69,977 25,313 (26) 690,615 109,680 (12) Cured 459.5 1.3 745.5 4.4 0.6 2.0 12.4 1986 117.079 32,726 (30) 1.273,336 165,196 (13) Roe 1,726.1 986.5 1,660.0 1354.5 657.5 2,601.0 269.6 423.6 2,321.5 1967 N/A' 42.732 N/A N/A 262,510 N/A Other 26.6 58.4 40.4 59.7 55.5 8.1 10.3 37.1 3,639.5 1966 N/A 45,696 N/A N/A 243,146 N/A
Subtotal 6,126.1 12,236.8 11,075.1 9,041.0 7,230.0 9,915.7 11,336.6 11,944.2 12,667.7 'Sources: FAa (for total ROK fishery imports, 1960-1966); Sheillish Ministry of Agriculture and Fisheries. Republic of Korea (for Frozen' 41.7 66.5 31.4 661.9 731.5 1,075.4 2,697.3 2,652.6 1,961.3 total Korean fishery exports, 1960-1986); U.S. Department Canned 36.9 9.3 92.0 17.5 5.5 10.1 22.0 42.7 of Commerce, Bureau of the Census (for U.S. import and Other 3.5 0.6 2.3 0.7 3.1 5.4 43.3 export statistics, 1960-66). 'The total imports and exports columns may not be com Subtotal 60.6 79.3 32.0 953.9 751.3 1061.6 2,910.5 2,660.0 2,047.3 pletely compatible, as FAa statistics (total imports) do not include seaweeds, but ROK Ministry of Agriculture and Total edible 6,206.7 12,316.1 11,107.1 9,994.9 7961.3 10,979.3 14,247.1 14,624.1 14,915.0 Fisheries statistics (total exports) do. 3Joint venture sales are not included. Data in parentheses Inedible indicate the percentage of the total. Meal/scrap 96.2 364.7 518.9 'N/A = Not yet availabie. Oil 16.2 6.4 9.9 3.6 6.9 0.4 0.2 59.5
Other' 606.6 564.0 249.8 261.6 130.1 53.1 328.2 645.4 761.0
Total inedible 624.6 590.4 259.7 265.4 137.0 53.1 424.8 1,010.3 1,339.4
Inedible partial 100r---------------, fishery products N/A' N/A N/A N/A N/A N/A N/A N/A N/A
_ Imports from the U. S. ~ 80 CJ EKporls 10 the U. S.
Grand total' 6,631.5 12,906.3 11,366.7 10,260.3 8.116.4 11,032.2 14,671.8 15,834.4 16,254.4
'May include small quantities of live and fresh product. 'May include small quantities of live product. 3Marine shells and other industrial fishery products. 'N/A = Not available. a '80 '81 '82 '83 '84 '85 '86 '87 '88 'Columns may not sum to total because of rounding. Year
g60
g 40 .c ::. 20
Figure 4.-Korean fishery trade with the United States by quantity (inedible partial fishery products not included), 1980-88. Source: U,S,
is up (Fig. 1, 4; Table 3). The ROK is $6.5 million in 1983 to about $55 milBureau of the Census. the fifth largest importer of U.S. seafood lion in 1988 (Table 8). This increase was products in the world, behind Japan, triggered by a drop in the ROK directed Canada, the United Kingdom, and fishing allocation in U.S. waters, from France. The United States shipped 279,000 t in 1983 to 0 in 1988. Although
won2 appreciated more than 30 percent 16,250 t of fishery products, valued at U.S. Customs has not recorded joint against the U.S. dollar, partiallyaccount nearly $46 million, to the ROK in 1988 venture sales of fish over-the-side to ing for the success of 1988 u.s. fishery (Tables 4-7). This represented an in Korean processing vessels as exports exports to Korea. Korea has also taken crease of nearly 3 percent by quantity in the past3 , the ROK Customs has advantage of the rapid appreciation of and 8 percent by value over U.S. fish counted them as imports from the United the Japanese yen and has boosted fish ery exports to South Korea in 1987 States. If U.S. Customs had included ery exports to Japan, many of which are (15,800 t, valued at $43 million). Despite joint venture sales as exports, however, re-exported imports from the United this increase, the ROK purchased only U.S. fishery exports and joint venture States, 2 percent, by value, of the total U.S. sales to the ROK would have totaled
fishery products exports to all countries over $100 million in 1988. Foreign fishKorea's Imports From in 1988. ery joint ventures in U.S. waters will be
the United States Along with the small increase in fish phased out in the near future because ery imports from the United States, the of the growing demand for fishery re
Overview ROK has also greatly increased its joint sources by U.S. fish processors. There Although South Korean imports of venture fishery operations in the U.S. is not enough fish to satisfy both U.S.
U. S. fishery products have fluctuated Exclusive Economic Zone (EEZ) in re domestic demand and foreign joint venover the past 9 years, the overall trend cent years. The value of over-the-side ture requests.
sales of Alaskan groundfish (primarily walleye pollock) by U.S. fishermen to 'The exchange rate was at about 630 won per u.s. 3The u.s. Customs Service will begin counting
dollar. Korean processing vessels grew from U.S. Fishery Joint venture sales as exports in 1989.
Marine Fisheries Review 56

Korea's Import Policies
The ROK prohibited imports of many fishery products for domestic consumption until 1978. At that time, the Korean Government began to relax import restrictions to prevent an increase in domestic prices caused by expanded consumer demand for fishery products. However, Korea still requires import licenses and imposes tariffs on foreign fishery imports to protect its domestic fishing industry and prevent an overreliance on foreign fishery imports. Fishery products can be imported duty free when they are processed in Korea and then re-exported.
Import Licensing
A serious barrier in exporting fishery products to the ROK is the Korean government's requirement for import permission (i.e. ,.an import license). Some fishery commodities are approved without question and are said to be on the "automatic approval" list. Despite some progress in liberalizing fishery imports, many fish and shellfish products are still on a restricted list. To import a restricted fishery commodity, special permission must be secured from the Administrator of the National Fisheries Administration on a case-by-case basis.
ROK government officials have rejected U.S. requests that specific fishery commodities be liberalized, stating that licensing restrictions are actually protecting U.S. exporters of these commodities by keeping cheaper imports from the Soviet Union and other countries from competing with U.S. fishery products on the Korean market. They also claim that it has not been politically expedient for the Korean government to completely liberalize fishery imports. South Korea's fishermen present a potent political force and the government has had to show a strong front against outside pressures to liberalize to please this constituency. The restricted commodities most important for U.S. exporters are various Alaska groundfish (walleye pollock, turbot, flounders, yellowfin sole, and halibut). Other items, such as rockfish, sablefish, and herring are among the many commodities on the ROK's automatic import approval list, but these products are mainly re-exported to Japan.
51(3), 1989
t: I.. Q
ui :::i
~ o " Ul
cD ~ o ~
,; iii."> .. -g~ .. ~ ~o
'Ue:e 0 0"" .. ~; ,jill.. -".. " Ui~",e $e §8 ~o
eI ,ge III t: 8.§ ~.. .c ~ c.. ~
"o
I ui.. :;;.. ...
"' .... '" lrill'ici.. '" '"cO
v"",""'mMt.ricici ~m cO
o .,;
.... o
.. ~O>
~~cO 0'"cO C\I~
0"'''""':"";0
""" '" "''''''' ~..:
"''''~cwi"":ai"' .. '"........ '" ...£..:
"''''0>t;i,,;;t; 0> .. ,..:C\i
O),.... ..... "'M,.... .... <ri~tDMlti~ 00 U1C"),....C\Icn ....
~ ....._ at .....0>
N~ I! I~ "'0>0oolen "''''~ <D~
,,;I~ I!
I.OCOMcnCO
~~?J~~ COIOCDIOC\l cONN
0 .... cn ..... It)
l8:g~1ll~ COCDClO .... Iti"v·CIi
.... C\lvo.q-v('f) cxia:iaiNNM"': ..... IOM(\I .....
.......... O)C\I .... an ~~<DaiNN
"''''''' cicio"'0>'"r--: .... T'"" I!
COt--LOC\lO) .....
:~Lri~~re ~'" 00N ai I~ COO>COOlC\l<D aicicic::iaiai O>N ..... 01'- ..... 1.0 0,....aj •
vvo co ..... 00'"Mci~ MM uim C\I..- ..... U')Q) oeo co ...... "'''' MN M "''''cO
COlO(") ..... Q)U') 0> -io(fj""':cOC\i g.... mCO l.OM,....U') v ..... NN NM
N 0"" (J)OCDai-.ill'iailti<'J COl.l)C\1 0 ...... ..... v en,...gC'i
,., ~ e e o '-'
I~
I~ Ii
~I§
I~ Ig
g o 15 en "
Ii '"o
Iq
~ "' <Do.. '" cO ;::0> ~ I; '"..
'"cOgl~ o. '" ;::
I~ OO<D C"S.,...: '" g
~'" Ii'" '"o '0
I~
Ii "'<D«itO ~O
'" Ii <D :0 15 <D .~
(ij (;...
~ Ul
Ul
" o .~
>
<DOO'"MN"";
'" ..'" I~ ~I~
00'"t\i.,...: .... 0..
I~
I~
I~ :;;
I~
~I~
00 M '" reM ....
cO '"
57

Teble 7.-Koreen fishery imports from the United Stetes, by species end velue, 1980·88. Source: U.S. Depertment of Commerce, Bureeu of the Census.
Imports (US$l,ooO)
Species 1980 1981 1982 1983 1984 1985 1986 1987 1988
Edible Crabs Salmon' Herring' Pollock' Cod Eels Halibut Squid Lobsters Shrimp Scallops Abalone Sablefish Sardines Mackerel Other fish Other shellfish Other edible'
1.0 1,668.7
4.8
25,311.3 187.6
2.8
218.5 9,618.7
12,727.3
10.2
104.1 3,290.7
99.5 14.9
57.6 4,035.0
11,015.9
38.0
51.6 5,965.4
95.7 3.2
1,095.5 4,364.9 9,794.9
29.3
7.3
5,324.0 1,360.3
3.6
1,351.7 1,900.1 6,169.3
138.4
1,851.7 533.0
2,723.2 1,ln.9
10,623.5
39.8
28.4 10.0
10,463.6 27.3
9.437.8 7.707.7
12,908.6 19.9
506.2
115.8
70.7 10.4 31.2
117.8 585.2
343.9 101.3
15,037.7 6,084.8
15,411.6 369.8 463.7
621.3 11.4
135.8 17.0 16.5 468.
179.5
2,170.0 458.9
11,608.7 9,539.9 8,181.8 2,166.0 1,826.9
662.2 198.1 131.5 80.7 62.3 41.1
9,106.9 176.0
Total edible 27,176.3 26,084.0 21,262.3 21,979.7 11,944.2 25,113.6 31,956.4 41,446.1 43,782.2
Inedible Meal/scrap Oil Other'
72.8 401.3
52.0 706.1
30.4 343.7
9.8 518.4
8.7 319.9 66.6
23.6 2.8
431.6
92.9 1.7
1,009.2
157.2 190.3
1,667.1
Total inedible 474.1 758.1 374.1 528.2 328.6 66.6 458.0 1,103.7 2,014.6
Inedible partial fishery products 28.5 11.1 2.5 21.4 15.6 133.5 313.8 182.3 101.1
Grand total' 27,678.9 26,853.2 21,638.9 22,529.3 12,288.4 25,313.8 32,728.2 42,732.1 45,898.0
'Including roe. 'Includes fish sticks, pastes, balls, etc., of various species. 'Marine shells and other industrial products. 'Columns may not sum to total because of rounding.
Tariffs ings of 15,000 t and 3,800 t, respectively. "Tariff quotas" were trade concesKorean tariffs for U.S. fishery prodsions set up in response to outsideucts are 20 percent ad valorem on the pressure for the liberalization of fisheryc.i.f. (cost, insurance, and freight) price imports. The Korean government noat the time of import declaration. Fishlonger imposes "tariff quotas." ery tariff rates are expected to fall to 15
percent in 1989, the first phase of a Marketingplanned reduction to 8 percent by 1992.
Korean marketing channels for fish and fishery products (both imported and
Import Quotas domestic) can be quite complicated. Until recently, the ROK imposed im Coastal landings are usually sold to local
port quotas (quantitative restrictions) in wholesalers, shippers, or processors by combination with tariffs (called "tariff dealers who handle the fish on a conquotas") on certain categories of im signment basis at the local wholesale ported fishery products, in addition to market. The fish are then transported to the import licensing requirement. The inland wholesale markets where they purpose of these "tariff quotas" was to are again sold to wholesalers through allow specific quantities of fishery im dealers. The ROK has 12 inland fish ports for domestic consumption into the wholesale markets and 10 public fish country at reduced tariff rates. For ex markets operated by fishery cooperaample, frozen fish and cuttlefish were tives. The wholesalers supply the fish subject to a 10 percent tariff rate (con to retailers who then sell them to the siderably lower than the "normal" rate consumers. In all, the fish may change of 20 percent) with import quota ceil- hands six or seven times before ending
Teble 8.-Koreen cetches end joint venture purcheses of Aleske groundflsh in the U.S. EEZ, by quentlty end velue, 1983·1988'.
Joint·venture purchases Directed
Year catch (I) Quantity (t) Value ($10')
1983 279,000 57,000 6.5 1984 276,000 98,000 11.4 1985 225,000 In,ooo 21.5 1986 97,000 378,000 44.8 1987 3,000 452,000 63.0 1988 389,000 55.0
'Source: Office of Trade and Industry Services, Na· tional Marine Fisheries Service, 1989.
up on the family table, substantially escalating retail prices.
The Korean government has been trying to expand market channels by increasing the number of local fish markets, as well as bypassing the coastal middlemen. Fishery products are shipped directly from the landing port to inland wholesale marketing centers. The inland markets then supply the fish to direct retail outlets or supermarkets on a consignment basis. As a result, the number of direct retail outlets for fishery products has reportedly increased in recent years.
Fishery Commodities
The ROK imported a record 16,300 t of fishery products, valued at nearly $46 million, from the United States in 1988 (Tables 4, 5). This was a 3 percent increase in quantity and a 7 percent in value over 1987 imports. As in the past, U.S. shipments consisted primarily of frozen whole fish and fish fillets, fish roes, and frozen shellfish (Fig. 5). Together these commodities accounted for 69 percent of the total quantity and 79 percent of the total value of the 1988 imports from the United States.
Frozen Finfish
The largest and most valuable U.S. export commodity is frozen whole fish and fish fillets. The United States shipped a record 11,500 t to the ROK in 1987, valued at over $23 million. Although frozen whole fish and fillets still held the number one spot in 1988, the quantity exported was only about two thirds of the 1987 level and value was
Marine Fisheries Review 58

Table 9.-Korean fishery exporta to the United States, by commodity and quantity, 1980-88. Source: U.S. Department of Commerce, Bureau of the Cenaus.
Exports (t)
Commodity 1980 1981 1982 1983 1984 1985 1986 1987 1988
Edible Fish
Fresh/frozen Whole Fillets Blocks Loins/discs
11,000.4 1.087.0
19,205.0 559.1
14,321.8 1,361.8
18,568.7 964.7
5.944.8 12,510.3 6,679.1 1,678.3 3,195.6 1,173.9 2.377.9 4,489.0 6,753.6 11,030.0
18,681.9 25,913.2 23,094.4 22,420.3 23,022.0 870.7 273.7
1,722.2 1,375.5 16,956.8 10,300.5 33,846.7 23,497.9
Subtotal 31,851.5 35,217.0 26,671.3 41,075.1 34,262.5 30,852.2 37,247.6 52,525.7 35,173.9
Canned In Oil Not in Oil
213.3 152.5
351.7 198.4
146.5 231.0 224.3 151.3 228.3 172.3 317.1 964.0 1,991.7 3,238.1
259.9 307.3 4,552.1 3,638.4
Subtotal 365.8 550.1 318.8 548.1 1,188.3 2,143.2 3,466.4 4,812.0 3,945.7
Cured Roe Surimi, analogs Other
124.9 15.5
253.2
218.9 19.9
38.4
240.5 242.7 332.3 631.6 650.5 47.6 74.5 76.3 129.6 151.0
1,141.8 207.4 294.6 340.3 621.1 699.4
724.5 913.9 149.5 142.8
3,245.7 4,728.2 920.0 1,085.8
Shellfish Fresh/frozen Canned Other
1,716.8 3,784.7
1,733.8 5,120.2
2,498.9 2,812.7 2,831.8 3,651.3 5,841.5 7,469.6 6,796.3 5,744.9 6,643.9 8,414.9
12.4 12.4 62.3
7,591.2 6,360.4 9,447.9 7,237.5
149.6 106.0
Subtotal 5,501.5 6,854.0 9,968.5 9,609.0 8,589.1 10,307.6 14,318.7 17,188.7 13,703.9
Total edible 38,112.4 43,096.4 37,454.1 51,844.0 44,788.7 44,685.3 57,675.4 79,566.1 59,694.2
Inedible Meal/scrap Oil Canned pet food Other industrial 49.7 123.7
240.4 75.3 Negl.'
13.3 12.2 78.4 151.6 108.3 82.7 83.9
361.1 708.5 0.1 9.9
74.2 67.4 134.5
Total inedible 49.7 123.7 78.4 165.1 108.3 335.3 159.3 428.5 927.1
Inedible partial fishery products N/A' N/A N/A N/A N/A N/A N/A N/A N/A
Grand total 3 38,162.2 43,220.1 37,532.5 52,009.1 44,897.0 45.020.6 57,834.7 79,994.6 60,621.3
'Negl. = Negligible. 'N/A = Not available. 3Columns may not sum to total because of rounding.
down by over 20 percent (Tables 4, 5). 94 percent of this was frozen tanner Sales of U.S. frozen fish (and a number crab. The record-high year for frozen of other fishery commodities, such as shellfish exports was 1987, when nearsalmon, crabs, and lobster) to the ROK ly $16 million worth were shipped to are largely dependent on Japanese mar South Korea. As was the case for frozen ket conditions. With the increased ap fish, Japanese markets competed strongpreciation of the yen and high prices ly for U.S. crab exports in 1987 and 1988 offered by the Japanese in 1988, U.S. and are largely responsible for the drop fishermen were able to boost sales of in exports to South Korea. frozen fish to Japan by over 50 percent,
Fish Roe hence the decrease in frozen fishery exports to the ROK. Japan was the Fish roes were the third most valuable preferred export mmarket for these U.S. fishery commodity export to the commodities. ROK in 1988, valued at almost $6 mil
lion. Roe exports increased from only Frozen Shellfish 424 t in 1987 to 2,300 t in 1988 and
Frozen shellfish was the second most tripled in value. According to U.S. Cusvaluable U.S. fishery commodity ex toms, herring roe comprised over 70 ported to the ROK in 1988, accounting percent of the total value. These statisfor over $12 million (Table 5). Almost tics may be misleading, however, as U.S.
51(3), 1989
Frozen fish 40%
Frozen shellfish
Other 17%
Fish 26%
roe 13%
Total = $45.9 million Figure 5.-Major fishery commodities imported by Korea from the United States by value, 1988 (percent of total). Frozen fish is whole and fillets. Source: U.S. Bureau of the Census.
fishery officials suspect that Customs agents may have mistakenly recorded roe herring (herring from which the South Koreans later remove the eggs) as herring roe. The remainder of U.S. roe exports was reportedly pollock roe. The United States exported a record $20 million worth of fish roes to the Koreans in 1979 and 1980.
Species
The most important species exported by the United States to the ROK in 1988 were, by value, crab, salmon, herring, and walleye pollock (Fig. 6, Table 7).
Crab
The United States exported 1,800 t of frozen crab, valued at almost $12 million in 1988. Alaska tanner or snow crab accounted for nearly 95 percent of the quantity (1,600 t) and value ($11 million) of this total. King crab exports to the ROK in 1988 were small-only 19 t of frozen and 40 tons of canned (valued at $Z75,OOO). Overall, 1988 U.S. crab exports decreased in both quantity and value from 1987 exports (see Frozen Shellfish section).
Salmon
U.S. 1988 frozen salmon exports to the ROK amounted to 2,600 t and had a value of $9.5 million. The quantity exported increased only 1 percent, but the
59

-- -- -- -- --- --- --- --- ---
-- -- -- -- --- --- --- --- ---
-- -- -- -- --- --- --- --- ---
-- -- -- -- --- --- --- --- ---
Table 10.-Korean fishery exports to the United States, by commodity and value, 1980-88. Source: U.S. DepsrtAlaska ment of Commerce, Bureau of the Cansus.Pollock
5% Exports (US$l,Ooo)
Commodity 1980 1981 1982 1983 1984 1985 1986 1987 1988
Other 27% Salmon
21%
Crabs 25%
Total =45.9 million Figure 6.-Major fish species imported by Korea from the United States by value, 1988 (percent of total). Salmon, herring, and pollock data includes roe. Source: U.S. Bureau of the Census, Total = $45.9 million.
value increased by 57 percent over that of 1987. World salmon prices were forced sharply upward in 1988 because of high Japanese demand. Japan's overall salmon catch was down in 1988 (with the exception of the fall chum salmon run in Hokkaido) and Japanese buyers offered top dollar for U.S. salmon. As a result, Korean prices were pushed up, netting the large increase in value of U.S. salmon exports, despite the small quantity increase. Frozen pink salmon ws the major species exported, accounting for 65 percent of the quantity and 55 percent of the value of the total (1,670 t, valued at $5.2 million). Chum salmon was the next most important species ($2.6 million), followed by sockeye ($0.8 million), silver ($0.5 million), and chinook salmon ($0.2 million).
Herring
The United States exported 3,600 t of herring and herring roe, valued at over $8 million, to the ROK in 1988. This was about half of the quantity and value of the U.S. herring exported to Korea in 1987. The Japanese market for herring products was favorable in 1988 and was most likely responsible for diverting more U.S. herring to Japan. Herring roe accounted for nearly 50 percent of the quantity and 53 percent of the value of total 1988 U.S. herring exports to the
Edible Fish
Fresh/frozen Whole 13,636,0 19,198,2 7,786,2 12,581,3 7,082.4 2,746,0 3.836,5 3,974,3 4.159,9 Fillels 2,214,1 2,930,3 2,478,1 6,276,8 13,511.0 18,106,0 32,754,9 58,059,5 37,559,4 Blocks 26,627,2 30,817,3 28,011.5 35,585,6 33,136,0 30,566,0 38,100,6 79,209,5 45,596,1 Loins/discs 2,152,9 4,718,6 4,119.4 790,2
Subtotal 44,630,2 57,664,6 42,395,4 55,233,9 53,729,4 51,421.0 74,692,0 141,243,3 87,355.4
Canned In Oil 435,2 897,5 327,4 491,2 521.2 299,5 460,1 627,8 805.0 Not in Oil 360,5 446,7 468.4 844,6 2,014,6 3,911,9 7,426,0 10,714,2 8,998,7
Subtotal 795,7 1,344,2 795,8 1,335,6 2,535,8 4,211.4 7,886,1 11,342.0 9,803,7
Cured 444,6 832,2 866,0 960.7 1,216.2 2,407,3 2,396.7 3,001,3 4,613.6 Roe 91.8 111.8 331.3 510.5 360.5 760,7 990.3 1,088.9 1,185.9 Surimi, analogs 3,476.8 9,692,6 14,750.4 Olher 649.7 890,8 699.6 811.9 1,242,4 1,609,5 2,360.8 3,268.1 5,405.9
Shellfish Fresh/frozen 4,558,2 4,716,3 11,148,2 12,095.5 11,540,7 13,646,6 27,739.8 46,316.9 43,178.0 Canned 12,628.7 16,809.4 22,907,6 20,587.7 19,133.6 21,301.0 25,268.7 31,521.4 33,974.5 Other 26.2 27.0 125,8 247,6 233,8
Subtotal 17,186.9 21,525.7 34,055,6 32,663.2 30,700.5 34,975,0 53,134.3 76,065.9 77,386,3
Total edible 63,999,0 62,369.2 79,143,9 91,535.9 89,784.8 95,385,0 144,957.0 247,722.2 200,500.9
Inedible Meal/scrap 88.4 25,5 89,6 247,2 Oil 0.7 1.6 3,9 350.1 Canned pet food 10.3 9,2 58.1 Other industrial 576,3 866.4 621.0 786.5 894,7 550,7 815.1 660.4 460.5
Total inedible 576.3 866.4 621.0 797,5 894,7 648,3 842.2 754.1 1,115.9
Inedible partial fishery products 5,217.4 8,423,3 9,453.4 7,556.9 10,771.8 13,846.1 19,396.3 34,033.9 41,529,7
Grand lolal' 69,792,7 91,658,9 89,218.3 99,890,2 101,451.2 109,879,9 165,195.6 282,510.2 243,146.4
'Columns may not sum to total because of rounding.
ROK (see Fish Roe section). South Korean imports of U.S. herring have fluctuated historically, but increased by about $3 million per year from 1984 through 1987.
Pollock
U.S. walleye or Alaska pollock exports to South Korea have increased yearly from only 36 t, valued at $20,000 in 1986, to over 1,000 t, valued at $2.2 million, in 1988. U.S. Customs listed the majority of this total as pollock roe (530 t, valued at $1.6 million). South Koreans have traditionally consumed walleye pollock, which is also harvested off their own coast, but fishermen are now having difficulty supplying it as the United States, the Soviet Union, and North Korea are tightening regulations on foreign fishing in their waters. Con
sequently, pollock imports are expected to increase rapidly in the near future.
Fishery Exports to the United States
Overview
The value of ROK exports of fishery products to all countries increased by nearly 50 percent from 1985 to 1986 (from $0.9 billion to $1.3 billion-Table 2). Fishery exports in 1986 accounted for about 4 percent of all Korean exports, up from 3.5 percent in 1985. (More recent figures were not available.) The increase in fishery exports was caused by an increased demand for fishery products in Japan and the United States, increasing world export prices, favorable exporting conditions caused by the appreciation of the Japanese yen,
Marine Fisheries Review 60
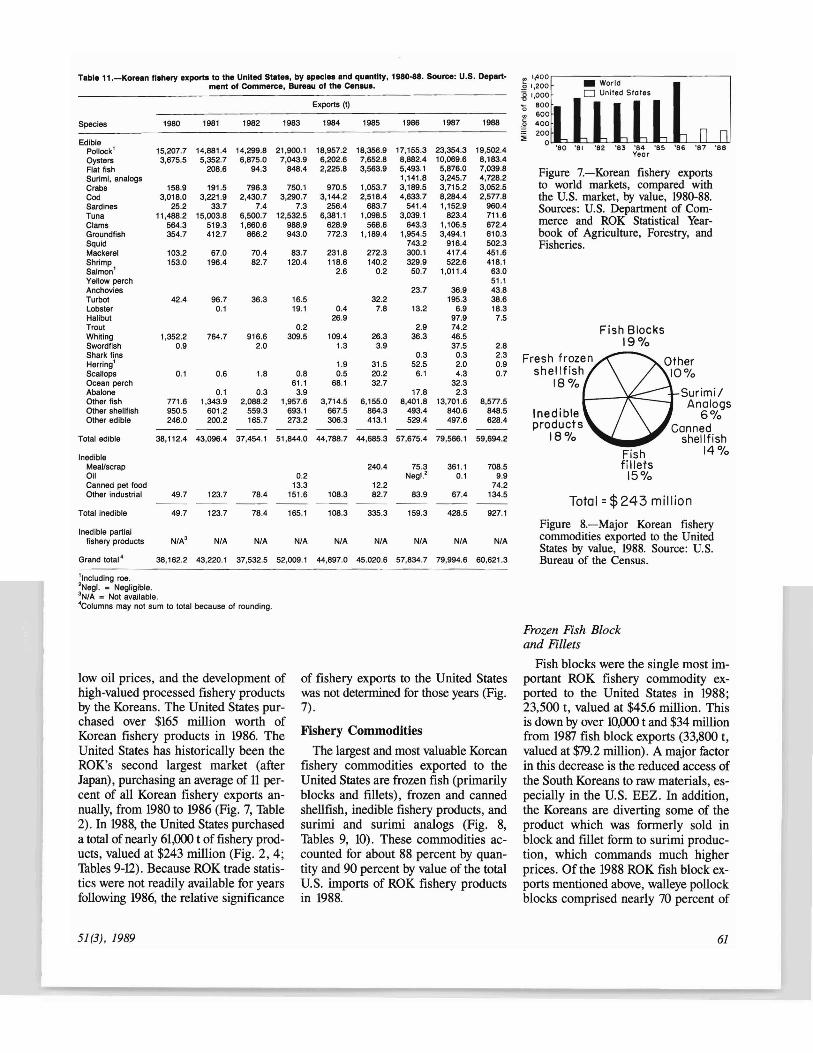
Table 11.-Korean fishery exports to the United States, by species and quantity, 1980-88. Source: U.S. Depart· 1,<OOr--------------,
ment of Commarce, Bureau of the Census. ',200 • World 1,000 0 Uniled Slol.s
Exports (t) BOO 600
Species 1980 1981 1982 1983 1984 1985 1986 1987 1988 <00 200
Edible oL8'~BO:L.I'BIII:,:L.II'BIII:2:L.11'B~3~••~<~'B~5~'B~6:'----:'B!-:1~'B~8 Pollock' 15.207.7 14.881.4 14.299.8 21,900.1 18,957.2 18,356.9 17,155.3 23,354.3 19,502.4 Year Oysters 3,675.5 5,352.7 6,875.0 7.043.9 6,202.6 7,652.8 8,882.4 10,069.6 8,183.4 Flat fish 208.6 94.3 848.4 2,225.8 3,583.9 5,493.1 5,876.0 7,039.8 Figure 7.-Korean fishery exportsSurimi, analogs 1,141.8 3,245.7 4,728.2 Crabs 158.9 191.5 796.3 750.1 970.5 1,053.7 3,189.5 3,715.2 3,052.5 to world markets, compared with Cod 3,018.0 3.221.9 2.430.7 3,290.7 3,144.2 2,518.4 4,833.7 8,284.4 2,577.8 the U.S. market, by value, 1980-88. Sardines 25.2 33.7 7.4 7.3 258.4 683.7 541.4 1,152.9 960.4 Sources: U.S. Department of ComTuna 11,488.2 15.003.8 6.500.7 12,532.5 6,381.1 1,098.5 3,039.1 823.4 711.6 merce and ROK Statistical YearClams 564.3 519.3 1,660.6 988.9 628.9 568.6 643.3 1,106.5 672.4 Groundfish 354.7 412.7 866.2 943.0 772.3 1,189.4 1,954.5 3,494.1 610.3 book of Agriculture, Forestry, and Squid 743.2 916.4 502.3 Fisheries. Mackerel 103.2 67.0 70.4 83.7 231.8 272.3 300.1 417.4 451.6 Shrimp 153.0 196.4 82.7 120.4 118.6 140.2 329.9 522.6 418.1 Salmon' 2.6 0.2 50.7 1,011.4 63.0 Yellow perch 51.1 Anchovies 23.7 36.9 43.8 Turbot 42.4 96.7 36.3 16.5 32.2 195.3 38.6 Lobster 0.1 19.1 0.4 7.8 13.2 6.9 18.3 Halibut 26.9 97.9 7.5 Trout 0.2 2.9 74.2 Fish BlocksWhiting 1,352.2 764.7 916.6 309.5 109.4 26.3 36.3 46.5 Swordfish 0.9 2.0 1.3 3.9 37.5 2.8 19% Shark fins 0.3 0.3 2.3 Herring' 1.9 31.5 52.5 2.0 0.9 Scallops 0.1 0.6 1.8 0.8 0.5 20.2 6.1 4.3 0.7 Ocean perch 61.1 68.1 32.7 32.3 Abalone 0.1 0.3 3.9 17.8 2.3 Other fish 771.6 1,343.9 2,088.2 1,957.6 3,714.5 6,155.0 8,401.8 13.701.6 8,577.5 Other shellfish 950.5 601.2 559.3 693.1 667.5 864.3 493.4 840.6 848.5 Other edible 246.0 200.2 165.7 273.2 306.3 413.1 529.4 497.6 628.4
Total edible 38,112.4 43,096.4 37,454.1 51,844.0 44,788.7 44,885.3 57,675.4 79,566.1 59,694.2
Inedible Meal/scrap 240.4 75.3 361.1 708.5 fillets Oil 0.2 Negl.' 0.1 9.9 15% Canned pet food 13.3 12.2 74.2 Other industrial 49.7 123.7 78.4 151.6 108.3 82.7 83.9 67.4 134.5
Total =$243 million Total inedible 49.7 123.7 78.4 165.1 108.3 335.3 159.3 428.5 927.1
Figure 8.-Major Korean fisheryInedible partial commodities exported to the United fishery products N/A' N/A N/A N/A N/A N/A N/A N/A N/A
States by value, 1988. Source: U.S. Grand total' 38,162.2 43,220.1 37,532.5 52,009.1 44,897.0 45.020.6 57,834.7 79,994.6 60,621.3 Bureau of the Census.
Surimil Analogs
6% Conned
shellfish 14%Fish
Inedible products
18%
'Including roe. 'Negl. = Negligible. 'N/A = Not available. 'Columns may not sum to total because of rounding.
low oil prices, and the development of high-valued processed fishery products by the Koreans. The United States purchased over $165 million worth of Korean fishery products in 1986. The United States has historically been the ROK's second largest market (after Japan), purchasing an average of 11 percent of all Korean fishery exports annually, from 1980 to 1986 (Fig. 7, Table 2). In 1988, the United States purchased a total of nearly 61,000 t of fishery products, valued at $243 million (Fig. 2, 4; Tables 9-12). Because ROK trade statistics were not readily available for years following 1986, the relative significance
51(3), 1989
of fishery exports to the United States was not determined for those years (Fig. 7).
Fishery Commodities
The largest and most valuable Korean fishery commodities exported to the United States are frozen fish (primarily blocks and fillets), frozen and canned shellfish, inedible fishery products, and surimi and surimi analogs (Fig. 8, Tables 9, 10). These commodities accounted for about 88 percent by quantity and 90 percent by value of the total U.S. imports of ROK fishery products in 1988.
Frozen Fish Block and Fillets
Fish blocks were the single most important ROK fishery commodity exported to the United States in 1988; 23,500 t, valued at $45.6 million. This is down by over 10,000 t and $34 million from 1987 fish block exports (33,800 t, valued at $79.2 million). A major factor in this decrease is the reduced access of the South Koreans to raw materials, especially in the U.S. EEZ. In addition, the Koreans are diverting some of the product which was formerly sold in block and fillet form to surimi production, which commands much higher prices. Of the 1988 ROK fish block exports mentioned above, walleye pollock blocks comprised nearly 70 percent of
61

Table 12.-Korean fishery exports to the United States, by species and value, 1980-88. Source: U.S. Department of Commerce, Bureau of the Census.
Exports (US$1,OOO)
Species 1980 1981 1982 1983 1984 1985 1986 1987 1988
Edible Oysters 11,773.1 16,794.2 21,619.2 21,243.2 20,162.5 23,731.5 26,451.4 33,618.2 35,734.4 Pollock' 20,184.7 23,520.0 20,403.7 27,379.6 24,516.6 22,436.7 25,346.9 47,634.0 33,753.0 Crabs 623.5 674.3 6,139.3 5,641.7 5,566.8 5,077.3 20,415.0 32,225.8 28,116.1 Flatfish 490.7 251.3 2,801.8 6,350.7 9,334.6 16,019.7 20,486.7 26,874.9 Surimi, analogs 3,476.8 9,692.6 14,750.4 Cod 5,009.2 6,851.7 4,871.1 6,948.8 6,693,6 5,306.0 11,261.1 29.960.2 8,434.1 Clams 2,231.1 2,027.2 4,678.3 3,068.4 2,320.7 2,146.6 2,023.4 3,614.0 3,651.6 Squid 1,565.8 2,980.0 2,978.7 Tuna 15,900.8 23,337.0 11,095.0 12,737.5 6,174.1 1,083.4 3,316.7 1,198.3 1,832.1 Shrimp 369.4 501.7 203.6 276.7 363.4 331.4 814.3 1,568.2 1,732.8
Oysters 15%
Crabs 12%
Flounders 11%
Cod Groundfish 583.1 796.4 1,553.9 1,715.9 1,387.6 1,892.5 3,455.1 8,812.2 1,595.12% Sardines 32.0 48.4 12.0 23.4 292.7 730.4 608.3 1,318.2 1,246.6
Mackerel 165.6 140.4 136.5 138.9 360.3 400.1 463.9 736.0 1,043.1 Total =$243 million Salmon' 1.6 3.2 207.2 2,934.3 242.5
Lobster 2.3 209.8 0.8 21.6 20.5 96.1 195.1 Anchovies 45.9 86.3 169.9Figure 9.-Major fish species exTurbot 86.7 189.7 94.8 43.9 110.6 957.1 138.4
ported by Korea to the United States Yellow perch 136.5 by value, 1988. Pollock data includes Halibut 161.0 827.0 68.7
roe. Source: U.S. Bureau of the Shark fins 26.5 28.8 51.6 Swordfish 2.8 1.1 2.6 26.1 233.9 19.2Census. Scallops 0.7 14.4 8.6 12.9 11.1 160.1 15.2 58.3 13.6 Herring' 1.5 9.3 49.2 130.9 6.7 5.7 Ocean perch 186.4 216.7 117.3 185.3 Trout 3.2 8.8 151.5 Whiting 2,380.8 1,414.4 1,718.5 520.1 199.5 41.2 85.4 102.5 Abalone 0.9 3.1 12.6 11.4 2.5 43.1 25.9
the total value-$31.5 million. Cod Other fish 1,854.6 3,239.7 4,401.9 5,784.8 11,630.8 17,920.9 25,572.7 42,378.2 29,020.8 Other shellfish 2,190.9 1524.3 1,406.7 2,243.6 2,272.7 3,506.6 1,781.6 3,892.2 4,925.0blocks were second in importance (1,800 Other edible 608.9 799.4 535.8 742.3 1,087.1 956.2 1,800.8 1,913.7 3,770.9
t, valued at $5.6 million), followed by Total edible 63,999.0 82,369.2 79,143.9 91,535.9 89,784.6 95,385.6 144,957.0 247,722.2 200,500.8
flounder blocks (1,600 t, valued at $5.2 Inediblemillion). In the frozen fillet category,
Meal/scrap 88.4 25.5 89.8 247.2 flounder fJ.llets topped the list (5,400 t, Oil 0.7 1.6 3.9 350.1
Can ned pet food 10.3 9.2 58.1valued at $21.6 million). Unspecified Other industrial 576.3 866.4 621.0 786.5 894.7 550.7 815.1 660.4 460.5 saltwater fish fJ.llets were second (4,700
Total inedible 576.3 866.4 621.0 797.5 894.7 648.3 842.2 754.1 1,115.8t, worth $15 million), followed by hake, haddock, Alaska pollock and cod fillets Inedible partial
fishery products 5,217.4 8,423.3 9,453.4 7,556.9 10,771.8 13,846.1 19,396.3 34,033.9 41,529.7(a combined 2,500 t, valued at $6.3
Grand total 2 69,792.7 91,658.9 89,218.3 99,890.2 101,451.2 109,879.9 165,195.6 282,510.2 243,146.4million). 'Includes roe. 2Columns may not sum to total because of rounding.
Fresh/Frozen and Canned Shellfish
The ROK exported over t77 million worth of these two commodities to the
Inedible Fishery Products Surimi and Surimi Analogs United States in 1988. Fresh/frozen shellfish accounted for about 56 percent Although the value of 1988 ROK edi The ROK first exported surimi and of the total ($43.2 million). Fresh/frozen ble fishery exports to the United States surimi analog products to the United crabs and crabmeat were the most was down by almost 20 percent from States in 1986, when it shipped over important commodities; 3,000 t were 1987, inedible fishery commodities (both 1,100 t, valued at $3.5 million. The shipped, valued at nearly $28 million. inedible and partial inedible) were up growth in exports of these commodities Other important commodities were by 22 percent, from $34.8 million to has been phenomenal; 1988 shipments frozen oysters and squid. Of all ROK $42.6 million. The most important in to the United States totaled 4,700 t, canned shellfish commodities shipped edible fishery products in 1988 were valued at $14.8 million. Nearly 100 perto the United States in 1988, canned jewelry ($17.7 million), leather belts cent of these were analog productsoysters were by far the most important, ($9.4 million), and small mirrors ($5.8 raw surimi exports were neglible. comprising over 90 percent of the total. million)4.
SpeciesOver 6,600 t of canned oysters and canned smoked oysters, valued at $31 'There is only a small fishery component to most On a species basis, the ROK's top ten
of the inedible partial fishery products. They are million, were shipped. The ROK also exports to the United States (in order of included in this report so that the data corresponds exported small amounts of canned clams, importance) in 1988 were oysters, wallto that reported in the "Fisheries of the United
shrimp, and mussels. States." eye pollock, crabs, flatfish, cod, clams,
Marine Fisheries Review 62

squid, tuna, shrimp, and various groundfish (Fig. 9, Tables 11, 12). Quantities shipped were down for all of the above, with the exception of flatfish (which increased by nearly 20 percent). Details of the top five exports (by value) follow.
Over 8,000 t of oysters, primarily canned, valued at $35.7 million, were exported to the United States in 1988. The quantity shipped was down 19 percent from 1987, when a record 10,000 t was exported, but the value was up 6 percent.
Walleye pollock was the top species export to the United States by quantity in 1988 (19,500 t), but it took second place by value ($33.8) million). As previously stated, pollock blocks and fillets comprised the bulk of the exports although canned pollock (770 t, valued at $2.3 million) and small amounts of smoked, dried, and salted pollock were also exported (quantity and value not available). U.S. imports of pollock products from the ROK have averaged a little over 18,000 t for the last 9 years. Until 1986, the value of these imports averaged about $23 million. In 1987, the Koreans, exported an all-time record
23,000 t to the United States, worth nearly $48 million.
In 1988, the United States purchased 3,000 t of Korean crabs, valued at $28 million. This was an 18 percent decrease by quantity and a 13 percent decrease by value below record 1987 purchases. U.S. imports of frozen crab and crabmeat have exceeded 3,000 t annually since 1986 (Table 11).
South Korean exports of flatfish (flounders) to the United States have enjoyed steady growth since 1983, when 848 t, valued at $2.6 million, were shipped. By 1988, a much larger amount (7,000 t) of flatfish, worth $26.8 million, was exported-ten times the 1983 exports by quantity and value. The most important commodity forms are frozen fillets, followed by frozen flatfish blocks.
Total 1988 ROK cod exports to the United States were 2,500 t, valued at nearly $8.5 million. Of this total, the most important commodity was frozen cod blocks (totaling 1,800 t, valued at $5.6 million). Cod fillets were next in importance (700 t, valued at $2.4 million) followed by small quantities of frozen whole cod and salted cod. The
1988 ROK cod exports to the United States were down approximately 70 percent by quantity and value over 1987 cod exports (8,200 t, valued at $30 million). This decrease is most likely due to increased sales of cod to the Japanese.
Conclusion
There is little doubt, given South Korea's phenomenal growth rate and increasing affluence, that U.S.-ROK fisheries trade will continue to grow. The rate of growth, however, will continue to be dependent upon the relaxation of import restrictions (import licenses and tariffs) by the Korean Govenment. An additional factor, the influence of the Japanese market on U.S. fishery exports to South Korea, adds a further element of unpredictability. However, as fishery raw materials become more difficult for the Koreans to obtain because of increased control of coastal countries over their own EEZ's, the prospects will continue to improve for U.S. exporters. (Source: IFR-89/52. Prepared by Paul E. Niemeier of the NMFS Foreign Fisheries Analysis Branch, Silver Spring, MD 20910.
The Sea Urchin Market in Japan
The Japanese market for live sea urchin and sea urchin roe from the United States is growing rapidly, but it has not yet been fully developed. Although imported sea urchin has penetrated the Japanese market (U.S. sea urchin exports to Japan have increased from 540 metric tons (t) in 1984 to 1,740 t in 1988: Figure 1), foreign-processed roe remains unpopular, largely because of inconsistencies in quality and supply. The strict quality requirements of the Japanese market will necessitate higher standards on the part of U.S. sea urchin roe processors to guarantee export success.
51(3), 1989
Consumption
Roe
Sea urchin roe is considered a delicacy in Japan, where it is primarily served raw in sushi. The Japanese name for sea urchin roe is "uni." Most sea urchin roe buyers at Tokyo's Tsukiji Central Wholesale Market purchase for expensive traditional Japanese-style restaurants which demand extremely high quality in both appearance and taste.
Although some imported sea urchin roe is currently shipped to Hokkaido
!=
<Il 2,000,----0=""'10;-.'1,.,-------,60 ~ r
E1'550 I Y n ....- 40 ~° D~~?U~nf lPOO ~ (l) 0 0 20 ~
::. 0 ~4 '85 '86 '87 '88 ° ~. Year ~
Figure I.-Japanese sea urchin imports from the United States by quantity and value, 1984-88. Source: Fisheries Agency of Japan.
and northern Honshu for processing, inferior quality has prevented an increased market share for imported roe. The demand for sea urchin roe is seasonal, with the largest amount being consumed in December. Sea urchin roe is marketed in different product forms: Fresh (nama uni), frozen (reito uni), baked and frozen (yaki uni), steamed (mushi
63

USA 1,564 Other 74
dhiliPPines 65 ....Chile 122
__-4~:'--f Mexico 125 Canada 190 China 194
ROK 1,110
1987 total: 3,696tons Figure 2.-Japanese sea urchin imports by country of origin and quantity (metric tons), 1987. Source: Fisheries Agency of Japan.
(Millions of dollars)
ROK $45.3
/Other$3 _China $2
l----~::===I-Mexico$ 2.3 'DPRK $2.4 """'Canada $4.2
USA $40.2
1987 total: $99,284,215
Figure 3.-Japanese sea urchin imports by country of origin and value (millions of dollars), 1987. Source: Fisheries Agency of Japan.
uni), and salted (shio uni). Salting is used primarily for lower-grade roe. 1\\'0 fermented urchin roe products are also popular in Japan: Neri uni (a blended urchin paste) and tsubi uni (a lumpy paste).
Live Urchin
Virtually no live imported sea urchin is sold at the Tsukiji Market. Buyers of live sea urchin usually prefer the domestic Japanese sea urchin which is limited in supply. Because of the difficulties in shipping and handling live, whole sea urchins, Japanese importers generally prefer to have the roe processed at the place of origin.
Imports
Japan imported 3,700 t of sea urchin
in 1987, valued at about $100 million (Fig.'2, 3). Nearly half of the value was supplied by the Republic of Korea (1,110 t valued at $45.3 million), followed by the United States (1,560 t valued at $40.2 million), Canada (190 t valued at $4.2 million), and North Korea (250 t valued at $2.4 million). In 1988, imports from the United States amounted to 1,740 t, with a value of $54 million, becoming the fourth largest U.S. fishery export to Japan by value. Values were not available for 1988 Japanese urchin imports from other countries.
Price
The highest priced sea urching products imported from the United States are the red sea urchin, Strongylocentrotus jranciscanus, shipped from Los Angeles and from San Francisco. Processed roe from the New England green sea urchin, S. droedachiensis, ranks third in price on the Japanese market, and green sea urchin roe harvested in British Columbia, Canada, and Puget Sound, Washington, ranks fourth. Prices of Los Angeles-origin sea urchin roe as of March 1989 were $8.20-$40.98 per trayl while British Columbia-origin roe brought only $4.92-$16.39 per tray. The wide price spread reflects the uneven quality of imported sea urchin roe.
The average wholesale price of live sea urchins from the U.S. west coast is around $10.00 per kg from October through April, but falls to around $6.00 per kg during the summer months when fear of food poisoning depresses consumer demand.
Quality Standards
Japanese consumers prefer pale yellow or orange roe over roe with mottled or dark brownish or redish color. Roe color is largely dependent on the diet, sex, and harvest time of the individual sea urchin. In the Sanriku area of Japan, sea urchin roe is steamed and therefore color is not as significant in determining quality and price. Roe from British Columbia is considered to be of inferior quality because the individual roe sacs, which are over 2 inches long,
'At an exchange rate of $1 = ¥ U2. One tray contains 260 g of roe.
are too large for use in sushi. Japanese processors 'look for a roe
recovery rate of about 10 percent and require a minimum of 3 metric tons of live sea urchin per day to run their plants efficiently. Inconsistent roe color and recovery percentages and unreliable supply are Japanese processors' chief complaints against U.S.-produced sea urchin products. Because roe recovery percentage and color vary with fishing season and region, U.S. suppliers must pay careful attention to harvest techniques and be willing to adapt them to Japanese taste.
Handling
Tsukiji Market auction house experts advise that improvement in the quality of U.S.-processed sea urchin roe would enhance sales. Because the roe deteriorates quickly during shipment, they make the following recommendations:
1) Use only the best fresh roe. Deteriorated roe melts around the edges during the brining process and has a poor appearance.
2) Keep the temperatures of the processing room and the brine water low.
3) Drain the brine water well off the roe before putting it on the trays. Keep the roe color uniform in trays.
4) Avoid freezing at any point during shipment. Repeated freezing and thawing causes loss of firmness and poor appearance. (Source: IFR-89/36. Prepared by Karen Kelsky and Paul Niemeier of the NMFS Foreign Fisheries Analysis Branch, Silver Springs, MD 20910.)
THE JAPANESE ABALONE MARKET
Although abalone is expensive in Japan, it is popular among Japanese consumers, who eat it in sashimi, Chinese food, and holiday gift preparations. There are five major abalone species consumed in Japan. The United States was the fourth-largest exporter of abalone to Japan in 1988.
Species
Japan's major abalone species are the Japanese abalone or "kuro awabi," Nor-
Marine Fisheries Review 64

dotis discus; the giant abalone or "madaka awabi:' N. gigantea; Siebold's abalone or "mekai awabi:' N. gigantea seiboldii; the northern abalone or "ez~
awabi" N. discus hannai; the tokobushi abalo~e or "tokobushi:' Sulculus diversicolor and a subspecies of the tokobushi abalo~e known as the "fuku tokobushi," S. diversicolor aquatiUs. Although the northern abalone is found in shallow coastal waters off northern Honshu and Hokkaido (at depths ofless than 15 m), the other species are found in warmer waters at depths ranging from 10 to 50 m.
Japanese abalone is thick-shelled, has dark colored meat, and grows to approximately 20 cm in length. Although it is good to eat fresh or steame~ whole, the meat is considered tough. Giant abalone also reach lengths of 20 cm, but the meat shrinks slightly when steamed. Siebold's abalone, which grows to 25 cm, is flatter than the other species and is consumed raw. Northern abalone has a relatively thin shell and is suitable for any type of preparation. Tokobushi ~balone is smaller than the other speCies, growing to lengths of only 7 cm. Tokobushi is characterized by 7-8 open holes on the shell, whereas other species of abalone have only 3-4 holes.
Consumption
Abalone is extremely expensive in Japan, and is generally bought by restaurants for preparation as sashirni. Almost all species are considered suitable for sashimi, although Japanese consumers prefer abalone with tan-colored meat. Giant and tokobushi abalone are also used in preparations known as "nigai" or "ni-awabi", whole abal~n~s
cooked with fish broth and soy. Nlawabi" packed in plastic bags or cans is a popular choice for the winter gift season. A leading Japanese manufacturer produces over 500 metric tons (t) of various kinds of ni-gai annually for the Japanese gift market. Other popular preparations are abalone steaks sauteed in butter and abalone marinated in vinegar. Dried abalone is used for Chinese cooking. The Japanese demand for fresh abalone increases in the summer because the Japanese believe that the quality improves as the season progresses.
51(3), 1989
Marketing
Live abalone is sold at auctions in Japan, generally in sizes ranging .fro~
150 to 500 g. The most popular SiZe is 200-300 g. Live Japanese abalone commands the best prices-$22.90-$53.00 per kg (D.S.$1 = ¥ l31)-and is normally sold to luxury Japane~e restaura?ts for sashirni. Japanese shippers of hve abalone keep the abalone in tanks at water temperatures of 15-18°C with~ut
feeding for about a week before shi~ment. Depriving the abalone of feed is believed to slow down its metabolism, thereby reducing mortality rates during shipping. Another benefit of the premarketing feed cut is to enhance the flavor of the abalone by reducing odor and excessive fat caused by feeds. The precise duration of the feed cut depends on the size of species.
Imports
Japan imported over 56 t (valued at $1.7 million) of abalone in 1988. The leading suppliers were, by quantity, China (25 t), the Republic of Korea (19 t), Australia (9 t), and the United States (4 t) (Fig. 1).1 By value, however, South Korea ($820,000) surpassed China ($690,000) by 17 percent, because of the higher quality of its abalone.
Imported abalone is said to be tougher than Japanese abalone, although live or fresh imports are considered more tender than the frozen product. Imports are generally not used for sashirni, but processed and canned. About 40,000 cartons of canned abalone are distributed in Japan annually2. U.S. abalone is not considered suitable for drying because the flavor is said to be insufficient to produce a quality broth.
Live California black abalone (> 1 kg each) and pink abalone (about 2 kg each) were sold in the Tokyo Central Wholesale Market (TCWM) in September 1988 for about $12.20 per kg, and $17.50-20.60 per kg, respectively. Other U.S. species are unknown in Japan. A specialist at a TCWM auction house advised U.S. exporters that a premarket
'Some of the U.S. imports may be Mexican-o~gin products shipped through Los Angeles, Calif. 2Canned abalone are packed 48 cans per carton, about 200 net per can.
Quantity Chino 24.9
USA 3.7
Australia 8.6
Total: 56.1 metric tons
Value ROK 818.1
Australia 122.7
/----....=:-1 USA 50.7
Chino 686.2
Total: $1.7million
Figure I.-Japanese imports of live, fresh, or chilled abalone, by country of origin, quantity (t) and value (US$I,OOO) , 1988.
ing feed cut of 3-4 days for black abalone and 7 days for pink abalone should help reduce mortality rates. He also suggested sorting both species accor~g ~o
size3. The recommended carton SiZe is 10 kg, although sometimes 12 kg cartons may be packed to compensate for water loss during shipment. Imported abalone often loses about 20 percent of its original weight by the time it is sold at auction. The specialist suggested that U.S. exporters should begin with trial shipments of 100-200 kg, and increase the quantity to 400-500 kg per shipment later. Consistency in shipping quantity
'Abalone sizes are: L (400 g and up) and M (under 400 g) for the black abalone, and L (1 kg and up) and M (under 1 kg) for the pink abalone, unless U.S. exporters are unable to provide 200-300 g sizes.
65
and stable quality are important for Japanese buyers.
Tsukiji import houses import fish and seafood on a consignment basis and remit payment to exporters about 1 week after the auction. They deduct 5.5 percent commission, import duties, truck
ing charges, etc. They are authorized by Japan's Ministry of Agriculture, Forestry and Fisheries to sell to middlemen or wholesalers at auctions through bidding, bargaining, or at a fixed price. The goods may be consigned by producers or purchased by the auction houses from
producers. The wholesaler's selling commissions are fixed at 5.5 percent for marine products. (Source: IFR-89/44R. Prepared by Karen Kelsky and Paul Niemeier of the NMFS Foreign Fisheries Analysis Branch, Silver Springs, MD 20910.)
MALAYSIAN SHRIMP CULTURE
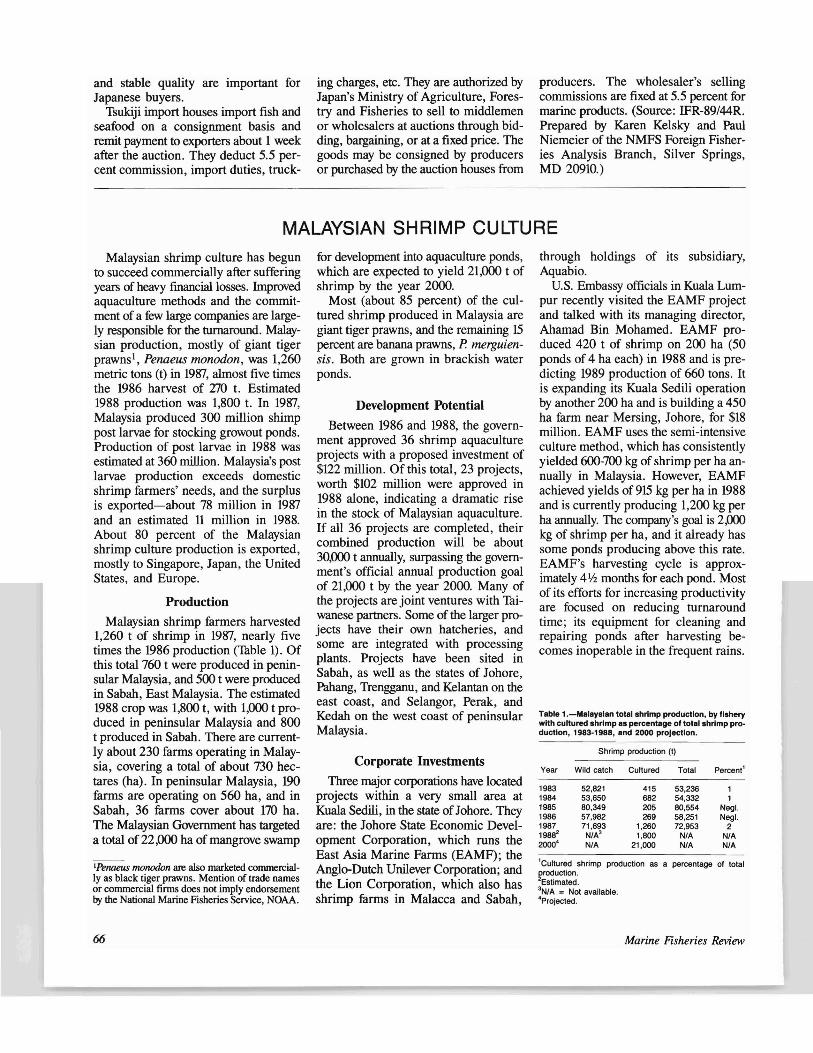
Malaysian shrimp culture has begun to succeed commercially after suffering years of heavy financial losses. Improved aquaculture methods and the commitment of a few large companies are largely responsible for the turnaround. Malaysian production, mostly of giant tiger prawns), Penaeus monodon, was 1,260 metric tons (t) in 1987, almost five times the 1986 harvest of no t. Estimated 1988 production was 1,800 t. In 1987, Malaysia produced 300 million shimp post larvae for stocking growout ponds. Production of post larvae in 1988 was estimated at 360 million. Malaysia's post larvae production exceeds domestic shrimp farmers' needs, and the surplus is exported-about 78 million in 1987 and an estimated 11 million in 1988. About 80 percent of the Malaysian shrimp culture production is exported, mostly to Singapore, Japan, the United States, and Europe.
Production
Malaysian shrimp farmers harvested 1,260 t of shrimp in 1987, nearly five times the 1986 production (Table 1). Of this total 760 t were produced in peninsular Malaysia, and 500 t were produced in Sabah, East Malaysia. The estimated 1988 crop was 1,800 t, with 1,000 t produced in peninsular Malaysia and 800 t produced in Sabah. There are currently about 230 farms operating in Malaysia, covering a total of about 730 hectares (ha). In peninsular Malaysia, 190 farms are operating on 560 ha, and in Sabah, 36 farms cover about 170 ha. The Malaysian Government has targeted a total of 22 ,000 ha of mangrove swamp
'Penaeus monodon are also marketed commercially as black tiger prawns. Mention of trade names or commercial fl11lls does not imply endorsement by the National Marine Fisheries Service, NOAA.
for development into aquaculture ponds, which are expected to yield 21,000 t of shrimp by the year 2000.
Most (about 85 percent) of the cultured shrimp produced in Malaysia are giant tiger prawns, and the remaining 15 percent are banana prawns, P. merguiensis. Both are grown in brackish water ponds.
Development Potential
Between 1986 and 1988, the government approved 36 shrimp aquaculture projects with a proposed investment of $122 million. Of this total, 23 projects, worth $102 million were approved in 1988 alone, indicating a dramatic rise in the stock of Malaysian aquaculture. If all 36 projects are completed, their combined production will be about 30,000 t annually, surpassing the government's official annual production goal of 21,000 t by the year 2000. Many of the projects are joint ventures with Taiwanese partners. Some of the larger projects have their own hatcheries, and some are integrated with processing plants. Projects have been sited in Sabah, as well as the states of Johore, Pahang, Trengganu, and Kelantan on the east coast, and Selangor, Perak, and Kedah on the west coast of peninsular Malaysia.
Corporate Investments
Three major corporations have located projects within a very small area at Kuala Sedill, in the state ofJohore. They are: the Johore State Economic Development Corporation, which runs the East Asia Marine Farms (EAMF); the Anglo-Dutch Unilever Corporation; and the Lion Corporation, which also has shrimp farms in Malacca and Sabah,
through holdings of its subsidiary, Aquabio.
U.S. Embassy officials in Kuala Lumpur recently visited the EAMF project and talked with its managing director, Ahamad Bin Mohamed. EAMF produced 420 t of shrimp on 200 ha (50 ponds of 4 ha each) in 1988 and is predicting 1989 production of 660 tons. It is expanding its Kuala Sedili operation by another 200 ha and is building a 450 ha farm near Mersing, Johore, for $18 million. EAMF uses the semi-intensive culture method, which has consistently yielded 600-700 kg of shrimp per ha annually in Malaysia. However, EAMF achieved yields of 915 kg per ha in 1988 and is currently producing 1,200 kg per ha annually. The company's goal is 2,000 kg of shrimp per ha, and it already has some ponds producing above this rate. EAMF's harvesting cycle is approximately 41J2 months for each pond. Most of its efforts for increasing productivity are focused on reducing turnaround time; its equipment for cleaning and repairing ponds after harvesting becomes inoperable in the frequent rains.
Table 1.-Malayalan total ahrlmp production, by fishery with cul1ured shrimp as percentage of total ahrlmp production, 1983-1988, and 2000 proJection.
Shrimp production (t)
Year Wild catch Cultured Total Percent'
1983 52,821 415 53,236 1 1984 53,650 682 54.332 1 1985 80,349 205 80,554 Neg!. 1986 57,982 269 58,251 Neg!. 1987 19882
71,693 N/A'
1,260 1,800
72,953 N/A
2 N/A
2000' N/A 21,000 N/A N/A
'Cultured shrimp production as a percentage of total r,roduction. Estimated.
'N/A = Not available. ·Projected.
Marine Fisheries Review 66

EAMF currently imports shrimp feed from Taiwan but is constructing its own feedmill. Feed accounts for about 60 percent of production costs in Sabah and 40-50 percent of production costs in peninsular Malaysia. Sabah has recently announced that it will embark on a feed mill joint venture with an unnamed foreign partner.
EAMF is vertically integrated, with its own hatchery and processing plant. It would like to process shrimp from other projects, but currently a substantial percentage of Malaysian shrimp are shipped live for processing to Singapore where they command higher prices. EAMF processes and freezes its shrimp for shipment to Japan where they are marketed under both premium-brand and general-brand names.
According to EAMF's managing director, the Kuala Sedili-based Unilever and Lion shrimp farms have just gone into production. At present, Lion's farm is producing 2 t per month, and Unilever is producing 1 t per month. Lion's shrimp farms in Malaysia are expected to harvest a total of 100-150 t in 1989. The company plans to expand from the current 40 ha in production to over 1,200 ha within the next 5 years. Press reports state that the Unilever project will eventually cover 1,000 ha (150 ponds), yielding 1,200 t per year. Unilever's total investment is expected to be $39 million.
The increased profitablity of shrimp culture in Malaysia is largely because of better siting. Previous projects often failed because ponds were located in mangrove areas where pond excavation resulted in a level of water acidity that is lethal to shrimp. In contrast, the Kuala Sedili projects are located on a tidal river at the edge of a mangrove area where the soil is more suitable.
Despite identical siting, however, there is strong disagreement among the three companies on the best production methods. The Unilever project has higher capital costs because the company lines its ponds with concrete and uses more expensive pumping equipment. The American farm manager for EAMF believes these costs are unnecessary, citing a previous Unilever failure in Sri Lanka. However, an industry source (not asso
51(3), 1989
ciated with any of the three companies) believes that EAMF and Lion risk failure precisely because their less expensive approach leads to costly pond maintenance and significant down time.
Other than feed, the greatest expense for all three projects is the pumping of thousands of gallons of brackish river water in and out of the ponds to maintain proper oxygen levels and to flush them of waste. According to EAMF's, Ahamad, while the government is still endorsing the use of mangrove land for aquaculture, the cognoscenti in Malaysian aquaculture will be setting up on sites similar to Kuala Sedili. The east coast is dotted with relatively unpolluted tidal rivers with adjacent state land theoretically available for aquaculture.
Hatcheries
At present, 32 shrimp hatcheries are registered with the Malaysian Fisheries Department (23 in peninsular Malaysia and 9 in Sabah). Post larvae production in 1987 was 300 million (240 million in peninsular Malaysia and 60 million in Sabah). Estimated 1988 post larvae production is 360 million (280 million in peninsular Malaysia and 80 million in Sabah). Although 78 million post larvae were exported in 1987, it is estimated that only about 11 million were exported in 1988. The reasons for this decline are not known. The major foreign markets for Malaysian post larvae are Sri Lanka, Oman, Pakistan, Hong Kong, Italy, China, and Thailand.
Sabah dominates production of wild tiger prawn broodstock in Malaysia. Live gravid females sell locally for between $58 and $110, with prices going as high as $1,820 in Taiwan, the major export market2 • (Tiger prawns accounted for 70 percent of Taiwan's shrimp exports to Japan and 29 percent of Southeast Asia's shrimp exports to Japan in 1987). Malaysia has banned the export of gravid shrimp, but smuggling them out of the country through Singapore is reportedly common.
Research
The Malaysian National Prawn Re
2The official exchange used in this report is U.S.$l.OO = M$2.75.
search Center was completed in 1987 with a $8.4 million grant from the Japanese Government. It has also received assistance from two Japanese aquaculture experts supplied by the Japanese International Cooperation Agency. The Center has cut shrimp post larvae production costs by 50 percent over the last 5 years, from $0.015 per fry to $0.007. A new technique for mass production of post larvae through induced spawning was developed at the Center and is being applied in most of Malaysia's hatcheries.
Government Incentives
The Malaysian government assists the shrimp culture industry through the Department of Fisheries, which provides advice and technical assistance. Shrimp culture firms are also eligible to receive the tax rebates and tax relief, which the Malaysian government provides to most developing industries. A 5 percent investment tax credit is extended to all shrimp culture investors, i.e., 50 percent of the first 5 year's qualifying capital expenditures may be deducted from taxable income. These expenditures include the clearing of land, pond construction, the purchase of plant and machinery, and building construction. Investors may also borrow from the government's new low-cost investment fund at reduced rates or benefit from a reduced interest rate export credit refinancing scheme.
Outlook
Malaysia will be pushing to join the ranks of major Asian shrimp producers over the next 10 years. Prospects are bright for continued investment now that the larger companies are beginning to demonstrate that shrimp aquaculture can succeed commercially in Malaysia. Whichever production method is employed, potential large players, such as plantation companies and state economic development corporations with foreign joint-venture partners, are likely to move into the shrimp culture business. (Source: IFR-89/50. Prepared by Karen Kelsky and Paul Niemeier of the NMFS Foreign Fisheries Analysis Branch, Silver Spring, MD 20910.)
67