komatsu d375a test report for canyon coal final...“komatsu d375a trial results reviewed” in...
TRANSCRIPT
Page1
Copyright©OptiInnovations–Confidential
OptiInnovationsCleanMobility
CompiledbyAndréJacobsandRaymondBeckerOPTIINNOVATIONSLIMITED0827880099/0834405599October 2018
ReportontheuseoftheOptiDieselFuel
CatalystintrialonKomatsuD375Adozer
atPhalanndwaMine(CanyonCoal)

Page2
Copyright©OptiInnovations–Confidential
Background Opti Innovations conducted a trial on a Komatsu D375A dozer (Fleet no: VUL 006) at Phalanndwa mine in terms of the agreed test protocol attached in Annexure 1. Nature and results of the trial The trial commenced on 24 July 2018 and ended on 11 August 2018 after 223 hours of operation by the said dozer. The baseline litres/hour consumption was determined by calculating the dozer hours worked versus litres consumed for the period January to June 2018 – an average of 75.89 litres/hour. (refer to “Komatsu D375A trial results Reviewed” in Annexure 2). In addition, a baseline emissions and fuel combustion efficiency test was undertaken by Disprotech SA, an independent emissions measuring firm. The results of the baseline test are attached in Annexure 3. Thereafter, on 24 July 2018, all normal fuel was flushed from the dozer’s fuel tank and the said fuel tank was filled with diesel dosed with OptiDiesel, as per the protocol, from a 1000-litre mobile bowser. OptiDiesel requires to be operative in an asset for a minimum of 72 hours, before optimal results can be achieved. It was, thus, decided to allow 81 hours of operation as a run-up period, before the actual trial would commence. Litres consumed and hours worked were recorded daily during the 81-hours run-up period. On 1 August 2018, 81 hours of operation had been achieved. As from 1 August 2018, litres consumed and hours worked using fuel dosed with OptiDiesel were still being recorded on a daily basis. It must be noted that during this period the dozer was moving interburden material exclusively. The results of the trial period from 1 – 11 August 2018 are shown in the “Komatsu D375A trial results Reviewed” in Annexure 2. These results indicate that the dozer used 16.3% less fuel compared to baseline during the trial. A final emissions and fuel combustion efficiency test was undertaken on 12 August 2018 by Disprotech SA – the results of which are attached in Annexure 4. The final test confirmed the following:
Page3
Copyright©OptiInnovations–Confidential
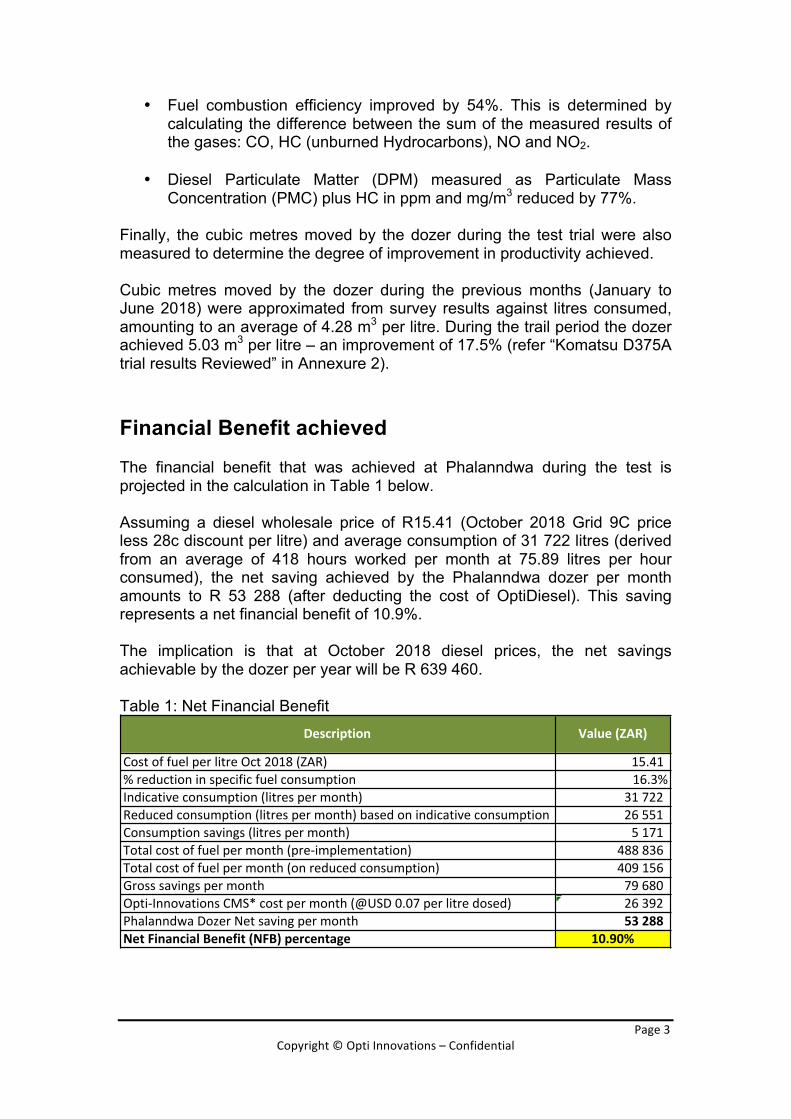
• Fuel combustion efficiency improved by 54%. This is determined by calculating the difference between the sum of the measured results of the gases: CO, HC (unburned Hydrocarbons), NO and NO2.
• Diesel Particulate Matter (DPM) measured as Particulate Mass
Concentration (PMC) plus HC in ppm and mg/m3 reduced by 77%. Finally, the cubic metres moved by the dozer during the test trial were also measured to determine the degree of improvement in productivity achieved. Cubic metres moved by the dozer during the previous months (January to June 2018) were approximated from survey results against litres consumed, amounting to an average of 4.28 m3 per litre. During the trail period the dozer achieved 5.03 m3 per litre – an improvement of 17.5% (refer “Komatsu D375A trial results Reviewed” in Annexure 2). Financial Benefit achieved The financial benefit that was achieved at Phalanndwa during the test is projected in the calculation in Table 1 below. Assuming a diesel wholesale price of R15.41 (October 2018 Grid 9C price less 28c discount per litre) and average consumption of 31 722 litres (derived from an average of 418 hours worked per month at 75.89 litres per hour consumed), the net saving achieved by the Phalanndwa dozer per month amounts to R 53 288 (after deducting the cost of OptiDiesel). This saving represents a net financial benefit of 10.9%. The implication is that at October 2018 diesel prices, the net savings achievable by the dozer per year will be R 639 460. Table 1: Net Financial Benefit
Description Value(ZAR)
CostoffuelperlitreOct2018(ZAR) 15.41%reductioninspecificfuelconsumption 16.3%Indicativeconsumption(litrespermonth) 31722Reducedconsumption(litrespermonth)basedonindicativeconsumption 26551Consumptionsavings(litrespermonth) 5171Totalcostoffuelpermonth(pre-implementation) 488836Totalcostoffuelpermonth(onreducedconsumption) 409156Grosssavingspermonth 79680Opti-InnovationsCMS*costpermonth(@USD0.07perlitredosed) 26392PhalanndwaDozerNetsavingpermonth 53288NetFinancialBenefit(NFB)percentage 10.90%
Page4
Copyright©OptiInnovations–Confidential
Conclusion: During the trial, the dozer consumed 16.3% less fuel than baseline operations, whilst moving 17.5% more material per litre of fuel consumed. This result was achieved mainly as a result of a 54% improvement in fuel combustion efficiency. In essence, the dozer was able to do more work using less fuel. Overall emissions (6 gases) reduced by 54% and DPM by 77% (as determined by the traditional measure of DPM in ppm or mg/m3). The direct net financial benefit in fuel consumption saving was calculated at 10.9% or +R50 000 per month. Phalanndwa management will be able to perform its own calculation of the additional financial benefit as a result of the 17.5% improvement in productivity achieved by the dozer. Finally, the abovementioned savings would exclude reduction in maintenance costs that will be achievable over time as a result of cleaner fuel combustion. Acknowledgements: Opti Innovations gives thanks to Cleavon Moothoosamy for provision of internal consumption and production data and Divan Maartens for his detailed and committed support during the trial period.
Page5
Copyright©OptiInnovations–Confidential
Annexure 1: Test Protocol
OptiInnovations
CleanMobility
CompiledbyAndréJacobsandRaymondBeckerOPTIINNOVATIONSLtd0827880099/0834405599
UsingtheOptiDieselFuelCatalyst
PROTOCOLFORESTABLISHINGNET
FINANCIALBENEFITFORMOBILEASSETSUSEDINOPEN-CASTMINING
byapplicationof
CustomFuelConsumptionMeasurement
Page6
Copyright©OptiInnovations–Confidential
Index
INDEX ............................................................................................................... 6BACKGROUNDANDINTRODUCTION .............................................................. 7THEIMPORTANCEOFLOADDATA ................................................................. 8COMPARINGFUELECONOMYONMOBILEASSETSTHATAREUSEDINOPEN-CASTMININGAPPLICATIONS ................................................................................................... 8
PROTOCOLFORMANUALFUELDOSINGMETHODOLOGY ........................... 11REQUIREDPROCEDUREFORMANAGING/DOSINGFUELFORTHEBASELINETESTANDTHECATALYSTTEST ................................................................................................ 11REQUIREDPROCEDURESFORGATHERINGBASELINECONSUMPTION&CONSUMPTIONWITHCATALYSTDATA ............................................................................................... 121.OPERATINGLOG-SHEET: .............................................................................. 12
OPERATIONALPROCEDURE ................................................................................. 12OPTI-INNOVATIONS’OBLIGATIONS ....................................................................... 12CLIENTCOMPANY/OPERATOR’SOBLIGATIONS ......................................................... 13ANNEXURE1:COMBUSTIONEFFICIENCYTEST ........................................................ 14
Page7
Copyright©OptiInnovations–Confidential
BackgroundandIntroductionTheOpti Innovations Fuel Solution is a turnkey approach to fuelmanagementthat increases the operational efficiency of Hydro Carbon combustion inINTERNAL COMBUSTION ENGINE POWERED assets, resulting in an overallimprovementinfueluseandreductionoftheharmfulemissionsassociatedwiththecombustionoffuel.The purpose of this test protocol is to document the data to be gathered andprovide the test methodology to be used for testing of Opti Innovations’combustionenhancingfuelefficiencycatalystonopen-castminingassets.The test protocol presented is geared towards being able to cost-effectivelydeterminetheeconomicbenefitofusing the fuelcatalystonagivenasset– i.e.calculate the quantum of fuel economy improvement through use of the fuelcatalyst.Thetestprotocoldoesnotrepresentthemosteffectivemannertodosefuelwiththe catalyst. Opti Innovations normally deploys a proprietary, skid-mounteddosingsystemthatusesauniquetechnologyandmethodforoptimaldosingoffuelintobulkfueltanksduringsupplierdelivery.Thistestprotocolwillsimulatesuchoptimaldosinginamanualwayinordertoavoidincurringthecapitalcostrequiredtousetheskid-mounteddosingsystem.

Page8
Copyright©OptiInnovations–Confidential
TheimportanceofloaddataComparingfueleconomyonmobileassetsthatareusedinopen-castminingapplicationsIt is important to understand that a number of variable, fluctuating factorsinfluence fuel economy onmobile load-bearing equipment assets. Examples ofthese factors in the context of vehicles include driver behaviour, climactic &mining conditions, topography, loads excavated or moved and drive train /engine losses, to name a few.Regardless of the inter-relationship between thevariousfactors,measuringtorqueoutput(i.e.workdone)asasinglemeasuredmetric compared to fuel volume consumed and tonnage moved provides anaccuratereflectionoffueleconomy.Whereitisnotpossibletoaccuratelymeasureandcollectthedatarelatedtothetorqueproducedforagivenvolumeoffuelconsumedforanamountoftonnagemoved, the following approach can be used to calculate a comparative fueleconomyforagivenequipmentasset.Itisassumedthereaderunderstandsthatsimply using tons/litre or litres/hour as the comparison metric is a flawedapproach due to the influencing factorsmentioned above. In order to create avalid comparison metric one needs to, at the very least, factor in the loadsmoved,bycalculatingavaluethatresultsinthefollowingmetricforcomparisonpurposes:
FuelGrams/kgmovedforanassetmovingloadsinagivenperiodIt is also important to understand that fuel efficiency gains may manifestthemselves through an improvement in fuel economyand an improvement inloadcapacityduetoincreasedtorque.Therefore,bycorrelatingbothloadmovedand fuel economychanges, one is able to get amoreaccurate reflectionof thebenefitsbeingderivedfromgivenfuelefficiencyintervention(s).Firstly, one has to determine the Specific Gravity of the fuel. This is done bymeasuring theweightof1or200 litre(s)of fuel ingramsanddetermining thetemperature atwhich the fuel isweighed at and recording it. A typical SG [email protected],one has to calculate in gramsthe litres of fuel used. This is done bymultiplyingtheSGofthefuelusedbythelitresoffuelusedtogetthemassoffuelingrams.Thelitresoffuelusedisdeterminedbymeasuringtheamountoffuelconsumedonaspecificactivityfromafulltanktoatankrefuel.Thirdly, the tonnagemoved is determined by taking the tons recorded at thebeginning of the activity and the tons recorded at the end of the activity.Subtracting the beginning reading from the end reading provides the activitytonsmovedduringtheactivity.
Page9
Copyright©OptiInnovations–Confidential
Onehas todetermine theKgmovedor carriedperperiod.The equation tobeusedis1ton/1000=Kg*hours(period).ThenextstepistocalculatetheFuelgrams/Kgeconomy.Thisisdone,firstly,bycalculatingthegramsoffuelused,bytotallingthelitresusedfortheactivityandmultiplyingitbytheSG.ThesecondstepwillbetodividethegramsoffuelusedfortheactivitybytheKgsmovedduringtheactivity.Theabovecalculationsneedtobeperformedforboththebaselineandefficiencyintervention(s)testperiod.TheBaselinemetricminus theCatalystmetricresults in theFuelConsumption(FC)saving.TheFC%savingisdeterminedbydividingthesavingintotheBaselinemetricx100.Tovalidatetheaccuracyofabovemeasurements,thefuelcombustionefficiencyoftheenginemayalsobetested,bydeterminingthenatureoftheexhaustgasesemittedfollowingthecombustionprocess.RefertoAnnexure1fordetails. It isproposed that a fuel combustionefficiency testbeperformedprior tobaselineandasecondandthirdtestaftercompletionofthecatalysttestprotocol.MethodtoobtaintheNetFinancialBenefit(NFB)
1. ObtaintheBaselinecostpergrambydividingthecostperlitreoffuelbytheSG.
2. To determine the Baseline cost per Kg,multiply the Baseline FC by the
costoffuelperKg.
3. ObtaintheCatalystcostpergrambyfirstaddingthecostperlitredosedofcatalysttothecostoffuel.DividethattotalbytheSG.
4. To determine the Catalyst cost per Kg, multiply the Catalyst FC by the
CatalystcostperKg.
5. SubtracttheCatalystcostperKgfromtheBaselinecostperKgtoobtaintheNFBcostperKg.
6. ToobtaintheNFB%dividetheNFBcostperKgbytheBaselinecostper
Kg.MethodtoobtaintheNFBQuantum
1. Obtain theBaseline fuelcostbymultiplying theBaseline fuelvolumebythefuelpriceperlitre.
2. ToobtaintheNFBquantummultiplytheNFB%bytheBaselinefuelcost.
Page10
Copyright©OptiInnovations–Confidential
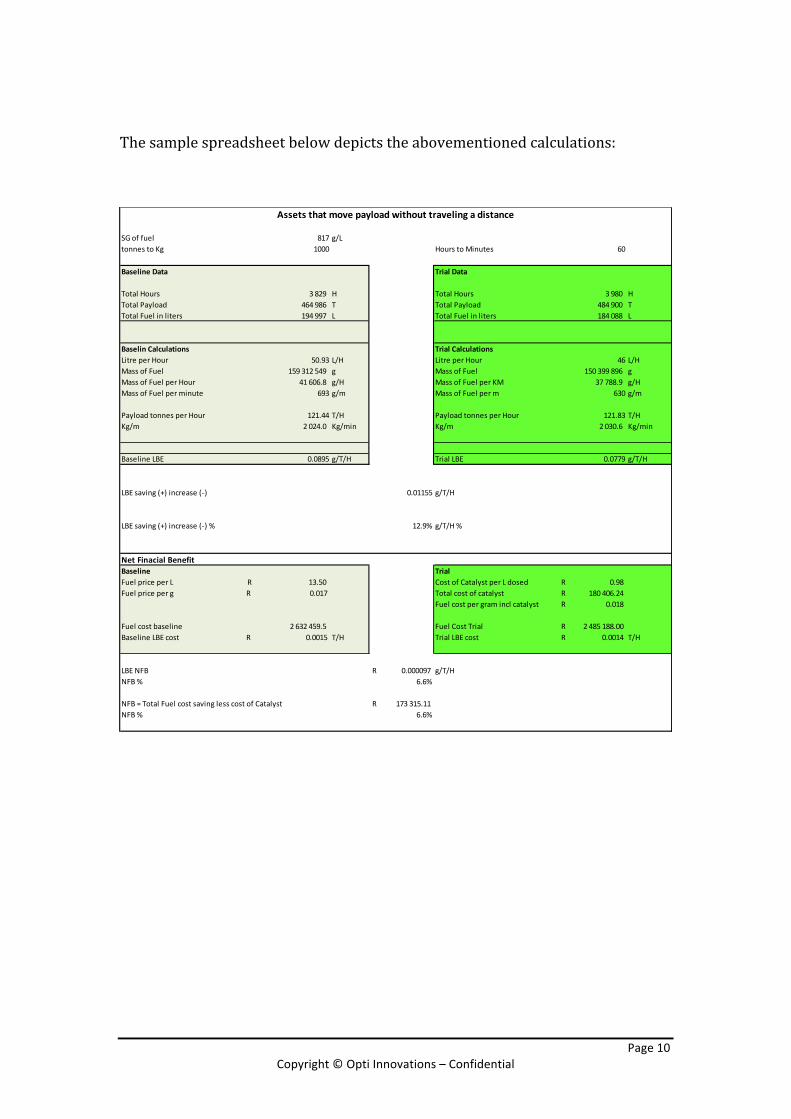
Thesamplespreadsheetbelowdepictstheabovementionedcalculations:
SGoffuel 817 g/LtonnestoKg 1000 HourstoMinutes 60
BaselineData TrialData
TotalHours 3829 H TotalHours 3980 HTotalPayload 464986 T TotalPayload 484900 TTotalFuelinliters 194997 L TotalFuelinliters 184088 L
BaselinCalculations TrialCalculationsLitreperHour 50.93 L/H LitreperHour 46 L/HMassofFuel 159312549 g MassofFuel 150399896 gMassofFuelperHour 41606.8 g/H MassofFuelperKM 37788.9 g/HMassofFuelperminute 693 g/m MassofFuelperm 630 g/m
PayloadtonnesperHour 121.44 T/H PayloadtonnesperHour 121.83 T/HKg/m 2024.0 Kg/min Kg/m 2030.6 Kg/min
BaselineLBE 0.0895 g/T/H TrialLBE 0.0779 g/T/H
0.01155 g/T/H
LBEsaving(+)increase(-)% 12.9% g/T/H%
NetFinacialBenefitBaseline TrialFuelpriceperL 13.50R CostofCatalystperLdosed 0.98RFuelpriceperg 0.017R Totalcostofcatalyst 180406.24R
Fuelcostpergraminclcatalyst 0.018R
Fuelcostbaseline 2632459.5 FuelCostTrial 2485188.00RBaselineLBEcost 0.0015R T/H TrialLBEcost 0.0014R T/H
LBENFB 0.000097R g/T/HNFB% 6.6%
NFB=TotalFuelcostsavinglesscostofCatalyst 173315.11RNFB% 6.6%
LBEsaving(+)increase(-)
Assetsthatmovepayloadwithouttravelingadistance
Page11
Copyright©OptiInnovations–Confidential
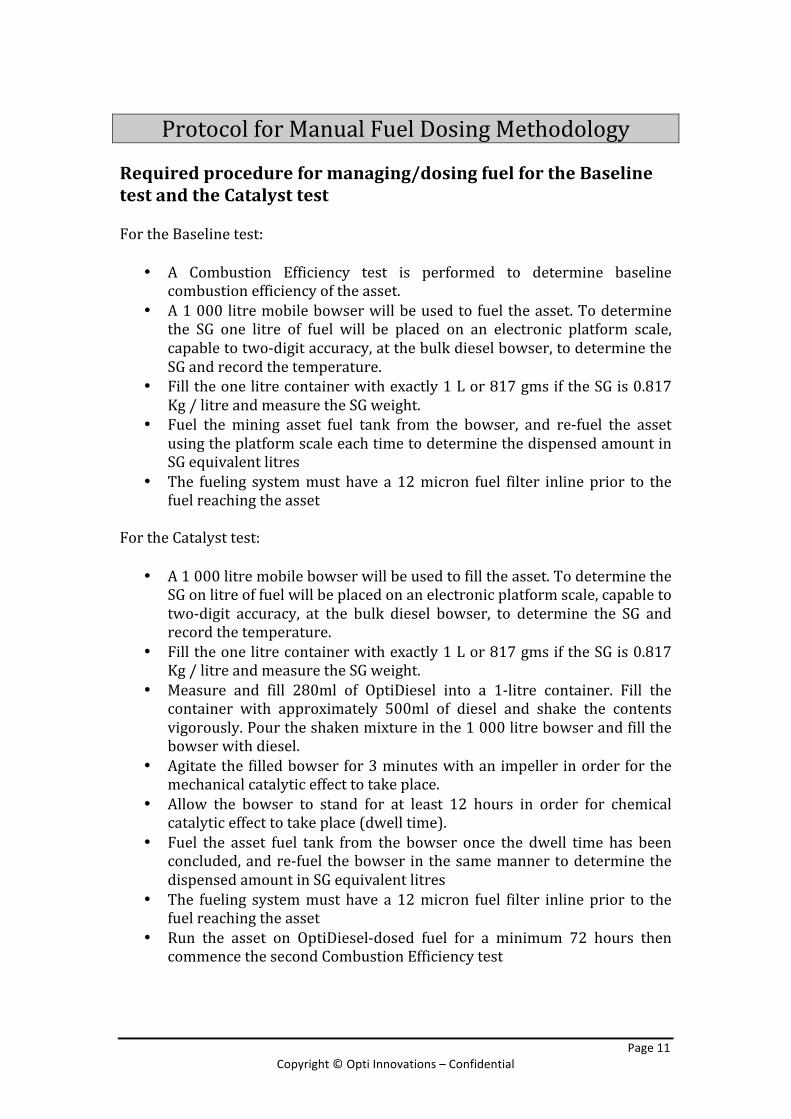
ProtocolforManualFuelDosingMethodologyRequiredprocedureformanaging/dosingfuelfortheBaselinetestandtheCatalysttestFortheBaselinetest:
• A Combustion Efficiency test is performed to determine baselinecombustionefficiencyoftheasset.
• A1000litremobilebowserwillbeusedtofueltheasset.Todeterminethe SG one litre of fuel will be placed on an electronic platform scale,capabletotwo-digitaccuracy,atthebulkdieselbowser,todeterminetheSGandrecordthetemperature.
• Filltheonelitrecontainerwithexactly1Lor817gmsiftheSGis0.817Kg/litreandmeasuretheSGweight.
• Fuel the mining asset fuel tank from the bowser, and re-fuel the assetusingtheplatformscaleeachtimetodeterminethedispensedamountinSGequivalentlitres
• The fueling systemmust have a 12micron fuel filter inlineprior to thefuelreachingtheasset
FortheCatalysttest:
• A1000litremobilebowserwillbeusedtofilltheasset.TodeterminetheSGonlitreoffuelwillbeplacedonanelectronicplatformscale,capabletotwo-digit accuracy, at the bulk diesel bowser, to determine the SG andrecordthetemperature.
• Filltheonelitrecontainerwithexactly1Lor817gmsiftheSGis0.817Kg/litreandmeasuretheSGweight.
• Measure and fill 280ml of OptiDiesel into a 1-litre container. Fill thecontainer with approximately 500ml of diesel and shake the contentsvigorously.Pourtheshakenmixtureinthe1000litrebowserandfillthebowserwithdiesel.
• Agitatethefilledbowserfor3minuteswithanimpeller inorderforthemechanicalcatalyticeffecttotakeplace.
• Allow the bowser to stand for at least 12 hours in order for chemicalcatalyticeffecttotakeplace(dwelltime).
• Fuel the asset fuel tank from the bowser once the dwell time has beenconcluded,andre-fuel thebowser inthesamemannertodeterminethedispensedamountinSGequivalentlitres
• The fueling systemmust have a 12micron fuel filter inlineprior to thefuelreachingtheasset
• Run the asset on OptiDiesel-dosed fuel for a minimum 72 hours thencommencethesecondCombustionEfficiencytest
Page12
Copyright©OptiInnovations–Confidential
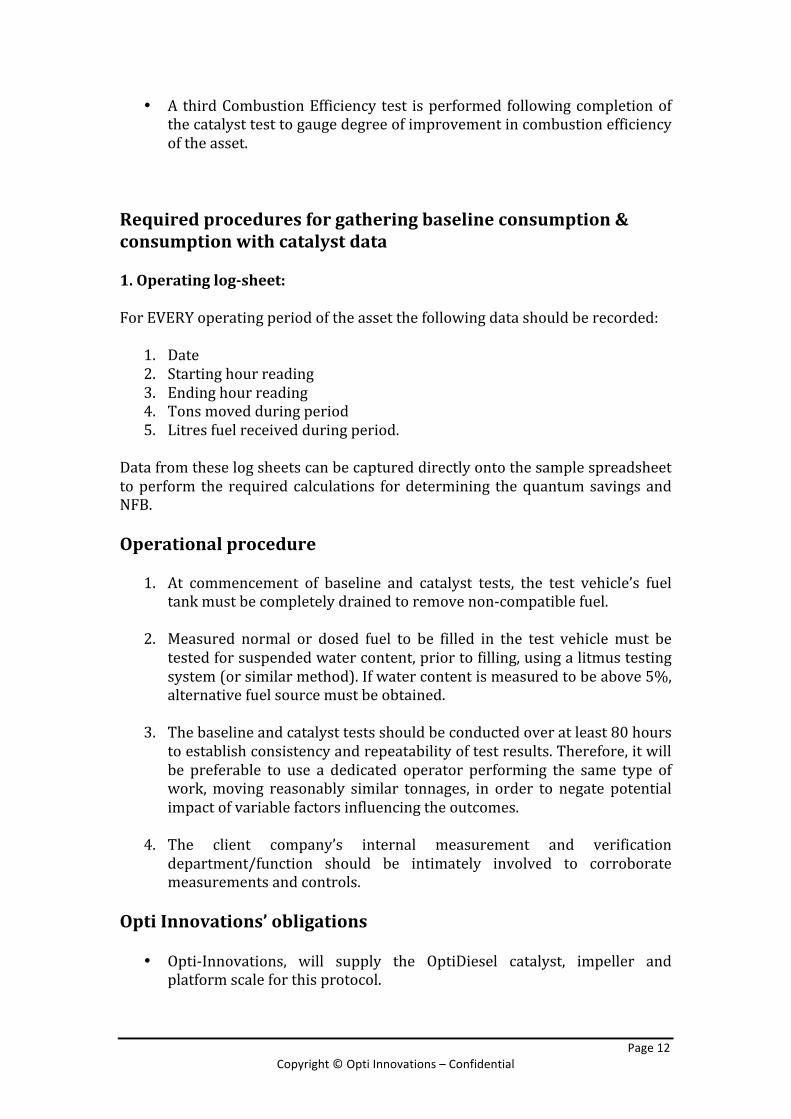
• AthirdCombustionEfficiency test isperformed followingcompletionofthecatalysttesttogaugedegreeofimprovementincombustionefficiencyoftheasset.
Requiredproceduresforgatheringbaselineconsumption&consumptionwithcatalystdata1.Operatinglog-sheet:ForEVERYoperatingperiodoftheassetthefollowingdatashouldberecorded:
1. Date2. Startinghourreading3. Endinghourreading4. Tonsmovedduringperiod5. Litresfuelreceivedduringperiod.
Datafromtheselogsheetscanbecaptureddirectlyontothesamplespreadsheettoperform the required calculations fordetermining thequantumsavingsandNFB.Operationalprocedure
1. At commencement of baseline and catalyst tests, the test vehicle’s fueltankmustbecompletelydrainedtoremovenon-compatiblefuel.
2. Measured normal or dosed fuel to be filled in the test vehiclemust be
testedforsuspendedwatercontent,priortofilling,usingalitmustestingsystem(orsimilarmethod).Ifwatercontentismeasuredtobeabove5%,alternativefuelsourcemustbeobtained.
3. Thebaselineandcatalysttestsshouldbeconductedoveratleast80hours
toestablishconsistencyandrepeatabilityoftestresults.Therefore,itwillbe preferable to use a dedicated operator performing the same type ofwork,moving reasonably similar tonnages, in order to negate potentialimpactofvariablefactorsinfluencingtheoutcomes.
4. The client company’s internal measurement and verification
department/function should be intimately involved to corroboratemeasurementsandcontrols.
OptiInnovations’obligations
• Opti-Innovations, will supply the OptiDiesel catalyst, impeller andplatformscaleforthisprotocol.
Page13
Copyright©OptiInnovations–Confidential
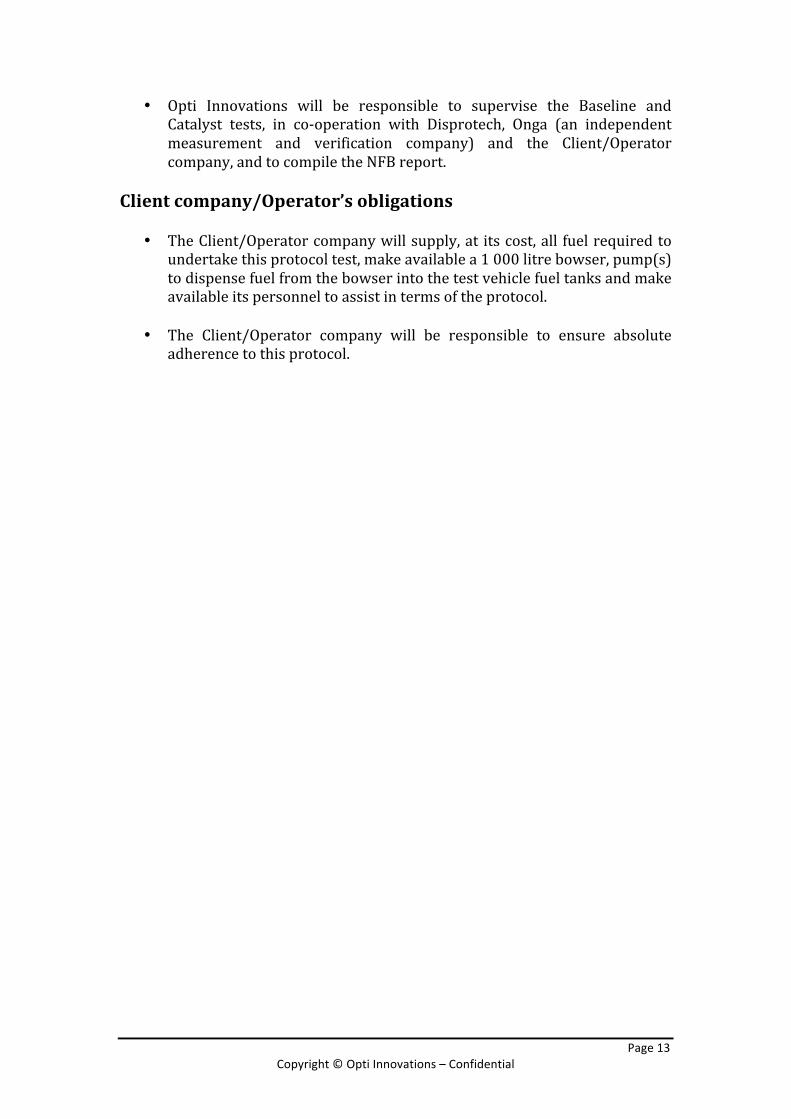
• Opti Innovations will be responsible to supervise the Baseline andCatalyst tests, in co-operation with Disprotech, Onga (an independentmeasurement and verification company) and the Client/Operatorcompany,andtocompiletheNFBreport.
Clientcompany/Operator’sobligations
• TheClient/Operatorcompanywillsupply,at itscost,all fuelrequiredtoundertakethisprotocoltest,makeavailablea1000litrebowser,pump(s)todispensefuelfromthebowserintothetestvehiclefueltanksandmakeavailableitspersonneltoassistintermsoftheprotocol.
• The Client/Operator company will be responsible to ensure absolute
adherencetothisprotocol.
Page14
Copyright©OptiInnovations–Confidential
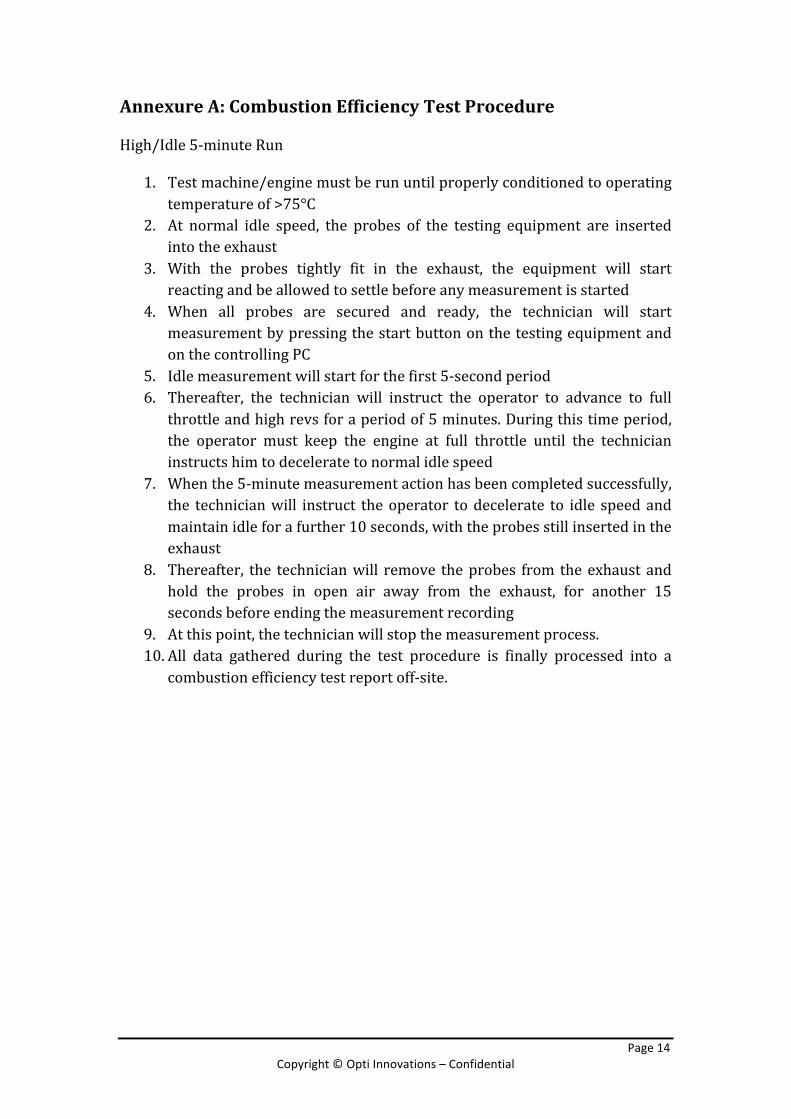
AnnexureA:CombustionEfficiencyTestProcedure High/Idle5-minuteRun
1. Testmachine/enginemustberununtilproperlyconditionedtooperatingtemperatureof>75°C
2. At normal idle speed, the probes of the testing equipment are insertedintotheexhaust
3. With the probes tightly fit in the exhaust, the equipment will startreactingandbeallowedtosettlebeforeanymeasurementisstarted
4. When all probes are secured and ready, the technician will startmeasurementbypressingthestartbuttononthetestingequipmentandonthecontrollingPC
5. Idlemeasurementwillstartforthefirst5-secondperiod6. Thereafter, the technician will instruct the operator to advance to full
throttleandhighrevsforaperiodof5minutes.Duringthistimeperiod,the operator must keep the engine at full throttle until the technicianinstructshimtodeceleratetonormalidlespeed
7. Whenthe5-minutemeasurementactionhasbeencompletedsuccessfully,the technicianwill instruct theoperator todecelerate to idle speedandmaintainidleforafurther10seconds,withtheprobesstillinsertedintheexhaust
8. Thereafter, the technicianwill remove theprobes from theexhaust andhold the probes in open air away from the exhaust, for another 15secondsbeforeendingthemeasurementrecording
9. Atthispoint,thetechnicianwillstopthemeasurementprocess.10. All data gathered during the test procedure is finally processed into a
combustionefficiencytestreportoff-site.
Page15
Copyright©OptiInnovations–Confidential
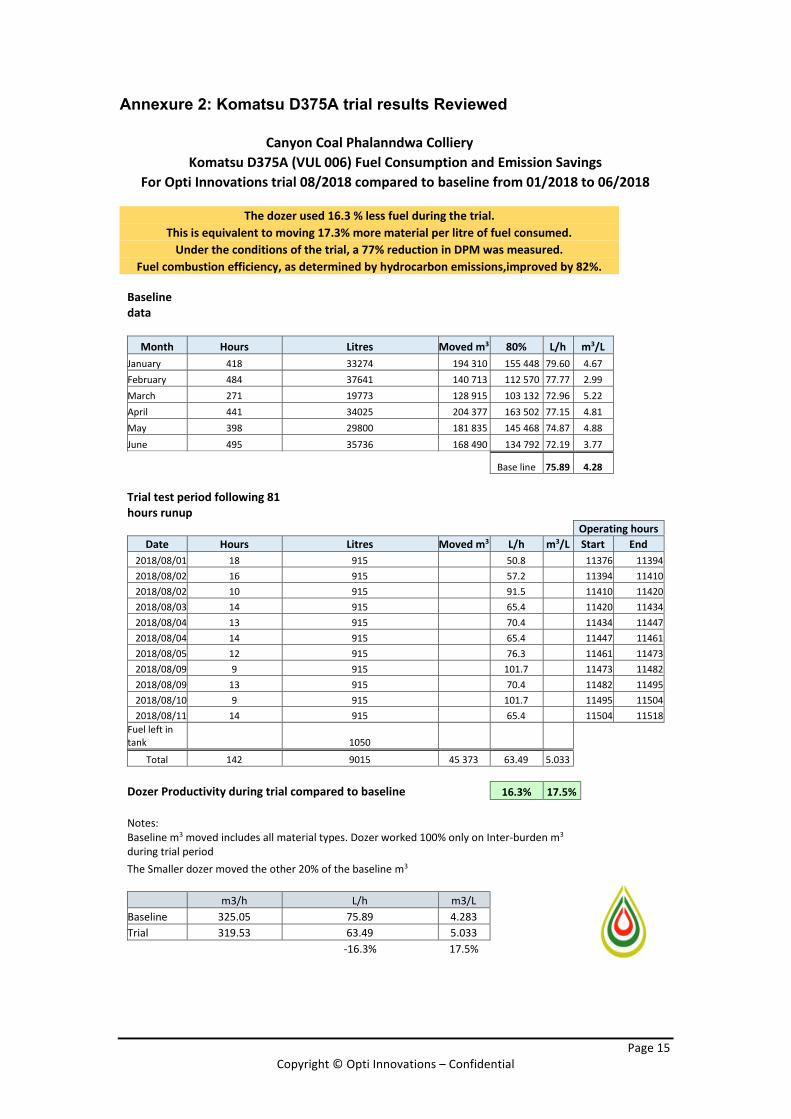
Annexure 2: Komatsu D375A trial results Reviewed
CanyonCoalPhalanndwaColliery KomatsuD375A(VUL006)FuelConsumptionandEmissionSavings
ForOptiInnovationstrial08/2018comparedtobaselinefrom01/2018to06/2018
Thedozerused16.3%lessfuelduringthetrial. Thisisequivalenttomoving17.3%morematerialperlitreoffuelconsumed. Undertheconditionsofthetrial,a77%reductioninDPMwasmeasured.
Fuelcombustionefficiency,asdeterminedbyhydrocarbonemissions,improvedby82%.
Baselinedata
Month Hours Litres Movedm3 80% L/h m3/L January 418 33274 194310155448 79.60 4.67 February 484 37641 140713112570 77.77 2.99 March 271 19773 128915103132 72.96 5.22 April 441 34025 204377163502 77.15 4.81 May 398 29800 181835145468 74.87 4.88 June 495 35736 16849013479272.19 3.77
Baseline 75.89 4.28
Trialtestperiodfollowing81hoursrunup
Operatinghours Date Hours Litres Movedm3 L/h m3/L Start End 2018/08/01 18 915 50.8 11376 11394 2018/08/02 16 915 57.2 11394 11410 2018/08/02 10 915 91.5 11410 11420 2018/08/03 14 915 65.4 11420 11434 2018/08/04 13 915 70.4 11434 11447 2018/08/04 14 915 65.4 11447 11461 2018/08/05 12 915 76.3 11461 11473 2018/08/09 9 915 101.7 11473 11482 2018/08/09 13 915 70.4 11482 11495 2018/08/10 9 915 101.7 11495 11504 2018/08/11 14 915 65.4 11504 11518
Fuelleftintank 1050
Total 142 9015 45373 63.49 5.033 DozerProductivityduringtrialcomparedtobaseline 16.3% 17.5% Notes:
Baselinem3movedincludesallmaterialtypes.Dozerworked100%onlyonInter-burdenm3duringtrialperiod
TheSmallerdozermovedtheother20%ofthebaselinem3 m3/h L/h m3/L Baseline 325.05 75.89 4.283 Trial 319.53 63.49 5.033 -16.3% 17.5%
Page16
Copyright©OptiInnovations–Confidential
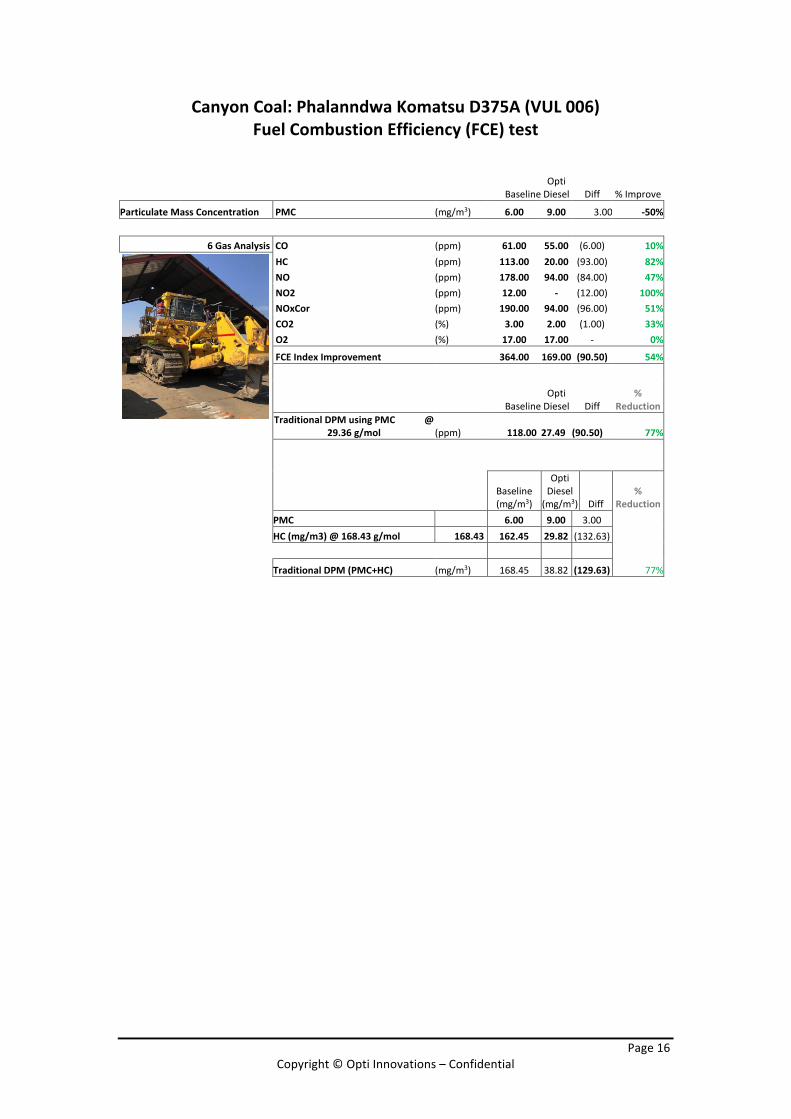
CanyonCoal:PhalanndwaKomatsuD375A(VUL006)FuelCombustionEfficiency(FCE)test
BaselineOptiDiesel Diff %Improve
ParticulateMassConcentration PMC (mg/m3) 6.00 9.00 3.00 -50%
6GasAnalysisCO (ppm) 61.00 55.00 (6.00) 10% HC (ppm) 113.00 20.00 (93.00) 82% NO (ppm) 178.00 94.00 (84.00) 47% NO2 (ppm) 12.00 - (12.00) 100% NOxCor (ppm) 190.00 94.00 (96.00) 51% CO2 (%) 3.00 2.00 (1.00) 33% O2 (%) 17.00 17.00 - 0% FCEIndexImprovement 364.00 169.00 (90.50) 54%
BaselineOptiDiesel Diff
%Reduction
TraditionalDPMusingPMC@
29.36g/mol (ppm) 118.0027.49
(90.50) 77%
Baseline(mg/m3)
OptiDiesel(mg/m3) Diff
%Reduction
PMC 6.00 9.00 3.00 HC(mg/m3)@168.43g/mol 168.43 162.45 29.82 (132.63)
TraditionalDPM(PMC+HC) (mg/m3) 168.45 38.82 (129.63) 77%
Page17
Copyright©OptiInnovations–Confidential
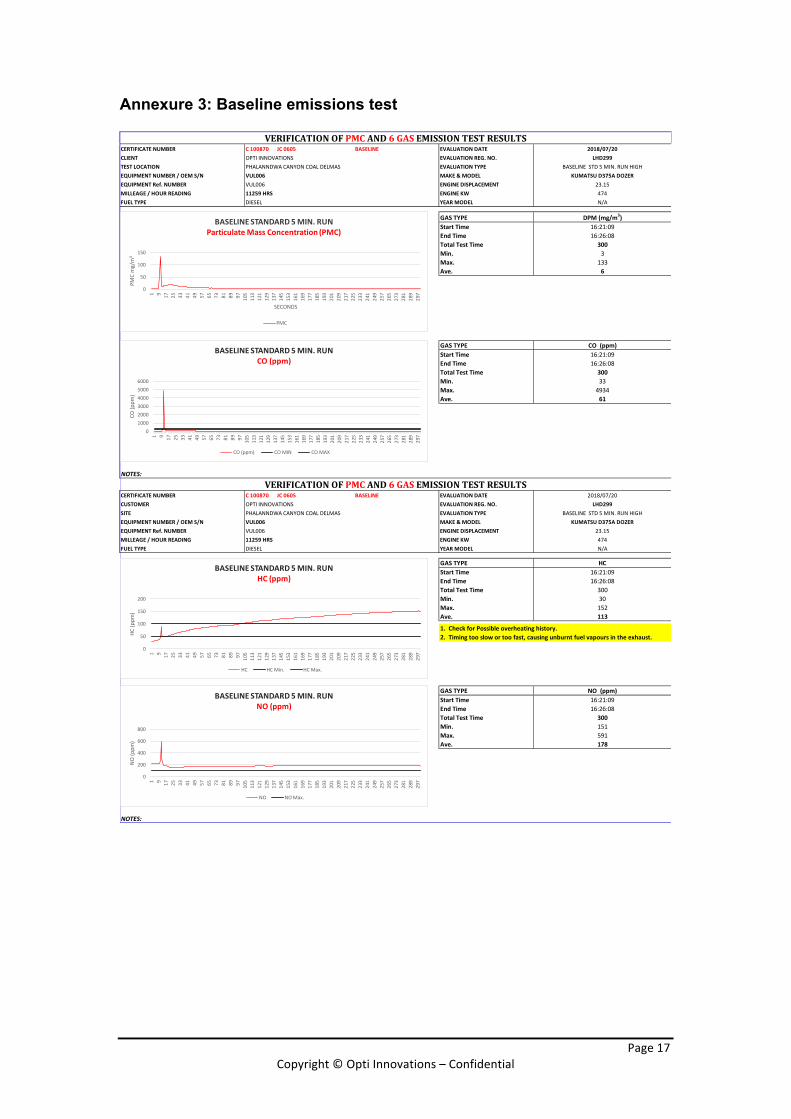
Annexure 3: Baseline emissions test
C100870 JC0605 BASELINE
GASTYPEStartTimeEndTimeTotalTestTimeMin.Max.Ave.
NOTES:
C100870 JC0605 BASELINE
1.CheckforPossibleoverheatinghistory.2.Timingtooslowortoofast,causingunburntfuelvapoursintheexhaust.
GASTYPEStartTimeEndTimeTotalTestTimeMin.Max.Ave.
NOTES:
VERIFICATIONOFPMCAND6GASEMISSIONTESTRESULTSCERTIFICATENUMBER EVALUATIONDATE 2018/07/20CLIENT OPTIINNOVATIONS EVALUATIONREG.NO. LHD299
EQUIPMENTRef.NUMBER VUL006 ENGINEDISPLACEMENT 23.15MILLEAGE/HOURREADING 11259HRS ENGINEKW 474
TESTLOCATION PHALANNDWACANYONCOALDELMAS EVALUATIONTYPE BASELINESTD5MIN.RUNHIGHEQUIPMENTNUMBER/OEMS/N VUL006 MAKE&MODEL KUMATSUD375ADOZER
StartTime 16:21:09EndTime 16:26:08TotalTestTime 300
FUELTYPE DIESEL YEARMODEL N/A
GASTYPE DPM(mg/m3)
CO(ppm)16:21:0916:26:08
300334934
Min. 3Max. 133Ave. 6
61
VERIFICATIONOFPMCAND6GASEMISSIONTESTRESULTSCERTIFICATENUMBER EVALUATIONDATE 2018/07/20CUSTOMER OPTIINNOVATIONS EVALUATIONREG.NO. LHD299
EQUIPMENTRef.NUMBER VUL006 ENGINEDISPLACEMENT 23.15MILLEAGE/HOURREADING 11259HRS ENGINEKW 474
SITE PHALANNDWACANYONCOALDELMAS EVALUATIONTYPE BASELINESTD5MIN.RUNHIGHEQUIPMENTNUMBER/OEMS/N VUL006 MAKE&MODEL KUMATSUD375ADOZER
StartTime 16:21:09EndTime 16:26:08TotalTestTime 300
FUELTYPE DIESEL YEARMODEL N/A
GASTYPE HC
NO(ppm)16:21:0916:26:08
300151591
Min. 30Max. 152Ave. 113
178
0
50
100
150
1 9 17 25 33 41 49 57 65 73 81 89 97 105
113
121
129
137
145
153
161
169
177
185
193
201
209
217
225
233
241
249
257
265
273
281
289
297
PMCmg/m
3
SECONDS
BASELINESTANDARD5MIN.RUNParticulateMassConcentration(PMC)
PMC
0100020003000400050006000
1 9 17 25 33 41 49 57 65 73 81 89 97 105
113
121
129
137
145
153
161
169
177
185
193
201
209
217
225
233
241
249
257
265
273
281
289
297
CO(p
pm)
BASELINESTANDARD5MIN.RUNCO(ppm)
CO(ppm) COMIN COMAX
0
50
100
150
200
1 9 17 25 33 41 49 57 65 73 81 89 97 105
113
121
129
137
145
153
161
169
177
185
193
201
209
217
225
233
241
249
257
265
273
281
289
297
HC(p
pm)
BASELINESTANDARD5MIN.RUNHC(ppm)
HC HCMin. HCMax.
0
200
400
600
800
1 9 17 25 33 41 49 57 65 73 81 89 97 105
113
121
129
137
145
153
161
169
177
185
193
201
209
217
225
233
241
249
257
265
273
281
289
297
NO(p
pm)
BASELINESTANDARD5MIN.RUNNO(ppm)
NO NOMax.
Page18
Copyright©OptiInnovations–Confidential
C100870 JC0605 BASELINE
GASTYPEStartTimeEndTimeTotalTestTimeMin.Max.Ave.
NOTES:
C100870 JC0605 BASELINE
ENIGINEOFTESTEDASSETHASNOTBEENSERVICEDORAIRFILTERCHANGEDBEFORETHETESTNOTES: ENGINEOFTESTEDASSETISINAVERYGOODCONDITIONANDWELLMAINTANED
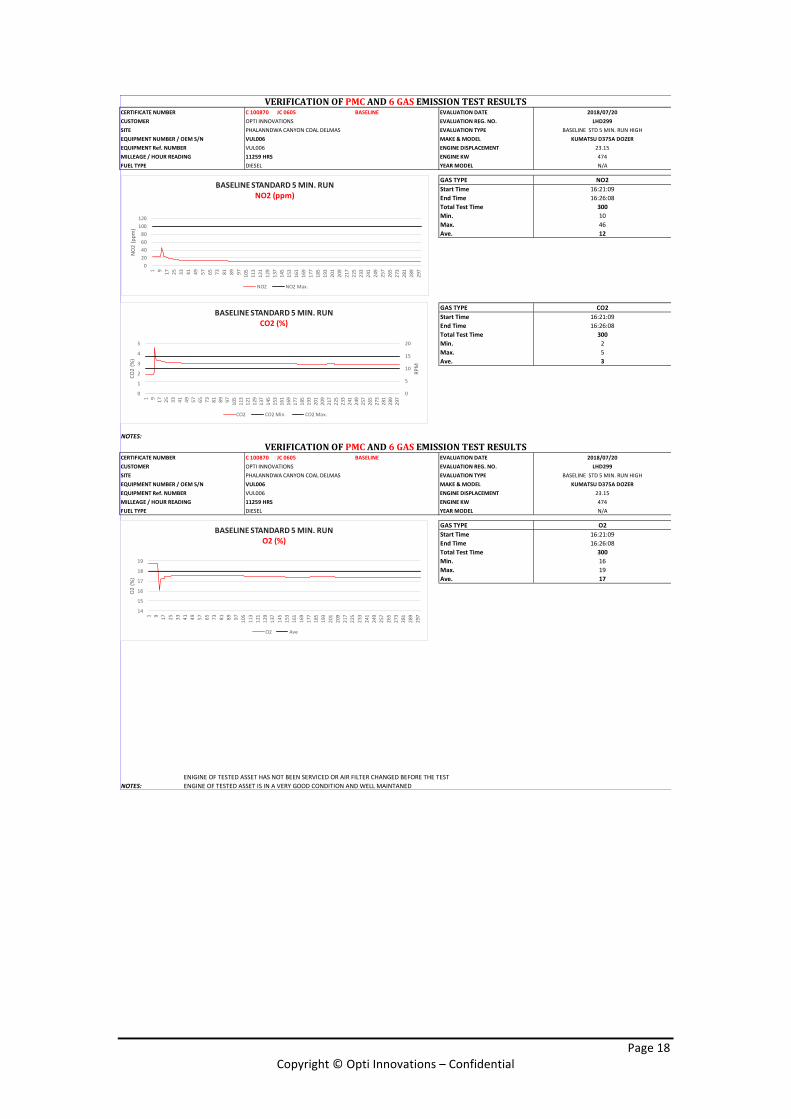
VERIFICATIONOFPMCAND6GASEMISSIONTESTRESULTSCERTIFICATENUMBER EVALUATIONDATE 2018/07/20CUSTOMER OPTIINNOVATIONS EVALUATIONREG.NO. LHD299
EQUIPMENTRef.NUMBER VUL006 ENGINEDISPLACEMENT 23.15MILLEAGE/HOURREADING 11259HRS ENGINEKW 474
SITE PHALANNDWACANYONCOALDELMAS EVALUATIONTYPE BASELINESTD5MIN.RUNHIGHEQUIPMENTNUMBER/OEMS/N VUL006 MAKE&MODEL KUMATSUD375ADOZER
StartTime 16:21:09EndTime 16:26:08TotalTestTime 300
FUELTYPE DIESEL YEARMODEL N/A
GASTYPE NO2
CO216:21:0916:26:08
30025
Min. 10Max. 46Ave. 12
SITE PHALANNDWACANYONCOALDELMAS EVALUATIONTYPE BASELINESTD5MIN.RUNHIGHEQUIPMENTNUMBER/OEMS/N VUL006 MAKE&MODEL KUMATSUD375ADOZER
3
VERIFICATIONOFPMCAND6GASEMISSIONTESTRESULTSCERTIFICATENUMBER EVALUATIONDATE 2018/07/20CUSTOMER OPTIINNOVATIONS EVALUATIONREG.NO. LHD299
FUELTYPE DIESEL YEARMODEL N/A
GASTYPE O2
EQUIPMENTRef.NUMBER VUL006 ENGINEDISPLACEMENT 23.15MILLEAGE/HOURREADING 11259HRS ENGINEKW 474
Min. 16Max. 19Ave. 17
StartTime 16:21:09EndTime 16:26:08TotalTestTime 300
020406080
100120
1 9 17 25 33 41 49 57 65 73 81 89 97 105
113
121
129
137
145
153
161
169
177
185
193
201
209
217
225
233
241
249
257
265
273
281
289
297
NO2(ppm
)
BASELINESTANDARD5MIN.RUNNO2(ppm)
NO2 NO2Max.
0
5
10
15
20
0
1
2
3
4
5
1 9 17 25 33 41 49 57 65 73 81 89 97 105
113
121
129
137
145
153
161
169
177
185
193
201
209
217
225
233
241
249
257
265
273
281
289
297
RPM
CO2(%)
BASELINESTANDARD5MIN.RUNCO2(%)
CO2 CO2Min. CO2Max.
14
15
16
17
18
19
1 9 17 25 33 41 49 57 65 73 81 89 97 105
113
121
129
137
145
153
161
169
177
185
193
201
209
217
225
233
241
249
257
265
273
281
289
297
O2(%)
BASELINESTANDARD5MIN.RUNO2(%)
O2 Ave
Page19
Copyright©OptiInnovations–Confidential
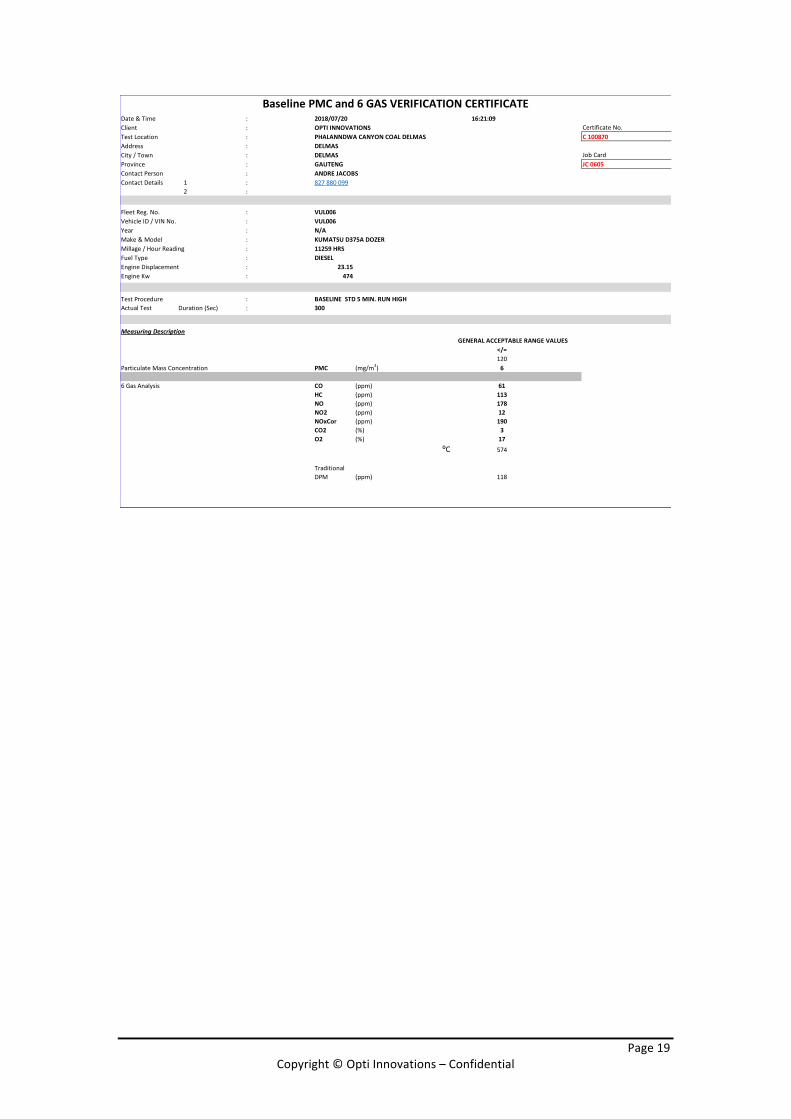
:: CertificateNo.: C100870:: JobCard: JC0605:
1 :2 :
: VUL006:: N/A: KUMATSUD375ADOZER: 11259HRS: DIESEL: 23.15: 474
:: 300
</=120
ParticulateMassConcentration PMC 6
6GasAnalysis CO 61HC 113NO 178NO2 12NOxCor 190CO2 3O2 17
⁰C 574
TraditionalDPM 118
Client OPTIINNOVATIONSTestLocation PHALANNDWACANYONCOALDELMASAddress DELMAS
BaselinePMCand6GASVERIFICATIONCERTIFICATEDate&Time 2018/07/20 16:21:09
ContactDetails 827880099
FleetReg.No.VehicleID/VINNo. VUL006
City/Town DELMASProvince GAUTENGContactPerson ANDREJACOBS
TestProcedure BASELINESTD5MIN.RUNHIGHActualTestDuration(Sec)
MeasuringDescription
(mg/m3)
YearMake&ModelMillage/HourReadingFuelTypeEngineDisplacementEngineKw
GENERALACCEPTABLERANGEVALUES
(%)
(ppm)(ppm)(ppm)(ppm)(ppm)(%)
(ppm)
Page20
Copyright©OptiInnovations–Confidential
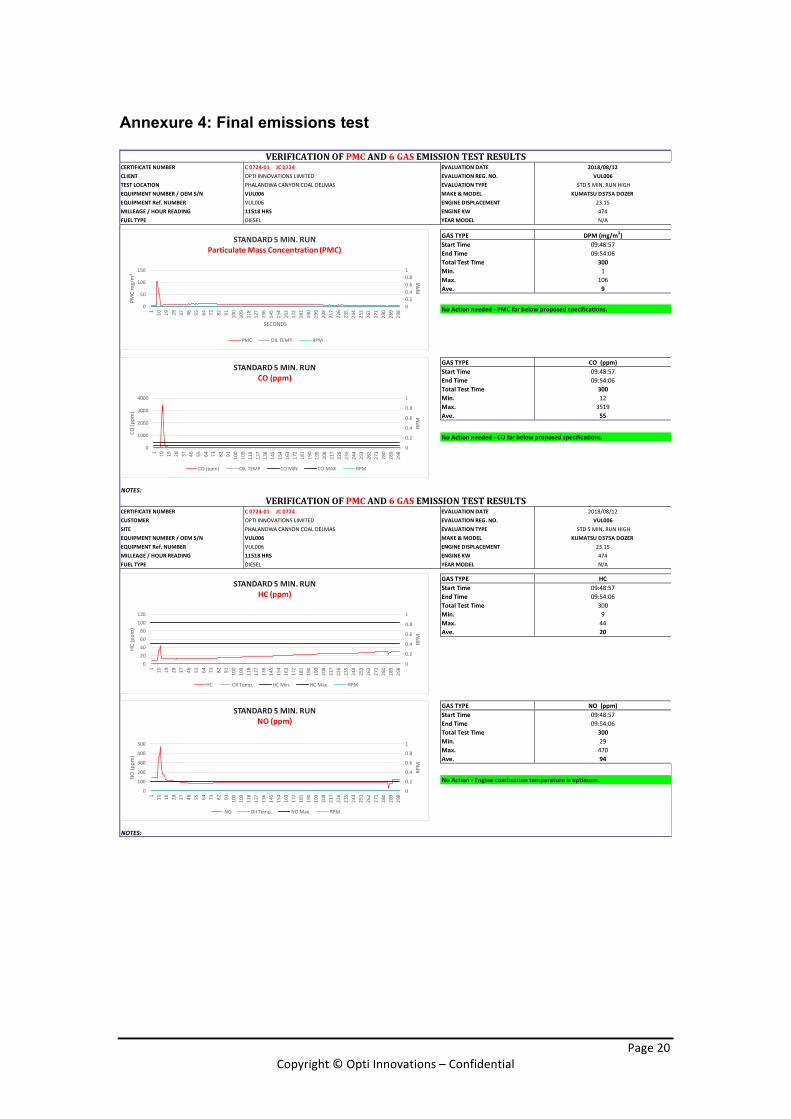
Annexure 4: Final emissions test
C0724-01 JC0724
NoActionneeded-PMCfarbelowproposedspecifications.
GASTYPEStartTimeEndTimeTotalTestTimeMin.Max.Ave.
NoActionneeded-COfarbelowproposedspecifications.
NOTES:
C0724-01 JC0724
GASTYPEStartTimeEndTimeTotalTestTimeMin.Max.Ave.
NoAction-Enginecombustiontemperatureisoptimum.
NOTES:
94
NO(ppm)09:48:5709:54:06
30029470
Min. 9Max. 44Ave. 20
StartTime 09:48:57EndTime 09:54:06TotalTestTime 300
FUELTYPE DIESEL YEARMODEL N/A
GASTYPE HC
EQUIPMENTRef.NUMBER VUL006 ENGINEDISPLACEMENT 23.15MILLEAGE/HOURREADING 11518HRS ENGINEKW 474
SITE PHALANDWACANYONCOALDELMAS EVALUATIONTYPE STD5MIN.RUNHIGHEQUIPMENTNUMBER/OEMS/N VUL006 MAKE&MODEL KUMATSUD375ADOZER
55
VERIFICATIONOFPMCAND6GASEMISSIONTESTRESULTSCERTIFICATENUMBER EVALUATIONDATE 2018/08/12CUSTOMER OPTIINNOVATIONSLIMITED EVALUATIONREG.NO. VUL006
CO(ppm)09:48:5709:54:06
300123519
Min. 1Max. 106Ave. 9
StartTime 09:48:57EndTime 09:54:06TotalTestTime 300
FUELTYPE DIESEL YEARMODEL N/A
GASTYPE DPM(mg/m3)
MILLEAGE/HOURREADING 11518HRS ENGINEKW 474
TESTLOCATION PHALANDWACANYONCOALDELMAS EVALUATIONTYPE STD5MIN.RUNHIGHEQUIPMENTNUMBER/OEMS/N VUL006 MAKE&MODEL KUMATSUD375ADOZER
VERIFICATIONOFPMCAND6GASEMISSIONTESTRESULTSCERTIFICATENUMBER EVALUATIONDATE 2018/08/12CLIENT OPTIINNOVATIONSLIMITED EVALUATIONREG.NO. VUL006
EQUIPMENTRef.NUMBER VUL006 ENGINEDISPLACEMENT 23.15
00.20.40.60.81
0
50
100
150
1 10 19 28 37 46 55 64 73 82 91 100
109
118
127
136
145
154
163
172
181
190
199
208
217
226
235
244
253
262
271
280
289
298
RPM
PMCmg/m
3
SECONDS
STANDARD5MIN.RUNParticulateMassConcentration(PMC)
PMC OILTEMP. RPM
0
0.2
0.4
0.6
0.8
1
0
1000
2000
3000
4000
1 10 19 28 37 46 55 64 73 82 91 100
109
118
127
136
145
154
163
172
181
190
199
208
217
226
235
244
253
262
271
280
289
298
RPM
CO(p
pm)
STANDARD5MIN.RUNCO(ppm)
CO(ppm) OILTEMP COMIN COMAX RPM
0
0.2
0.4
0.6
0.8
1
020406080
100120
1 10 19 28 37 46 55 64 73 82 91 100
109
118
127
136
145
154
163
172
181
190
199
208
217
226
235
244
253
262
271
280
289
298
RPM
HC(p
pm)
STANDARD5MIN.RUNHC(ppm)
HC OilTemp. HCMin. HCMax. RPM
0
0.2
0.4
0.6
0.8
1
0
100
200
300
400
500
1 10 19 28 37 46 55 64 73 82 91 100
109
118
127
136
145
154
163
172
181
190
199
208
217
226
235
244
253
262
271
280
289
298
RPM
NO(p
pm)
STANDARD5MIN.RUNNO(ppm)
NO OilTemp. NOMax. RPM
Page21
Copyright©OptiInnovations–Confidential
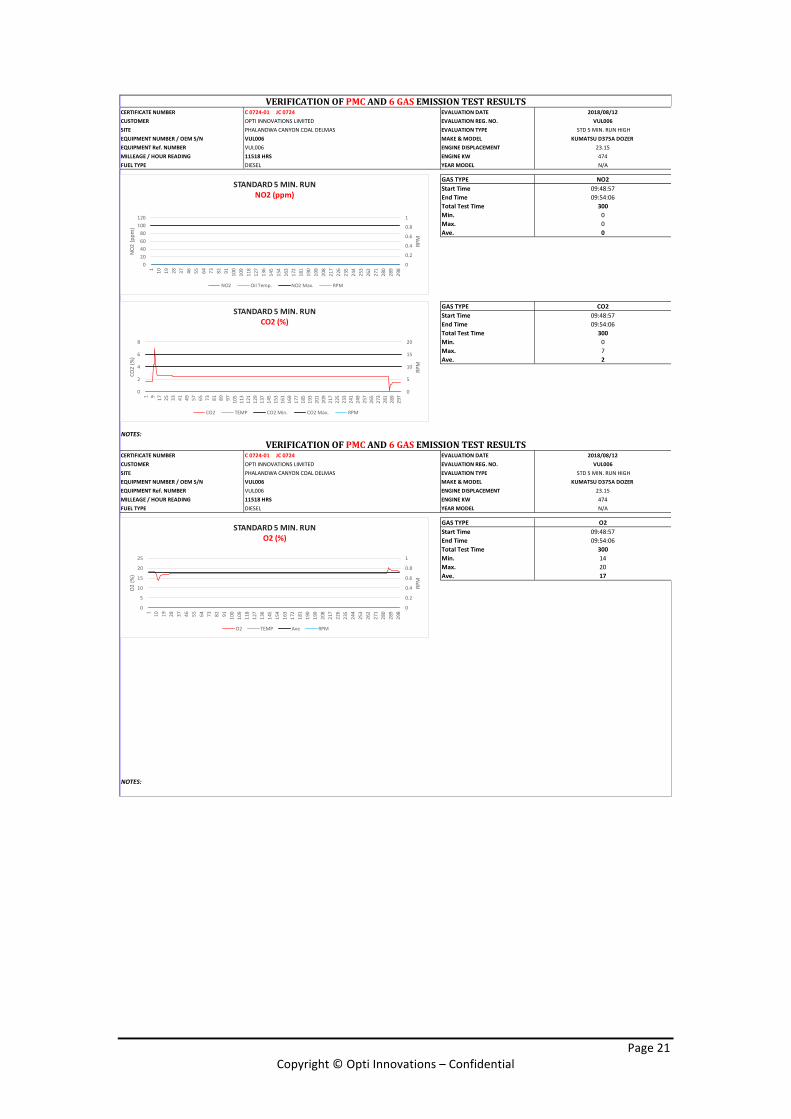
C0724-01 JC0724
GASTYPEStartTimeEndTimeTotalTestTimeMin.Max.Ave.
NOTES:
C0724-01 JC0724
NOTES:
Min. 14Max. 20Ave. 17
StartTime 09:48:57EndTime 09:54:06TotalTestTime 300
FUELTYPE DIESEL YEARMODEL N/A
GASTYPE O2
EQUIPMENTRef.NUMBER VUL006 ENGINEDISPLACEMENT 23.15MILLEAGE/HOURREADING 11518HRS ENGINEKW 474
SITE PHALANDWACANYONCOALDELMAS EVALUATIONTYPE STD5MIN.RUNHIGHEQUIPMENTNUMBER/OEMS/N VUL006 MAKE&MODEL KUMATSUD375ADOZER
2
VERIFICATIONOFPMCAND6GASEMISSIONTESTRESULTSCERTIFICATENUMBER EVALUATIONDATE 2018/08/12CUSTOMER OPTIINNOVATIONSLIMITED EVALUATIONREG.NO. VUL006
CO209:48:5709:54:06
30007
Min. 0Max. 0Ave. 0
StartTime 09:48:57EndTime 09:54:06TotalTestTime 300
FUELTYPE DIESEL YEARMODEL N/A
GASTYPE NO2
EQUIPMENTRef.NUMBER VUL006 ENGINEDISPLACEMENT 23.15MILLEAGE/HOURREADING 11518HRS ENGINEKW 474
SITE PHALANDWACANYONCOALDELMAS EVALUATIONTYPE STD5MIN.RUNHIGHEQUIPMENTNUMBER/OEMS/N VUL006 MAKE&MODEL KUMATSUD375ADOZER
VERIFICATIONOFPMCAND6GASEMISSIONTESTRESULTSCERTIFICATENUMBER EVALUATIONDATE 2018/08/12CUSTOMER OPTIINNOVATIONSLIMITED EVALUATIONREG.NO. VUL006
0
0.2
0.4
0.6
0.8
1
020406080
100120
1 10 19 28 37 46 55 64 73 82 91 100
109
118
127
136
145
154
163
172
181
190
199
208
217
226
235
244
253
262
271
280
289
298
RPM
NO2(ppm
)
STANDARD5MIN.RUNNO2(ppm)
NO2 OilTemp. NO2Max. RPM
0
5
10
15
20
0
2
4
6
8
1 9 17 25 33 41 49 57 65 73 81 89 97 105
113
121
129
137
145
153
161
169
177
185
193
201
209
217
225
233
241
249
257
265
273
281
289
297
RPM
CO2(%)
STANDARD5MIN.RUNCO2(%)
CO2 TEMP CO2Min. CO2Max. RPM
0
0.2
0.4
0.6
0.8
1
0
5
10
15
20
25
1 10 19 28 37 46 55 64 73 82 91 100
109
118
127
136
145
154
163
172
181
190
199
208
217
226
235
244
253
262
271
280
289
298
RPM
O2(%)
STANDARD5MIN.RUNO2(%)
O2 TEMP Ave RPM
Page22
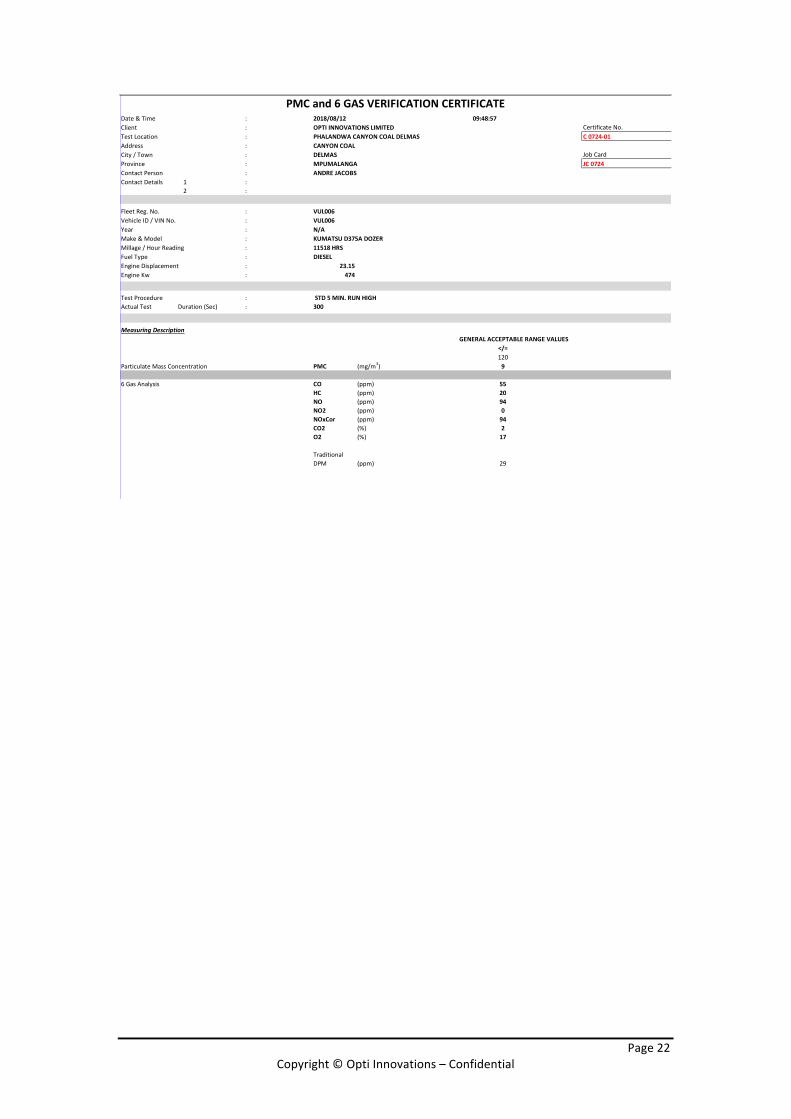
Copyright©OptiInnovations–Confidential
:: CertificateNo.: C0724-01:: JobCard: JC0724:
1 :2 :
: VUL006:: N/A: KUMATSUD375ADOZER: 11518HRS: DIESEL: 23.15: 474
:: 300
</=120
ParticulateMassConcentration PMC 9
6GasAnalysis CO 55HC 20NO 94NO2 0NOxCor 94CO2 2O2 17
TraditionalDPM 29
(%)
(ppm)(ppm)(ppm)(ppm)(ppm)(%)
(ppm)
TestProcedure STD5MIN.RUNHIGHActualTestDuration(Sec)
MeasuringDescription
(mg/m3)
YearMake&ModelMillage/HourReadingFuelTypeEngineDisplacementEngineKw
GENERALACCEPTABLERANGEVALUES
ContactDetails
FleetReg.No.VehicleID/VINNo. VUL006
City/Town DELMASProvince MPUMALANGAContactPerson ANDREJACOBS
Client OPTIINNOVATIONSLIMITEDTestLocation PHALANDWACANYONCOALDELMASAddress CANYONCOAL
PMCand6GASVERIFICATIONCERTIFICATEDate&Time 2018/08/12 09:48:57