knowledge-based support systems for long range planning€¦ · long range planning is the process...
TRANSCRIPT

Knowledge-Based Support Systems for Long Range Planning
Donald W. Kosy and Vasant Dhar
CMU-RI-TR-83-21
The Robotics Institute Carnegie-Mellon University
Pittsburgh, Pennsylvania 15213
13 December 1983
Copyright @ 1983 Carnegie-Mellon University
This research was sponsored by the Eastern Electronics Systems Company.


i
Table of Contents 1. INTRODUCTION 2. LONG RANGE PLANNING PRACTICES AT MARYSVILLE
2.1 Purposes of Long Range Planning 2.2 The Planning Process at Marysville
2.2.1 Context 2.2.2 The Plant-Level Plan 2.2.3 Creating the Plan 2.2.4 Resource Pian Rollup and Review 2.2.5Summary
2.3 Problems with Planning 3. CURRENT SUPPORT SYSTEMS
3.1 Decision Support Systems 3.2 Functionality 3.3 User Interface
4.1 System Architecture 4. KNOWLEDGE-BASED SUPPORT SYSTEMS
4.1.1 The Knowledge Base 4.1.2 The Inference Engine 4.1.3 The User Interface
4.2.1 SRL 4.2.2 ROMULUS 4.2.3 REMUS
4.2 ROME: A Rule-Oriented Modeling Environment
4.3 Summary 1. EXHIBITS BIBLIOGRAPHY
1 2 2 3 3 4 5
10 14 14 17 17 17 19
21 21 21 23 24 27 27 28 30 31 33 39


ii
List of Figures
Figure 2- 1 : Flow of Responsibility in Creating Plans Figure 2-2: Creating a Program Resource Plan Figure 2-3: Resource Plan Review Figure 3- 1 : Current Decision Support System Architecture Figure 4- 1 : A Knowledge-Based Decision Support System Architecture
6 8
10 19 22


iii
List of Exhibits Exhibit 1: Outline of the Text Portion of a Plan Exhibit 2: Outline of a Resource Plan Exhibit 3: Example of a Plant Goal Exhibit 4: Example of Plant Strategy, Tactics, and Metrics Exhibit 5: Types of Analyses Called for in the FY83 Request Exhibit ti: The Volume Spending Portion of a Resource Plan
33 34 35 36 37 38


Abstract
Long range planning is the process by which an organization assesses its h ture environment and develops
specific plans of action to respond to, or change, that environment to achieve its goals. This report presents
the results of a study of long range planning practices at one plant of a large US. computer firm, focusing on
current and potential decision support systems (DDSs) for the quantitative aspects of the planning process.
While it appears that the clerical tasks in the process can be computerized using current DSS technology, this
technology does not help managers evaluate the credibility or quality of the plans made. An architecture is
described for a system incorporating a much richer store of knowledge about planning variables which would
allow the system itself to validate, explain, and justify its results. A concrete realization of such a system,
called ROME, has becn designed and is currently under development. Design goals for ROME are presented
and potential uses of the system are illustrated.

1
1 . IN-PRODUCTION
This report presents the results of a study of formal long range planning practices at Eastern Electronic Systems’ Marysville manufacturing facility conducted by a group from Carnegie-Mellon University’s Robotics Institute during the summer of 1982. Eastern Electronic Systems (EESCO)’ is a large U.S. company that produces a wide variety of computer equipment, peripherals, and systems. The Marysville plant (MV) is responsible for manufacturing the largest systems in EESCO’s product line.
The purpose of the study was threefold: (1) to lay out and analyze the current methods of long range planning at MV, (2) to examine the current level of computer support for planning, and (3) to hypothesize and discuss advanced, knowledge-based systems that could help planners and planning managers to do their jobs more efficiently and effectively. Accordingly, the remainder of this report is divided into three major sections. Section 2 describes the process and products of long range planning at Marysville as they exist today- Section 3 discusses current computer-based support systems. Section 4 outlines the major areas in which knowledge-based support seems feasible and presents the conceptual design of a system whose cornponents would provide such assistance. It is concluded that‘a knowledge-based system could make a significant contribution to solving some of the generic problems that currently exist in the planning process.
‘Eastern Electronic Systems, EESCO and Marysville are pseudonyms for the organizations that were the subjects of this study.
2
2. LONG RANGE PLANNING PRACTICES A T MARYSVILLE
This section is divided into three parts. First, a general description of the purpose and components of long range planning (LRP) is presented. This is followed by a description of the LRP process at Marysville and the results, both formal and informal, it produces. We conclude with a discussion of some of the problems that have been encountered with the process and the results.
2.1 Purposes of Long Range Planning
Lcng range planning may be viewed as a systematic attempt to assess the future environment within which an organization must operate coupled with the development of specific plans of action to be taken to respond to, or change, that environment to achieve organizational goals. Plans may be made at all levels in an organization, ranging from aggregate plans for the company as whole down to individual plans for each suborganization within it. "Long range" plans are those which extend at least five years into the future beyond the current year.
Six major components of long range planning2 may be identified:
1, Forecasting: the initial assessment of environmental factors external to an organization which serve as input to the planning process. The most common forecast needed is one that gives the number and types of products to be sold in future years. For a manufacturing organization like Marysville, the sales forecast is translated into a projected shipment schedule (called the "systems build" schedule or "master schedule" at Marysville) covering the years in the plan. Other important forecasts are those for future salary levels, utility rates, inflation factors, labor market conditions, and so on. These forecasts are taken as working assumptions for the rest of the planning exercise.
2. Targeting: establishing specific goals, time frames for achieving them, and plans for accomplishing them. In general, top management sets forth goals for the firm as a whole, based on the issues of greatest concern to them, which provide a basic direction for the rest of the planning process. These goals define in broad terms the kinds of results the process should yield. Examples of goals include improvements in efficiency (e.g., better asset utilization, increased productivity), and improvements in effectiveness (e.g., better customer service, higher product quality). A large fraction of the planning effort within a suborganization is then devoted to decomposing higher level goals into sets of subgoals that apply to that suborganization, devising plans to accomplish the subgoals, and defining visible, objective, and preferably quantitative milestones by which to measure progress. At Marysville, these results are sometimes called "strategies," "tactics" and "metrics," respectively.
3. Estimating Future Resource Requirements: a process combining compuiation and judgment to yield the amounts and types of resources that will be needed at various points in time for the organization to meet the sales forecast and achieve its targeted goals. The major resources of a manufacturing organization, for example, include personnel, floor space, capital equipment, and
'adapted from (Eliassen, 1975)

3
expense funds. Estimates of future requirements are used both for allocating resources currently held and for making decisions on acquiring new ones. They are also used to project anticipated progress toward meeting efficiency goals.
4. Coordination: establishing communication. agreement and cooperation among various suborganizations which depend on each other to achieve a common goal. The most common sort of interdependency among suborganizations is the producer/consumer relationship. Agreements are generally formalized as commitments by one suborganization to produce or perform in a way that satisfies the needs of another suborganization. A highly useful, though indirect. consequence of trying to achieve coordination is that various problems faced by suborganizations are made visible to senior managers, providing them with a better understanding of the conditions and assumptions upon which the resulting formal plans are based.
5. Contingency Planning: enhancing the flexibility of an organization by anticipating alternative future scenarios. The idea is to prepare, or be capable of preparing, a set of alternate plans, each contingent on different possible developments within the external environment.
6. Control: using a plan as a reference point to evaluate actual performance by Comparing it to that planned.
2.2 The Planning Process at Marysville
2.2.1 Context
The formal LRP process is initiated each year by a request for a plan which is issued to suborganizations by their parent organization. For Marysville Manufacturing, the request comes from the Big Systems Group (BSG) which, in turn, is responding to a request from the Vice President for Manufacturing. The request outlines the content of a document to be produced - _ the formal long range plan - - and sets out a schedule of tasks to be’accomplished in developing the plan. Organizational goals to be targeted are specified and, when higher management has already decided on strategies for achieving some of them, these strategies are presented as well. Strategies developed at the BSG level and handed down to Marysville are called “superset strategies”. Accompanying the request are definitions of terms, preparation guidelines, and various data, such as forecasts of financial factors, the build schedule, depreciation tables, etc., to be used in the planning exercise.
Requests are not always the same from one year to the next. The requests Marysville has received have differed in several respects. Formal planning procedures at the plant level were introduced fairly recently within EESCO (1980) and the requests in earlier years were aimed as much at introducing and developing those procedures as at obtaining specific plans. With respect to the planning document, neither the exact content nor the format was predetermined. This allowed plant-level planners to determine their own structure for planning information and thereby accommodate their own local needs as well as those of higher management.
For one thing, they have differed in intent.
As experience with formal planning has accumulated, requests have become more specific and

4
derailed. In the beginning, requests were fairly vague and it was up to the planning manager and piant staff to interpre! them and to seek out (or create) definitions, guidelines, forecasts, and schedules as they came to be needed during the process. A good deal of time was spent resolving terminological confusion, searching for sources of data, reconciling differences in similar data obtained frorn differen: sources, and so on. In contrast, the FY83 request is quite specific about most items. The acconipanying material includes an extensive list of definitions, and more than 50 pages giving financial data, specific questions to be answered, formats to be used, etc. For new items, Le. those related to issues not stressed in previous planning cycles, questions are phrased in general terms with suggestions for how planners might wish to respond, as in previous years.
Finally, requests in different years have emphasized different organizational goals. In FY81 and FY82, for exarnple, efficiency goals were dominant and a substantial revision of the manufacturing process was called for as a way of meeting them. Hence plans had to be made to convert plants to the new process. The FY83 request asslimes these plans are being implemented and shifts the focus to broader concerns, such as the relative strength of EESCO's products and processes compared to its competitors, and how to manage the workforce in the face of rapidly changing future manpower requirements.
While the basic framework of the request will probably remain the same in coming years, it is likely to change incrementally in detail each year along the lines just described. To provide a concrete basis for the following discussion, we will use the FY83 planning context throughout unless otherwise mentioned .
2.2.2 The Plant-Level Plan
The FY83 request to Marysville specifies the content of the planning document to be produced and, in many cases, the formats in which various types of information are to be presented. Roughly a dozen types of analyses are called for to support and justify the elements of the plan the plant will submit. Group-level goals and strategies are included but, since both are essentially the same as for the FY82 planning cycle, neither is described in much detail. The schedule defines 12 milestones in the planning process and specifies an overall preparation time of six months.
The request calls for a document consisting of seven sections. The first six are primarily expository and are referred to collectively as the "text" portion of the plan. The seventh contains numerical projections of output and inventory levels, resource requirements, and values of various performance indicators for the years covered by the plan. It is called the "resource plan". Outlines of these two parts of the document are shown in Exhibits 1 and 2 in the Appendix.
The Text. The heart of the text portion of the plan comprises sections 1V and V on goals and strategies. These sections represent to higher management the level of performance Marysville intends to strive for and specific actions it plans to take. Thus they express what the plant staff believes is achievable and promise what will be achieved. Plant-level goals are expected to at least equal group level goals but the plant staff is free to define more aggressive goals if they believe the plant can reach them. An' example of a goal statement from the plan is shown in Exhibit 3 and a strategy is shown in Exhibit 4. There are 8 such goals and 28 strategies.
5
The text also contains the results of the analyses that have been requested. Some of the types of information desired for the FY83 plan are listed in Exhibit 5. In inost cases, these results will appear in section IV and V as support for goals and strategies. When some topic is of special concern to top management, however, it may be broken out for treatment in a separate section, as is the case for competitive positioning in the FY83 plan.
The Resource Plan. The particulars of the resource plan are defined at the BSG level and are formalized in a computer program which takes inputs from the plants and computes totals and performance measures. This program seems to have no name but we will refer to it as "ROLLUP" since the aggregation function it performs is called "rolling up" a plan at Marysville. The format of the resource plan, as exemplified by the Volume Spending section, is shown in Exhibit 6. For the whole plan, there are 64 input lines, each of which contains entries for seven years, making 448 values that the plant must supply. From these, the program computes entries for 47 lines, or 329 values in all.
Line items in the resource plan can be viewed as "control parameters" that BSG wishes to use to monitor the anticipated performance of its plants. There are four sorts of parameters: output levels, resource levels, resource requirements, and performance measures. Output levels include the dollar volume of goods to be produced and dollar value of inventory to be accumulated. Resource levels are amounts of resources the plants expects to have available, such as the amount of floor space MV expects to own or be leasing. Resource requirements are projections of manufacturing needs, expressed either as dollars of expense, e.g. spending for materials, or in the relevant resource units, e.g. square feet of floor space required for a manufacturing process. Performance measures are mainly ratios, such as output/person, outputlsq. ft., and so on.
In many firms, long range planning is viewed as an extension of the budgeting process. Budgeted amounts for operating expenses and capital investments are taken as the first year of the plan and approximate allocations are made for subsequent years, out to the planning horizon. At EESCO, however, long range planning has much greater scope than budgeting and includes consideration of many more factors than are included in the budget. Projections of floor space requirements and inventory levels, for example, are part of the long range plan but not part of the budget. While some information similar to that in the budget also appears in the plan, planning and budgeting at EESCO to date have been separate activities, with different purposes, performed at different times, and directed by different individuals.
2.2.3 Creating the Plan
The Marysville planning manager delegates the preparation of the different parts of the plan to plant functional managers and to manufacturing program managers (MPMs). Functional managers are generally responsible for developing the strategies, tactics, and metrics associated with goals and MPMs are responsible for making resource plans for their programs. The planning manager himself is responsible for the Visions, Differences, Competitive Positioning, and Messages sections of the text. He also develops resource plans for undefined products that he expects will impact the plant within the planning window but won't be shipped until after the planning horizon.
As plans are made and resource figures are developed, they are reviewed and critiqued by the planning manager and revised as necessary by their authors. When all parts of the plan have been

6
completed, the planning manager assembles them together in a plant plan and submits it to BSG for review. The overall flow of responsibility in this process is shown in Figure 2-1.
revisions needed
revisions needed
revisions needed
text
Figure 2- 1 : Flow of Responsibility in Creating Plans
Creatincl the Text. The text portion of the plan is a product of creative negotiation, analysis, and problem-solving on the part of the functional managers. In concert with group staff, they must decide on what levels of performance Marysville can achieve in future years and how group superset strategies should be adapted to the Marysville plant to achieve that performance. They must also analyze the problem that gave rise to the goal and/or strategy and propose specific tactics (actions) to be taken to eliminate the problem.
Each functional manager is responsible for developing one or more strategies. When tactics and metrics have been worked out for a strategy, they are presented at planning meetings for comment

7
and evaluation. Planning meetings are held weekly as a vehicle for communicating planning information, motivating planning tasks, and coordinating results. An estimated 15 man days of effort goes into the preparation of a typical Marysville strategy.
It is not necessary to totally regenerate the text portion of a plan each year, as long as goals and strategies remain relatively constant from one year to the next. Since the strategies are designed to be implemented over a period of years, any particular strategy will continue to appear in the planning document until either its goals have been accomplished or it becomes obsolete and is abandoned. The main changes in the text stem from (1) requests for new types of information from BSG; (2) incremental changes to tactics and metrics as experience is accumulated; (3) adoption of new strategies; and (4) adoption of new goals. Of course, other elements of the text can change as well, but this would occur only rarely, such as when a plant is given a completely new role within the organization.
Creatins the Resource Plan. A plant resource plan is created by first creating a resource plan for each manufacturing program3 that will be producing systems within the planning window. The MPM for each program assigns this task to a team of functional specialists - - manufacturing engineers, materials engineers, financial analysts, etc. - - associated with the program. Each specialist is charged with developing estimates and projections of numerical values associated with his speciality. The team leader is responsible for combining these results to produce the actual resource plan line-item values. The overall process is depicted in Figure 2-2.
As an example of how the process works, consider the derivation of the Production Spending line, which gives estimated gross labor costs for each year in the plan. These estimates depend on the nature of the product to be produced, the manufacturing process to be used, and forecasted environmental factors. The product defines a configuration of parts - - cabinets, backplanes, cables, modules, and so on. The process defines a sequence of manufacturing steps by which parts are assembled into that configuration and tested. Similarly, each part defines a configuration of subparts and there is a manufacturing process for assembling and testing that configuration.
For each step in each process, manufacturing engineers develop estimates of the number of labor hours it requires. By summing over steps, the labor hours for a particular process can be calculated. Adding this amount to the sum of the labor hours needed to manufacture the parts that are input to the process gives the total labor hours needed to manufacture the unit the process produces. This quantity is called the "standard hours" for the unit. Combining labor hours for parts and processes in this way eventually yields the standard hours for a complete system.
Multiplying standard hours for a system by a burdened labor rate gives the gross labor cost for the system. Since the build schedule specifies the number of systems to be built for each year in the plan, multiplying the standard hours per system times the labor rate forecasted for that year times the number of systems to be built yields the estimated gross cost of labor for each year. These figures are then added to incremental costs incurred b y the program, such as the projected cost of repair work to be done, and the total is entered on the Production Spending line of the program resource plan.
3A manufacturing program is the set of activities needed to manufacture a particular type of computer system in EESCOs product line. Two of the systems in this line are called Hemlock and Redwood.

8
product definition
process definition
forecasts
build schedule
1 task assionments
estimates
I I projections
revisions needed
Program Resource
Plan
Rollup
Fiqure 2-2: Creating a Program Resource Plan
Generating values to fill out most other lines in the plan involves similar decoinposition/recomposition procedures. Material Spending, for example, is derived by summing up the cost of materials for all the component parts, using forecasted materials prices for each year. Space requirements for a program are a function of the space requirements for each of the manufacturing steps. Not all lines are determined this way, however. The Manufacturing Projects line, for example, which gives the estimated cost of future development projects, is not directly related to components or manufacturing steps.
Strategies and tactics can affect the resource plan. For example, a cost-reduction tactic was
9
adopted with the FY82 plan to assign some fraction of Redwood module assembly to offshore plants. Hence, some fraction of Redwood production spending will not occur at Marysville and some receipts to Marysville inventory should be entered instead to account for this shift. The particular fraction to be assigned for each year was chosen judgmentally. Neither the tactic nor the judgment appear in the formal planning document.
Most of the derivation of the resource plan is currently done manually. There is no computer database of forecast factors, assumptions made, or intermediate planning results. Except for ROLLUP, there has been no use of computers in performing the computations. However, two software systems are being introduced which should help in putting a resource plan together. One, the CE system (for Cost Estimator), is designed to maintain a bill of materials (or BOM) which is a hierarchical description of a machine in terms of parts, subparts, subsubparts, etc. Information about labor and materials costs can be attached to the BOM and reported at any level. The other, called EPS (named for the company that markets it), is a row-and-column calculator, or "electronic spreadsheet", similar to Visicalc (Beil, 1983). It allows users to define tabular reports, perform arithmetic calculations to compute row and column values, and to generate instances of reports from input data. The planning manager is encouraging the use of both of these tools.
The information needed for the plan comes from sources in all parts of the plant organization. The entire plant staff is involved in the planning process to some extent. For example, in estimating floor space requirements, the Manufacturing Engineering department must supply information on space needed for the manufacturing process, the Materials departments must specify stock and inventory space needs, and both of these depend on the characteristics of the products to be produced as defined within the various programs. Furthermore, when meeting a goal depends on some group external to the plant, such as the offshore plants that will be supplying Redwood modules, the planning process will also involve that group to negotiate and commit to the necessary performance.
In contrast to the incremental changes made to the text portion of the plan, the resource plan has to be entirely regenerated each year. In fact, the resource plan is often regenerated several times during the planning process itself. The reasons for this are many. During the lifetime of a product, the build schedule is typically changed many times and financial forecasts may be revised as well. When a unit enters production, estimates of manufacturing parameters and constants may be revised to reflect production experience. As a product matures, there may be design changes or enhancements which were not foreseen earlier. I f new technologies become available, the definition of the manufacturing process may be changed to take advantage of them. To date, the MPM's have not attempted to predict such changes in advance. But, since any one of them affects nearly every line in the plan, the whole plan must be regenerated as changes are realized.
Although a complete plant resource plan contains more than 700 numbers, it should be clear from the above that these constitute only a small fraction of the total data developed during the planning processes. Behind every plant plan, for instance, there is the set of program plans that it summarizes. Behind every program plan is the considerably larger volume of data used in its derivation, e.g. standard-hours tables, assumed efficiency factors, production process definitions, and the like, which are not included in the final formal document. These lower level numbers are developed by individual engineers and analysts for their own use in supplying the requested information and usually are maintained privately by them. Thus, a resource plan represents only the "tip of the planning iceberg" and most of the supporting data and documentation remains with those who produced it.
10
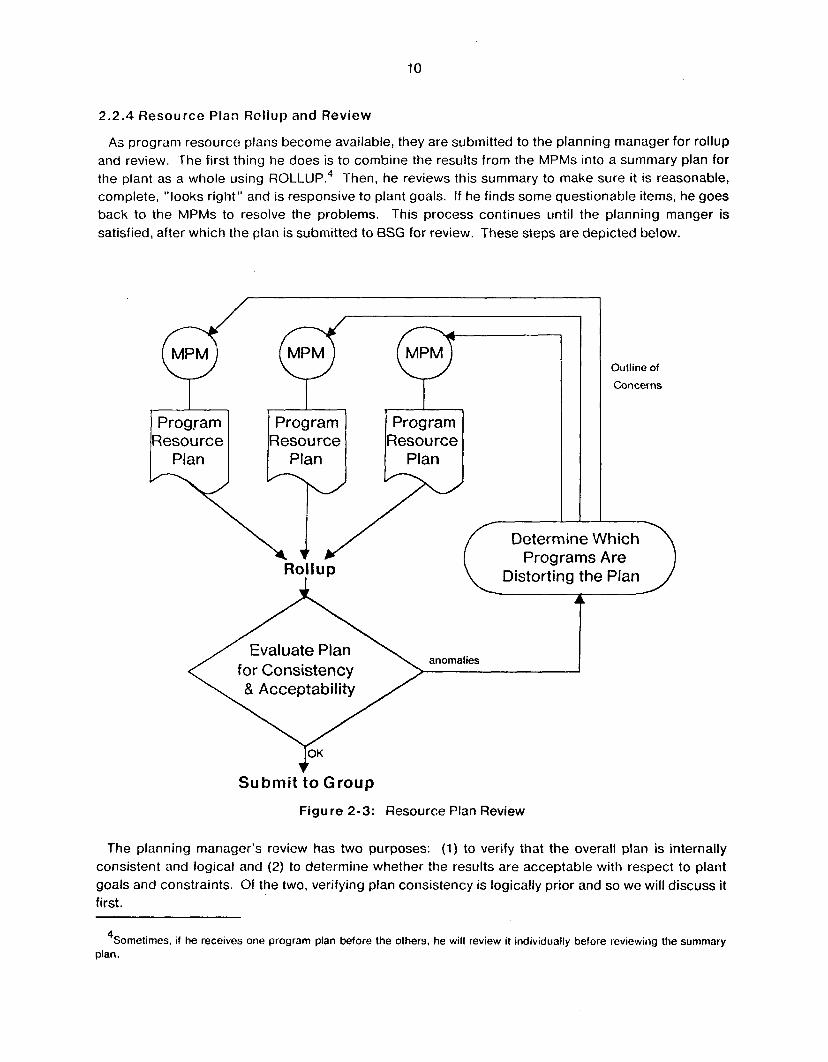
2.2.4 Resource Plan Rollup and Review
As program resource plans become available, they are submitted to the planning manager for rollup and review. The first thing he does is to combine the results from the MPMs into a summary plan for the plant as a whole using ROLLUP.4 Then, he reviews this summary to make sure it is reasonable, complete, "looks right" and is responsive to plant goals. If he finds some questionable items, he goes back to the M P M s to resolve the problems. This process continues until the planning manger is satisfied, after which the plan is submitted to BSG for review. These steps are depicted below.
Determine Which
Distorting the Plan
Evaluate Plan for Consistency
p" Submit to Group
Figure 2-3: Resource Plan Review
The planning manager's review has two purposes: (1) to verify that the overall plan is internally consistent and logical and (2) to determine whether the results are acceptable with respect to plant goals and constraints. Of the two, verifying plan consistency is logically prior and so we will discuss it first.
Outline of
Concerns
'Sometimes, if he receives one program plan before the others, he will review it individually before reviewing the summary plan.
11
Internal consistency. As pointed out previously, program plans are constructed nianually and include data, assumptions and judgments from numeroils sources within the plant organization. Hence, as the numbers are combined together, there are many places where conflicting assumptions, differing judgments, miscommunication, misunderstanding, and ordinary human error can affect the results. From the planning manager's point of view, it is therefore necessary to validate the results.
To begin with, the manager's concerns are directed at some macro control parameters that are useful in identifying discrepancies. These include the totals for people, space, spending, capital, and components thereof. The questions he asks himself are of the following forms:
0 Do projected values fall within historical ranges?
0 Are observed trends in the macro parameters approximately matched by trends in functionally related parameters?
0 Do the trends have underlying causal explanations?
Let us consider some examples. Suppose the planning manager observes a value for projected plant population in the first year of the plan that is significantly lower than the current size of the workforce. This might be due to a major change in plant activity or to an error in the projection. Since he knows the build schedule and plant charter, the planning manager can tell whether a change in activity is expected. If no such change is apparent, he might then consider the components of the total population, e.g. the population projections for each program, projections of indirect and direct labor, labor requirements for new product introduction and manufacturing projects. etc., to attempt to isolate the components that account for the low total. Additionally, he might ask about the factors from which population is derived, e.g. the standard hours projections and labor rates, and compare them to norm values to see if there is a discrepancy.
Now suppose the planning manager sees a decrease in projected population over some period. To determine whether this is reasonable, he might look for a decrease in projected plant output over the same period, based on the assumption that less labor is needed to produce a smaller volume of output. If output were not falling, he might check plant goals for that period to see whether productivity increases had been planned. If so, and the magnitude of the increase were large enough, this could justify the population decrease. Similarly, i f he sees a constant or increasing population, he would try to verify that this is consistent with output and productivity trends.
For space requirements, the planning manager will raise a question i f any value is either much higher or much lower than'the amount of floor space required in the past to produce a similar volume of output. With respect to trends, he normally expects space requirements and plant population to move in the same direction. This is based on the simple fact that people need space to work in. If the projections do not follow this pattern, he will ask for an explanation. His concern may be resolved, however, i f additional considerations are brought out. For example, space requirements should go up with an expanding workforce unless additional shifts are being added.
In the spending area, the planning manager expects output value to be an increasing function of labor costs and materials spending - - the more one produces, the more labor and materials one has to use. Hence, he would consider it anomalous i f materials spending increased and output didn't, or
12
vice versa. And, since he knows that the cost of a unit is made up of about 70-8070 materials, he would expect changes in materials spending and output to be roughly proportional. If this pattern did not appear, he would again seek an explanation. In this case, such an explanation might be that a change in design was projected in later years of the plan that would make the product more material intensive.
With respect to capital, the planning manager expects investments in one year to correlate with increases in output or increases in productivity in subsequent years. If this pattern is violated, he will ask for an explanation of what the proposed investment was intended to accomplish. Moreover, he expects the level of investment to be consistent with known prices for equipment that is likely to be bought. If the numbers given are too high or too low, this would be questionable.
Finally, the planning manager expects various performance metrics to be consistent with industry norms, or with past values for the plant. So, if production spending/person, output/sq ft, or some other ratio were significantly different than the norm in any year, this would lead him to investigate the components of the ratio to find the reason for its deviance.
In sum, plan validation involves determining whether the results accord with the planning manager's mental model of how the firm operates. Because of the detail and diversity of information in a plan, the validation process can be highly complex. However, there seem to be some key line items that are inputs to a top layer of validation criteria. If these are satisfied, further examination may not occur. Otherwise, additional conditions to consider are introduced incrementally as validation proceeds through different levels of detail.
Accentability. Goals play an extremely important role in the plan review process. First of all, the goals that come down from BSG set thresholds on what will be considered acceptable performance when the plan is reviewed at the group level. When these goals are explicit and quantitative, they can readily be used to check the values in the plan. It is easy to tell, for example, whether cost projections for the plant are in line with group goals for costs. Implicit and/or qualitative goals may also be used, but the planning manager may then have to intermet the numbers given and make a judgment as to whether what they imply satisfies the goal. So, for instance. a fluctuation in the projected plant population numbers over time might be interpreted as indicating an "unstable workforce". If there were a goal to maintain a stable workforce, this fluctuation would contravene the goal and hence the plan should be rejected as unacceptable. Without known goals, it would be impossible for the planning manager to tell whether his plant's projected performance will be held to be adequate or inadequate.
Second, goals serve as standards for identifying variances in the plan. One factor that distinguishes "acceptable" trends in the resource plan from "inconsistencies" is knowledge of how resources "should be" allocated. For example, asset utilization metrics are alfected by inventory strategy. If there were a plan to reduce total manufacturing time per unit, this would imply lower in-process inventory levels and hence higher asset utilization (output/assets). Thus, the appearance of increasing asset utilization figures on a resource plan should be seen as an acceptable trend in this case, consistent with the planned change in manufacturing process.
In using performance ratios to evaluate a plan, the planning manager has to realize that numbers

13
which appear to be out of line with respect to group goals may not necessarily be indicative of poor performance. Rather, they may reflect corporate or group strategies that necessitate certain conditions at the plant level. For example, one of Marysville's roles in the group is to be a start-up plant for new large systems manufacturing. Hence, it has to employ a relatively large proportion of engineers and other indirect labor personnel compared to other plants. Evaluation of Marysville based on efficiency-oriented metrics such as output per person will therefore have to be interpreted in light of this role. In other words, the presence of a "high" or "low" metric may not necessarily indicate a high or low contribution to overall group performance. We have observed that the planning manager never uses performance ratios in an unconditional manner for assessing plan acceptability. Rather, his evaluation is invariably qualified by the specific contingencies that exist at the time of evaluation.
Comparing a plan with plant constraints is also important. If a constraint is violated, this can alert the plant staff to possible future problems and warn them that evasive action should be taken. For example, in reviewing projected floor space requirements, finding a value which exceeded the projections of space available would cause the planning manager to ask such questions as: Does the space deficit persist over several years? If so, can some work be off loaded to other plants? Or, i f the deficit is short .term, can additional space be leased? Which course would be most economical? Conversely, i f a surplus of floor space were projected, the planning manager might wish to advertise this to other plants who could potentially move some of their work to Marysville.
Finally, the planning manager is concerned with whether all elements of the plan are consistent with the strategies that have been decided on. For example, i f there were a goal to improve product quality and a strategy which specified the acquisition of new test equipment, then the resource plan should reflect this purchase in the capital investment section. Similarly, if there were a strategy to shift quality control procedures to earlier stages of the manufacturing process, then the projected effect of this strategy - - reduction in overall testing costs, say - - should appear in the plan.
There are two basic methods by which the planning manager can review a plan:
1. He can review the process by which the results in the plan were derived and try to determine whether each step of the derivation was justified. That is, for each item in the plan, he can disaggregate the item and "push it back" through the computations (and/or people) that produced it to bring out and evaluate the data and relationships upon which that item was based.
2. He can review the results themselveg by comparing them to the values derived independently.
Not surprisingly, "reviewing the process" does not occur very much. The reasons are that first, such a process is highly cumbersome and second, the information required to do this reasonably efficiently is not directly available. Currently, process review involves locating the individuals responsible for the derivation and asking for an explanation of the result. Problems sometimes arise here when the relevant information has been forgotten, discarded, or re-rationalized. Furthermore, whenever plans are revised, old documents are often discarded. Hence, there is neither an explicit record of the original information nor a record of the reasons that changes were made.
14
From the planning manager's point of view, reviewing the results theniselves is a better method both because it requires less effort and information and because it is very powerful at the plant level of aggregation. We have observed that reviewing the process (the "pushback") only occurs after an anomalous result has been detected by the sort of macro tests discussed above.
2.2.5 Summary
To summarize, the LRP process consists of successive decompositions of requests and successive recompositions of responses to those requests as the data are developed. I.e., requests for information of particular kinds in particular forms come down from higher management and are satisfied by an upward flow of information from lower organizational units. Satisfying a request typically requires a combination of:
0 data-gathering (e.g. assembling estimates of manufacturing costs)
0 computation (e.g., the derivation of unit cost)
0 problem-solving (e.g., finding ways to reduce costs to meet a given goal)
0 negotiation (e.g., obtaining cost commitments from component suppliers)
0 presentation (e.g. preparing a cost report in the format requested)
Information is successively aggregated as it flows upward through each level of the organizational hierarchy.
The various review and revision loops are needed to deal with "errors" of various sorts (e.g., misunderstandings, misconceptions, and ordinary errors of arithmetic and data entry), refinements of previous estimates in the light of new information (e.g., the more detailed machine and process definitions that evolve throughout a product's life cycle), and changes in assumptions. The whole process is highly dynamic (some might say "ill-structured"), not only because of the iterations it involves, but also because of the introduction of new tasks, not foreseen initially, that are required to solve problems not initially apparent.
2.3 Problems with Planning
Since the LRP process involves many individuals and many levels of the organization, the type of problem encountered varies within the organization. For example, the MPM's and their assistants find that LRP is very time-consuming. Most of their calculations are still done manually with data drawn from various physical file folders. Contingency planning in the formal sense does not currently exist at the plant level. The existing modeling systems (CE, EPS) are not integrated, do not provide the relevant information, and are not particularly easy to use for contingency analysis purposes. The planning manager finds it difficult to get the same answer to a question from different financial analysts. Many parties in the process have found that there were types of resource consumption that were not included in the categories defined for the resource plan.
Most of these problems appear to be transient, however. Since the process at Marysville is relatively

15
new and evolving, they are basically teething problems, which will disappear in time by the application of the obvious remedies. At the planning manager's level, though, three important generic problems are apparent: plan integrity, information loss, and the problem of uncertainty.
Plan Intearity. As noted above, generating a long range plan requires combining information from many sources into successively more aggregate forms. An estimate that is erroneous (for whatever reason) that gets "rolled up" in the aggregation process is often virtually impossible to discover without tracing back through the entire plan formulation process. This problem is exacerbated by the fact that several items in the plan depend on the same basic estimates and are therefore affected (although differently, by the time they are rolled up) by erroneous assumptions and/or rationales. The difficulty of tracking down these errors is a major concern of the planning manager.
Information Loss. The planning process produces a set of agreed upon numbers where the credibility of the numbers to all parties involved depends on the "feel" for them acquired in the process. In part, this "feeling" stems from an awareness of the various assumptions, rationales, and models by which the numbers are derived, and the acceptance of them that is produced by participating in the process. Unless such justifications are made explicit. Iiowever. some degree of information loss occurs. Those reading the plan who did not help create it will not know how or why it came out the way it did. Conversely, if this information is explicitly associated with the plan results, i.e., i f the information on which results depend is recorded and easily accessible, it is likely to aid the planning manager in identifying discrepancies in the plan and also in diagnosing possible causes for those discrepancies.
It is not enough, however, to simply annotate a plan - - with footnotes, say - - or to require planners to provide explanatory appendices. The problem here is how to retain the justifications that planners use without burdening them with additional work, and how to make these justifications accessible without cluttering or obscuring the results which the aggregation process is intended to deliver.
Uncertaintv and Chanae. Making a plan requires making assumptions about the future and these assumptions may, of course, turn out to be invalid. Plan review must therefore take into account the inexact nature of the planning factors. When the planning manager performs a review, he sometimes engages in various forms of hypothetical reasoning to test the sensitivity of the plan to the premises on which estimates have been based. For example, he might ask himself "What if, contrary to expectations, Motorola is unable to develop the VLSl technology that is supposed to form component X of Redwood?" Without information on which plan results depend on what assumptions, answering such questions is very difficult.
When assumptions change, a plan may have to be changed as well. It is apparent at Marysville, and also in the literature, that long range plans are subject to constant revision long before the planning horizon becomes reality. Currently, however, the reasons for making changes are not recorded and so, from the standpoint of plan review, they are essentially lost. Thus, to evaluate either hypothetical or actual changes in a plan, it is not only important to have justifications available, but also to be able to determine easily how they interact in the derivation of the final plan results.
*.**
In concluding this section, we note that there are two potential areas for computerized support

16
within the planning process: plan generation and plan review. In the next section, we examine current support systems and how their capabilities apply to planning and other decision-malting processes. The strengths and weaknesses of these systems form part of the basis for our recommendations in Section 4.
17
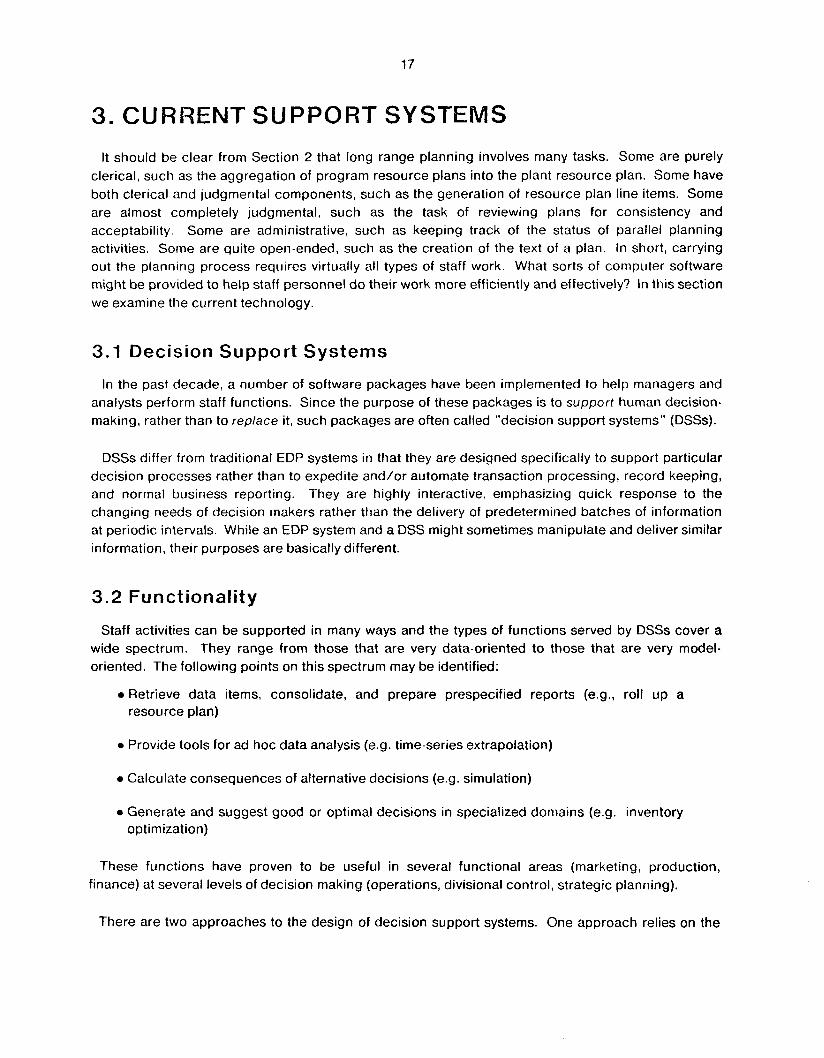
3. CURRENT SUPPORT SYSTEMS It should be clear from Section 2 that long range planning involves many tasks. Some are purely
clerical, such as the aggregation of program resource plans into the plant resource plan. Some have both clerical and judgmental components, such as the generation of resource plan line items. Some are almost completely judgmental, such as the task of reviewing plans for consistency and acceptability. Some are administrative, such as keeping track of the status of parallel planning activities. Some are quite open-ended, such as the creation of the text 'of a plan. In short, carrying out the planning process requires virtually all types of staff work. What sorts of computer software might be provided to help staff personnel do their work more efficiently and effectively? In this section we examine the current technology.
3.1 Decision Support Systems
In the past decade, a number of software packages have been implemented to help managers and analysts perform staff functions. Since the purpose of these packages is to support human decision- making, rather than to replace it, such packages are often called "decision support systems" (DSSs).
DSSs differ from traditional EDP systems in that they are designed specifically to support particular decision processes rather than to expedite and/or automate transaction processing, record keeping, and normal business reporting. They are highly interactive, emphasizing quick response to the changing needs of decision makers rather than the delivery of predetermined batches of information at periodic intervals. While an EDP system and a DSS might sometimes manipulate and deliver similar information, their purposes are basically different.
3.2 Functionality
Staff activities can be supported in many ways and the types of functions served by DSSs cover a wide spectrum. They range from those that are very data-oriented to those that are very model- oriented. The following points on this spectrum may be identified:
0 Retrieve data items, consolidate, and prepare prespecified reports (e.g., roll up a resource plan)
0 Provide tools for ad hoc data analysis (e.g. time-series extrapolation)
0 Calculate consequences of alternative decisions (e.9. simulation)
0 Generate and suggest good or optimal decisions in specialized domains (e.9. inventory optimization)
These functions have proven to be useful in several functional areas (marketing, production, finance) at several levels of decision making (operations, divisional control, strategic planning).
There are two approaches to the design of decision support systems. One approach relies on the

18
provision of general purpose information-processing tools which are interfaced to the user by a fairly nonprocedural language. Examples of such systems include IFPS (Interactive Financial Planning System), marketed by Execucom Systems of Austin, Texas, EIS (Executive Information System), available from Boeing Computer Services, VISICALC, and EPS. They differ from ordinary, general purpose programming languages in that they incorporate certain concepts5 and data structures that establish a context within which the system is used. Such systems are useful in performing data retrieval, ad hoc analyses, flexible report generation, etc.
The second approach adopts the view that a DSS should be built around a basic task and not as a by-product of a tool kit. The idea is to first understand the information requirements of the task and then to use these as a point of departure for building the system. For example, a task-oriented DSS described in (Alter, 1979) was installed at a large shipping concern to aid in long range planning and management control. The system was based on a two dimensional table with columns representing time periods and rows representing revenues, expenses, etc. as in the EPS system. One of the key functions of the system was to evaluate the effects of various financing options and variations in the prodirct mix (the different types of ships and cargoes) on rows in the table. This sort of system is usually built in-house to provide facilities for synthesizing, analyzing, and/or exploring large numbers of alternative decisions.
It can be argued that current DSSs support decisions in three ways. First, they automate some of the clerical component of a manager's activities thereby enabling him to more fully explore aspects of problems not otherwise possible. Secondly, they provide structural frameworks for some types of decisions in the form of computational models. Thirdly. within the context of a model. they provide a free-flowing interaction with the system thereby introducing the possibility of providing the manager with a better understanding of the problem.
The support they provide is limited, however. For one thing, their clerical function does not extend much beyond calculating and formatting. Not much attention is paid to input validation, assumption checking, or keeping track of intermediate results. Nor is there any provision for mechanisms by which systems could explain their derivations or justify their results to users who were not familiar with what the system does. All of this leaves many users skeptical about the credibility of the reports they get.
When some inputs are the end result of a series of negotiations, agreements and assumptions, these factors are not identified to the system user. Neither the source, the reason, nor the potential malleability of assumed values is recorded with the results they affect. Again, a user can be left with questions about the results which the system cannot answer.
Tool-kit systems suffer from a major drawback when used to support higher level decision-making because they require a manager to have an adequate formulation of a problem before the tools can be used. They do not have the capability to focus the user-system interaction on the "right" parts of a situation about which a free flowing interaction could then occur. In other words, there is no tool that can direct a user into an appropriate mind-set. Rather, i f he has some formulation of a problem in
E.g., a report layout, some general forecasting model, an optimization algorithm, etc., that determines the basic element(s) 5
central to the system.
19
I b I
mind to start with, the tools might help him to solve that problem, but will not help him choose what to try next. This is a severe limitation considering the fact that managers most often need assistance in situations characterized by extreme ambiguity, where there is little initial understanding of what problem formulations might be fruitful.
1
Flexible software
new routines Computer t-- for developing
3.3 User Interface
I
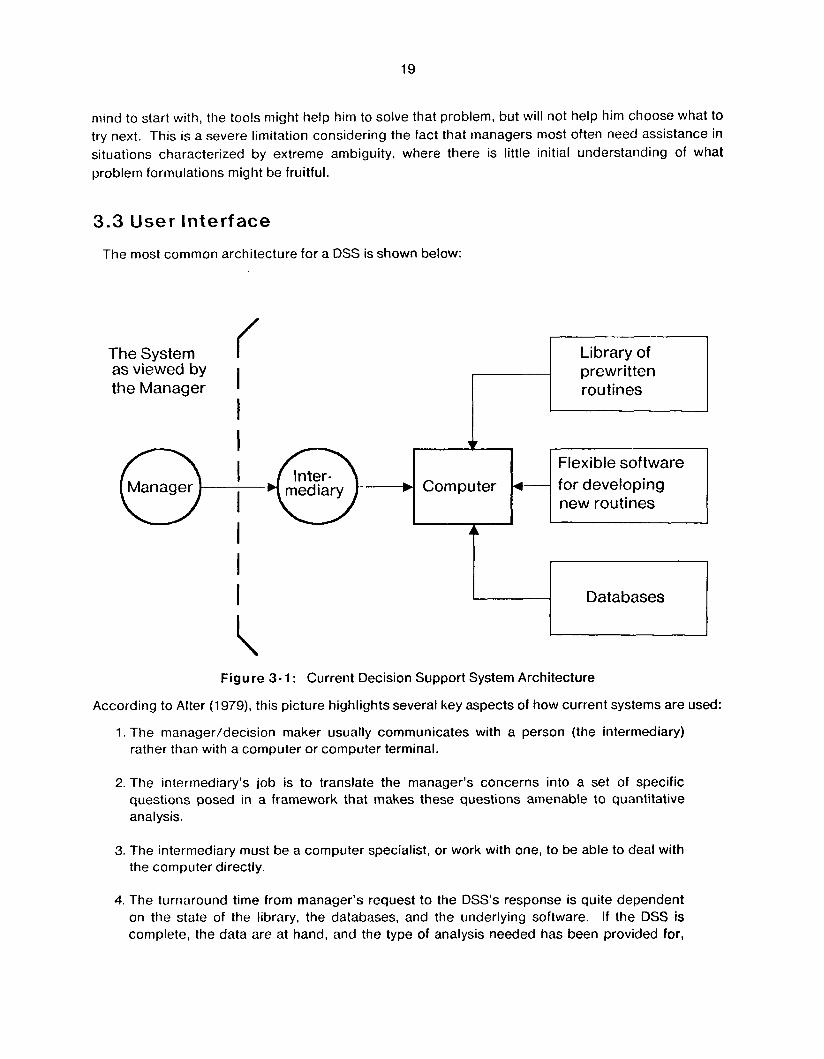
The most common architecture for a DSS is shown below:
I
The System I I I
as viewed by the Manager
Data bases
Library of prewritten routines
I Figure 3- 1 : Current Decision Support System Architecture
According to Alter (1979), this picture highlights several key aspects of how current systems are used:
1. The manager/decision maker usually communicates with a person (the intermediary) rather than with a computer or computer terminal.
2. The intermediary’s job is to translate the manager’s concerns into a set of specific questions posed in a framework that makes these questions amenable to quantitative analysis.
3. The intermediary must be a computer specialist, or work with one, to be able to deal with the computer directly.
4. The turnaround time from manager’s request to the DSS’s response is quite dependent on the state of the library, the databases, and the underlying software. If the DSS is complete, the data are at hand, and the type of analysis needed has been provided for,
20
the job is usually done with dispatch. However, i f new data must be gathered, or new routines and models must be developed, the adaptability of the software determines whether the original request can be met in time to help the manager.
This picture of DSS usage fits the current situation at Marysville rather well. The managers whose LRP needs are to be supported are the MPMs and the planning manager. The intermediaries are either planning assistants or financial analysts associated with the programs. The DSSs they have are EPS, CE, and ROLLUP. Apparently, only EPS comes with software for developing new routines. Databases are being developed for both CE and EPS but not much exists at present. The interfaces presented to the user on the input side comprise declarative data definition languages (EPS and CE), data entry facilities (all three), command languages (CE and EPS), and a specialized programming language (EPS). On the output side, all three produce formatted reports, both hard and soft copy.
None of these systems is particularly problem oriented. Rather, each is designed to provide certain services which may be specialized to a single application (ROLLUP) or generalized to apply to a range (EPS). Neither are they particularly easy for managers themselves to use. It usually takes a programmer/analyst to translate a manager's needs into system actions. Consequently, managers do not often engage in a "free-flowing interaction" with them.

21
4. KNOWLEDGE-BASED SUPPORT SYSTEMS
This section presents the recommendations of the CMU study team and outlines the design of a system to implement those recommendations. To begin with, we believe that virtually all of the clerical LRP tasks at Marysville can be computerized using current DSS technology. So, for example, it seems to us to be feasible to develop an on-line data bank of planning factors, specialized calculators for each type of resource plan line-item, various report generators, etc. As mentioned earlier, a development effort along these lines has already been initiated by the planning manager. However, we also believe that any system resulting from this effort - - no matter how carefully designed and crafted - - must partake of the shortcomings of the technology with which it is built.
Second, we believe that the shortcomings of current technology are not fundamental to the DSS approach. Rather, we suggest that many of them stem for a single cause, namely, that current systems simply don't know what the numbers mean. In particular, they don't have knowledge of how the numbers are defined in terms of real-world events and so they can't explain what the numbers stand for. They don't themselves retrieve, examine, or display the relationships used to derive the numbers and so they can't explain how they got their results. They don't distinguish assumed relations from necessary ones and so they can't justify their computations. They have no knowledge of "normal" vs "abnormal" circumstances and so cannot detect peculiar data values, whether they be input. intermediary, or final values. Finally, they have no sense of the consequences implied by the numbers and hence cannot tell "good" values from "bad" ones with respect to the goals of the organization.
4.1 System Architecture
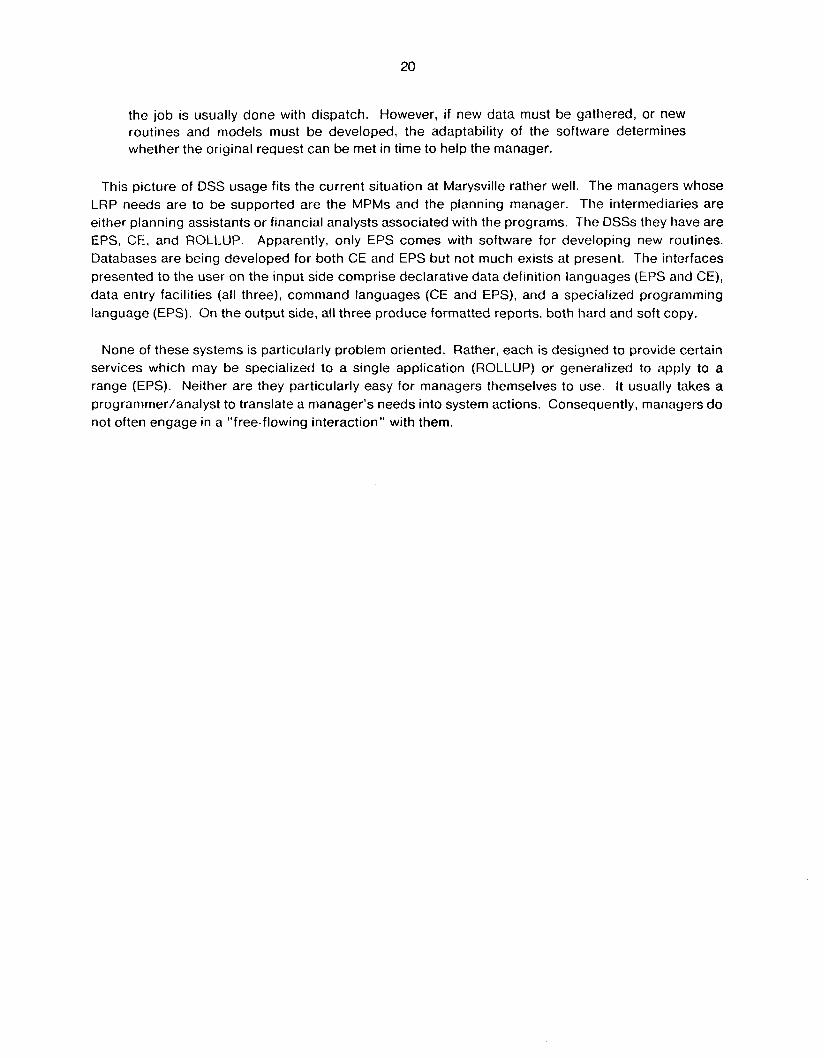
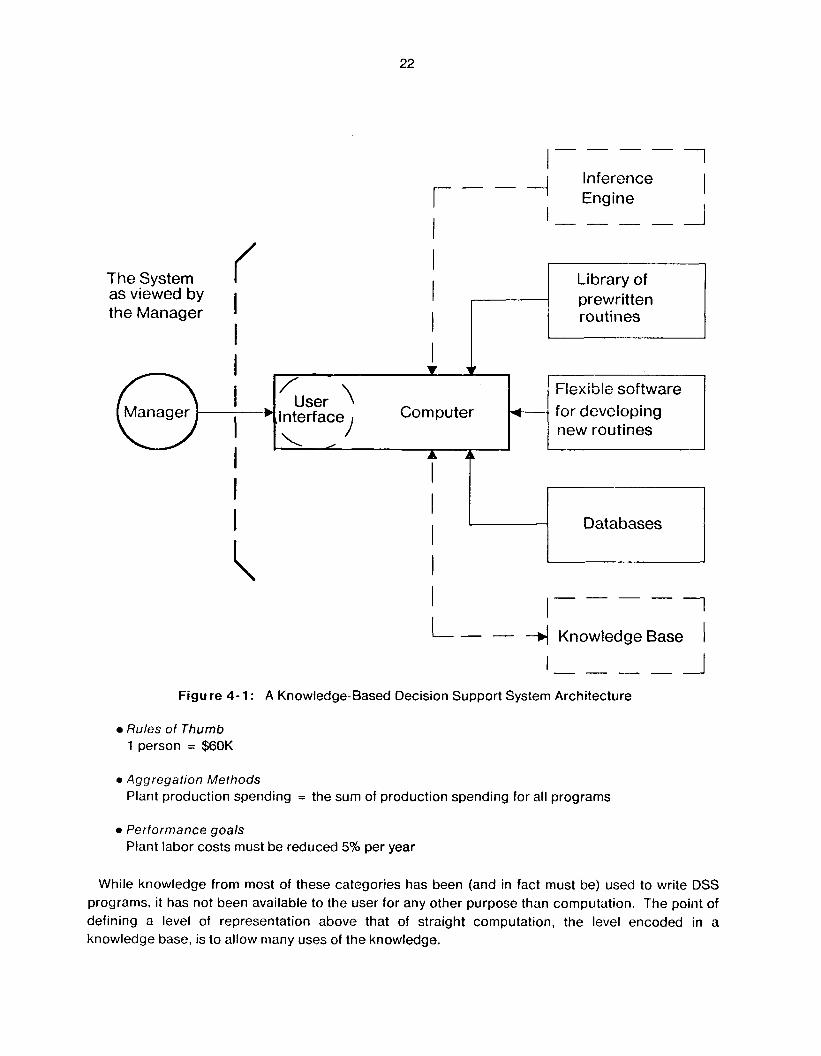
To overcome some of these deficiencies, let us consider an architecture for a knowledqe-based support system, as shown in Figure 4-1. The concept of a "knowledge-based system" is borrowed from recent research in the field of artificial intelligence. Applying this concept to the decision support area adds three new components to the system. These components provide the facilities a DSS needs to store, apply, and communicate knowledge.
4.1 -1 The Knowledge Base
The knowledge base is the repository for the definitions, relations, rules, methods, and goals that have lain behind traditional DSSs but have not been made explicit. For LRP tasks, a knowledge base should contain the following types of information:
e Definitions Production spending is the gross cost of labor and overhead incurred by an operating unit.
e Accounting Relationships Total Spending = Production Spending + Material Spending
Causal Relations and Transfer Functions Material spending is an increasing function of output
22
Computer J Manager ,interface
\ /
1 ---- I
+
TheSystem I as viewed by the Manager I
I Inference
I ---/ Engine r - - I
prewritten routines
I I
Flexible software for developing new routines
I 1 I 1 L-- 4 KnowledgeBase I
I I
- --- I
Figure 4- 1 : A Knowledge-Based Decision Support System Architecture
Rules of Thumb 1 person = $60K
0 Aggregation Methods Plant production spending = the sum of production spending for all programs
e Performance goals Plant labor costs must be reduced 5% per year
While knowledge from most of these categories has been (and in fact must be) used to write DSS programs, it has not been available to the user for any other purpose than computation. The point of defining a level of representation above that of straight computation, the level encoded in a knowledge base, is to allow many uses of the knowledge.

23
Consider, for example, knowledge of an accounting relationship. If represented only procedurally, by an assignment statement in a subroutine, the relationship can yield an output value from inputs. But, if represented declaratively, as a symbolic expression in the knowledge base, this relationship might also be used for:
Algebraic reasoning Given that production spending is value x and total spending is value y, then materials spending must be equal to y - x.
Explanation Q: Why is total spending higher this year than last year? A: Because materials spending is higher this year than last year.
Justifying results Q: How did you get T for total spending? A: From the sum of materials spending, which was x, and production spending, which was y.
Besides the factual, declarative knowledge, a system still needs procedural knowledge to be able to utilize and manipulate expressions in diverse ways. This knowledge takes the form of rules. A rule is essentially a conditional statement which says that if certain specified conditions -. contained in the "premise" of the rule - - are met, a specified action is to be executed or a specified conclusion is to be drawn. The above responses, for instance, depend on rules such as:
given values for n- 7 terms in an equation, one can solve fo r the n'th value
e if one term in a summation increases and none decreases, the sum increases
a total is correct if its components are correct.
These rules, in turn, depend on an even larger number of lower level rules. In algebraic reasoning, for example, there must be rules for actually solving an equation as well as for detecting when it is solvable.
There are several reasons for representing procedural knowledge in the form of rules. For one, when a program calculates a value, infers a fact, or takes some other action as the result of applying a rule. the premise data and the name of the rule can be linked to that result to indicate where it came from. These dependency links may then be used to explain how the result was derived or to justify the validity of the result based on the validity of the rule. In addition, a rule embodies a single, modular "chunk" of knowledge and explicitly state all necessary context in its premise. Consequently, modifying the knowledge base consists of simply adding, changing, or deleting rules. The capabilities of a knowledge-based system are thus a function of the relationships and rules it "knows".
4.1.2 The Inference Engine
Knowledge without a means of applying it is mute - - it can only help the user as much as a book can. The inference engine is the set of mechanisms that put the knowledge to work. These mechanisms respond to demands for information by finding a path through the knowledge base that will generate
the information from the data at hand, i f that is possible with the knowledge available. This path is constructed by invoking a chain of rules whose premises are satisfied by the stored data and whose final result is the information desired. There are also mechanisms which respond to new information, i.e. information newly generated or externally entered, by noticing whether a stored rule applies and taking the actiori specified by that rule. An inference engine can be used to support such tasks as:
Data validation Labor rate forecasts seem low. Are they fully burdened?
Recognizing qualitative patterns Prodiiction spending is increasing sharply.
Consistency analysis Output is increasing but production spending is approximately flat. This seems odd.
Diagnosis Equipment acquisitions in FY84 are expected to increase productivity. An increase in productivity would account for increasing output without increasing production spending.
e Detection of violated goals Hemlock system I/L costs do not meet the cost reduction goal for FY85.
Decision simulation What i f we need to increase output by 15%?
The engine performs these functions by a combination of pattern matching, search, rule invocation, operator application (e.g., compare, transform, add), programmed functions and problem-solving heuristics.
4.1.3 The User Interface
I f we wish to make a system accessible to managers directly, so they can get what they want as quickly as possible, then some provision must be made for performing the functions currently performed by human intermediaries. This is the province of the user interface. To eliminate the need for a computer specialist, the interface must be flexible, forgiving, fast, informative, and easy to learn without training. To eliminate the need for an analyst (to translate managerial questions into specific system requests) the interface must be able to accept questions that a manager would normally pose to an analyst, or, at least, to an automated version of one.
Let us consider the analyst’s function first. When managers are free to ask a computer system any sort of factual question they wish, they tend to ask two major types (Malhotra, 1975). First, they ask questions about the situation they are interested in, including questions about:
Data values What is Hemlock production spending in FY85? What is total spending for each program?
Properties of entities & identity questions
25
How many kinds of machines will we be building in FY85? What plants will produce components for the Redwood system?
Model results and what-if questions What is plant productivity in FY85? Would productivity increase i f the Redwood program were moved elsewhere?
functions of data What is the ratio of production spending to output for each program? What is the percentage increase in output for each program in FY85?
Yes-no questions Are costs being reduced for Hemlock? Does each program expect to buy new equipment?
Causality Why was there such a large increase in plant population in FY85? Do you have any information on what the capital expenditure in FY85 is for?
Second, they ask questions about the system itself, including questions regarding:
Capabilities List all the functions you can perform. Can you format reports?
Contents Do you have the resource plan made last year? Do you have any information on problem installations?
Composition of data items Give me a breakdown of material spending. Are labor costs and "production spending" the same?
Definitions of data items and models What is the definition of Manufacturing Projects? How is "value-add'' calculated?
Finally, they also make requests which are not strictly questions, including:
Declaring model definitions Define "labor-intensity" to be the ratio of production spending to output. Define %chlabor = (production-spending(year) - production-spending(year-l))/production-spending(year-l).
Issuing specific orders Plot a graph of output for each program. Display the volume spending portion of the resource plan.
Of course the questions and requests need not be expressed in English, as above. Other

26
possibilities include request menus and problem-oriented command languages. However, i f the system language is too far from the manager's own, the need for an intermediary to translate will remain.
The state-of-the-art in natural language processing is such that it may be possible to provide an interpreter for some fraction of the input types in the above lists. It is not clear how large that fraction might be. Research has shown that the knowledge needed to properly interpret a substantial fraction of linguistic constructions is truly enormous, multi-leveled (from vocabulary, syntax and semantics up through pragmatics. conversational conventions, and speaker intent), and extremely difficult to formalize in an efficient way. Beyond that, answering questions that require "common sense" or specialized domain knowledge, such as open-ended what-ifs and questions about causality, requires a considerably larger body of knowledge whose formalization is still an open research issue. Questions about the system, rather than the situation, may be easier to deal with since they involve knowledge of system internals rather than knowledge of the domain, although relatively little work has been done in this area.
Eliminating the computer specialist may be somewhat less difficult. Recent research on "robust" interfaces suggests that given a relatively small amount of linguistic knowledge, systems can be made more cooperative (Hayes et a / . , 1981). In particular, ways are being developed to provide such capabilities as:
0 Recovery from user mistakes, e.g. spelling correction
0 Tolerance of user ignorance, e.g. acceptance of command synonyms and variation in syntactic forms
0 A directory of services, e.g. responding to questions like "How do I get a printout of report l?"
The development of comfortable interfaces to knowledge-based systems is currently a very active research area.
* * * *
In the following section, we present the design goals for a particular knowledge-based support system called ROME currently under development in the Intelligent Systems Laboratory. It can be viewed as an "umbrella" system in that we expect it to provide an extensible framework within which various functions could be served. Since many aspects of planning depend on quantitative projections and analyses, the design focuses on the representation and use of quantitative information. Hence we expect that ROME will be directly applicable to the generation and review of resource plans. However, to the extent that the text portion of a plan is made specific enough to include detailed tactics and quantitative metrics, the facilities of ROME could also be useful in preparing that part of the plan.
27
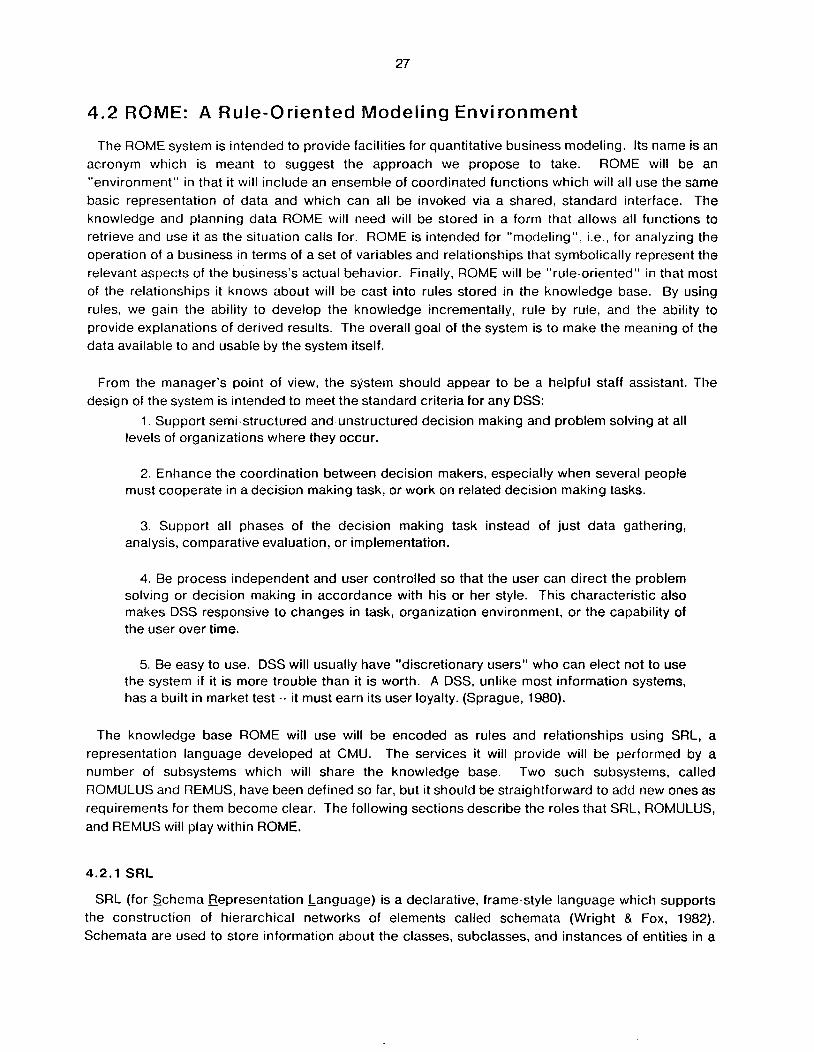
4.2 ROME: A Rule-Oriented Modeling Environment
The ROME system is intended to provide facilities for quantitative business modeling. Its name is an acronym which is meant to suggest the approach we propose to take. ROME will be an "environment" in that it will include an ensemble of coordinated functions which will all use the same basic representation of data and which can all be invoked via a shared, standard interface. The knowledge and planning data ROME will need will be stored in a form that allows all functions to retrieve and use it as the situation calls for. ROME is intended for "modeling", i.e., for analyzing the operation of a business in terms of a set of variables and relationships that symbolically represent the relevant aspects of the business's actual behavior. Finally, ROME will be "rule-oriented'' in that most of the relationships it knows about will be cast into rules stored in the knowledge base. By using rules, we gain the ability to develop the knowledge incrementally, rule by rule. and the ability to provide explanations of derived results. The overall goal of the system is to make the meaning of the data available to and usable by the system itself.
From the manager's point of view, the system should appear to be a helpful staff assistant. The design of the system is intended to meet the standard criteria for any DSS:
1. Support semi-structured and unstructured decision making and problem solving at all levels of organizations where they occur.
2. Enhance the coordination between decision makers, especially when several people must cooperate in a decision making task, or work on related decision making tasks.
3. Support all phases of the decision making task instead of just data gathering, analysis, comparative evaluation, or implementation.
4. Be process independent and user controlled so that the user can direct the problem solving or decision making in accordance with his or her style. This characteristic also makes DSS responsive to changes in task, organization environment, or the capability of the user over time.
5. Be easy to use. DSS will usually have "discretionary users" who can elect not to use the system i f it is more trouble than it is worth. A DSS, unlike most information systems, has a built in market test - _ it must earn its user loyalty. (Sprague, 1980).
The knowledge base ROME will use will be encoded as rules and relationships using SRL, a representation language developed at CMU. The services it will provide will be performed by a number of subsystems which will share the knowledge base. Two such subsystems, called ROMULUS and REMUS, have been defined so far, but it should be straightforward to add new ones as requirements for them become clear. The following sections describe the roles that SRL, ROMULUS, and REMUS will play within ROME.
4.2.1 SRL
S R L (for Schema Representation Language) is a declarative, frame-style language which supports the construction of hierarchical networks of elements called schemata (Wright & Fox, 1982). Schemata are used to store information about the classes, subclasses, and instances of entities in a

28
domain and about relationships among them. The links in a network allow one schema to automatically "inherit" information from another on demand and it is possible for the user to control inheritance by defining new types of links. Schemata may also be used to represent rules, constraints, and goals.
For ROME, schemata will be developed to represent:
0 resource plans, lines, and items
0 arithmetic relationships, both equalities and inequalities
0 causal relationships and constraints
A rule-base must also be developed to include:
0 computational rules, for deriving numerical values
0 inference rules, for deriving consequences from the planning facts and assumptions in the database
0 evaluation rules, for making judgments about the consistency and acceptability of values and assumptions
0 diagnosis rules, for hypothesizing and choosing among potential causes of inconsistencies or variances in a plan
Currently. the inference processes that operate on SRL structures do not support the generation of computational rules from arithmetic relationships nor the maintenance of rationales for stored values. Consequently, the language will be extended to include:
1 .ComDutational Dependencies. Arithmetic and algebra are fairly central to quantitative modeling. As shown earlier, the knowledge expressed in a single equation can be put to many uses. ROME must therefore have powerful facilities for understanding and using arithmetic relationships and formulae. SRL will be augmented to include the mechanisms for transforming knowledge from one form into another as appropriate.
2.Data Dependencies. Throughout this document, we have stressed the importance of avoiding information loss. This loss occurs whenever sources, models, rationales, or assumptions are not explicitly recorded as the plan is being assembled. The importance of these rationales for tracing back to causes of an identified problem have also been discussed. SRL will be extended to provide a means of representing these dependencies explicitly.
4.2.2 ROMULUS
ROMULUS stands for "rule-oriented modeling using a language understanding system". It will be the front-end for ROME and will act as the intermediary between a user and all ROME subsystems. The goal is to provide a robust, natural, communication medium.

29
In general, the interface to a modeling system must accept three sorts of inputs: declarations, commands, and questions. Declarations are needed to specify the variables comprising a model, the procedures to be used to compute their values, the constraints that must be satisfied, and the source data to be used for model initialization. Commands are needed, of course, to tell the system what to do. Questions are important in making the system helpful and cooperative. To get along without a human intermediary. a manager must be able to ask the system itself questions about what it knows, what it can do, and why results came out the way they did. In addition, a manager is likely to order the system to perform various functions by phrasing the order as a question. E.g., the question "What is the ratio of production spending to output for each program?" is essentially the same as the command "Compute and print the ratio of production spending to output for each program."
The ROMULUS interface will support several styles of interaction including menu, command line and natural language. We intend to use a selection menu at the top level in order to provide a concise, tutorial description of ROME'S facilities. Declarations, and more detailed commands, will be specified via simple command lines such as "Remember that total spending = production spending + material spending" and "Warn me if ending inventory (y) > ending inventory ( y - l ) . " To allow users to access the knowledge base and stored data without special training, the system will accept several types of questions in English sentence/phrase form. For example, a user will be able ask "What is the definition of Production Spend ?" and, "What is the relationship between Production Spend, Manufacturing Projects, New Plant/Excess Capacity, and Other Recoveries?". We expect to be able to respond to requests like these phrased either as questions or as imperatives of the form "Tell me . . . ' I , "Show me ... ", etc.
In all three modes, we will pay special attention to making the system as nelpful as possible. This will include the correction of spelling errors, explanations of what is expected of the user at any point, and (possibly) suggestions as to how to obtain desired information or accomplish desired operations.
- A Hwothetical Scenarip
*What i s t h e d e f i n i t i o n o f p r o d u c t i o n spend ?
P R O D U C T I O N S P E N D I N G I S THE GROSS COST OF LABOR AND OVERHEAD,
*How i s i t c a c u l a t e d ?
" c a c u l a t e d " = > c a l c u l a t e d
PLANT P R O D U C T I O N S P E N D I N G = P R O D U C T I O N S P E N D I N G FOR HEMLOCK + P R O D U C T I O N S P E N D I N G FOR REDWOOD
*show me t h e r a t i o n a l e f o r why m a n u f a c t u r i n g p r o j e c t s i s $y i n 1 9 8 4 .
BECAUSE I N 1985, I T I S L I K E L Y THAT TECHNOLOGY "wonderchip" WILL BE PURCHASED BY U S FOR USE I N THE REDWOOD T E S T I N G PROCEDURE.
*who can g i v e me t h e l a t e s t i n f o r m a t i o n on t h a t ?
SOURCE : MANUFACTURING E N G I N E E R I N G PERSON : NOT S P E C I F I E D - SORRY.
30
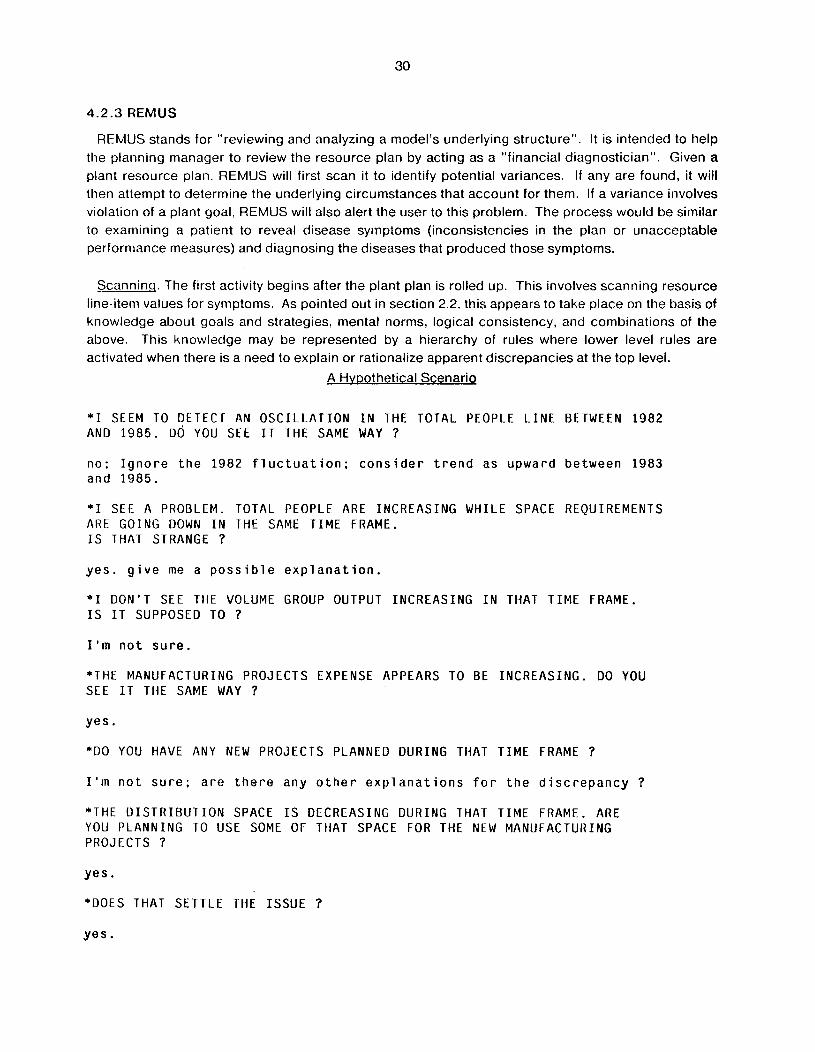
4.2.3 REMUS
REMUS stands for "reviewing and analyzing a model's underlying structure". It is intended to help the planning manager to review the resource plan by acting as a "financial diagnostician". Given a plant resource plan, REMUS will first scan it to identify potential variances. If any are found, it will then attempt to determine the underlying circumstances that account for them. If a variance involves violation of a plant goal, REMUS will also alert the user to this problem. The process would be similar to examining a patient to reveal disease symptoms (inconsistencies in the plan or unacceptable perforniance measures) and diagnosing the diseases that produced those symptoms.
Scanninq. The first activity begins after the plant plan is rolled up. This involves scanning resource line-item values for symptoms. As pointed out in section 2.2, this appears to take place on the basis of knowledge about goals and strategies, mental norms, logical consistency, and combinations of the above. This knowledge may be represented by a hierarchy of rules where lower level rules are activated when there is a need to explain or rationalize apparent discrepancies at the top level.
A Hwothetical ScenariQ
*I SEEM TO DETECT AN O S C I L L A T I O N I N THE T O T A L PEOPLE L I N E BETWEEN 1982 AND 1985. DO YOU SEE I T THE SAME WAY ?
no; Ignore the 1982 f l u c t u a t i o n ; cons ider t rend as upward between 1983 and 1985.
*I SEE A PROBLCM. T O T A L PEOPLF ARE I N C R E A S I N G W H I L E SPACE REQUIREMENTS ARE G O I N G DOWN I N THE SAME T I M E FRAME. I S THAT STRANGE ?
yes. g i v e me a poss ib le exp lanat ion .
*I D O N ' T SEE THE VOLUME GROUP OUTPUT I N C R E A S I N G I N THAT T I M E FRAME. I S I T SUPPOSED TO ?
I ' m no t sure.
*THE MANUFACTURING P R O J E C T S EXPENSE APPEARS TO BE I N C R E A S I N G . DO YOU SEE I T THE SAME WAY ?
yes.
*DO YOU HAVE ANY NEW PROJECTS PLANNED D U R I N G THAT T I M E FRAME ?
I ' m no t sure; are the re any o t h e r exp lanat ions f o r the d iscrepancy 7
*THE D I S T R I B U T I O N SPACE I S D E C R E A S I N G D U R I N G THAT T I M E FRAME. ARE YOU P L A N N I N G T O USE SOME OF THAT SPACE FOR THE NEW MANUFACTURING PROJECTS ?
yes.
*DOES THAT S E T T L E THE I S S U E ?
yes.

31
Diaanosis. After identifying variances, REMUS will examine the knowledge it used in the process and proceed to reason about the chain of rationales that led to problematic number(s). For example, if a discrepancy were identified in the "production spending" line (i.e. an inconsistency with other believed facts), REMUS might chain back through the rationales/computations and conclude, perhaps, that the assumed labor rate is not consistent with its internal norm.
Variance diagnosis can be of two types:
1. An ex-ante enumeration of resource plan line items,
2. An ex-post comparison of projected versus actuals. The results of this comparison could be fed into a system that would determine whether
0 corrective action should be taken, or
0 the goals/strategies should be modified.
"Corrective action" should be taken not on the basis of the variance itself, but only if the trends indicated by the data are not compatible with the desired goals.
Of course, such a "corrective action synthesizer" would require that justifications for calculations be explicit and would require knowledge about the MV production environment. To be able to answer "what i f " questions or analyze the sensitivity of results to changes in assumptions, a hypothetical reasoning system would also be needed wherein assumptions could be altered arid the effects observed. However, unlike traditional systems, which are capable of strictly quantitative analyses, and where the rationales for performing the analyses are imdicit, ROME will keep track of justifications. In other words, the system would provide exDlicit reason maintenance so that the impact of alternative assumptions on numbers, or on other assumptions, could be examined. Clearly, this kind of thought experimentation is an important part of a planner's job even in instances where a variance may not exist, Le. when it is desirable to hypothesize if something can be done better than at present.
4.3 Summary
Preparing a long range plan for the Marysville plant is a very complex process involving many people and many kinds of information. Although several computerized support tools are being used to assist in this process, the tools do little more than carry out computations and display results. Not much attention is given to screening the input data for anomalies, verifying that the data satisfy the assumptions of the tools being used, or checking to make sure that the outputs seem reasonable for the situation at hand. Nor are there facilities for explaining what the outputs represent, showing their derivation, or justifying the results to users who may not be familiar with what a particular tool does.
A knowledge-based support system called ROME is being constructed which will itself perform many of the above tasks and hence more effectively support the LRP process. This system is designed to overcome the limitations of current DSS technology by using more knowledge in more

32
diverse ways than is the case in current systems. ROME will have access to knowledge of how the items in a plan are defined and so will be able to tell the user what the numbers stand for. It will keep track of the relationships used to derive the numbers and so will be able to explain how results were arrived at. It will also be able to detect peculiar or abnormal values by using knowledge of the constraints the numbers should satisfy, such as consistency with historical values and conformance with targeted plant goals.
The initial development of ROME will focus on two subsystems, ROMULUS and REMUS. ROMULUS will act as the communication interface to ROME and will provide managers with information without the need to go through a computer specialist. It will be able to accept declarations of definitions, constraints, and computational rules, answer questions about these knowledge base elements, and explain how they were used to generate results. REMUS will act as a reviewer of resource plans. Given a particular plan, it will first scan the plan to identify inconsistencies, unmet business goals, deviations from approximate norms, and the like. Then it will attempt to determine the underlying circumstances that account for what it finds by examining the assumptions, computations and source data that produced it.
In the short run, the ROMULUS and REMUS developments are to some extent parallel because ROMULUS does not "feed into" REMUS or vice versa in an automatic fashion. Rather, the user will decide what he wants to do next. However, as pointed out at the end of section 3, where we discussed the deficiencies of existing systems, it is often the need to focus on the part of the problem - - a problem structuring activity - - that is most important. We propose to provide this capability in REMUS which will serve the function of focusing the planner's attention on the problematic parts of the resource plan. Once a discrepancy has been identified, it can be followed by a pushback on the identified problem through ROMULUS. Since the data dependencies would be explicit, this combination of focusing followed by pushback should constitute a fairly powerful capability.
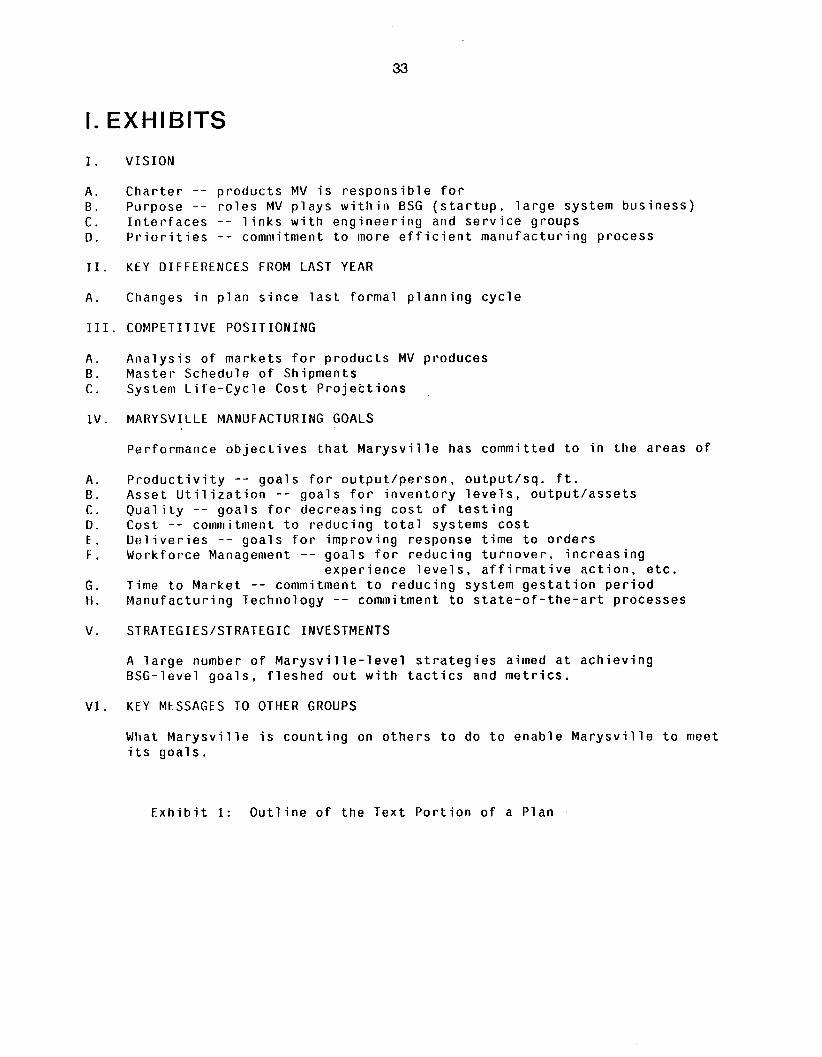
33
I. EXHIBITS
I. V I S I O N
A . C h a r t e r -- p r o d u c t s MV i s r e s p o n s i b l B . Purpose - - r o l e s MV p l a y s w i t h i n BSG C . I n t e r f a c e s - - l i n k s w i t h e n g i n e e r i n g D . P r i o r i t i e s - - commitment t o more e f f
11. K E Y D I F F E R E N C E S FROM LAST YEAR
f o r ( s t a r t u p , l a r g e sys tem b u s i n e s s ) and s e r v i c e g r o u p s c i e n t m a n u f a c t u r i n g p r o c e s s
A . Changes i n p l a n s i n c e l a s t f o r m a l p l a n n i n g c y c l e
111. C O M P E T I T I V E P O S I T I O N I N G
A . A n a l y s i s o f m a r k e t s f o r p r o d u c t s MV p roduces B. M a s t e r Schedu le o f Sh ipments C . System L i f e - C y c l e Cos t P r o j e c t i o n s
I V . MARYSVILLE MANUFACTURING GOALS
Per fo rmance o b j e c t i v e s t h a t M a r y s v i l l e has c o m m i t t e d t o i n t h e a reas o f
A . B . C . D. E . F .
G. H .
V .
V I
P r o d u c t i v i t y -- g o a l s f o r o u t p u t / p e r s o n , o u t p u t l s q . f t . Asse t U t i l i z a t i o n - - g o a l s f o r i n v e n t o r y l e v e l s , o u t p u t / a s s e t s Q u a l i t y -- g o a l s f o r d e c r e a s i n g c o s t o f t e s t i n g Cos t -- commitment t o r e d u c i n g t o t a l systems c o s t D e l i v e r i e s -- g o a l s f o r i m p r o v i n g response t i m e t o o r d e r s W o r k f o r c e Management -- g o a l s f o r r e d u c i n g t u r n o v e r , i n c r e a s i n g
Time t o M a r k e t -- commitment t o r e d u c i n g sys tem g e s t a t i o n p e r i o d M a n u f a c t u r i n g Techno logy -- commitment t o s t a t e - o f - t h e - a r t p rocesses
e x p e r i e n c e l e v e l s , a f f i r m a t i v e a c t i o n , e t c .
S T R A T E G J E S / S T R A T E G I C INVESTMENTS
A l a r g e number o f M a r y s v i l l e - l e v e l s t r a t e g i e s aimed a t a c h i e v i n g BSG- leve l g o a l s , f l e s h e d o u t w i t h t a c t i c s and m e t r i c s .
K E Y MESSAGES TO OTHER GROUPS
What M a r y s v i l l e i s c o u n t i n g on o t h e r s t o do t o e n a b l e M a r y s v i l l e t o meet i t s g o a l s .
E x h i b i t 1: O u t l i n e o f t h e T e x t P o r t i o n o f a P l a n

34
I. PEOPLE -- E s t i m a t e d p l a n t p o p u l a t i o n l e v e l s needed (number)
11. SPACE -- F l o o r space ( K sq. f t . )
A . E s t i m a t e d amount r e q u i r e d ( d i s t r i b u t i o n vs . m fg . p r o c e s s e s ) 6 . P r o j e c t e d amount a v a i l a b l e (owned vs . l e a s e d )
111. CAPITAL ($M)
A . P r o j e c t e d c a p i t a l e x p e n d i t u r e s b y pu rpose ( e . 9 . g e n e r a l p l a n t r e n o v a t i o n , equ ipmen t f o r p r o d u c i n g e x i s t i n g p r o d u c t s , equ ipment f o r p r o d u c i n g new p r o d u c t s , e t c . )
B . Ne t PP&E ( P l a n t , P r o p e r t y & Equ ipment ) -- p r o j e c t e d a s s e t l e v e l s
I V . VOLUME S P E N D I N G ($M)
A . E s t i m a t e d p r o d u c t i o n expenses ( m a t e r i a l s , l a b o r , e t c . ) € 3 . E s t i m a t e d expenses f o r s e r v i c e s (new p r o d u c t i n t r o d u c t i o n ,
r e p a i r s , e t c . ) r e c o v e r a b l e f r o m o u t s i d e t h e p l a n t C . E s t i m a t e d r e c e i p t s t o i n v e n t o r y f r o m o u t s i d e t h e p l a n t D . E s t i m a t e d t o t a l i n v e n t o r y a v a i l a b l e f o r sh ipmen t
V . VOLUME OUTPUT ( $ M ) -- P r o j e c t e d volume o f o u t p u t t o consumers ( e . g . hardware p r o d u c t g r o u p s , f i e l d s e r v i c e , e t c . 1
V I . VOLUME I N V E N T O R Y
A . E s t i m a t e d y e a r - e n d i n v e n t o r y ($M) € 3 . E s t i m a t e d y e a r - e n d i n v e n t o r y (weeks)
V I I . FINAL ASSEMBLY
A . E s t i m a t e d expenses ( m a t e r i a l s , l a b o r , e t c . ) € 3 . P r o j e c t e d o u t p u t ( a t t r a n s f e r c o s t . a t l i s t p r i c e ) C . E s t i m a t e d y e a r - e n d i n v e n t o r y ($M) , p l a n t vs . p i p e l i n e D . E s t i m a t e d y e a r - e n d i n v e n t o r y (weeks ) , p l a n t v s . p i p e l i n e
V I I I . PERFORMANCE -- C a l c u l a t e d e f f i c i e n c y r a t i o s ( e . 9 . o u t p u t / p e r s o n , sq. f t . r e q u i r e d / p e r s o n , o u t p u t / s q . f t . , e t c . )
I X . E X T R A
A . D i s a g g r e g a t i o n o f Volume O u t p u t by p a r t i c u l a r consumer g roups B . D i s a g g r e g a t i o n o f Peop le i n t o i n d i r e c t - and d i r e c t - l a b o r ( I L and DL).
C . E s t i m a t e d l e v e l o f s u b c o n t r a c t i n g (DL e q u i v a l e n t s ) D . O t h e r p e r f o r m a n c e r a t i o s
% o f f s h i f t , e t c .
E x h i b i t 2 : O u t l i n e o f Resource P l a n
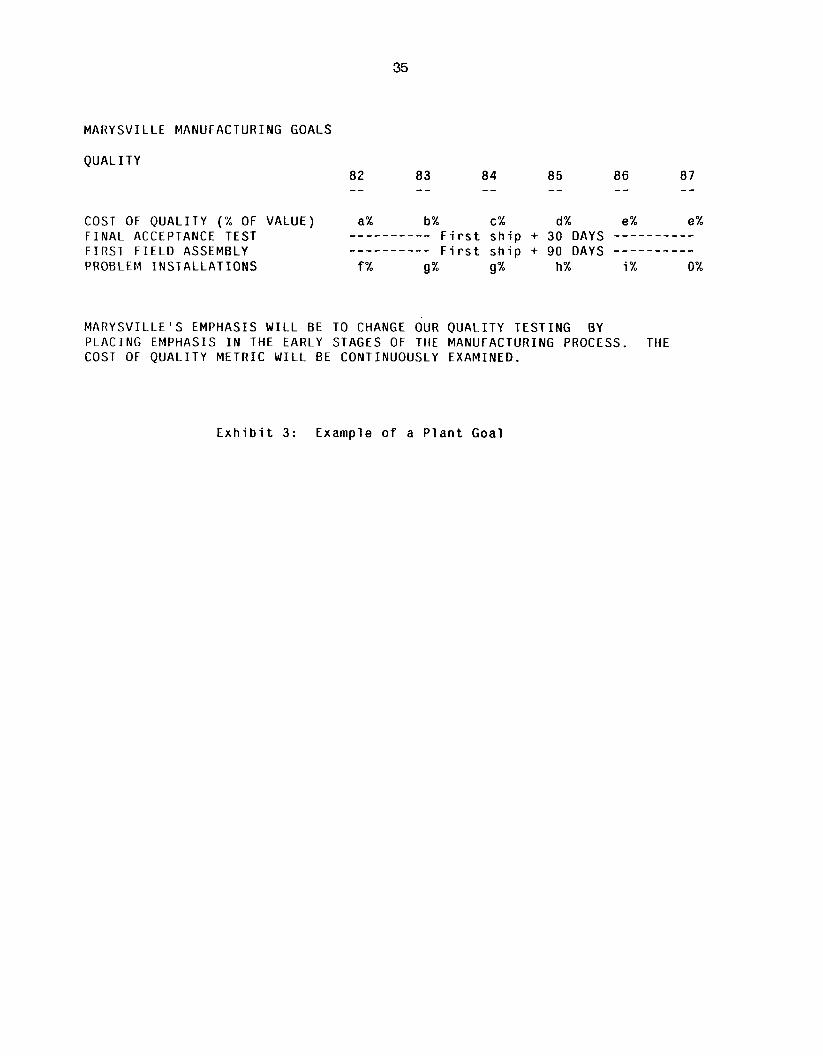
35
M A R Y S V I L L E MANUFACTURING GOALS
QUAL I TY
COST OF Q U A L I T Y ( % OF V A L U E ) a% b% C% d% e% e% F I N A L ACCEPTANCE T E S T F I R S T F I E L D ASSEMBLY
F i r s t s h i p + 30 DAYS ---------- F i r s t s h i p + 90 DAYS - - - - - - - - - -
---------- ----------
PROBLEM I N S T A L L A T I O N S f% 9% 9% h% i% 0%
M A R Y S V I L L E ' S E M P H A S I S WILL BE TO CHANGE OUR Q U A L I T Y T E S T I N G BY P L A C I N G E M P H A S I S I N THE EARLY STAGES OF THE M A N U r A C T U R I N G PROCESS. T H E COST OF Q U A L I T Y M E T R I C W I L L BE C O N T I N U O U S L Y E X A M I N E D .
E x h i b i t 3 : Example o f a P l a n t Goa l
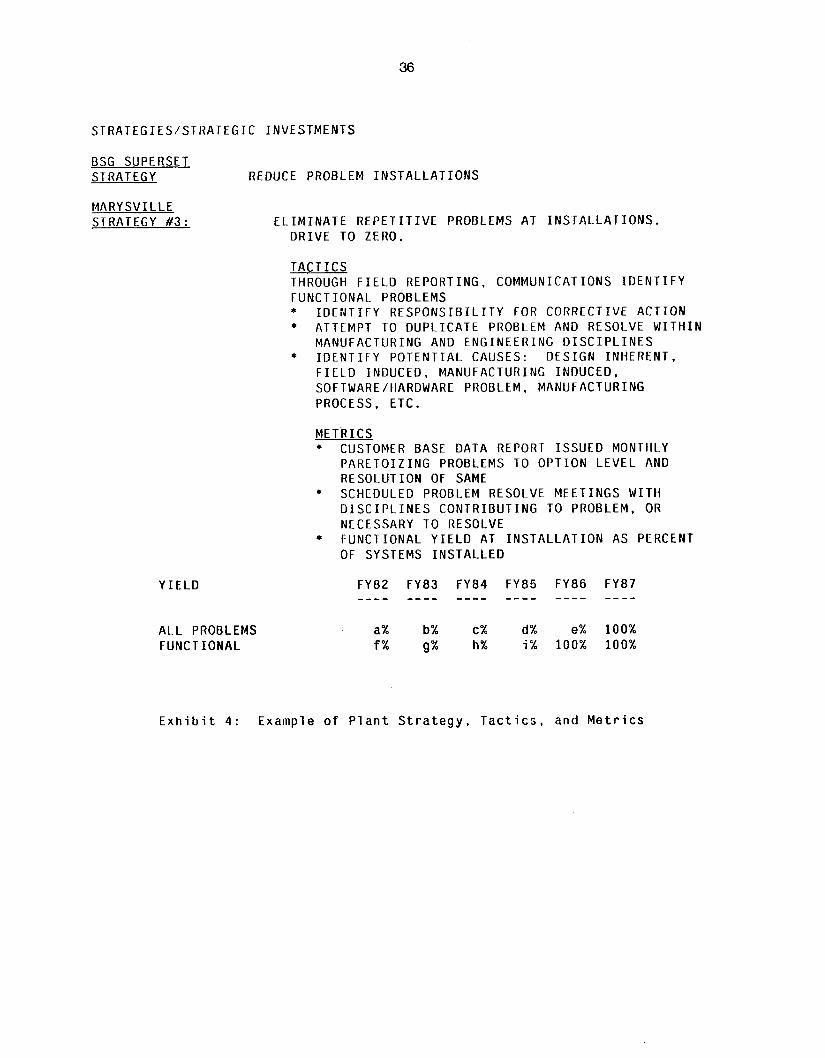
36
S T R A T E G I E S / S T R A T E G I C I N V E S T M E N T S
BSG SUPERSET STRATEGY REDUCE PROBLEM I N S T A L L A T I O N S
MARY S V I L L E STRATEGY #3:
Y I E L D
A L L PROBLEMS F U N C T I O N A L
E L I M I N A T E R E P E T I T I V E PROBLEMS AT I N S T A L L A T I O N S . D R I V E TO ZERO.
T A C T I C S THROUGH F I E L D REPORTING, C O M M U N I C A T I O N S I D E N T I F Y F U N C T I O N A L PROBLEMS * I D E N T I F Y R E S P O N S I B I L I T Y FOR C O R R E C T I V E A C T I O N * ATTEMPT TO D U P L I C A T E PROBLEM AND RESOLVE W I T H I N
MANUFACTURING AND E N G I N E E R l N G D I S C I P L I N E S * I D E N T I F Y P O T E N T I A L CAUSES: D E S I G N I N H E R E N T .
F I E L D I N D U C E D . MANUFACTURING I N D U C E D . SOFTWARE/t IARDWARE PROBLEM, MANUFACTURING PROCESS, ETC.
M E T R I C S * CUSTOMER BASE DATA REPORT I S S U E D MONTHLY
P A R E T O I Z I N G PROBLEMS TO O P T I O N L E V E L AND R E S O L U T I O N OF SAME
* SCHEDULED PROBLEM RESOLVE M E E T I N G S W I T H D I S C I P L I N E S C O N T R I B U T I N G TO PROBLEM, OR NECESSARY TO RESOLVE
* F U N C T I O N A L Y I E L D AT I N S T A L L A T I O N A S PERCENT OF SYSTEMS I N S T A L L E D
a% b% C% d% e% 100% f% gX h% i % 100% 100%
E x h i b i t 4 : E x a m p l e o f P l a n t S t r a t e g y , T a c t i c s , and M e t r i c s
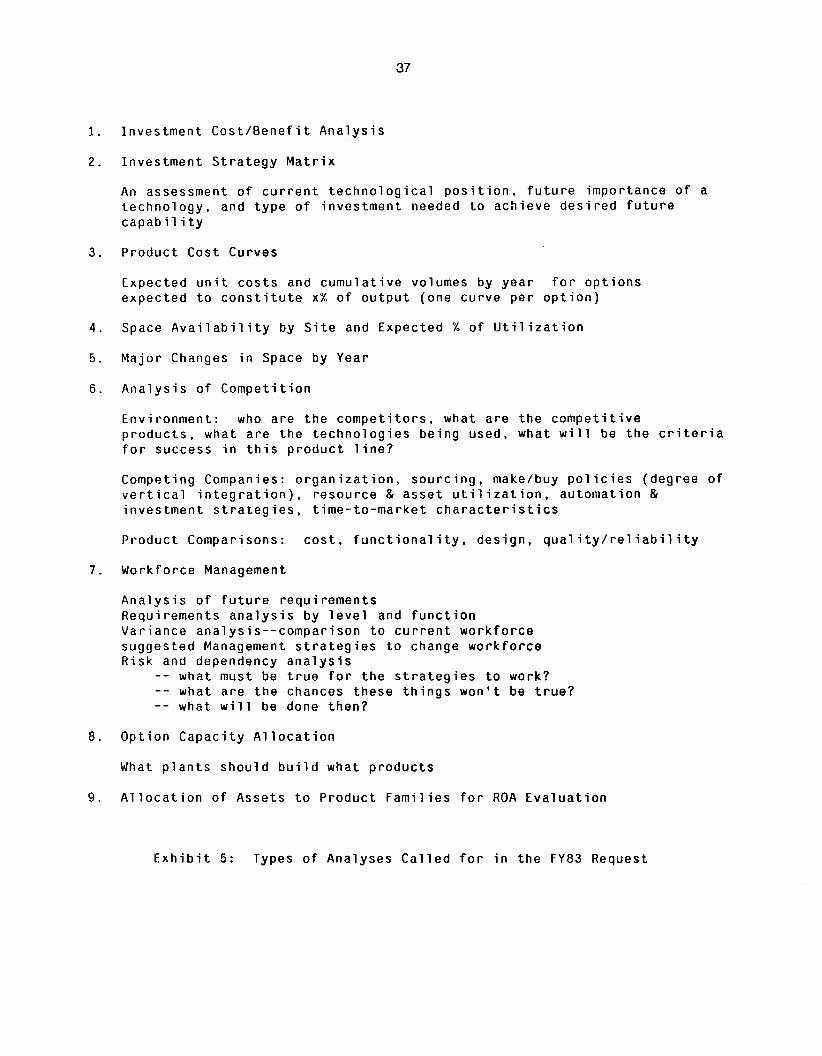
37
1.
2.
3 .
4 .
5.
6 .
7 .
8.
9 .
I n v e s t m e n t C o s t / B e n e f i t A n a l y s i s
I n v e s t m e n t S t r a t e g y M a t r i x
An assessment o f c u r r e n t t e c h n o l o g i c a l p o s i t i o n , f u t u r e i m p o r t a n c e o f a t e c h n o l o g y , and t y p e o f i n v e s t m e n t needed t o a c h i e v e d e s i r e d f u t u r e capab i 1 i t y
P r o d u c t C o s t Curves
Expec ted u n i t c o s t s and c u m u l a t i v e volumes by y e a r f o r o p t i o n s e x p e c t e d t o c o n s t i t u t e x% o f o u t p u t (one c u r v e p e r o p t i o n )
Space A v a i l a b i l i t y by S i t e and Expec ted % o f U t i l i z a t i o n
M a j o r Changes i n Space by Year
A n a l y s i s o f C o m p e t i t i o n
E n v i r o n m e n t : who a r e t h e c o m p e t i t o r s . what a r e t h e c o m p e t i t i v e p r o d u c t s , what a r e t h e t e c h n o l o g i e s b e i n g used, what w i l l be t h e c r i t e r i a f o r success i n t h i s p r o d u c t l i n e ?
Compet ing Companies: o r g a n i z a t i o n , s o u r c i n g , make/buy p o l i c i e s ( d e g r e e o f v e r t i c a l i n t e g r a t i o n ) , r e s o u r c e & a s s e t u t i l i z a t i o n , a u t o m a t i o n & i n v e s t m e n t s t r a t e g i e s . t i m e - t o - m a r k e t c h a r a c t e r i s t i c s
P r o d u c t Compar isons : c o s t , f u n c t i o n a l i t y , d e s i g n , q u a l i t y / r e l i a b i l i t y
Wo r k f o r c e Management
A n a l y s i s o f f u t u r e r e q u i r e m e n t s Requ i remen ts a n a l y s i s b y l e v e l and f u n c t i o n V a r i a n c e a n a l y s i s - - compar i son t o c u r r e n t w o r k f o r c e sugges ted Management s t r a t e g i e s t o change w o r k f o r c e R i s k and dependency a n a l y s i s
-- what must be t r u e f o r t h e s t r a t e g i e s t o work? -- what a r e t h e chances t h e s e t h i n g s w o n ' t be t r u e ? -- what w i l l be done t h e n ?
O p t i o n C a p a c i t y A l l o c a t i o n
What p l a n t s s h o u l d b u i l d what p r o d u c t s
A l l o c a t i o n o f A s s e t s t o P r o d u c t F a m i l i e s f o r ROA E v a l u a t i o n
E x h i b i t 5 : Types o f Ana lyses C a l l e d f o r i n t h e FY83 Request

38
RESOURCE PLAN SYSTEM
REPORT TYPE - FULL RESOURCE PLAN -$MILLIONS- O R G A N I Z A T I O N : PLMV - MARYSVILLE
* * * * * VOLUME SPENDING ****
25 26 27 28 29 30 3 1 32 33
MATERIAL SPENDING 13.30* 5 .70 14 .90 1 0 . 1 0 6 . 8 5 8 . 3 6 10 .30 PRODUCTION S P E N D I N G 9 . 1 0 1 0 . 3 0 10 .30 1 1 . 1 0 2 3 . 7 0 3 5 . 9 0 30 .20 TOTAL S P E N D I N G 2 2 . 4 0 2 6 . 0 0 25.20 2 1 . 2 0 3 0 . 5 5 4 4 . 2 6 40 .50 MANUFACTURING PROJECTS 0 . 0 0 0 . 0 0 0 .20 0 . 3 0 0 . 4 0 0 . 3 0 0 .30 NEW PLANT/EXCESS CAPACITY 0 . 0 0 0 .40 0 .50 0 .60 0 .60 4 . 5 0 0.20 NEW PRODUCT EXP 2.00 2 .30 8 .80 6 .20 2 . 4 0 1.00 1.00 OTHER RECOVERIES 0 .00 1 .50 1 . 7 0 0 . 7 0 0 .70 0 . 7 0 0.80 VARIANCES 0 . 0 0 0 .00 0 . 0 0 0.00 0 . 0 0 0 . 0 0 0 .00 VALUE ADD CALCULATED 24.40 3 0 . 2 0 36 .40 29.00 3 4 . 6 5 46 .76 42.80
E x h i b i t 6 : The Volume S p e n d i n g P o r t i o n of a R e s o u r c e P l a n
39
BIBLIOGRAPHY
1. Alter, S., Decision Support Systems: Current Practice and Continuing Challenges, Reading, Mass.: Addison-Wesley, 1979.
2. Beil, D. H., The Visicalc Book, Reston, Va.: The Reston Publishing Co., 1983.
3. Eliasson, G., Business Economic Planning, Swedish Federation of Industries, 1976.
4. Hayes, P. J., Ball, J. E., and Reddy, R., "Breaking the Man-Machine Barrier," Computer, V. 14, No. 3, 1981.
5. Malhotra, A., Design Criteria for a Knowledge-Based English Language System for Management: An Experimenfal Analysis, PhD Thesis, Sloan School of Management, MIT, 1975.
6. Sprague, R. H., "Decision Support Systems", Database, V. 12, Nos. 1 & 2, Fall 1980.
7. Wright, M., and Fox, M. S., "SRL/1.5 User Manual", Intelligent Systems Laboratory, The Robotics Institute, Carnegie-Mellon University, 1982.

Namc: Knowledge-based Support Systems for Long
Range Planninp
Donald W. Kosy and Vasant Dhar Author (s)
Submitted by:
Rcfcrccd by: Mark Fox
. . , -\ * ,
8/9/81 , r. . . Status: 1. < w n s
3.
Technical Kcport Number: CMU-RI-TR- 2 /

KNQWLEDGE-BASED SUPPORT SYSTEMS
FOR
LONG RANGE PLANNING
Donald W. Kosy arid Vasant Dhar
Intelligent Systems Laboratory The Robotics Institute
Carnegie-Mellon University Pittsburgh, Pennsylvania 15213
13 December 1983
Abstract: Long range planning is the process by which an organization asscsses its future environment and develops specific plans of action to respond to, or change, that environment to achieve its goals. This report presents the results of a study of long range planning practices at one plant of a large U.S. computer firm, focusing on current and potential decision support systems (DSSs) for the quantitative aspects of the planning process. While it appears that the clerical tasks in the process can be computerized using current DSS technology, this technology does not help managers evaluate the credibility or quality of the plans made. An architecture is described for a system incorporating a much richer store of knowledge about planning variables which would allow the system itself to validate, explain, and justify its results. A concrete realization of such a system, called ROME, has been designed and is currently under development. Design goals for ROME are presented and potential uses of the system are illustrated.
Copyright @ 1983 CMU Robotics Institute
This research was sponsored by the Eastern Electronics Systems Company.