knowledge acquisition from sensor data in an equine - doras
TRANSCRIPT

Knowledge Acquisition from Sensor Data in anEquine Environment?
Kenneth Conroy1, Gregory May1, Mark Roantree2, Giles Warrington1, SarahJane Cullen3, and Adrian McGoldrick4
1 CLARITY: Centre for Sensor Web Technologies2 Interoperable Systems Group, School of Computing
3 School of Health & Human Performance, Dublin City University, Dublin 9, Ireland4 The Turf Club, The Curragh, Co. Kildare, Ireland
Abstract. Recent advances in sensor technology have led to a rapidgrowth in the availability of accurate, portable and low-cost sensors. Inthe Sport and Health Science domains, this has been used to deploymultiple sensors in a variety of situations in order to monitor participantand environmental factors of an activity or sport. As these sensors oftenoutput their data in a raw, proprietary or unstructured format, it is diffi-cult to identify periods of interest, such as events or actions of interest tothe Sport and Exercise Physiologists. In our research, we deploy multiplesensors on horses and jockeys while they engage in horse-racing train-ing exercises. The Exercise Physiologists aim to identify events whichcontribute most to energy expenditure, and classify both the horse andjockey movement using basic accelerometer sensors. We propose a meta-data driven approach to enriching the raw sensor data using a series ofProfiles. This data then forms the basis of user defined algorithms todetect events using an Event-Condition-Action approach. We provide anEvent Definition interface which is used to construct algorithms basedon sensor measurements both before and after integration. The result en-ables the end user to express high level queries to meet their informationneeds.
1 Introduction
Given the widespread nature of sensor networks and sensor technology, andthe high volumes of data generated on an ongoing basis, it is inevitable thatdata warehousing and knowledge discovery will be adopted as key technologiesfor end users and domain experts to improve their abilities in data analysis,decision support, and the automatic extraction of knowledge from data. In manyapplication areas, the volume of data gathered in a single experiment is toogreat to extract any meaningful knowledge as end users must manually extractdata from spreadsheets for simple queries. Where database type solutions mayhave been used in the past [2], sensor network data management will demandthe type of functionality available in data warehouses [6, 8]. The continuous
? This work is supported by Science Foundation Ireland under grant 07/CE/I1147

2 Authors Suppressed Due to Excessive Length
refinement of query expressions that is taken for granted in data mining is notpossible when using the raw data generated by sensors. However, the wide rangeof sensor devices together with the low level nature of data offers new challengesto data warehouse researchers as they seek to build generic solutions to the issuesprovided by sensor networks. Different domains will bring different requirementsand associated issues. In all cases, one feature is common: the significant gapbetween the abstract queries of domain specialists and the data which theyare processing. This paper presents a system to narrow this gap in order thatspecialist users can fully exploit the data gathered by their sensor networks.
Paper Structure. The paper is structured as follows: in the remainder ofthis section, we provide the background which motivates this work and providea statement of our contribution; in §2, we provide a discussion on state of theart; §3 details the profile-based Semantic Enrichment process; in §4, we presentour modular approach to complex event detection; in §5 we present our exper-iments and an evaluation in terms of high level user queries; and finally in §6,we conclude the paper.
1.1 Background and Motivation
A recent collaboration with the Irish Turf Club [16], the regulatory body forhorse-racing in Ireland, provided us with an extensive set of data from sensorsdeployed on multiple horses and jockeys in training. The sensors include mul-tiple accelerometers (Actilife GT3X, Crossbow) mounted on a horse simulatorand jockey. These sensors measure: rates of change in direction in uniaxial andtriaxial (x,y,z) planes; a Cosmed K4b2 metabolic system [5] measuring a varietyof physiological factors from the jockeys breathing; a SenseWear [12] armband,which estimates energy expenditure; and a Garmin GPS system for outdoor tri-als. Each of these devices has its own format, ranging from plaintext to XMLcompliant sensor output.
Depending on the distance that the jockey is racing, there are many differentfactors that can predict competitive performance with predictors that can bephysiological, environmental, or equipment specific. By sensing changes in phys-iological factors, environmental conditions, and equipment and how they affecteach other, it is possible to gain a greater understanding of the demands of bothracing and training. This could potentially allow for the development of targetedtraining sessions to investigate aspects of race performance. By capturing racespecific data and comparing it to data generated using the horse simulator, itmay be possible to see if training addresses the needs of racing and competing.This is not possible without a warehouse-style system that is capable of com-bining data from each sensor used to monitor the event as well as utilising userdefined information on the event and participant, and measuring over a periodof time.
The sports physiologists involved in this research have identified key eventsthat must be determined for knowledge acquisition. These events are then in-corporated into high level queries that extract the new knowledge and are nowdescribed.

Knowledge Acquisition from Sensor Data in an Equine Environment 3
– SimSpeed. This event classifies the speed at which the horse-simulatormoves. It changes the energy demands of jockeys as they try to maintain arace position under great speeds. It has five movement stages, each represent-ing change in gait of the horse; walking, trotting, cantering, fast-canteringand galloping. A combination of GT3X Accelerometer and Activity Profileare used to identify these stages.
– Energy Expenditure(EE)-Est. Estimates the amount of energy expendedfor the amount of time spent in each of the simulator stages. This is asimplified estimation, used when specialist equipment is not available and isbased on participant anthropometrics and accelerometer data.
– Energy Expenditure(EE)-Calc. Calculates the amount of energy ex-pended during each of the simulator stages based on physiological data cap-tured at the same time using other sensors. Data can be more accuratelycalculated based on breath-by-breath data from a portable metabolic gasanalysis system (Cosmed K4b2 metabolic system). Data can also be calcu-lated from existing algorithms on portable heart-rate monitoring systems(Garmin, Polar, Cardiosport).
– Whipping. During the final stages of a race, jockeys use a hand held whipto drive the horse to greater speeds. Although jockeys are predominately onehanded they need to be able to do this with both hands under different racingconditions. Sensing these events is based on three GT3X Accelerometers, oneon each of the jockeys wrists, and another located on the saddle.
– Jockey Pushing Out. Usually occurring towards the end of a race, thejockey is in dynamic imbalance, positioned in a state of forward propulsion,crouching in order to minimise wind resistance, and encourage the horseto maintain speed. This is discovered using information from GT3X Ac-celerometers located on the chest, and the sacroiliac joint, and by ensuringthe corresponding values are also associated with a level 4 Speed - fast canter.
The advances in sensor technology have resulted in significant changes in theways in which scientists can gather data. In the horseracing domain, the focusis primarily on the health and condition of the horse. However, decreasing theenergy expended by the jockey during the early parts of a race may result ingaining a competitive edge when pushing out at the end of a race. No standardway of measuring the energy expenditure of jockeys during horse-racing exists,and thus, no specialised systems to understand this data are in place. As aresult, the domain experts seek to calculate energy expended and define otherhorse-related events from a deployment of multiple sensors. Due to a lack of acommon standard amongst the sensors deployed, a data management frameworkfor defining events and acquiring knowledge is required.
Contribution. In this paper, we extend the EventSense framework pre-sented in [3] with a new process to extract knowledge from multiple sensorsources. We begin with a metadata driven approach to structural and semanticenrichment using a series of Profiles. We then expand our event detection mech-anism to a 3-Tier format: basic event detection; event detection based on resultsof other defined events; and events definitions based on data integrated from

4 Authors Suppressed Due to Excessive Length
multiple sources and new event definitions. The modular nature of the eventdefinition allows the end user greater control and flexibility in defining eventsand thus, acquiring different forms of knowledge.
2 Related Research
In [15], the authors present the Semantic Sensor Web (SSW), an approach toannotating sensor data with semantic metadata to improve interoperability andprovide contextual information required for knowledge discovery. They leverageSensor Web Enablement (SWE) [14] and Semantic web standards to do so. Meta-data referring to time, space and theme is included as they extend SWE to havemore expressive information based on ontological (OWL)[17] representations.Semantics are defined using RDFa [10] with SWRL [11] based rules defined todeduce new ontological assertations. The resulting rule-based assertations allowfor extended query and reasoning within the sensor domain. While we also usethe SOS[13] and O&M[9] components, our approach is more lightweight, withour event definitions not requiring substantial knowledge of programming orcomplex specification language. In [7], the SSW approach is extended to illus-trate the advantages of semantic annotation of SOS services, focusing on a deepanalysis of sensor data to discover important environmental events.
The authors of [20] present a framework for sensor data collection, manage-ment and exchange conforming to the SWE standard. They have deployed theirsystem for an environmental monitoring purpose, which involves the integrationof multiple sensors. Unlike our approach, context applied to the data is limitedto location, with additional context requiring the development of applicationsthat access the data. While they support remote access to multiple sensors, itis not designed to be deployed in an environment with legacy sensors transmit-ting in various formats, or storing information locally. Their approach containsno facility for defining rules for detecting events, other than cross-correlation ofmultiple sensors measuring similar properties.
In [1], they present an approach to sensor discovery and fusion by semanti-cally annotating sensor services with terms from a defined ontology representingan environmental monitoring setup. Their main goal is to aid in the detectionof natural disasters. The sensors used are static and have relationships definedby the ontology. A Geosensor Discovery Ontology (GDO) is defined, specify-ing a taxonomy of sensor observations, geographic objects and substances. Likeour approach, they use a lightweight method to provide added meaning, keepingcomplexity low in order to maintain usability by end-users from a non-computingbackground. Information is discovered based on rules defining semantic require-ments, location and timepoints. Usability is provided using a GUI. Sensor fusionis performed by a Joint Server Engine (JSE) which takes user input and trans-lates it into SOS requests. The data is then merged, removing duplicates andnormalisation is performed during the process. However, the system structurecannot be altered by the creation of interrelated event definitions to define anddetect more interesting events, a necessary requirement in our system.

Knowledge Acquisition from Sensor Data in an Equine Environment 5
3 Context and Knowledge Representation
In [3], we introduced the EventSense framework with Profiles used to automatethe imposition of structural semantics to raw sensor data. Here, we will showhow the same concept can be easily extended to the new domain of horse rac-ing. The goal is to demonstrate how basic knowledge is represented and this isfundamental to our mining activities, presented in the next section.
3.1 Context Data
The task of defining the context is split into two constructs, an Activity Profilewhich is built for each activity (such as horse-racing) and consists of standardinformation such as the start and end time and the location, and some non-standard activity specific information. The sports physiologists are interested inactivity-based effects on energy expended by the jockey. This requirement caninvolve complex calculations and algorithms to detect these events, as well asthe inclusion of some external contextual information. For instance, knowledgeof the weather at the time of deployment and the terrain is useful information todetermining why performance was not optimal for a certain deployment. Whilethere exist sensors to identify this information, it is often not feasible to doso. As a result, a broad range of manually recorded information is observed byscientists as the deployment of sensors is ongoing. It is this information whichis included in an Activity Profile as optional context. A sample Activity Profilefor an indoor deployment of a jockey on a simulator is shown in Example 1.
Example 1. Sample Activity Profile: Horse-Racing (Simulator)
<HorseRacing-Sim><aid>1</aid><start_time>12:30:00</start_time><end_time>13:30:00</end_time><date>2010-03-10</date><location>indoor</location><jockey>subject1</jockey>...
</HorseRacing-Sim>
Further knowledge is encoded in a Participant Profile. This information isprimarily anthropometric data measured infrequently by Sport and ExercisePhysiologists as they typically do not alter greatly over time. In addition tothese standard values, common across all domains, domain specific informationis included where necessary, such as a specific multiplier for some algorithmmeasuring energy expenditure. In Example 2, we show the anthropometric datafor ’Participant ID (pid) 1’, the EE-Est multiplier figure, and other domain-based information such as jockey class (trainee). As with the Activity Profile,queries can be made on this information following integration, and they can byused as parameters in the formation of event detection rules.
Example 2. Sample Participant Profile: Jockey

6 Authors Suppressed Due to Excessive Length
<Jockey><pid>1</pid><gender>male</gender><height>170.6</height><weight>68</weight><age>22</age><BMI>23.53</BMI><jockey_type>trainee</jockey_type><horse>Sim3</horse><horse_weight></horse_weight><horse_height>15</horse_height>...
</Jockey>
3.2 Sensor Representation
A Sensor Profile must be defined for each sensor type, to model the structureof the sensor data. Each sensor is assigned a Profile detailing the fields cor-responding to sensor values and instructions to standardise the data format.This includes information relating to which timing protocol is used, and howthis is converted to a system standard. For example, some sensors record theirtimestamps as a fraction of a minute, others in milliseconds. These must bestandardised in order to aid in the process of merging multiple data sources.
Example 3. Sample Sensor Profile: GT3X Accelerometer
<GT3XAccelerometer><sid>2</sid><time_format>ms</time_format><sample_rate>30</sample_rate><Granularity_min>0.033333</Granularity_min><Granulatity_max>0.033333</Granularity_max><field_formats>int, int, int</field_formats>...
</GT3XAccelerometer>
Example 3 shows a sample Sensor Profile for a GT3X Accelerometer. Thisshows the fields recorded, assigns them tag names, and details the sample rateand timing format used. It provides the basic structure and layout for a sensorsoutput, but in order to make sense of the information, we must use contex-tual information. We do this by merging the sensor data with the Activity andParticipant Profile information, discussed next.
3.3 Imposing Context on Sensor Data
The process of merging static context with dynamic sensor data uses a combina-tion of Java and the XQuery Update Facility [19]. Currently, we perform integra-tion based on the sensor timestamps and granularity constraints and ContextualProfile information, but this research is ongoing. Due to the different samplingrates of devices, there are often many more records for one device over some in-terval as for another device. For instance, the GT3X Accelerometer monitors theenvironment at 30Hz, whereas the Heart Rate monitor samples once per second.We take the approach of averaging values where appropriate and leaving blank

Knowledge Acquisition from Sensor Data in an Equine Environment 7
spaces where averaged values do not correspond to real world conditions. Forinstance, averaging the following and preceding values of Heart Rate is appro-priate in all experiments. However, averages for accelerometers cannot be used.We identify these constraints with the Sensor Profile, where the granularity min
and max ensure the system does not create data outside acceptable limits. Ourmotivation for this paper was to determine if key events could be accuratelydetected, and if these events could be used in query expressions. A more holisticintegration process will be presented as part of future work.
4 Knowledge Acquisition
Knowledge acquisition in EventSense is based on events defined by the specialistend user events. EventSense provides the ability to build event detection algo-rithms using sensor data, context profiles, functions and nested events. Eventsare modular in nature, and we classify them as Tier 1, 2 or 3 depending on theirstructure. The Tier classification corresponds to the inclusion of pre-conditionrequirements for some events prior to definition.
– The most basic events are Tier 3, which consist of a single sensor whosevalues match a specified condition, and may include Activity and ParticipantProfile knowledge.
– A Tier 2 event can contain other events (ie. their results) within its condi-tion component and therefore, must also explicitly state the pre-conditionrequired to execute the current event detection. This pre-condition is theevent definition for detecting the property involved in the condition.
– A Tier 1 event definition can include both the results of previous events andany number of sensor data (i.e. all sensor data available after integration).
The use of a 3-tier system allows us to define a number of relatively basicevents which can be combined to form more complex events. To allow Tier 1and 2 event definitions, it was necessary to extend our original architecture [3].It is now possible to specify additional operators, standardise the pre-conditionelement, perform integration of information sources and model how events relateto each other. The remainder of this section details the structure of the basicevent detection module (Tier 3), describes the grammar and operators of thesystem and details how we use the results obtained from these modules to buildup more advanced event detection modules (Tier 1 and 2), thus illustrating thepower integrated data can provide the user.
4.1 Pre-Integration Event Detection
Tier 3 events, which are the building blocks for more advanced events, are gen-erally defined to discover a large amount of single-sensor based events on verylarge sources of information. For instance, the GT3X Accelerometer accessed inExample 4 has 108,000 data values for each hour of deployment. Pre-processingthis information to detect some event (a ’fast-cantering’ horse in this case) allows
8 Authors Suppressed Due to Excessive Length
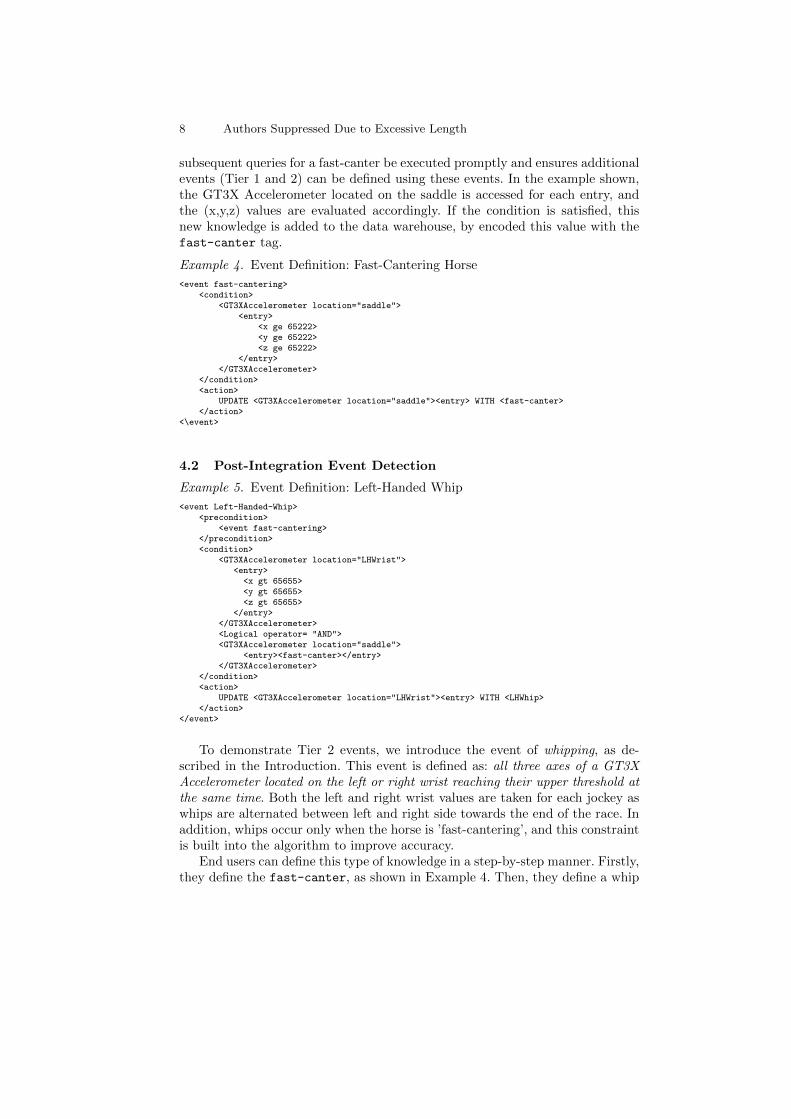
subsequent queries for a fast-canter be executed promptly and ensures additionalevents (Tier 1 and 2) can be defined using these events. In the example shown,the GT3X Accelerometer located on the saddle is accessed for each entry, andthe (x,y,z) values are evaluated accordingly. If the condition is satisfied, thisnew knowledge is added to the data warehouse, by encoded this value with thefast-canter tag.
Example 4. Event Definition: Fast-Cantering Horse
<event fast-cantering><condition>
<GT3XAccelerometer location="saddle"><entry>
<x ge 65222><y ge 65222><z ge 65222>
</entry></GT3XAccelerometer>
</condition><action>
UPDATE <GT3XAccelerometer location="saddle"><entry> WITH <fast-canter></action>
<\event>
4.2 Post-Integration Event Detection
Example 5. Event Definition: Left-Handed Whip
<event Left-Handed-Whip><precondition>
<event fast-cantering></precondition><condition>
<GT3XAccelerometer location="LHWrist"><entry>
<x gt 65655><y gt 65655><z gt 65655>
</entry></GT3XAccelerometer><Logical operator= "AND"><GT3XAccelerometer location="saddle">
<entry><fast-canter></entry></GT3XAccelerometer>
</condition><action>
UPDATE <GT3XAccelerometer location="LHWrist"><entry> WITH <LHWhip></action>
</event>
To demonstrate Tier 2 events, we introduce the event of whipping, as de-scribed in the Introduction. This event is defined as: all three axes of a GT3XAccelerometer located on the left or right wrist reaching their upper threshold atthe same time. Both the left and right wrist values are taken for each jockey aswhips are alternated between left and right side towards the end of the race. Inaddition, whips occur only when the horse is ’fast-cantering’, and this constraintis built into the algorithm to improve accuracy.
End users can define this type of knowledge in a step-by-step manner. Firstly,they define the fast-canter, as shown in Example 4. Then, they define a whip

Knowledge Acquisition from Sensor Data in an Equine Environment 9
occurring on either side (a definition for Left-handed-whip and Right-handed-whip), and finally a generic whipping definition which combines the results ofleft/right whip. Both the left and right whip events involve knowledge previ-ously discovered by prior events. These are the <fast-canter> tags includedin updates. It is therefore necessary for the left and right whip event definitionsto specify the fast-canter event definition as a pre-condition. This means thefast-cantering event definition must be defined and executed prior to execut-ing either the left or right whip event detection. The structure of the left handedwhip event is shown in Example 5. Similarly, in the generic whipping event def-inition, shown in Example 6, the left and right whip events are pre-conditions.
Example 6. Event Definition: Whipping
<event Whipping><precondition>
<event Left-Handed-Whip><event Right-Handed-Whip>
</precondition><condition>
<GT3XAccelerometer location="LHWrist"><entry><LHWhip></entry>
</GT3XAccelerometer><Logical operator = "OR"><GT3XAccelerometer location="RHWrist">
<entry><RHWhip></entry></GT3XAccelerometer>
</condition><action>
UPDATE <GT3XAccelerometer location="saddle"><entry> WITH <whip></action>
</event>
The Tier 2 definitions illustrate the combination of event results requiredto evaluate more complex events. We extend the functionality of our previoussystem to include the NOT and XOR functions, in addition to the AND andOR previously defined.
Tier 1 events can contain multiple sensor output, each of a different type, andalgorithms can contain functions combining values from these sensors to extractmore complex knowledge. In Example 7, we show a prototype calculation forenergy expenditure (EE-Calc). In this example, data from a Cosmed metabolicsystem and an accelerometer are used to compute a new measure and updatean entry with the computed value. This mining process is ongoing: the team ofdomain experts are now in a position to refine threshold values as their analyticalprocedures progress.
Example 7. Event Definition: Energy Expenditure Calculation (Prototype)
<event EE-Calc><precondtion>
<event SimSpeed><event fast-cantering>
</precondition><condition>
<GT3XAccelerometer location="saddle"><entry><SimSpeed eq 3></entry>
</GT3XAccelerometer>

10 Authors Suppressed Due to Excessive Length
<Logical operator= "AND"><Cosmed><entry><EEm gt 0></entry></Cosmed><Logical operator= "AND"><FnCalc-EE>
<&result gt 0></FnCalc-EE>
</conditon><action>
UPDATE <Cosmed><entry><EE-Calc-Sum> WITH <value>&result</value></action>
</event>
5 Experiments and Evaluation
Experiments were run on a 2.66GHz Intel Core2 Duo CPU server with 4GB ofRAM. The sensors were deployed on a jockey while on a Horse Simulator, asshown in Figure 1. As part of our evaluation, we measure query times for iden-tifying the events pre-defined by the sport scientists. We also measure the timetaken to enrich the information both structurally and with the event-definitioncontext.
GT3X Accelerometer
COSMED
SenseWear Armband
Crossbow Accelerometer
Fig. 1. Indoor Simulator Training
Table 1 shows sample event detection times, run following the executionof the event definitions. The instances of whipping represent entries matchingthe criteria given in the event definition. The numbers correspond to entries,which in the case of the GT3X Accelerometer is 0.03333 of a second. Afterexperiments, it was discovered that the average duration of a whip is 0.5 seconds(or 15 instances). Analysing a ground-truth for the data concerned (ground

Knowledge Acquisition from Sensor Data in an Equine Environment 11
Events Filename Size Values Query Time Results
1 Fast-Cantering GT3Xsaddle.xml 8.12MB 108,009 56ms 13,353
2 Left Whip leftwrist.xml 7.22MB 108,009 51ms 210
3 Right Whip rightwrist.xml 7.08MB 108,009 53ms 45
4 Whipping GT3Xsaddle.xml 8.12MB 108,009 55ms 13,353
Table 1. Sample Event Queries and times
Event Filename Enrichment Time
1 Fast-Cantering GT3Xsaddle.xml 13,450ms
2 Left Whip leftwrist.xml 12,221ms
3 Right Whip rightwrist.xml 11,902ms
4 EE-Est > 90% Cosmed.xml & HeartRate.xml 1,498ms
Table 2. Sample Enrichment Times
truth analysis was performed using video in as many circumstances as possible),confirmed that there were 3 right whip events, and 14 left whip events, as shownin the query result set.
A prior experimental run resulted in the (incorrect) discovery of 4 right whipevents and 20 left whip events, a total of seven false positives. It was realised thatother jockey movements were identifed to be whip movements. This event detec-tion evolved to include the use a new fast-cantering constraint. Including thisconstraint and the knowledge that a whip can only occur during a fast-canter,resulted in removing these false positives (one right hand whip, and six left handwhips). This illustrates how the Sports Physiologists are now in a position to al-ter their needs using event definition modules to improve accuracy. As the testedjockeys were trainees, they are not allowed to gallop. For any other jockey, thisevent would be replaced with a Gallop event.
For completion, we show a sample of contextual enrichment times in Table 2.The time is the total accumulated from converting raw sensor data to low-levelstructured information and then to high-level event-rich information. As yet,we have not performed any optimisation on the transformation process, as themotivation was to enable users to define and detect complex requirements fromsemantically poor information. The main evaluation comes from our collabora-tors who can now define their requirements in the form of events and extractnew knowledge.
6 Conclusions
In this paper, our goal was to reduce the gap between the requirements of ourcollaborators and the sensors recording movement data on Horse Simulators. Weextended the EventSense framework with a new process to extract knowledgefrom multiple sensor sources. We described our metadata driven approach tostructural and semantic enrichment using Sensor and Contextual Profiles. Wethen introduced our new event detection mechanism in its 3-Tier format: basic

12 Authors Suppressed Due to Excessive Length
event detection; event detection based on results of other defined events; andevents definitions based on data integrated from multiple sources and new eventdefinitions. The modular nature of the event definition allows the end user greatercontrol and flexibility in defining events and thus, acquiring different forms ofknowledge. Our experiments have shown how this approach is evaluated andis providing benefit to the end user. Our current work is based on integration,utilising the timing and granularity constraints along with synchronisation tech-niques and algorithms, to extend the knowledge acquisition capabilities evenfurther.
References
1. Babitski, G., Bergweiler, S., Hoffmann, J., Schon, D., Stasch, C., Walkowski, A.(2009), Ontology-Based Integration of Sensor Web Services in Disaster Manage-ment in Proc. of the 3rd International Conference on GeoSpatial Semantics (GeoS),Springer-Verlag, pp. 103-121.
2. Bonnet, P., Gehrke, J., Seshadri, P. (2001), Towards Sensor Database Systems inMobile Data Management (MDM ’01), Vol. 1987, Springer-Verlag, pp. 3-14.
3. Conroy, K., May, G., Roantree, M., Warrington, G. (2011), Expanding Sensor Net-works to Automate Knowledge Acquisition. To Appear in British National Confer-ence on Databases (BNCOD), LNCS, Springer-Verlag.
4. Corrales, J. A., Candelas, F. A., Torres, F. (2010) Sensor data integration for indoorhuman tracking in Robotics and Autonomous Systems, Vol. 58, Issue 8, pp. 931-939.
5. Cosmed (2011), http://www.cosmed.it/6. Da Costa, R. A. G., Cugnasca, A. E. (2010), Use of Data Warehouse to Manage
Data from Wireless Sensors Networks That Monitor Pollinators in 11th InternationalConference on Mobile Data Management (MDM), IEEE Computer Society, pp.402-406
7. Henson, C. A., Pschorr, J. K., Sheth, A. P., Thirunarayan, K. (2009), SemSOS:Semantic sensor Observation Service in International Symposium on CollaborativeTechnologies and Systems (CTS), pp. 44-53
8. Marks, G., Roantree, M., Smyth, D. (2011), Optimizing Queries for Web GeneratedSensor Data. in Australasian Database Conference (ADC), Australian ComputerSociety, Inc., pp. 151-159
9. Observations and Measurements (2011), http://www.opengeospatial.org/standards/om10. Resource Description Framework in attributes (RDFa) (2011),
http://www.w3.org/TR/xhtml-rdfa-primer/11. Semantic Web Rule Language (2011), http://www.w3.org/Submission/SWRL/12. SenseWear System (BodyMedia) (2011), http://sensewear.bodymedia.com/13. Sensor Observation Service (2011), http://www.opengeospatial.org/standards/sos14. Sensor Web Enablement (2011), http://www.opengeospatial.org/projects/groups/sensorweb15. Sheth, A. P., Henson, C. A., Sahoo, S. S. (2008), Semantic Sensor Web. in IEEE
Internet Computing Vol. 12, IEEE Computer Society, pp. 78-8316. The Irish Turf Club (2011), http://www.turfclub.ie/site/17. Web Ontology Language (2011), http://www.w3.org/TR/owl-features/18. XQuery (2011), http://www.w3.org/TR/xquery/19. XQuery Update Facility (2011), http://www.w3.org/TR/xquery-update-10/20. Yang, J., Zhang, C., Li, X. Huang, Y., Fu, S. Acevedo, M. F. (2010), Integration
of wireless sensor networks in environmental monitoring cyber infrastructure inWireless Networks Vol. 16 Issue 4, Springer Netherlands, pp. 1091-1108