kirtland afb, a nonaxisymmetric - nasa · · 2013-08-31an experimental investigation of a...
TRANSCRIPT
. -
NASA ' T P
1188 c.1
NASA Technical Paper 1188 1
--I " - 0 -= =r: D = m p-3
- = -
$=% 1c-g
+m % & = H r y I q 4 ~ 1 = = E Experimental and Analytical \KIRTLAND AFB, I
Investigation of a Nonaxisymmetric Wedge Nozzle at Static Conditions
- 4 m=
C w Y t R q Lnm TI II) -"
George T. Carson, Jr., and Mary L. Mason
JULY 1978
NASA
https://ntrs.nasa.gov/search.jsp?R=19780018166 2018-06-14T16:35:26+00:00Z

TECH LIBRARY U F B . NM
NASA Technical Paper 1188
Experimental and Analytical Investigation of a Nonaxisymmetric Wedge Nozzle at Static Conditions
George T. Carson, Jr., and Mary L. Mason Langley Research Center Humpton, Virginia
National Aeronautics and Space Administration
Scientific and Technical Information Office
1978
SUMMARY
An experimental investigation of a nonaxisymmetric wedge nozzle has been con- ducted at static conditions. tions and oil flow photographs, expand the current nonaxisymmetric nozzle data base. the range of nozzle pressure rat ios in this experiment, the nozzle exhaust flow exhibits regions of predominately two -dimensional flow and regions of highly three-dimensional flow, characterized by shock waves and vortex flow.
The resulting data, in the form of detailed pressure distribu- For
An analytical investigation has been conducted to evaluate a two-dimensional, inviscid, time -dependent theory as a nonaxisymme t r i c nozzle performance predictor. Results indicate good agreement between theory and experiment in regions of predomi- nately two-dimensional flow for all nozzle pressure ratios considered. Agreement is con- siderably weaker in the regions of three-dimensional flow, especially at the higher nozzle pressure ratios. When three-dimensional effects are minimized by the flow character- ist ics, the agreement between theory and experiment improves; agreement remains opti- mal at the lower nozzle pressure ratios. Such resul ts indicate that, fo r the wedge nozzle and related nozzle configurations, the two-dimensional, inviscid theory may be applied as a limited performance predictor.
INTRODUCTION
Multimission jet a i rcraf t must operate effectively over a wide range of Mach num- bers and power settings. nozzles. fo r high internal performance. As a result , the axisymmetric nozzle has generally been implemented in the multiengine jet a i rcraf t design. However, the integration of multiple nozzles with the airf rame resu l t s in a complex aft-end flow field, which can produce an aft-end drag problem. In addition, the multiengine jet a i rcraf t design gen- erally requires a large boattail "gutter" interfairing between the engines o r the nozzles. This interfairing increases the drag problem, especially in the case of separated flow near the nozzle exit (refs. 2 and 3).
Such aircraf t require high-performance propulsion exhaust Conventional axisymmetric nozzles are lightweight and use a variable geometry
(See ref. 1.)
The effects of such adverse interference may be minimized by the use of nonaxisym- metr ic wedge nozzle designs. inate the boattail "gutter" interfairing and, thus, reduce the adverse drag effects. ref. 4.)
Proper integration of a nonaxisymmetric design can elim- (See
This nozzle a lso has the advantage of efficient in-flight thrust-reversing o r
thrust-vectoring capabilities, unavailable in the conventional axisymmetric nozzle. ref. 5.) of the wedge nozzle compares favorably with that of axisymmetric nozzles at transonic and supersonic speeds.
(See Preliminary research has indicated that the isolated aeropropulsive performance
(See refs. 6 and 7.)
The available data base fo r nonaxisymmetric nozzle research is drawn from analy- sis of isolated and integrated nozzle designs (refs. 6 to 10). A small par t of the data base includes pressure measurements and internal flow properties. (See ref. 11.) However, the data consist primarily of force measurements, which represent the nozzle aeropro- pulsive performance in t e r m s of thrust and drag. addition of pressure measurements and internal flow field characterist ics to the present data base. In this investigation, an isolated, nonaxisymmetric wedge nozzle has been tested extensively at static conditions. measurements for the internal flow field and the exhaust jet. Oil flow photographs provide additional flow field characterist ics. currently limited data base. An increased understanding of the flow phenomena is essen- tial in the development of adequate prediction techniques.
The objective of this experiment is the
The resulting data consist of detailed pressure
Such data types a r e necessary for expanding the
In addition to this experimental investigation, an analysis has been performed to
(See ref. 12.) A general, accurate prediction evaluate the use of a two-dimensional, time-dependent, inviscid theory as a nonaxisym- metr ic nozzle performance predictor. theory is essential for the development of high-performance nonaxisymmetric nozzles at minimum cost. Comparison of the experimental data and the analytical results evaluates the application of the theory as a predictor model under static conditions.
SYMBOLS
2 nozzle throat area, cm *t
b width of trailing edge of nozzle wedge, cm
cT thrust coefficient, T/AtptYj
(k center line
C crown (keel) line, cm (see fig. 3)
D maximum nozzle diameter, cm
d half-breadth line, cm (see fig. 3)
2

I? length of wedge f rom throat to trailing edge, cm
P local static pressure, Pa
atmospheric pressure, Pa Pa
jet total pressure, Pa Pt,j
r nozzle internal radius, cm
T thrust, N
X distance along model center line from nozzle throat, positive downstream, cm
Y vertical distance f rom plane passing through nozzle throat and center line, cm
Z lateral distance f rom plane passing through nozzle throat and center line, cm
77 order of superellipse equation
e angular component of (r, 6 ) polar coordinate system, rad (see fig. 3)
Abbreviations:
NAP computer program f o r computation of two-dimensional, time -dependent, inviscid nozzle flow
SAE Society of Automotive Engineers, Inc.
MODEL
The experiment was conducted using the base line, dry power configuration of the nonaxisymmetric wedge nozzle discussed in reference 6. of the model installed fo r static testing. centerbody geometry and the nozzle internal area distribution.
Figure 1 contains a photograph The main features of this nozzle are the wedge-
Figure 2 gives the nozzle assembly dimensions and the wedge geometry. Duct- wedge c ross sections of the internal flow area are given in the figure for the regions upstream of the leading edge of the wedge, at the leading edge, and at the geometric throat of the nozzle. The internal flow geometry is characterized by a transition f rom a circle
3

upstream of the wedge to a superellipse, a rectangular geometry, at the nozzle throat. The transition section is illustrated in figure 3. A detailed discussion of the transition and superellipse geometry is given in the appendix.
APPARATUS
The experimental investigation was conducted in the static tes t stand of the Langley
The air control system is similar; 16-foot transonic tunnel. tunnel. it includes valving, f i l ters , and heat exchange facilities. also similar to that of the 16-foot transonic tunnel, is based on a 100-channel magnetic tape system.
The air supply system is the same as that of the transonic Reference 1 3 describes this facility in detail.
The data acquisition system,
Figure 4 contains a photograph of the static tes t simulation system in the static tes t stand. An external high-pressure air system provided the air supply. air at a controlled stagnation temperature of 300 K entered a high-pressure chamber through six supply lines in the nozzle support. The flow of high-pressure air ran perpen- dicular to the model axis. p ressure plenum. Air passed f rom the low-pressure plenum to the nozzle tailpipe to simulate jet exhaust flow f rom the nozzle exit.
Dry, heated
From the high-pressure chamber, the flow entered the low-
Instrumentation
This investigation included measurements of surface static pressure, jet total pres- sure , jet total temperature, and air mass-flow rate. The pressure values were recorded by seven multiple pressure scanning transducer units. A thermocouple was used to mea- sure the jet total temperature in the low-pressure plenum. An electronic turbine flow- meter was used to record the mass flow of the high-pressure air. The pressure and temperature in each air supply line were also measured before the flow discharged into the low-pressure plenum.
The original model (ref. 6) was modified to include 286 pressure orifices, each 0.1016 cm in internal diameter. Rows of orifices were placed along the surface of the wedge, along the inner right sidewall of the cowl, and inside the top of the cowl. Each of these areas held three orifice rows. Most of the row positions can be seen in figure 1. Specific Cartesian coordinates of the pressure orifices, as well as diagrams of their loca- tion on the model, are given in table I.
On the nozzle wedge, all three orifice rows ran in the axial direction, with 0.635 cm between the successive orifices. One row was placed along the center line on the bottom of the wedge. The second row was placed along the left quarter span on top of the wedge.
4

The third row, also on top of the wedge, was located along the extreme right edge of the wedge sidewall.
Internal pressure orifices were placed along the top inside of the cowl. The rows r a n in the axial direction, with 0.635-cm spacing between the orifices, as on the wedge. One row was placed along the axial center line; another ran along the left quarter span. The third row was placed along the inside of the upper left sidewall corner, with an incli- nation of approximately 45' f rom the center of the plane of the wedge.
Internal pressure orifices were placed horizontally along the right sidewall of the cowl up to the leading edge of the wedge. One row ran along the sidewall center line; the spacing between orifices in this row was 0.635 cm. The remaining two rows were placed 2.45 cm above the center line and 2.45 c m below the center line, respectively. Spacing in these rows was 1.27 c m between orifices.
Tes ts
Two types of experimental data were obtained: pressure distributions and oil flow
For the oil flow data, the orifices on photographs. p ressure ratios f rom 1.5 to 6.0, a t 0.5 increments. the wedge were sealed, and the top of the wedge was painted black. For each nozzle pres- sure ratio, the wedge was covered with a thin coat of SAE 140 oil, and a high-speed photo- graph of the oil flow pattern was taken. As a secondary oil flow data system, a video tape of the developing and final flow field was made at each nozzle pressure ratio.
The nozzle pressure distributions were determined for a range of nozzle
Experimental Data and Discussion
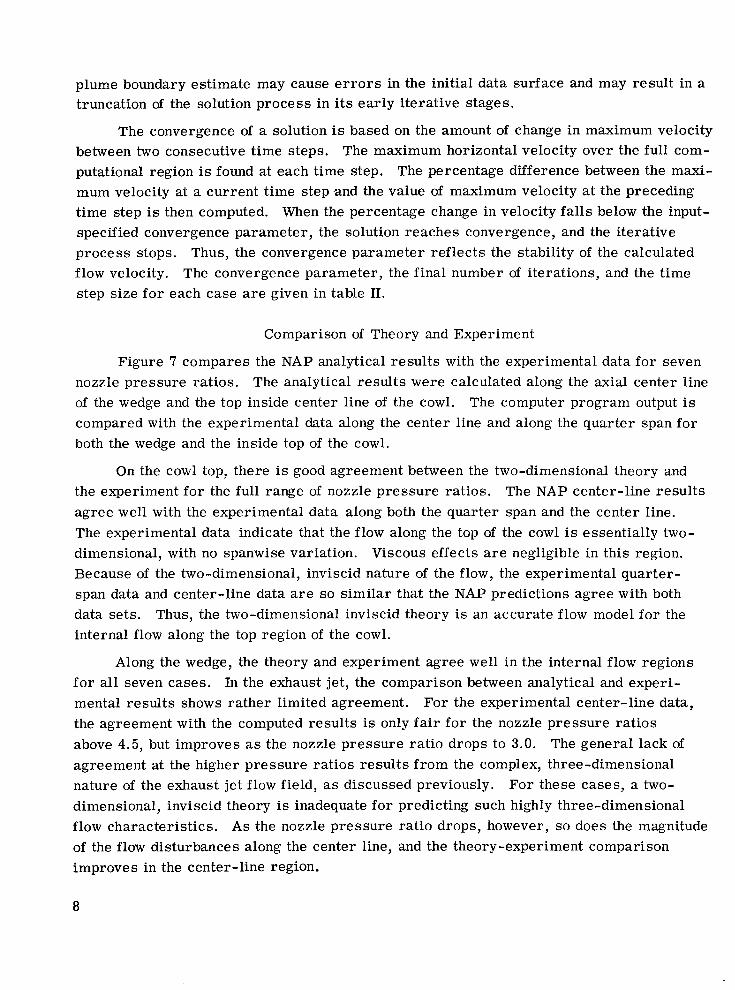
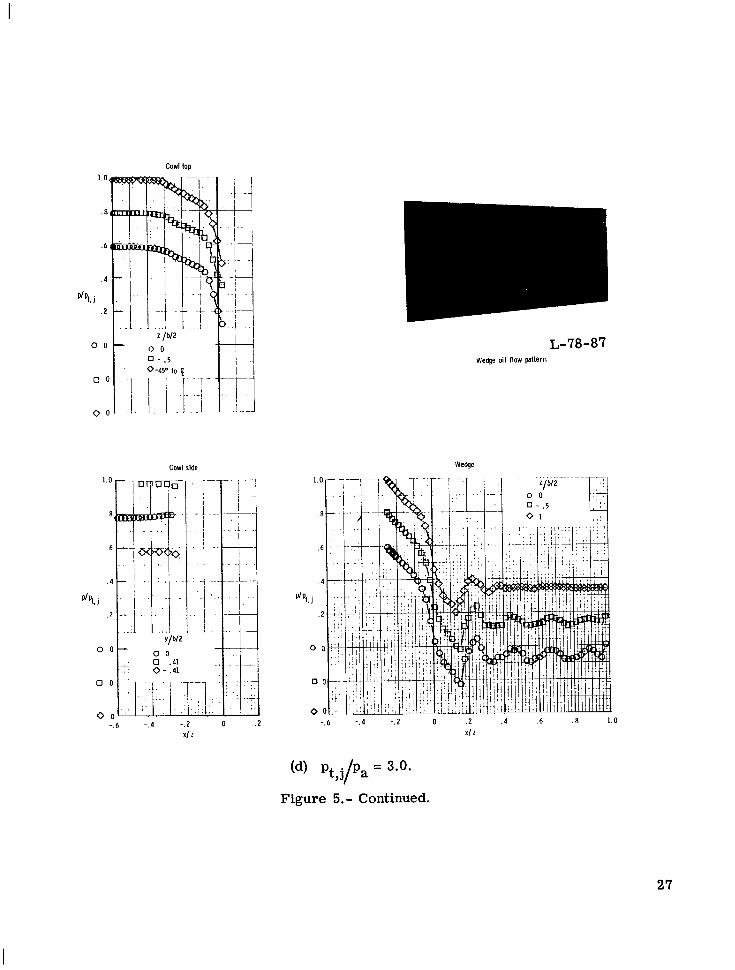
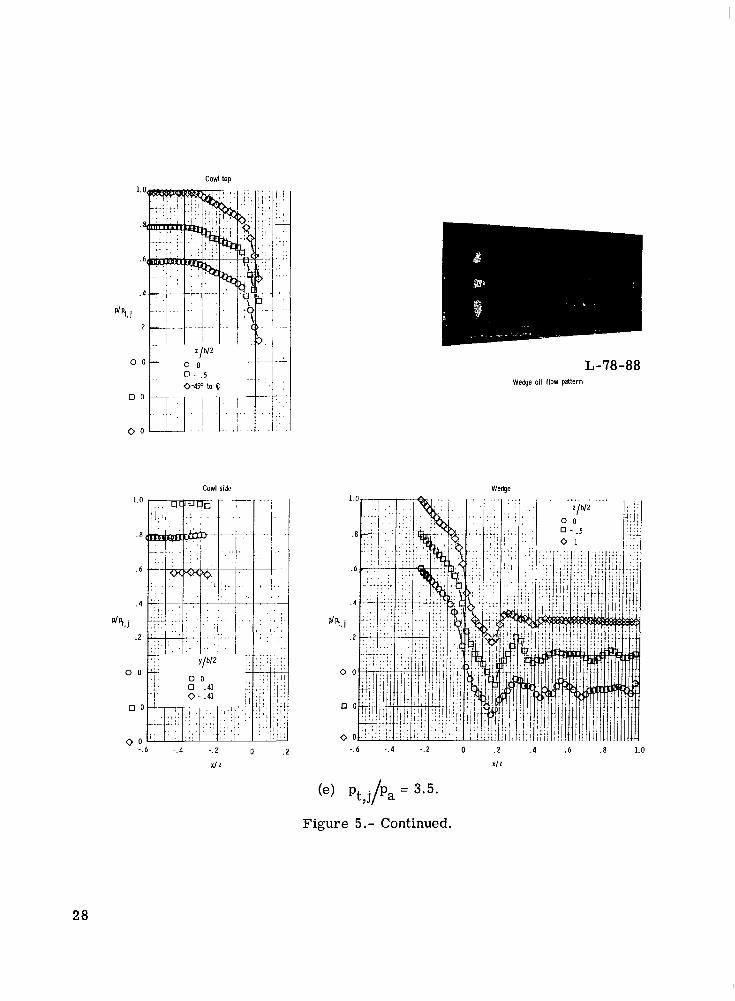
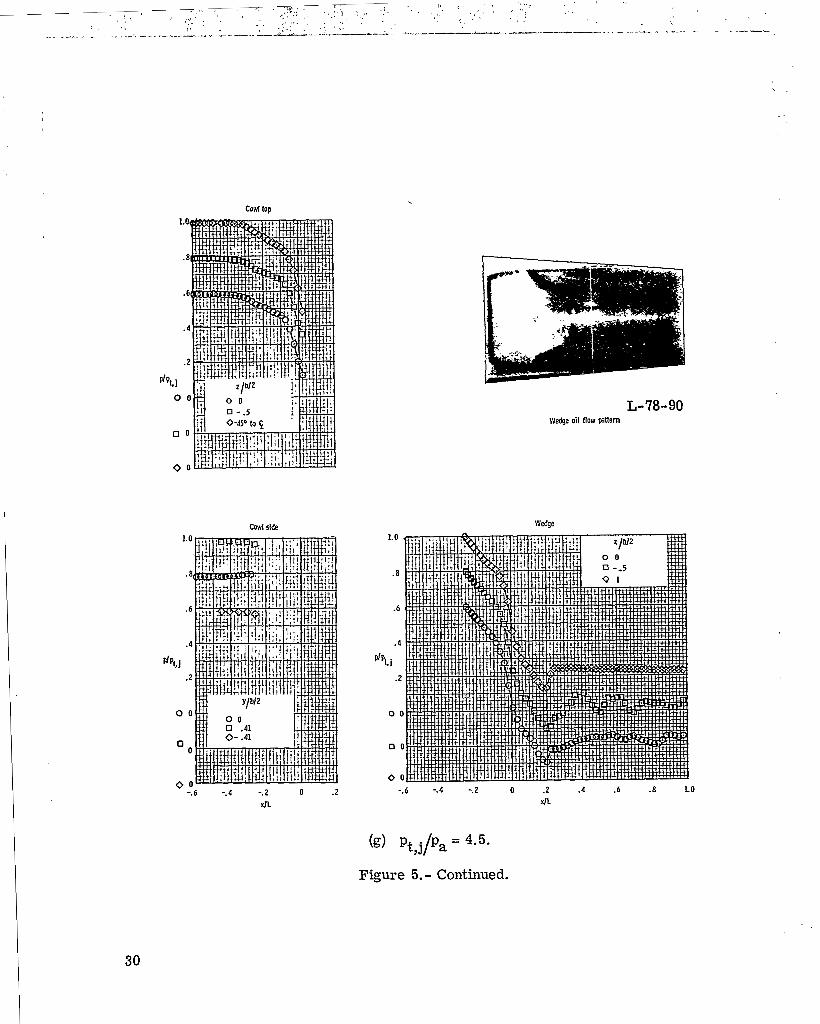
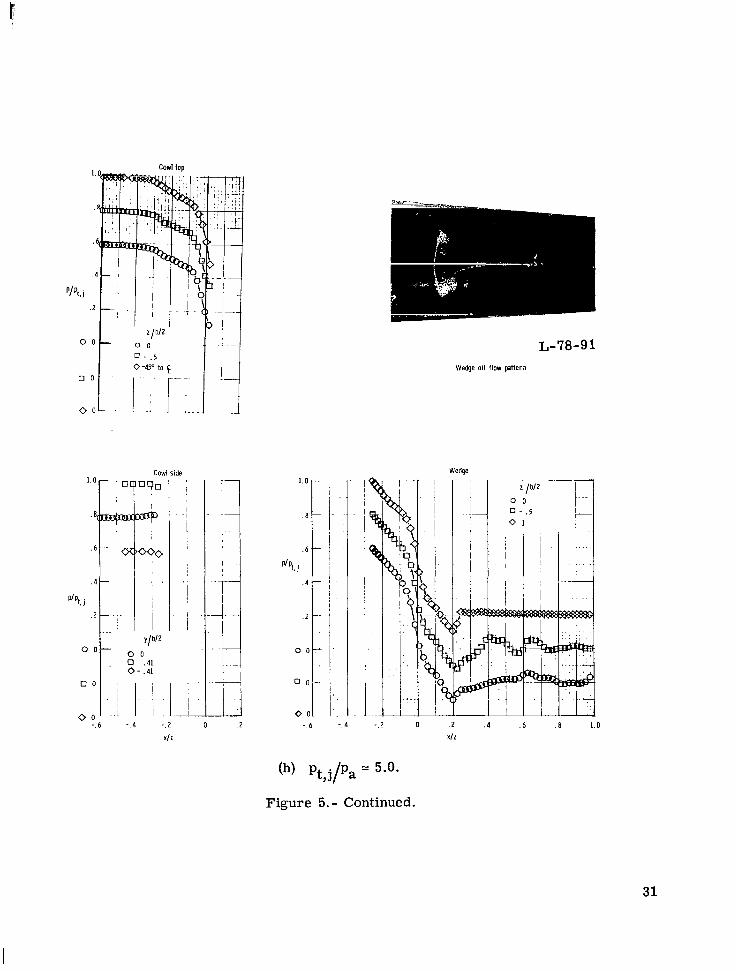
The pressure distributions and the oil flow photographs for the complete range of P res su re data are plotted as the ratio of local
The oil flow photographs a r e scaled to the hori-
experimental data a r e given in figure 5. p ressure to jet total p ressure against the nozzle length, nondimensionalized by the distance f rom the throat to the end of the wedge. zontal axis of the data plots.
The pressure distributions and oil flow photographs describe internal flow character- istics at each experimental nozzle pressure ratio. The resu l t s are discussed for each of the three data acquisition regions on the nozzle: internal right sidewall, and along the wedge.
along the internal cowl top, along the
Cowl top.- Along the top of the cowl, the internal pressure distribution is essentially the same for the range of nozzle pressure rat ios investigated. the lowest nozzle pressure rat io of 1.5. slightly downstream of the geometric throat, but ahead of the nozzle exit. nificant spanwise variation indicates that the flow is essentially two-dimensional in this region.
The flow chokes even at The crit ical p ressure rat io of 0.528 occurs
A lack of sig-
5

Cowl right side.- Along the right side of the cowl, the pressure distribution far upstream lies in the stagnation chamber of the nozzle. The downstream measurements in this region are in the vicinity of the leading edge of the wedge. On the center orifice row, the pressures increase slightly as the wedge is approached. This increase in pres - su re results f rom the reduction in velocity which occurs as the flow approaches the stag- nation region of the wedge. Along the top and bottom rows, the pressures decrease slightly, reflecting an increase in the subsonic velocity as the flow moves into the con- verging area of the nozzle. These flow patterns remain s imilar for the full range of experimental nozzle pressure ratios.
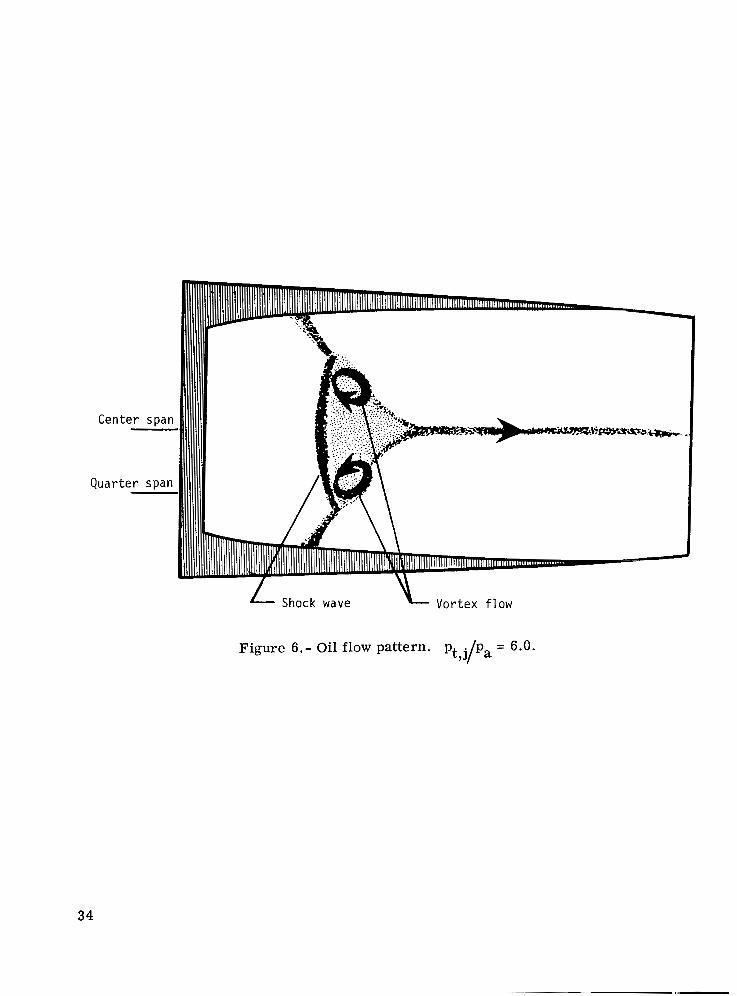
Wedge.- Along the surface of the wedge, the pressure distributions upstream of the nozzle exit are s imilar for all 10 nozzle pressure rat ios investigated. The rat io of local pressure to jet p ressure begins near unity upstream and decreases to the cri t ical pres- su re ratio of 0.528 at the throat. In the upstream region and in the throat area, the flow is quasi two-dimensional, as has been discussed earlier. However, downstream of the throat and nozzle exit, the flow becomes three-dimensional, particularly for nozzle pres- sure ratios greater than 2.0. Three-dimensional flow patterns are illustrated by the data plots and oil flow photographs for the higher nozzle pressure rat ios in figure 5. The pressure distributions, oil flow photographs, and video tape data were analyzed to deter- mine the basic three-dimensional flow characterist ics. A diagram of the dominant flow characterist ics apparent a t a nozzle pressure ratio of 6.0 is given in figure 6. The single flow characterist ic which is evident a t nozzle pressure rat ios above 2.0 is a strong shock wave just downstream of the nozzle exit. The flow field observations indicate that turbu- lence effects due to the shock resul t in counterrotating vortex flow on either side of the wedge center line, slightly downstream of the shock. At the higher nozzle pressure ratios, apparent flow disturbance downstream indicates that a weaker secondary shock may occur downstream, in the vicinity of the trailing edge of the wedge. The pressure distribution near the wedge sidewall is essentially the atmospheric pressure, indicating a possible layer separation in this region.
The shock waves and vortex flow define three-dimensional flow along the wedge, downstream of the nozzle exit. center line for the higher nozzle pressure ratios. Viscous effects tend to decrease the magnitude of the pressure gradient along the center line in the vicinity of shock waves. As a result , the pressure variation is minimal along the center line. However, away from the center line, the viscous effects become weaker and exert limited influence on the magnitude of the pressure gradients. As a result , l a rger changes in pressure occur away f rom the center line, as illustrated by the variation in the wedge data at the higher nozzle pressure ratios.
Three-dimensional effects are dominant along the wedge
(See fig. 5.)
6
In summary, the flow through the nonaxisymmetric wedge nozzle may be divided into two regions, one of essentially two-dimensional flow and one of three-dimensional flow. Flow through the nozzle cowl is quasi two-dimensional until it passes the throat. For all experimental nozzle pressure ratios, the flow choked at this point. Downstream of the cowl, the jet flow along the wedge becomes highly three-dimensional. The domi- nant characterist ics of the flow in this region include a strong shock wave and counter- rotating vortex flow.
ANALYTICAL INVESTIGATION
A two -dimensional, inviscid, time -dependent theory was applied to the nonaxisym- metr ic wedge nozzle as a potential predictor of the nozzle performance. been incorporated in the development of a computer program (NAP) which calculates inter- nal nozzle flow and jet exhaust plume for steady converging, converging-diverging, and plug nozzle configurations (ref. 12). Internal flow may be specified as either axisymmetric o r two-dimensional.
This theory has
The external flow velocity is zero.
The computer code incorporates the two-dimensional equations of motion in noncon- servative form. interior mesh points are calculated by a MacCormack finite-difference scheme, a two- step predictor-corrector. second-order reference plane method of characterist ics. Shock waves are modeled using a "shock smearing" technique which incorporates an explicit artificial viscosity t e rm with numerical smoothing. temperature, density, and pressure for grid points spanning the internal and external jet flow areas.
A geometric computational grid spans the entire flow area. The
The boundary mesh points, inlet and exit, are computed by a
For this analysis the program output w a s generated as velocity,
The exhaust jet plume boundary and thrust values were also calculated.
To evaluate the two-dimensional theory as a nonaxisymmetric nozzle performance
The internal flow characterist ics and the jet plume boundary and predictor, the computer-generated resul ts were compared with the experimental data discussed previously. flow characterist ics were calculated using the wedge configuration under two-dimensional conditions. Since the experiment w a s conducted at static conditions, no external flow specification was necessary. Results are presented for seven cases; these cases range f rom nozzle pressure rat ios of 3.0 to 6.0, at 0.5 increments. Analytical flow was not cal- culated below the nozzle pressure ratio of 3.0, since limitations in the computer code inhibit the flow velocity f rom returning to subsonic levels once it has become supersonic.
Several input parameters are important in achieving a stable solution with an accept-
The theory is also sensitive to an input initial estimate of able level of accuracy. A convergence parameter controls the total number of iterations and the stability of the solution. the exhaust jet boundary in those cases which require a jet calculation. An inaccurate jet
7
plume boundary estimate may cause e r r o r s in the initial data surface and may result in a truncation of the solution process in its ear ly iterative stages.
The convergence of a solution is based on the amount of change in maximum velocity between two consecutive time steps. The maximum horizontal velocity over the full com- putational region is found at each time step. The percentage difference between the maxi- mum velocity at a current time step and the value of maximum velocity at the preceding t ime step is then computed. When the percentage change in velocity falls below the input- specified convergence parameter, the solution reaches convergence, and the iterative process stops. Thus, the convergence parameter reflects the stability of the calculated flow velocity. The convergence parameter, the final number of iterations, and the time step size f o r each case are given in table II.
Comparison of Theory and Experiment
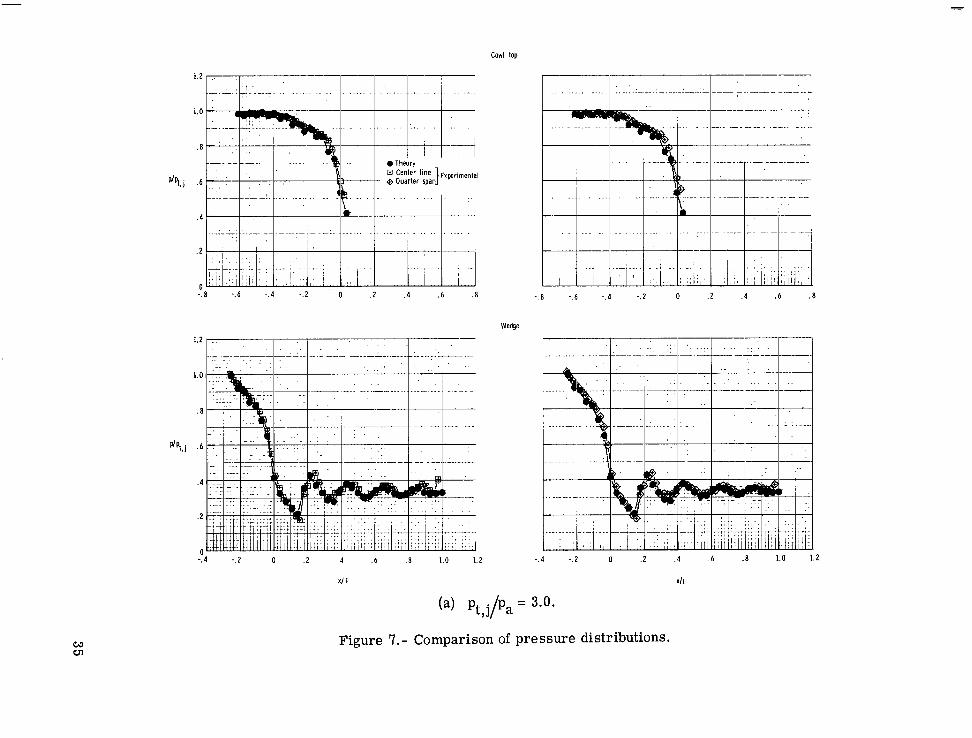
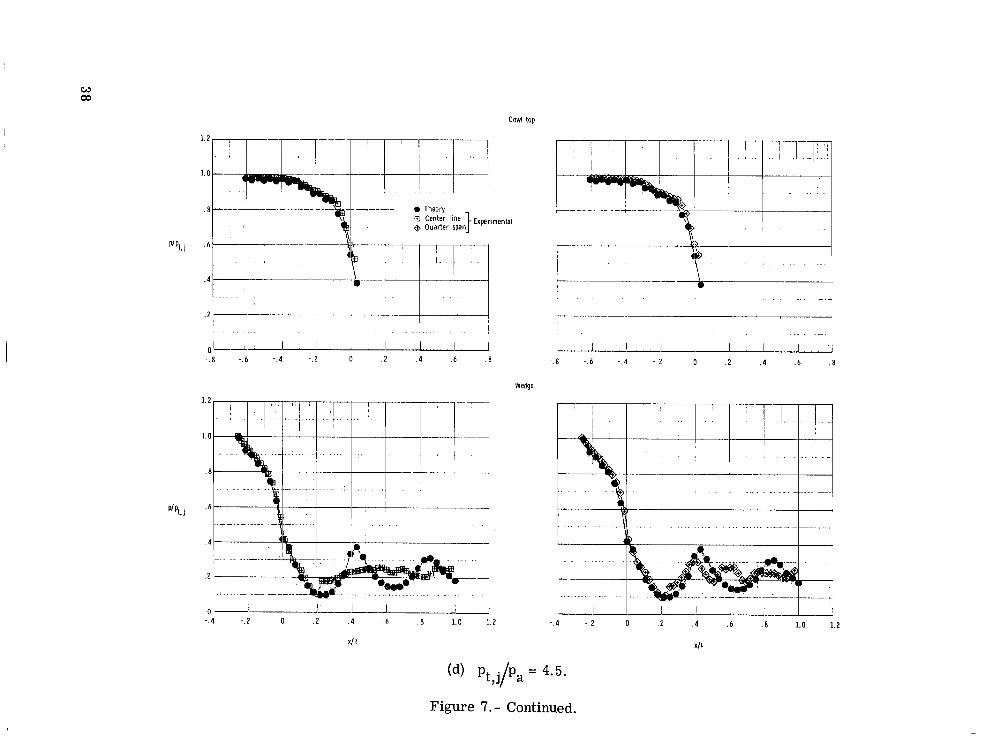
Figure 7 compares the NAP analytical resul ts with the experimental data for seven nozzle pressure ratios. The analytical results were calculated along the axial center line of the wedge and the top inside center line of the cowl. The computer program output is compared with the experimental data along the center line and along the quarter span for both the wedge and the inside top of the cowl.
On the cowl top, there is good agreement between the two-dimensional theory and the experiment for the full range of nozzle pressure ratios. agree well with the experimental data along both the quarter span and the center line. The experimental data indicate that the flow along the top of the cowl is essentially two- dimensional, with no spanwise variation. Viscous effects are negligible in this region. Because of the two-dimensional, inviscid nature of the flow, the experimental quarter- span data and center-line data are so s imilar that the NAP predictions agree with both data sets. Thus, the two-dimensional inviscid theory is an accurate flow model for the internal flow along the top region of the cowl.
The NAP center-line resu l t s
Along the wedge, the theory and experiment agree well in the internal flow regions
For the experimental center-line data, fo r all seven cases. mental resul ts shows rather limited agreement. the agreement with the computed resul ts is only fair for the nozzle pressure rat ios above 4.5, but improves as the nozzle pressure rat io drops to 3.0. agreement at the higher pressure rat ios resul ts f rom the complex, three-dimensional nature of the exhaust jet flow field, as discussed previously. For these cases, a two- dimensional, inviscid theory is inadequate fo r predicting such highly three-dimensional flow characterist ics. A s the nozzle pressure ratio drops, however, so does the magnitude of the flow disturbances along the center line, and the theory-experiment comparison improves in the center-line region.
In the exhaust jet, the comparison between analytical and experi-
The general lack of

The analytical resul ts and the quarter-span experimental data for the jet region show better agreement than the center-line comparisons, except at the higher nozzle pressure ratios. dominate the entire jet region. At the lower nozzle pressure ratios, the viscous effects tend to damp out the strong shock effects, so that the three-dimensional flow character- istics along the quarter span diminish in magnitude. Since the flow is more two dimen- sional in these cases, the resu l t s of the two-dimensional, inviscid theory compare favorably with the quarter-span data.
For the higher pressure ratios, the strong three-dimensional effects
In addition to the pressure distributions, analytical g ros s thrust values were calcu- lated for all seven nozzle pressure ratios. imental data for the wedge nozzle, which are presented in reference 6. and analytical resul ts are given in figure 8 as thrust coefficients at each nozzle pressure ratio. The coefficients of the ideal isentropic gross thrust, as calculated in reference 6, are also plotted. The predicted thrust coefficients generally lie between the ideal and experimental values. However, agreement is rather inconsistent, reflecting the lack of agreement in certain experimental and analytical pressure distributions, as discussed previously. limited. thrust o r discharge coefficient, as is discussed briefly in reference 1 2 .
These predictions were compared with exper- The experimental
Thus, for the wedge nozzle, the theoretical thrust prediction is rather Results for other types of nozzles indicate an improvement in prediction of
The two-dimensional, inviscid, time-dependent theory is a good performance predictor for the wedge nozzle in the internal regions where flow is essentially two- dimensional. In regions of three-dimensional flow, the theory gives reasonable approx- imations to the flow field character is t ics at lower nozzle pressure ratios, where the viscous effects are minimized. At higher nozzle pressure ratios, the theory is inade- quate for prediction of highly three-dimensional flow. Thus, for the wedge nozzle and s imilar configurations, the two-dimensional, inviscid theory may be applied as a limited performance predictor of internal and jet flow characterist ics.
CONCLUSION
An experimental investigation of a nonaxisymmetric wedge nozzle has been con- The resulting detailed pressure distributions and oil flow ducted at static conditions.
photographs expand the current nonaxisymmetric data base, which consists primarily of thrust and drag data. In addition, an analytical investigation has been made to evaluate a two-dimensional, inviscid, time-dependent theory as a nonaxisymmetric nozzle perform- ance predictor. In the regions of two-dimensional nozzle flow, the analytical resul ts agree well with the experimental data for the fu l l range of nozzle pressure rat ios under investigation.
9

In regions of three-dimensional flow, the theory predicts the basic flow character- ist ics of the real data; the agreement of theory with experiment is optimum at the lower nozzle pressure ratios, where three-dimensional effects are minimum. Results indicate that for the wedge nozzle and similar designs, the two-dimensional, inviscid, time- dependent theory may be applied as a limited performance predictor of internal and jet flow characterist ics.
Langley Research Center National Aeronautics and Space Administration Hampton, VA 23665 May 2, 1958
10

APPENDIX
TRANSITION GEOMETRY
The internal geometry of the nonaxisymmetric wedge nozzle is characterized by a region of transition f rom a circular flow area to a rectangular area. tion is illustrated in figure 3. wedge and ends at the nozzle geometric throat. superellipse, o r rectangular, geometry and the area distribution of the flow region. The c ross sections are defined by r, 8 , cy d, and r , ~ in the fo rm
This transition sec- The section begins upstream of the leading edge of the
The subsequent equations define the
1 1
The coordinates y and z may then be computed a t each x, using
y = r sin e
z = r cos Q
The duct internal geometry is based on the parameters c y d, and 77 , used in the superellipse equation. The dimensions shown in the subsequent equations define the internal duct geometry of the static tes t model. All dimensions are in centimeters.
For -17.600 I x 5 -13.830
c = 6.286
d = 6.286
q = 2.0
For -13.830 I x 5 -6.915
x + 13.830 6.915
XI =
x2 = 2
11

APPENDIX
d = 6.287 - ( 0 . 0 9 5 ) ~ ~
x + 13.830 13.830
x3 =
sin a x3 + 1.511 + 1.0
2.0 x4 = [ (
x5 = 1.0 + (2048 fi - 1.O)x4
In 2 q = - In - 0
x5
The cross-sectional area is fixed in this region. To find c , iterate
At X = -6.915
c = 6.250
d = 6.191
17 = 3.559
For -6.915 5 x I O
d = 6.191
x + 6.915 6.915
x1 =
sin 71 x1 + 1.5)l + 1
2 x2 = c c
1 2

APPENDIX
x3 = 0.75 - 0.5X2
c1 = c at (x = -6.915) = 6.2504
c = c1 + 6.2865 - cl) (x2)"3 (
x + 13.830 13.830
x4 =
sin 71 x4 + 1.5)] + 1.0
2.0 x5 = [ (
x6 = 1 + ( 2 0 4 8 f i - 1 . 0 ) ~ ~
In 2 v=- In -
x6 \Tz
For 0 5 x 5 26.505
c = 6.2865
d = 6.1913
77 = 11.0
13

RE FERE NCES
1. Schmeer, J ames W.; Lauer, Rodney F., Jr.; and Berr ie r , Bobby L.: Performance of Blow-in-Door Ejector Nozzles Installed on a Twin-Jet Variable-Wing-Sweep Fighter Airplane Model. NASA TM X-1383, 1967.
2. Reubush, David E.; and Mercer , Charles E.: Effects of Nozzle Interfairing Modifica- tions on Longitudinal Aerodynamic Characterist ics of a Twin-Jet, Variable-Wing- Sweep Fighter Model. NASA TN D-7817, 1975.
3. Maiden, Donald L.; and Berr ie r , Bobby L.: Effect of Airframe Modifications on Longitudinal Aerodynamic Characterist ics of a Fixed-Wing, Twin-Jet Fighter Airplane Model. NASA TM X-2523, 1972.
4. Maiden, Donald L.; and Petit, John E.: Investigation of Two-Dimensional Wedge Exhaust Nozzles fo r Advanced Aircraft. J. Aircraft, vol. 13, no. 10, Oct. 1976, pp. 809-816.
5. Capone, Francis J.: Supercirculation Effects Induced by Vectoring a Partial-Span Rectangular Jet. J. Aircraft, vol. 12, no. 8, Aug. 1975, pp. 633-638.
6. Maiden, Donald L. : Performance of an Isolated Two-Dimensional Variable-Geometry Wedge Nozzle With Translating Shroud and Collapsing Wedge at Speeds Up to Mach 2.01. NASA TN D-7906, 1975.
7. Maiden, Donald L.: Performance of an Isolated Two- Dimensional Wedge Nozzle With Fixed Cowl and Variable Wedge Centerbody at Mach Numbers Up to 2.01. NASA TN D-8218, 1976.
8. Martens, Richard E.: F-15 Nozzle/Afterbody Integration. J. Aircraft, vol. 13, no. 5, May 1976, pp. 327-333.
9. Capone, Francis J.; and Maiden, Donald L.: Performance of Twin Two-Dimensional Wedge Nozzles Including Thrust Vectoring and Reversing Effects at Speeds Up to Mach 2.20. NASA TN D-8449, 1977.
10. Pendergraft. 0. C.: Comparison of Axisymmetric and Nonaxisymmetric Nozzles Installed on the F-15 Configuration. AIAA Paper 77-842, July 1977.
11. Harrington, Douglas E.; Schloemer, J ames J.; and Skebe, Stanley A.: Thrust Performance of Isolated Two-Dimensional Suppressed Plug Nozzles With and Without Ejectors at Mach Numbers From 0 to 0.45. NASA TM X-3384, 1976.
14

12. Cline, M. C.: NAP: A Computer Program for the Computation of Two-Dimensional, Time-Dependent, Inviscid Nozzle Flow. LA-5984 (Contract W-7405-ENG-36), Los Alamos Scientific Lab., Jan. 1977.
13. Corson, Blake W., Jr.; Runckel, Jack F.; and Igoe, William B.: Calibration of the Langley l6-Foot Transonic Tunnel With Test Section A i r Removal. NASA TR R-423, 1974.
15

TABLE I.- PRESSURE ORIF'ICE LOCATIONS
[Coordinate sys t em is defined in fig. 23
Y / l 1 Z / l
0.024 1 -0,119 ,042 1 -.119
__ X / l
~
-0.263 -.250 -.234 -.218 -.199 -.179 -.160 -.139 -.116 -.093 -.071 -.048 -.024 0
,024 ,048 ,072 ,098 ,121 ,144 .168 ,192 ,215 ,240 ,262 ,285 ,309 ,333
- __
L X!l
, 0.351
1 .37f
(a) Cen te r l ine
-.119 -.120 -.119 -.120 -.119 - . i20 -.120 -.120 -.119 -.120 -.120 -.120 -.120
Y / l -. .0.028
-.044 -.062 -.078 -.092 - . lo7 -.118 -.130 -.141 -.150 -.158 -.164 -.169 -.170 - . l a9 -.165 -.161 -.157 -.153 -.149 -.145 -.140 -.136 -.132 -.128 -.124 -.120 -.116
I ,391
~ ,447
.5 ia
I ,423
, .47c ,494
,541 ,585 ,589
, ,613 ,836 ,660 ,884
z / l
0 0 0
0 0 0 0 0 0 0
0 0 0 0 0
,230 1 ,230 1
4 1
3.356 - 3 8 0 ,403 ,421 ,451 ,475 ,498 .522 ,545 ,569 ,593 ,617 ,640 ,664 ,688
441 :470
0 l l ,712 0 ; ,736
0 .I83 0 ,806 0 ' ,830 0 " .a54
0 , ,759
0 ! ,878
0 1 ; ,901
- .119. -.120/
- .119/
Y/1
0.112 - . l o 7 - . l o 3 -.099 - 095 -.091 -.087 -.083 - .om -.074 -.070 -.Of36 -.062 -.058 - .OS3 -.049 -.045 -.041 -.037 -.033 -.029 -.024 -.020 -.016 -.012 -.008 -.004
.Io7 ,731 ,155
z i l
0 0 0 0 0 0 0 0 0
0 0
0 0 0 0 0 0 0 0 0 0 0 0 0 0 0
0
,229 ,229 ,229 ,230
- X / l -~
0.20: -.2% -.23! -.21! -.201 -.la( -.16( -.14( -.11i -.09f - . O l d
-.051 -.02f -.oo:
.02c ,044 ,068 ,092 ,116 ,139 ,164 ,187 ,210 ,234 .258 ,283 .305 .328 _ _
683
I ,731 I .IS6
I :lo7
P r e s s u r e o r l l i ce rows a r e indicated by dashed l ines.
Wedge
fb) Left q u a r t e r span
,230. ,230: ,230 ,230, ,2291
,778 ,802 ,826 ,850 .a74
,061 .077 ,092 ,106 ,119 ,130 ,140 ,149 ,157 ,163 ,168 ,170 ,169 ,166 ,162 ,158
,150 I -.119 ,146 -.119 ,141 -.119 ,138 -.119 ,133 -.119 ,129 -.119 ,125 -.119 ,121 -.119 ,117 -.119
,802 .826 ,849 ,874 .898 .922 ,945 ,969
Y / l
0.113 . l o 9 .lo5 ,101 ,091 ,093 ,089 ,085 ,081 ,071 ,072 ,068 ,064 ,080 ,056 ,052 ,050 ,044 ,040 ,036 ,032 .028 .023 .019 .015 .011 ,008
Z / l
.0.119 -.119 -.119 -.119 -.120 -.119 -.119 -.119 -.119 -.119 -.119 -.119 -.120 -.120 -.120 - .119 -.119 -.119 -.119 -.119 -.119 -.119 -.120 -.120 -.120 -.120 -.120
- X / l
.0.263 -.251 -.236 -.220 -.199 -.181 -.159 -.I39 -.117 -.095 -.074 -.052 -.028 -.005
,019 ,044 ,068 ,092 ,115 ,139 ,163 .186 ,210 .234 ,257 ,282 ,305 ,328
-
-
Y / 1
0.024 ,044 ,062 ,077 ,094 ,108 ,120 ,130 ,141 ,150 ,158 ,184 ,169 ,171 ,110 .167 .163 ,159 ,155 ,151 ,141 ,143 ,138 ,134 ,130 ,126 ,122 ,118
(c) Right edge
.229#1 ,897
.229'1 ,921 ,229 .944
Y/2
0.114 ,110 ,108 ,102 ,098 ,094 .090 .0b6 ,082 ,071 ,073 ,069 ,065 .061 ,057 ,053 ,049 ,045 ,041 ,036 .032 .028 ,024 ,020 ,016 ,012
0.229 ,229 .22E , 229 ,229 ,230 ,229 .229 ,229 ,229 .229 ,229 ,229 ,229 ,229 ,229 ,230 ,229 ,228 228
.228
.228 ,228 ,228 ,228 ,228 ,228

TABLE I.- Concluded
Z / l
-0.182 -.I80 -.183 -.le4 -.la5 -.I85 -.I85 - 186 -.la9 - 188 -.le9 -.192 -.I91 -.I94
-E--- _--- P r e s s u r e orif ice rows are indicated
by dashed l ines .
x / 1
-0.282 -.256 -.233 -.209 -.le5 -.161 -.137 -.I13 -.OB9 - .065 -.041 -.016
,008
cow1 top
,eft quarter span
-.117
/ 1
0 0 0 0 0 0 0 0 0 0 0 0 0 0
Center line -
X / l
-0 282 -.258 -.234 -.210 -.la6 -.161 -.138 -.114 -.090 - 066 -.042 -.018 ,006
(c) Left corner
X / l
-0.469 -.419 -.372
(
Y / l
.239 ,239 ,239 ,239 ,238 ,237 ,235 ,231 ,228 ,224 ,220 .217 ,214 ,212
Y / l
-0.095 -.095 -.095
(t
Y / l
1.209 ,208 ,208 ,208 ,208 ,208 ,208 ,207 ,206 ,206 ,206 ,205 ,204 .202
X / l
.0.619 -.594 -.570 -.547 -.522 -.499 -.474 -.450 -.425 -.401 -.377 -.353 -.328 -.306
Y / l
1.211 ,211 .214 ,218 ,223 ,227 ,232 ,236 ,238 .239 ,239 ,239 ,240
- : / 1
0 0 0 0 0 0 0 0 0 0 0 0 0
-
~
X / l
-0.619 -.595 -.571 -. 546 -.522 -.499 -.475 -.450 -.425 -.402 -.378 -.354 -.329 -.303
x / 1
0.619 -.594 -.573 -.551 -.527 -.502 -.476 -.452 -.428 -.408 -.381 -.355 -.332 -.302
y / 1
1.155 ,157 ,154 ,152 ,152 ,154 ,155 156
.I56 160 ,162 ,162 ,161 ,169
? / I
0.171 ,171 ,182 ,181 ,193 ,198 ,202 ,201 .209 ,211 ,213 .213 ,213
- =/L.- 0.195 -.191 -.202 -.207 -.212 -.211 -.221 - 225 - 228 -.230 -.230 -.230 -.230
P r e s s u r e or i f i ce r o w s a r e indicated by dashed l ines .
Cowl right s ide
(a) Center line (b) Below renter line c ) Above center l ine ~~
x / I
-0.468 -.420 -.310 -.324 -.270
~
z 11
0 220 ,223 .226 ,228 .231
~
-
X / l
-0.614 -.%I -.564 -.539 -.516 -.492 -.467
i / l
0 0 0 0 0 0 0
' / 1
0 0 0 0 0 0 0 0
~
-
- Z / l
1.237 ,237 ,236 ,236 ,236 ,236 ,236 ,235
~
Y 11 ~
0.096 ,096 096 ,097 -095
~
z / 1
0.220 ,223 .226 ,228 ,231
~

TABLE 11.- CONVERGENCE CRITERIA
Convergence Pt,j/Pa parameter
3 0.005 3.5 .005 4 .005 4.5 .005 5 .006 5.5 .005 6 .007 ..
Total iterations
8175 5181 3915 3422 3441 4034 3671
~
~~
' Step size,
.79 x 10-6
.79 x 10-6
sec
0.76 x
.78 x
.78 x
.78 x 10-6
.78 x 10-6
1 8

Figure 1.- Closeup view of nozzle installed for testing.
CL W

U pst ream Leading edge Throat (no t to scale) (not to scale) , (not to scale)
, Duct-wedge &oss sectiohs 1
F- 33.436
44.104
Section A--A
(a) General design overview.
Figure 2.- Nozzle assembly dimensions. All dimensions are in cm.
20

1 - 33.436 -,I
Wedge c o o r d i n a t e s
-5.544
-2.770 -2.077 - 1.384 - .069 - .003
I . 390 26.505
Y 0.000 1.321 2.032 2.540 3.048 3.353 3.708 3.962 4.204 4.382 4.470 4.394 4.428
.ooo
(b) Two-dimensional wedge geometry.
Figure 2. - Concluded.
21
I

.,. -,.., .,,.. .,, . ... ....
7 (Inside keel line) C
(Half-breadt h line)
Figure 3 . - Transition a rea internal geometry (coordinate system is defined in fig. 2).
22

23

Cowl top
dpt, j
1.0
.8
.6
.4
.2
1.0
.8
. 6
. 4
dpt, j
.z
0 0
0 0
A "
Cowl side
L-78-84 We@ oil flow pattern
-.6 - .4 -.2 0 . 2 -.6 -.4 -.2 0 .2 . 4 .6 .8 1.0 v u
XI 1 X I 1
(a> Pt,j/P, = 1.5.
Figure 5. - Nozzle pressure distribution and corresponding oil flow pattern.
2 4

cowl top 1.0
. 8
.6
. 4
dpi, j . 2
0 0
0 0
1 /bl2 .. ' 0 0 2 0 - . 5
0 -450 to E
Wedge
L- 78-8 5 Weme oil flow pattern
Cowl side
- . 6 - .4 - . 2 o . 2 . 4 . 6 .a 1.0 XI I
(b) p p a = 2.0. t,j/
Figure 5. - Continued.
25

Cowl top
L- 78- 86 We@ 011 flow pattern
Cowl side
- .6 -.4 -.2 0 .2 . 4 . 6 . 8 1.0 XI 1
(c) Pt,j/P, = 2.5.
Figure 5. - Continued.
26
Cowl top
L-78-87 WeaJe oil flow pattern
Cowl side Wedge
- .b - . 4 -.2 0 . 2 . 4 . b . 8 1.0
x/ 1
(d) p pa = 3.0. t,j/
Figure 5. - Continued.
27
cowl top
Cowl side
0 .2
xi 1
L-78-88 Wedge oil flow pattern
Wedqe
- . 6 - . 4 -.2 0 .2 . 4 . 6 . 8 1.0
XI 1
Figure 5.- Continued.
28

Cowl top 1.0
.E
.6
. 4
.2
Cowl slde
1.0
.E
.6
. 4
dpt,j
.2
O (
0 0
0 0
I . 0 0 - ~ 0 .41 . I 0- .41
- .6 - .4 - . 2 0 . 2
XI 1
1.0
.E
. 6
. 4
p'pt. j
. 2
0 0
01
01 -.6 - .4 - . 2 0
(f) p p a = 4.0. t,i/
L-78-89 Wedge oil flow pattern
Wedge
. 4 , 6 . 8 1.0 .2 x/ 1'
Figure 5. - Continued.
29
cowl top
L- 78- 90 \'ledge oil flow pattern
Covd side
v - -.6 -.4 -.2 0 .2
X/L -.b -.4 -.2 0 .2 .4 .6 .8 LO
X/L
(€9 Pt,j/Pa = 4.5.
Figure 5. - Continued.
30
Cowl too
1.0
.8
. 6
'pt. j
. 4
.2
Cowl side 1.0
.8
.6
- -
-
-
-
L-78-91 Wedge oil flow pi iern
Wedqe
I
i --t
I
! I
I I j
,
0 0 0 - . 5 0 1 z'b'2 P
-. 4 -.2 0 . 2 . 4 . 6 .8 1.0
XI1
(h) p . pa = 5.0. t, J /
Figure 5. - Continued.
31

Cowl side
L- 78 - 92 WeaJe oil flow pattern
We6ue
-.6 - . 4 -.2 0 .2 41
. 6 - . 4 -.2 0 .2 . 4 .6 . 8 1.0 XI I
Figure 5. - Continued.
32

Cowl side
- 6 - . 4 - . 2 0 .2
Wedge
.- XI I XI I
Figure 5. - Concluded.
33
Center span
Quar ter span
A!- Shock wave Vor tex f l o w
Figure 6.- Oil flow pattern. Pt,j/Pa = 6.0-
34
Cowl top
-.8 -.6 - . 4 - . 2 0 . 2 . 4 . 6 .8 . 8 -.6 - .4 -.2 0 . 2 . 4 . 6 . 8
Wedge
- . 4 - .2 0 . 2 . 4 .6 .8 1.0 1.2 -.4 -.2 0 . 2 . 4 .6 . 8 1.0 1.2
XI 1 XI1
(a> Pt,j/Pa = 3.0.
Figure 7. - Comparison of pressure distributions.

w Q,
1.2
1.0
.8
. . . . . . . . . . . . . ... . . . . . .
. 4 I
-------+-t-! .2 -
-.8 -.6 - . 4 - . 2 0 2 . 4 .6 .8
Wedge
cow1 top
I . . . . . . . . . . . . . . . . . . . . ..................
1.2
1.0
.8
6 n
4
2
~ . . . . . . . . . . . . . . . . . . . ..
. . . . . .... . I . . . . . . . -_-
- ................ .
0 rA1,L::A. 0 .2 , 4 .6 ,8 1.0 1.2 - . 4 -.2
-.8 -.6 - . 4 -.2 0 .2 .4 .6 ,8
I I I I I I I
.......... ....
. 4 -.2 0 .2 . 4 .6 .8 1.0 1.2
Figure 7 . - Continued.

. 4
.2
0 -.4 -.2 0 . 2 . 4 .6 . 8 1.0 1.2 - . 4 - . 2 0 . 2 . 4 .6 . 8 1.0 1.2
X I 1
(4 Pt j/Pa = 4.0.
Figure 7. - Continued. W -4
w 03
Cowl top
. 4 1 -+---+-I--- I.. . . . . . . .
-.8 -.6 - . 4 - .2 0 2 . 4 .6 . 8
Wedge
1.2
1.0
.6
.2 --
0 - L - L L L - d -.4 -.2 0 . 2 . 4 .6 . 8 1.0 1.2
XI 1
I I '
i ~' I. ..............
. . . . . . . . . . . . ....
. . . . . . . . . . . . . . . . . . . . . . . . ,
- . 4 - . 2 0 . 2 . 4 .6 . 8 1.0 1.2
X / l
Figure 7. - Continued.

Cowl top
T--'--- - __I
I , I I i
.2
- 1.2 , . . . . . . . . ..
-- 1.0
, . , . . .
. . . . . . .
. . .. o f I 1 . 1 I /
.6 ' 1 -..I . ... . , , .. .
" -.4 - .2 0 . 2 . 4 .6 , 8 1.0 1.2
Wedge
I . . .. . . .9lL . _. -. . . . . . - . . . , . - . . . -
. 4 . ..*. ~
. 2
. 2
w (0
X l 1
(e> Pt j/Pa = 5.0 *
Figure 7. - Continued.
XI 1

Cowl top
I 1 t--rl .2 -- I . o l - I I I l - .8 - . 6 - . 4 -.2 0 .2 . 4 ,6 . 8
Wedge
- .4 - . 2 0 . 2 . 4 .6 .8 1.0 1.2
XI 1
++---------I
++--I 0 .2 . 4 . 6 . 8 - . 8 -.6 - .4 -.2
- .4 -.2 0 . 2 . 4 . 6 . 8 1.0 1.2
Figure 7. - Continued.

- I . 2
~
. .
0 -.8 -.6 - .4 -.2 0 . 2 . 4 .6 . 8 0 , 2 . 4 ,6 ,8 -.8 -.6 - . 4 - . 2
.2
n - .4 - . 2 0 . 2 . 4 .6 , 8 1.0 1.2
xi 1
. 4 -.2 0 . 2 . 4 .6 ,8 1.0 1.2
xi1
k> Pt,j/P, = 6.0.
Figure 7 . - Concluded.


1. Report No. NASA TP-1188
~
I 5. Report Date 4. Title and Subtitle
2. Government Accession No. 3. Recipient's Catalog No.
EXPERIMENTAL AND ANALYTICAL INVESTIGATION O F A NONAXISYMMETRIC WEDGE NOZZLE AT STATIC CONDITIONS
7. Author(s)
George T. Carson, Jr., and Mary L. Mason
9. Performing Organization Name and Address
NASA Langley Research Center Hampton, VA 23665
12. Sponsoring Agency Name and Address
National Aeronautics and Space Administration Washington, DC 20546
8. Performing Organization Report No.
10. Work Unit No. 1 505-11-23-06 I 11. Contract or Grant No.
13. Type of Report and Period Covered 4 Technical Paper
14. Sponsoring Agency Code I 1
15. Supplementary Notes
16. Abstract
An experimental investigation of a nonaxisymmetric wedge nozzle has been conducted a t static conditions. The resulting data, in the fo rm of detailed pressure distributions and oil flow photographs, expand the current nonaxisymmetric nozzle data base. An analytical investigation has been conducted to evaluate a two-dimensional, inviscid, time-dependent theory as a nonaxisymmetric nozzle performance predictor. su re ra t ios investigated, results indicate good agreement between theory and experiment in regions of predominately two-dimensional flow and limited agreement in regions of three- dimensional flow. dimensional, inviscid theory may be applied as a limited performance predictor.
For the range of nozzle p re s -
For the wedge nozzle and related nozzle configurations, the two-
7. Key Words (Suggested by Author(s))
Propulsion nozzles Nonaxisymmetric wedge nozzle NAP
18. Distribution Statement
Unclassified - Unlimited
Subject Category 02 22. Price*
-. . - - 20. Security Classif. (of this page) 1 21. "0;; Pages I Unclassified 1 $4.50
9. Security Classif. (of this report1
Unclassified
For sale by the National Technical Information Service, Springfield, Virginia 22161
. . . ..
NASA-Langley, 1978

National Aeronautics and Space Administration
Washington, D.C. 20546 Official Business Penalty for Private Use, $300
THIRD-CLASS BULK RATE
I
2 7 1U,A, 060978 S00903DS DEPT OF THE A I R FORCE AF WEAPONS LABORATORY ATTN: TECHNICAL LIBRARY (SUL) KIRTLAND AFB NPl 87117
bstage and Fees Paid National Aeronautics and Space Administration NASA451
Postal Manual) Do Not Return- POSTMASTER: If Undeliverable (Section 158
,