kinetics of tap water dechlorination and aquatic … · calcium thiosulfate dechlorination agent...
TRANSCRIPT

Kinetics of Tap Water Dechlorination and Aquatic Health Impacts of
Selected Dechlorination Chemicals
Submitted by
Bhagya N. Weerasinghe
Hon. B.Sc, University of Toronto, Canada
A thesis submitted to the Faculty of Graduate Studies and Research in partial fulfillment of the requirements for the degree of
Master of Applied Science*
Ottawa-Carleton Institute for Environmental Engineering Carleton University
Ottawa, Ontario, Canada
Copyright © 2008 B.N. Weerasinghe
The Master of Applied Science in Environmental Engineering Program is a joint program with the University of Ottawa, administered by the
Ottawa-Carleton Institute for Environmental Engineering

1*1 Library and Archives Canada
Published Heritage Branch
395 Wellington Street Ottawa ON K1A0N4 Canada
Bibliotheque et Archives Canada
Direction du Patrimoine de I'edition
395, rue Wellington Ottawa ON K1A0N4 Canada
Your file Votre reference ISBN: 978-0-494-44060-5 Our file Notre reference ISBN: 978-0-494-44060-5
NOTICE: The author has granted a nonexclusive license allowing Library and Archives Canada to reproduce, publish, archive, preserve, conserve, communicate to the public by telecommunication or on the Internet, loan, distribute and sell theses worldwide, for commercial or noncommercial purposes, in microform, paper, electronic and/or any other formats.
AVIS: L'auteur a accorde une licence non exclusive permettant a la Bibliotheque et Archives Canada de reproduire, publier, archiver, sauvegarder, conserver, transmettre au public par telecommunication ou par Plntemet, prefer, distribuer et vendre des theses partout dans le monde, a des fins commerciales ou autres, sur support microforme, papier, electronique et/ou autres formats.
The author retains copyright ownership and moral rights in this thesis. Neither the thesis nor substantial extracts from it may be printed or otherwise reproduced without the author's permission.
L'auteur conserve la propriete du droit d'auteur et des droits moraux qui protege cette these. Ni la these ni des extraits substantiels de celle-ci ne doivent etre imprimes ou autrement reproduits sans son autorisation.
In compliance with the Canadian Privacy Act some supporting forms may have been removed from this thesis.
Conformement a la loi canadienne sur la protection de la vie privee, quelques formulaires secondaires ont ete enleves de cette these.
While these forms may be included in the document page count, their removal does not represent any loss of content from the thesis.
Canada
Bien que ces formulaires aient inclus dans la pagination, il n'y aura aucun contenu manquant.

Abstract
The kinetics of seven dechlorination agents (DA) was studied to identify the efficacy of
dechlorination under variable dosage, mixing (periodic/continuous), and pH conditions
(6.5 - 8.6 and/or >9). Dechlorination reactions at lx stoichiometric dosage (mg DA/ mg
CI2) of the DAs are rapid in most cases, but not instantaneous and in some cases needed
more than stoichiometric dosage to ensure a near zero residual level (0.02 mg/L total
residual chlorine, as required by CEPA (1999)). Dechlorination kinetic analysis revealed
reactions were either pseudo-first or zero order with respect to total chlorine
concentration in solution at the lOx stoichiometric dosage and second order overall at 2 -
4x stoichiometric dosages. 48-hour aquatic toxicity tests were conducted using Daphnia
magna to identify the acute (short-term) toxicity affects of the dechlorination chemicals
over a range of concentrations (0 - 200 mg/L). Sodium sulfite and thiosulfate were found
to have the least aquatic mortality effects while hydrogen peroxide and calcium
thiosulfate had the most deleterious effects.
Key words: dechlorination kinetics, dechlorination, aquatic toxicity, sulfur salts, thiosulfates
11

Acknowledgements
I would like to take this opportunity to thank everyone who helped me in various ways to make this thesis project possible.
I would like to extend my greatest gratitude to my research supervisor, Dr. Onita Basu. Without your guidance, advice and encouragements this thesis project would not have been possible.
I would also like to thank Professor Susan Logie for keeping me motivated to write and providing me with valuable feedback on my draft reports. Thank you, Dr. Deniz Karman for your advice on the data analysis and helping me improve the quality of my research.
I also would like to acknowledge the Region of Niagara for funding the analytical equipment used in this project and Canada Colors Limited for providing me with cost information for the chemicals.
I would like to acknowledge Dr. Marie Tudoret-Chow, Environmental Engineering Laboratory Technologist, for your assistance in providing laboratory space, ordering supplies and always lending me a helping hand when assistance was needed. Thank you, Mr. Peter Mosher, Manager of Science Stores and Chemistry at Carleton University, for providing me with the initial stock of chemicals for the aquatic toxicity testing.
Also, a special thank you goes to Dr Bernard Vigneault, Program Manager at the Metals and the Environment at Natural Resources Canada, and Ms. Maureen McKeague for providing the initial Daphnia magna stock cultures and necessary procedures to maintain the cultures.
I am really grateful to Nigel De Souza for all the assistance you provided me with the dechlorination experiments.
Last but not least, I want to thank my family and those most dear to me, especially Thaminda Perera, for their support, patience and understanding throughout this project.
111

Table of Contents
ABSTRACT n
ACKNOWLEDGEMENTS m
TABLE OF CONTENTS iv
LIST OF NOMENCLATURE vi
LIST OF TABLES VII
TABLE OF FIGURES ix
1 INTRODUCTION 1
1.1 Rationale for this Study 4
1.2 Objectives 5
2 LITERATURE REVIEW 7
2.1 Dechlorination 7 2.1.1 Significance of Dechlorination 8 2.1.2 Introduction to Selected Dechlorination Chemicals 10
2.2 Selection Criteria for Dechlorination Agents in Wastewater Applications... 22 2.2.1 Chemical Dosage and Cost 22 2.2.2 Contact Time for Reaction Completion and Mixing Requirements 26
2.3 Health Impacts of Dechlorination Chemicals 29 2.3.1 Aquatic Toxicity 30 2.3.2 Human Health Effects 38
3 METHODOLOGY 44
3.1 Dechlorination Experiments: Materials and Methods 44 3.1.1 Dechlorination Agents Tested 53 3.1.2 Variables Tested 54 3.1.3 Methods of Data Analysis 57 3.1.4 List of Experiments 62
3.2 Aquatic Toxicity Testing: Daphnia Experiments 63 3.2.1 Test Organism 63 3.2.2 Test Procedure 64 3.2.3 List of Experiments 67
4 RESULTS AND DISCUSSION 69
4.1 Dechlorination Experiments 70 4.1.1 Order of Dechlorination Reactions 71 4.1.2 Impact of Tested Variables on the Dechlorination Rate 83 4.1.3 Summary of Dechlorination Results 106
4.2 Acute Toxicity Tests: Daphnia magna Experiments 109
iv

4.2.1 Toxicity of Sulfur Salts I l l 4.2.2 Toxicity of Thiosulfates 115 4.2.3 Toxicity of Hydrogen Peroxide and Ascorbic Acid 117 4.2.4 Comparison of the Acute Toxicity of the Dechlorination Agents 119
4.3 Applications in Wastewater Treatment Plant Design 125
5 CONCLUSIONS AND FUTURE WORK 133
5.1 Conclusions 133
5.2 Future Work 139
REFERENCES 141
Appendices 147
Appendix 1: NFPA Hazard Chart 147
Appendix 2: Dechlorination Agent Dosage and Cost Calculations 148
Appendix 3: Plots for Reaction Order Determination 151
Appendix 4: Plots for LC50 Determination 157
v

List of Nomenclature
AA CEPA CTS DA DI water DO EC EC50
FC HP LC50
NOEC
MSDS MWWE NFPA OEL RPM SBS SMBS
ss STS TC
Ascorbic Acid Canadian Environmental Protection Act, 1999 Calcium Thiosulfate Dechlorination Agent De-ionized water Dissolved Oxygen Environment Canada Effective Concentration: DA concentration which induces a 50% effect to the response compared to the control or response halfway between the baseline and maximum Free Chlorine Hydrogen Peroxide Lethal Concentration: the concentration that reduces the survival by 50% No Observed Effect Concentration: the highest concentration of material in a toxicity test that has no statistically significant adverse effects on the exposed organisms as compared to the controls Material Safety Data Sheet Municipal Wastewater Effluent National Fire Protection Association (United States) Occupational Exposure Limit Revolutions Per Minute Sodium Bisulfite Sodium Metabisulfite Sodium Sulfite Sodium Thiosulfate Total Chlorine
VI

List of Tables Table 1: Comparison of various wastewater disinfection options 3
Table 2: Advantages and disadvantages of selected dechlorination chemicals 21
Table 3: Stoichiometric dosages and cost of various dechlorination chemicals 24
Table 4: Potential human health effects of dechlorination chemicals 39
Table 5: Comparison of the composition of municipal wastewater effluent and the test water of this experimental study 51
Table 6: Preparation of hard water with hardness between 160 - 180 mg/L as CaC03....51
Table 7: List of experiments undertaken for each of the seven dechlorination chemicals.62
Table 8: Concentrations of DA used in 48 hours Daphnia magna mortality testing 67
Table 9: Apparent reaction orders (with respect to total chlorine concentration) and rate constants for the seven dechlorination chemicals tested at lOx stoichiometric ratio 76
Table 10: Second order reaction rate constants (L/mol.s) for the dechlorination reactions of sodium bisulfite and ascorbic acid at 2x and 3x stoichiometric dosage 80
Table 11: Second order reaction rate constants (L/mol.s) for the dechlorination reactions of sodium sulfite, metabisulfite, and sodium thiosulfate at 2 - 4x stoichiometric dosage. 80
Table 12: Dechlorination reaction rate constants obtained at various dosages of the dechlorination chemicals 92
Table 13: Calculated reaction rate constants for the various mixing regimes of sodium sulfite and ascorbic acid 94
Table 14: Calculated reaction rate constants for the various mixing regimes of sodium bisulfite, metabisulfite, and sodium thiosulfate 96
Table 15: Calculated reaction rate constants for calcium thiosulfate under various mixing regimes 100
Table 16: Calculated reaction rate constants for calcium thiosulfate under various mixing regimes 102
Table 17: Impact of mixing and solution pH on the dechlorination rate 106
Table 18: Results summary for dechlorination experiments 106
Table 19: The average dissolved oxygen (%) and pH values for the three replicates with various concentrations of sodium sulfite, bisulfite and metabisulfite 113
vn

Table 20: The average dissolved oxygen (%) and pH values for the three replicates with various concentrations of sodium and calcium thiosulfate 116
Table 21: The average dissolved oxygen (%) and pH values for the three replicates with various concentrations of ascorbic acid and hydrogen peroxide 118
Table 22: Type of aquatic toxicity caused by the dechlorination chemicals 120
Table 23: 48 hour LC50 values derived using the Graphical Method (USEPA, 2002). ..122
Table 24: Acute toxicity test results summary 123
Table 25: Calculated required reaction times for lOx stoichiometric dosages of DAs to achieve 0.02 mg/L residual with a 1, 2 and 3 mg/L initial concentration of chlorine 128
Vll l

Table of Figures Figure 1: Distribution diagram for the chlorine species HOC1 and OCT in water at various pH levels 9
Figure 2: Daphnia magna 31
Figure 3: Experimental setup 45
Figure 4: Detailed schematic of the experimental setup. Not drawn to scale 46
Figure 5: Three-blade propeller used to mix the experimental solution 47
Figure 6: DULCOMETER® D1C online continuous pH and chlorine residual analyzer..49
Figure 7: Hach® DR2800 spectrophotometer and free/total chlorine powder pillows 49
Figure 8: Culture jars in the incubator with the timed "cool-white" fluorescent light - 3 0 cm above the water surface 64
Figure 9: Measured total chlorine concentrations overtime following the addition of sodium metabisulfite to the experimental solution 71
Figure 10 (a), (b), (c): Unimolecular pseudo first order tests for sodium. Data for the 10 x stoichiometric dosage at continuous low intensity mixing and pH 6.5 - 8.5 was used in the analysis 74
Figure 11: Second order tests undertaken for the 2 - 3x stoichiometric dosages of sodium bisulfite, calcium thiosulfate and ascorbic acid 79
Figure 12: Second order tests for the 2 - 3x stoichiometric dosages of sodium sulfite, sodium metabisulfite, sodium thiosulfate and calcium thiosulfate 81
Figure 13: Second order test for the lx stoichiometric dosages of Sodium bisulfite, sodium metabisulfite, calcium thiosulfate, and hydrogen peroxide 82
Figure 14: Kinetic results for sodium sulfite, sodium thiosulfate and ascorbic acid under lx stoichiometric dosage 84
Figure 15: Kinetic data for sodium sulfite, thiosulfate and ascorbic acid under various dosages (2-4x). The solution pH was between 6.5 - 8.5 and the samples were continuously mixed at 130 RPM 85
Figure 16: Kinetic results for sodium bisulfite, metabisulfite, calcium thiosulfate and hydrogen peroxide at the lx stoichiometric dosage 88
Figure 17(a), (b): Kinetic results for the sodium bisulfite, metabisulfite and calcium thiosulfate under varying dosages (2-4x) 89
ix

Figure 18: Reaction kinetics for sodium sulfite at various mixing regimes tested 95
Figure 19: Reaction kinetics for ascorbic acid at various mixing regimes tested 95
Figure 20: Reaction kinetics for sodium bisulfite at various mixing regimes tested 97
Figure 21(a), (b) & (c): Reaction kinetics for sodium thiosulfate, hydrogen peroxide and sodium metabisulfite at various mixing regimes tested 98
Figure 22: Reaction kinetics for lOx stoichiometric dosage of sodium metabisulfite at various mixing regimes tested 99
Figure 23(a) & (b): Reaction rate constants for sodium metabisulfite and calcium thiosulfate at various mixing regimes tested 100
Figure 24: Reaction rate constants for sodium metabisulfite and sodium thiosulfate at the two pH regimes tested 103
Figure 25: Reaction rate constants for ascorbic acid at the two pH regimes tested 104
Figure 26: Reaction rate constants for sodium sulfite at the two pH regimes tested 105
Figure 27: Reaction rate constants for calcium thiosulfate at the two pH regimes 105
Figure 28: Percentage survival of Daphnia magna for various concentrations of sodium sulfite, bisulfite and metabisulfite 111
Figure 29: Percentage survival of Daphnia magna for various concentrations of the sodium thiosulfate and calcium thiosulfate 115
Figure 30: Percentage survival of Daphnia magna for various concentrations of hydrogen peroxide and ascorbic acid 117
Figure 31: Percentage survival for the control, sodium bisulfite, metabisulfite, ascorbic acid, calcium thiosulfate and hydrogen peroxide. Sodium sulfite and sodium thiosulfate were omitted as these chemicals did not cause any significant changes to the percentage survival 120
Figure 32: Percentage survival data for Daphnia magna for the 2 mg/L concentration of the seven dechlorination agents 130
Figure 33: Percentage survival data for Daphnia magna for the 20 mg/L concentration of the seven dechlorination agents 131
Figure 34 : Percentage survival data for Daphnia magna for the 200 mg/L concentration of the seven dechlorination agents 132
x

Chapter 1 1 Introduction Municipal wastewater effluents (MWWEs), one of the largest single effluent discharges
(by volume) in Canada (Environment Canada (EC), 2001), was estimated to be 14.4
million m /day of treated wastewater in 1999 (EC, 2001b). Prior to treatment, MWWE
contains a noxious mix of human waste, suspended solids, debris, and a variety of
chemicals from residential, commercial and industrial processes (EC, 2001b). MWWE
not only contains toxic compounds and material that will lead to a high dissolved oxygen
demand in receiving waters, but it also contains disease-causing microorganisms (eg E.
Coli) that could potentially be harmful to humans. Consequently, the wastewater effluent
is treated and disinfected to minimize its impact on the aquatic environment. The
purpose of disinfection is to remove pathogenic microorganisms, using a variety of
chemical and physical disinfectants, prior to discharging the water into natural water
bodies. Disinfection of the effluent is an essential step in maintaining good water quality
of fresh water bodies that support aquatic species, contact and non-contact recreation, or
1

serve as a source of potable water. Chlorine is the most popular disinfectant for
wastewater treatment facilities across North America, because of its effectiveness in
achieving the desired microbial inactivation at a low cost and due to its wide availability.
The Canadian Environmental Protection Act, 1999 (CEPA 1999), declared chlorinated
municipal wastewater effluents as toxic to aquatic biota, and identified the effluent as a
priority for risk management action. As a result, chlorine in the disinfected wastewater
effluent is required to be less than 0.02 mg/L as CI2 by 2010. In order to meet this
regulatory requirement, there are two main options available for the wastewater treatment
facilities: neutralize or remove the chlorine in disinfected wastewater using common
dechlorination chemicals or carbon adsorption (USEPA, 2000), or switch to another
disinfectant method such as ultraviolet (UV) treatment or ozonation. However, the UV
treatment could be costly due to high energy consumption as a result of high absorbance
of UV light by wastewater (Macauley et ah, 2006), and suspended particles in wastewater
could reduce the effectiveness of UV disinfection and increase the required dosage (Loge
et ah, 1999; Parker & Darby, 1995). Ozonation is currently not a preferred option by
wastewater treatment facilities because ozone is expensive to produce, requires on-site
generation and immediate use, and has high operational and maintenance costs (EPA
Victoria, 2002). The advantages and disadvantages of various available wastewater
disinfection options are tabulated in Table 1. Thus many of the treatment facilities still
use chlorine as the disinfectant and neutralize the toxic chlorine using dechlorination
chemicals prior to discharge.
2

Effectiveness Against Bacteria Viruses Parasites
High Low to medium Low
High High High
High High Not fully assessed
Practicality Process Control Complexity Maintenance and Cleaning
Well Developed Simple to moderate Low to moderate
Developing Complex Moderate to intensive
Developing Simple to moderate Intensive
Reliability
Costs (depending on size of plan Operation Capital (small to medium plant) Capital (medium to large plant)
High
t) Medium1
Medium Low to Medium
High
Medium1
High High
Medium
Medium1
Low to Medium Medium to high
Adverse Effects Safety Risk: Transportation Safety Risk: on-site Fish and macro-invertebrate toxicity Formation of toxic by-products Disposal of cleaning products High Energy consumption
Yes Substantial Toxic3
Potential No No
No Moderate Unlikely
Unknown No Yes
No Minimal No
Unknown Yes Yes
Adapted from EPA Vicotoria (2002) modified from USEPA (1992) 1 The ranking of the three methods varies with the size of the system design 2 The toxic residual chlorine can be reduced by dechlorination
The process of removing residual chlorine from disinfected wastewater prior to its
discharge into the natural environment is known as dechlorination. The objective of
dechlorination is to reduce all chlorine-produced oxidants to a non-reactive halide form
(Helz & Nweke, 1995) via chemical reactions. Since stringent regulations governing
effluent chlorine levels are in place in Quebec and in the United States for some time
(Tikkanen et al, 2001), kinetics of dechlorination reactions should be well studied.
However, there is a lack of published research studies on the kinetics of the reactions
between the dechlorination chemicals and chlorine under varying dosages of the
dechlorination agent, mixing and pH conditions.
3

Dechlorination agents (DAs) are added to the municipal wastewater effluent to reduce the
deleterious effects of chlorine on aquatic species. Water that has been chlorinated and
then dechlorinated is reported to be far less toxic to aquatic organisms than either
unchlorinated or chlorinated effluent (EC, 2003). Nevertheless, the dechlorination
agents, known to be less harmful than chlorine, might also pose a threat to the aquatic
species in receiving streams. Thus, it is important to investigate the aquatic toxicity of
common dechlorination chemicals. Even though the environmental benefits to the
dechlorination of wastewater effluent prior to discharge has been the focus of research for
many years, potential aquatic and human health impacts of DAs have not been well
studied (Ryon et al, 2002). When choosing a dechlorination agent to treat the
wastewater effluent, knowing the aquatic and human health impacts of the chemical
exposure becomes important, because the receiving natural rivers and lakes support
contact and non-contact recreation, aquatic life and serve as a portable source of water.
1.1 Rationale for this Study
In order to ensure that the effluent is completely neutralized and the dechlorination
reactions are optimized, it is important to have a better understanding of the kinetics of
dechlorination reactions. This research into the kinetics of dechlorination reactions
should help wastewater engineers and operations staff in selecting the appropriate
dechlorination agent, applying the proper dosage, allowing for sufficient contact time and
adequate mixing, as well as understanding the influence of pH regimes and identifying
economical constraints. The study of the aquatic and human health impacts associated
with the use of dechlorination chemicals at various concentrations will help the
wastewater facility managers and policy makers to make accurate decisions regarding the
4
most suitable dechlorination chemical based on minimum human and aquatic health
impacts. Thus, this research study will investigate the dechlorination kinetics and aquatic
toxicity of selected dechlorination chemicals.
1.2 Objectives
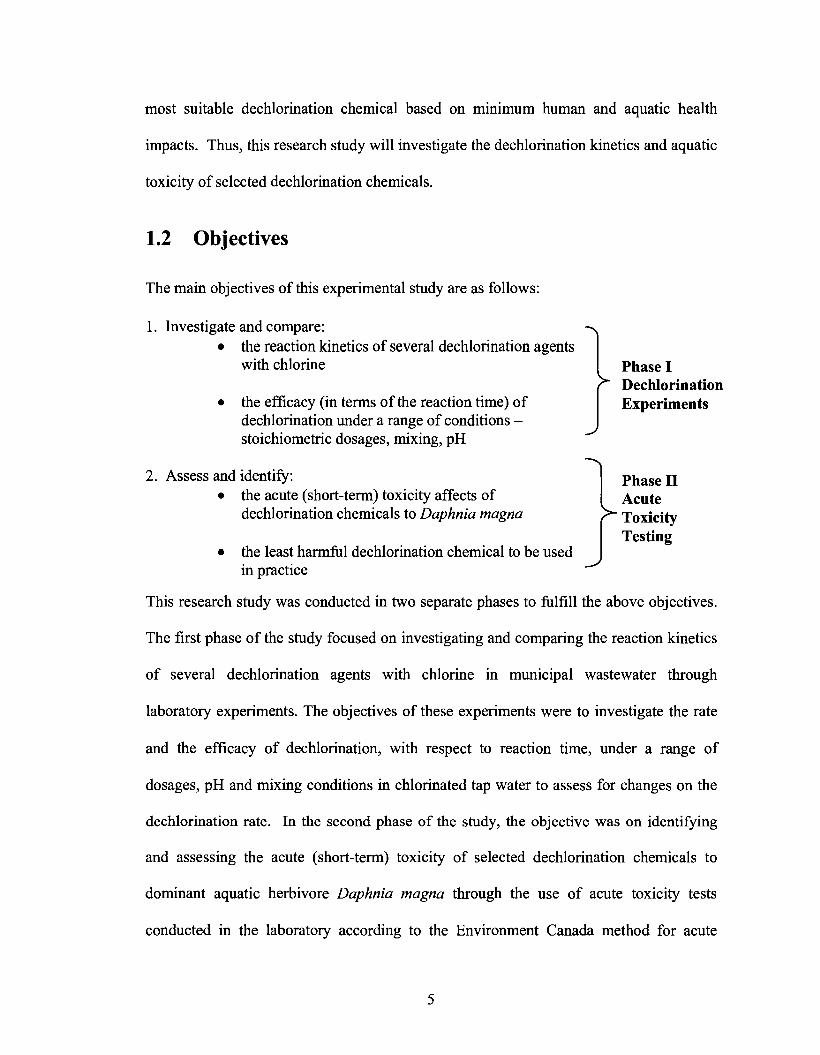
The main objectives of this experimental study are as follows:
1. Investigate and compare: • the reaction kinetics of several dechlorination agents
with chlorine
• the efficacy (in terms of the reaction time) of dechlorination under a range of conditions -stoichiometric dosages, mixing, pH
2. Assess and identify: • the acute (short-term) toxicity affects of
dechlorination chemicals to Daphnia magna
• the least harmful dechlorination chemical to be used in practice
Phase I r Dechlorination
Experiments
Phase II Acute
r Toxicity Testing
This research study was conducted in two separate phases to fulfill the above objectives.
The first phase of the study focused on investigating and comparing the reaction kinetics
of several dechlorination agents with chlorine in municipal wastewater through
laboratory experiments. The objectives of these experiments were to investigate the rate
and the efficacy of dechlorination, with respect to reaction time, under a range of
dosages, pH and mixing conditions in chlorinated tap water to assess for changes on the
dechlorination rate. In the second phase of the study, the objective was on identifying
and assessing the acute (short-term) toxicity of selected dechlorination chemicals to
dominant aquatic herbivore Daphnia magna through the use of acute toxicity tests
conducted in the laboratory according to the Environment Canada method for acute
5

toxicity testing (EC, 1990). Percentage mortality of Daphnia magna was investigated
under various concentrations of the dechlorination chemicals to identify the least harmful
dechlorination chemical to be used in practice.
The remaining chapters will present the necessary background on dechlorination
chemicals and their health impacts, a detailed description of the experimental
methodology, the results of the dechlorination experiments and the aquatic toxicity
testing and a discussion of the significance of the experimental data as well as
conclusions and recommendations of the study. Chapter 2 is a review of literature
pertaining to the significance of dechlorination, selected dechlorination chemicals,
selection criteria for dechlorination chemicals, and the impacts of these chemicals on
aquatic and human health. Chapter 3 includes a description of the detailed experimental
methodology of the dechlorination experiments and aquatic toxicity testing undertaken in
the laboratory. Chapter 4 presents the results that were obtained in the experimental
studies and discusses the significance of these results. Chapter 5 summarizes the main
findings and recommendations for future research.
6

Chapter 2 2 Literature Review This chapter includes a review of the literature related to the significance of
dechlorination, chemistry of the selected dechlorination chemicals, selection criteria for
dechlorination chemicals, and the impacts of these chemicals on aquatic and human
health.
2.1 Dechlorination
The following sections present the significance of the dechlorination of disinfected
municipal wastewater effluent, and introduce the physical and chemical properties of
selected dechlorination chemicals, and their chemistry with chlorine. The selection
criteria for dechlorination chemicals in municipal wastewater applications are also
discussed.
7

2.1.1 Significance of Dechlorination
Dechlorination is the process of partially or completely removing residual chlorine from
disinfected wastewater by chemical or physical treatment prior to discharge into the
natural environment or into the drinking water system (i.e. for superchorinated waters) (
Helz & Nweke, 1995; US Army, 1988; USEPA, 2000). In 1999, an estimated 14.4
million m3/day of treated wastewater was discharged into Canadian fresh water bodies,
making municipal wastewater effluents (MWWEs) one of the largest single effluent
discharges in the country (Environment Canada (EC), 2001b). Since MWWE contains
toxic compounds, and material and disease-causing microorganisms (fecal-coliforms), it
is disinfected before being discharged into natural freshwater bodies (using a variety of
chemical and physical disinfectants). The most commonly used chemical disinfectants
are chlorine-based disinfectants (chlorine gas, chloramines and chlorine dioxide) and
ozone. Chlorine and chloramines have become an attractive disinfectant for wastewater
treatment facilities across North America, because of their effectiveness in achieving
desired microbial inactivation, low cost and wide availability. (EC, 2001b) A brief
description of chlorination chemistry is included below.
Chlorination Chemistry
Chlorine is added to wastewater either in the form of gas (Ch) or as hypochlorite salts
(e.g sodium hypochlorite, NaOCl). When chlorine (gas) is dispersed in water it rapidly
hydrolyses as can be seen in the following reaction:
ci2+H2O^> HOCI+H+ + cr
8

At 25°C, the equilibrium constant (Keq) for this reaction is reported to be 4.5 x 10⁴ M"1. In
dilute solutions with pH values of 3 or greater, this forward reaction is essentially
complete (USEPA, 2007b). Depending on the pH of the solution, at 20°C, hypochlorous
acid (HOCl) dissociates (see Figure 1) into hypochlorite ion (OCl) as follows:
HOCl <-> OCr + H+ pKa = 7.6
In addition, the HOCl and OCT ions, also
known as free chlorine, are powerful oxidants
and readily react with millimole (mmol)
concentrations of reduced nitrogen (in the form
of ammonia, organic amines, and amides)
present in wastewater, resulting in the
formation of chloramines (Helz & Nweke,
1995). Chloramines, also known as combined
100 90
80
70
~<® u
§50
^40
30 20 10
0
20"C- >\
\
\
k N s .
0
10
20
30
40
50 EJ O
60 £
70
80
90
100 4 5 6 7 8 9 10 11
PH
chlorine, exist in three forms: Figure 1: Distribution diagram for the chlorine species HOCl and OCl" in water at
monochloramine, dichloramine, and various PH levels. Adapted From: www.uq.edu.au
trichloramine. Thus, chlorine being a powerful oxidant is an effective disinfectant for the
purpose of wastewater treatment.
Although chlorinated wastewater has been directly discharged into Canadian freshwater
bodies in the past, there have been increasing concerns about the impact of chlorine
residuals and chlorination byproducts on aquatic biota (EC, 2001b). Consequently, under
the Canadian Environmental Protection Act, 1999 {CEPA, 1999), chlorinated municipal
wastewater effluents were recognized to be toxic and were identified as a priority for risk
9

management action. After recognizing the potential negative effects of chlorine on the
aquatic life of the receiving water bodies, Environment Canada published a Proposed
Notice in the Canada Gazette (June 7th, 2003) requiring certain owners of wastewater
systems to prepare and implement pollution prevention plans for inorganic chloramines
and chlorinated wastewater effluents (chlorine) under the Canadian Environmental
Protection Act, 1999 {CEPA, 1999). All wastewater facilities with an effluent release to
surface water greater than or equal to 5000 m3/day, were required to have total residual
chlorine concentrations no more than 0.02 mg/L.
Although the use of dechlorination chemicals has been the main dechlorination strategy
utilized by treatment facilities for many years (USEPA, 2000; EC, 2003), there is a lack
of published research on the reaction kinetics between these dechlorination chemicals and
chlorine. Having an understanding of reaction kinetics and the associated aquatic and
human health impacts of these chemicals should help wastewater facility managers and
policy makers to choose the most suitable dechlorination chemical. Section 2.1.2
includes a discussion of seven dechlorination agents that are currently in use for various
applications including wastewater treatment. These seven dechlorination compounds
include three sulfur compounds, two thiosulfates, ascorbic acid, and hydrogen peroxide.
2.1.2 Introduction to Selected Dechlorination Chemicals
Many dechlorination strategies are currently used in practice, including injection of sulfur
compounds, thiosulfates, ascorbic acid, and hydrogen peroxide and carbon adsorption
(USEPA, 2000). Injection of sulfur compounds (e.g. sulfur dioxide (SO2), sodium sulfite
(SS - Na2S03), sodium bisulfite (SBS - NaHS03), sodium metabisulfite (SMBS -
10

Na2S205)) and carbon adsorption are amongst the most commonly used strategies for
dechlorination (USEPA, 2000). Due to ease of handling, sulfur dioxide gas is primarily
used in large facilities (EC, 2003), while small facilities prefer sodium sulfite and
bisulfite due to the ease of control and handling of these chemicals (USEPA, 2000).
SMBS hydrolyzes to SBS when added to water, which is a method utilized by many
researchers as a source of bisulfite for experimental purposes (Yonkos et al, 2001). As a
result of the high costs associated with carbon adsorption, it is not a widely used
dechlorination method in the wastewater industry. Alternatively, dechlorination agents
such as sodium thiosulfate (STS - Na2S2C>3), calcium thiosulfate (CTS - CaS203),
hydrogen peroxide (HP - H2O2) and ascorbic acid (AA - C5H5O5CH2OH) are used for
many dechlorination applications, including wastewater treatment, due to their
effectiveness in neutralizing chlorine. The following subsections further discuss seven
dechlorination agents that are of interest in the subsequent experimental studies of this
research project.
2.1.2.1 Sodium Sulfite (SS)
Sodium sulfite (Na2S03), available in powder/crystalline and tablet form, undergoes the
following reaction with free chlorine:
Na2S03 + HOCl -» Na2S04 + HO Sodium sulfite Hypochlorous acid Sodium sulfate Hydrochloric acid
SS is available in tablet form, making it easier to store, handle and apply, compared to
solutions or powders. SS may reduce the solution pH because it produces hydrochloric
acid as a product of the reaction with chlorine, and 1.78 mg of SS is required to remove 1
mg of chlorine. Reducing the pH of the water may pose a threat to the aquatic biota. SS,
11

like other sulfur compounds (Ryon et al, 2002), is a reducing agent and is reported to
scavenge oxygen {Tikkanen et al, 2001) by the following reaction:
2 Na2S03 + 0 2 ->• 2Na2S04 Sodium sulfite Sodium sulfate
Theoretically, 1 mg of SS is calculated to scavenge 0.127 mg of oxygen (See Appendix
2).
2.1.2.2 Sodium Bisulfite (SBS)
Available as a white powder, granules or clear liquid solution, sodium bisulfite (NaHSOs)
is highly soluble in water. It undergoes the following reactions with free chlorine:
NaHS03 + HOCl -> NaHSO, + HO Sodium bisulfite Hypochlorous acid Sodium bisulfate Hydrochloric acid
To remove 1 mg of chlorine, 1.47 mg of SBS is required and 1.38 parts of alkalinity (as
CaCOs) is consumed per 1 part of chlorine removed (EC, 2003). SBS is also an oxygen
scavenger (Ryon et al., 2002) according to the following reaction:
2 NaHSO, + 02->2Na+ + 2H+ + 2SOf Sodium bisulfite
SBS may crystallize at room temperature. Also, because of its high viscosity of 3.64
mPa.s compared to 1.00 mPa.s for water at 20 °C, this dechlorination agent is difficult to
handle. Also, SBS is a highly acidic solution (pH of 1% w/v SBS solution = 4.3), which
in combination with the production of hydrochloric acid during the reaction may lower
the pH of the receiving water (Tikkanen et al., 2001).
12

2.1.2.3 Sodium Metabisulfite (SMBS)
Similar to sodium bisulfite, sodium metabisulfite (Na2S20s) is preferred by small
treatment facilities due to its availability as a liquid in various concentrations (EC, 2003),
as well as white crystals or powder form (USEPA, 2007a). SMBS reacts with free
chlorine as follows:
Na2S2Os + 2Cl2+3H20^2NaHS04 + AHCl Sodium metabisulfite Sodium bisulfite Hydrochloric acid
SMBS hydrolyzes to SBS when added to water, which is a method utilized by researchers
to produce bisulfite for experimental purposes (Yonkos et al, 2001). To remove 1 mg of
chlorine residual 1.34 mg of SMBS is required, and similar to bisulfite, 1.38 parts of
alkalinity (as CaCC^) is consumed per each part of chlorine removed (Worley, 2000).
Since the above chlorine neutralization reaction produced hydrochloric acid, it may lower
the pH of the solution. Similar to SBS, even a solution of 1% SMBS is very acidic and
has a pH of 4.3. In addition, the reaction between SMBS and chlorine results in the
production of hydrochloric acid, which may further reduce the pH of the receiving water.
2.1.2.4 Sodium Thiosulfate (STS)
In the United States, sodium thiosulfate (Na2S203) has been widely used in the
wastewater industry (Tikkanen et al, 2001), however, in Canada its main applications
have been in aquarium dechlorination (EC, 2003), the pulp and paper industry and in
bench-scale chlorination/dechlorination studies (White, 1999). STS is an odorless,
colorless, transparent, monoclinic crystal, which undergoes multiple reactions with free
and combined chlorine.
13

The STS dosage required for dechlorination is pH dependent. At low pH values, the
acidity in the solution causes the thiosulfate ion to be unstable and disproportionate into
sulfite and elemental sulfur as shown below.
S2Ol~ + H+ -> HSO~ + S
For instance at a pH of 11 the stoichiometric dosage is 0.56 mg STS/mg C^, while at a
pH of 8 the dosage increases to 1.86 mg STS/mg CI2 (Tchobanoglous, 2003; Worley,
2000). The following reaction is only stoichiometric at pH 2 and yields sodium bisulfate
(Tchobanoglous, 2003; Worley, 2000).
Na2S203 + Cl2 + 5 i / 2 0 -> 2NaHS04 + MCI Sodium thiosulfate Sodium bisulfate
If excess thiosulfate is present with chlorine in the solution, sulfur dioxide (which smells
like a rotten egg) is produced according to the following reaction. Elemental sulfur is also
produced in this reaction.
Na2S203 + 2HCI -> INaCl +H20 + S+ S02 Sodium thiosulfate Hydrochloric Acid Sodium chloride Sulfur dioxide
STS is available in anhydrous (Na2S203) as well as pentahydrate (Na2S2C>3.5H2O) form.
The anhydrous form has a lower solubility in water compared to the pentahydrate form
that is readily soluble. Although STS is a reducing agent, it scavenges comparably less
oxygen than sodium sulfite, bisulfite or metabisulfite. The required contact time for STS
to react with chlorine is higher than for most other dechlorination agents (Ryon et al,
2002). Also, excess thiosulfate released into rivers and streams may promote thiobacillus
bacterial growth, especially during low flow conditions {Tikkanen et al, 2001). In the
presence of oxygen, thiobacillus bacteria have the unique ability to convert hydrogen
14

sulfide gas into sulfuric acid as follows (EPA, 1998), reducing the pH of the receiving
waters (Ryon et ah, 2002; Tikkanen et ah, 2001).
H2S(g) + 202 Mobacillusbactena > JJ^Q^
hydrogen sulfide atmospheric oxygen Sulfuric acid
2.1.2.5 Calcium Thiosulfate (CTS)
Available as a clear crystalline substance, calcium thiosulfate (CaS203) has a faintly
sulfurous odor (Wang et ah, 2006). It reacts with free as well as combined chlorine.
CTS undergoes the following reaction with free chlorine (Tikkanen et ah, 2001)
producing calcium sulfate in the process.
CaS203 + 4HOC1 +H 2 0 -> CaS04+ 4HC1 + H2S04 Calcium thiosulfate Hypochlorous acid Calcium sulfate Hydrochloric acid Sulfuric acid
At pH 7.35, 0.99 mg of CTS is required to neutralize 1 mg of residual chlorine; however
at pH 11, only 0.45 mg CTS is required for the reaction. This variation in the required
dosage of CTS with variable pH is because at pH 7.35, the chlorine species (e.g. HOC1 to
OC1") are in ~ 1:1 ratio but at pH 11, all of the chlorine in solution is in the OC1" form
(see Figure 1).
Although, CTS is found to be non-toxic to aquatic species, one disadvantage to the usage
of CTS is that the reactions using stoichiometric concentrations are rather slow and
require nearly five minutes for complete neutralization (Wang et ah, 2006). CTS is not
an oxygen scavenger and does not produce sulfur dioxide gas as a reaction by-product
like the other sodium-based dechlorination agents (Wang et ah, 2006). If the wastewater
effluent is over-dosed with CTS, milky-colored suspended solids are produced, which
add to the turbidity of the water. CTS also promotes the growth of thiobacillus bacteria if
15

released in excess into receiving water bodies (Tikkanen et al., 2001), which might result
in the case of cooling water and disinfected wastewater dechlorination operations (Wang
et al, 2006). Another concern with using CTS is that it produces both hydrochloric and
sulfuric acid in the dechlorination reaction, which could substantially lower the pH of the
solution.
2.1.2.6 Hydrogen Peroxide (HP)
Both municipalities and industries use hydrogen peroxide (H2O2) for dechlorination
purposes (Worley, 2000). HP reacts with free chlorine according to the following
reaction when the pH is above 7:
Cl2+H202 -+2HCl + 02
The reaction is instantaneous and complete at the pH value of 8.5. (EC, 2003) To
neutralize 1 mg of chlorine, 0.48 mg of HP is required. Also, the oxygen produced in the
above reaction can increase the dissolved oxygen (DO) level in the receiving streams.
Therefore, a major advantage of using HP in wastewater application is that it has no
negative impact on receiving water bodies, and it may boost the DO levels in the
receiving water bodies (EC, 2003). However, if excess HP is present in the effluent as a
result of overdose, HP could be quenched with a quenching agent such as catalase. These
quenching agents have been reported to be unstable for HP quenching because of the
complexity and the length of time required for the measurements (Liu et al, 2003).
In addition, HP reacts with hypochlorite ion as follows:
ClO~ + H202 -> Cl~ + H20 + 02
16

From a kinetic analysis of the above reaction in the temperature range 15 - 35°C, Shams
El Din & Mohammed (1998) found that the reaction was complete in 10-15 minutes, both
in portable and sea water. They also concluded that the reaction is second order with
respect both reactants. However, in the presence of one reactant in excess, the reaction
was determined to be first order with respect to the other reactant (i.e. pseudo-first order).
In other words, the dechlorination reaction involving hydrogen peroxide is pseudo-first
order with respect to hypochlorite ion (CIO). (Shams El Din & Mohammed, 1998)
The reaction between HP and combined chlorine species such as chloramine has been
reported to be considerably slower than its reaction with free chlorine (Shams El Din &
Mohammed, 1998). Therefore, in terms of the required reaction time, sulfur compounds
are preferred for dechlorination of wastewater with high concentrations of reduced
nitrogen. HP is ideal for wastewater facilities with either long contact times for
dechlorination, or mechanical mixing, or if wastewater is denitrified before chlorination.
Due to these operational constraints, and the difficulties in chemical handling, it is
unlikely that HP will be used in small treatment facilities (EC, 2003).
2.1.2.7 Ascorbic Acid (AA)
Commonly known as vitamin C, L-ascorbic acid (C5H5O5CH2OH) is widely used to
dechlorinate water for medical (e.g. kidney dialysis units) (Wiseman, 1997) and
analytical purposes (Bedner et al, 2004). To neutralize 1 mg of chlorine (as Cli) 2.48
mg of AA is required (see Appendix 2 for calculation). Available as colourless,
odourless, white crystals, AA reacts with chlorine as follows:
17

CsH505CH2OH+ HOCl -> C5Hi05CH2OH+ HCl +H20 Ascorbic Acid Hypochlorus Acid Dehydroascorbic Acid Hydrochloric Acid
During the above reaction, hydrochloric acid is produced reducing the solution pH. The
AA solution itself has a pH of 2, which is highly corrosive (EC, 2003). Together, the
above factors could substantially reduce the pH of the AA reaction solution. AA is
effective in reducing both hypochlorite and chloramine (Paterka, 1998), but Bedner et al.
(2004) found the reaction rate of AA with chlorine to be much slower than that of sodium
sulfite and thiosulfate. Although EC (2003) claims that AA is not a DO scavenger,
Bedner et al. (2004) found that it exerts a Biological Oxygen Demand (BOD) of 3.1 mg
O2/L when reducing 1 mg CI2/L with a 50% molar excess of AA. However, considering
the health benefits and low risks associated with AA, it has been drawing attention as a
potential dechlorination chemical for natural water streams (Paterka, 1998). Other
advantages of using AA are that it is safe to handle, and has no inherent odor (Paterka,
1998).
2.1.2.8 Summary of Dechlorination Chemicals
A number of dechlorination chemicals are currently used to remove free and/or combined
chlorine from the water in the wastewater industry, medical field, pulp and paper industry
and in bench-scale laboratory studies. The following section summarizes the reaction
chemistry, the advantages and the disadvantages of selected dechlorination chemicals in
wastewater application.
Sulfur salts such as sodium sulfite (SS), sodium bisulfite (SBS), and sodium metabisulfite
(SMBS) are amongst the most commonly used chemicals for wastewater applications
18

(USEPA, 2000). SS and SBS are also known as sulfur (IV) compounds, since they
contain sulfur in the +4 oxidation state (Helz & Nweke, 1995) and, when dissolved in
water, they produce sulfur (IV) compounds, such as the sulfite ion (SOf) and sulfur
dioxide gas. However, compared to sulfur dioxide gas itself, the salts have less
dechlorination efficiency per amount of product added. Nevertheless, small facilities
prefer SS and SBS over sulfur dioxide gas due to ease of storage, chemical feeding (into
the reactor), control and handling. Amongst all the available sulfur salts, SMBS has been
reported to require the lowest addition rate (USEPA, 2000). In addition, sulfur
containing dechlorination agents are known to deplete DO and suppress pH levels of the
water, which may negatively impact the aquatic organisms in the receiving streams
(Tikkanen et al, 2001; Yonkos et al, 2001). Also, it has been found that the S (IV)
compounds are more effective in reducing total residual chlorine and the resulting
toxicity in waters with chlorine present in the free chlorine form compared to the
combined chlorine from. Sulfur salts are less efficient in neutralizing combined chlorine,
which is the predominant chlorinated species in wastewater with high organic loads (Helz
& Nweke, 1995).
STS and CTS have also become popular dechlorination agents, especially in bench-scale
laboratory studies and aquarium applications. Even though commonly used for
dechlorination in the United States (Ryon et al, 2002), there seems to be no evidence for
the use of these chemicals in wastewater dechlorination in Canada. Thiosulfates are
reported to be more effective than sulfites in reducing both residual chlorine fractions in
wastewater (Bedner et al, 2004). The reaction involving STS is sensitive to the solution
19

pH, thus the stoichiometric dosage required varies depending on the pH (Worley, 2000).
CTS, on the other hand, reacts very rapidly with free chlorine reducing the required
contact time for dechlorination. This reduction in contact time is a great advantage in
wastewater applications with short contact times available for the dechlorination
reactions. However, using CTS in excess may cause an increase in the effluent turbidity
and promote the growth of thiobacillus bacteria in the receiving water bodies (Tikkanen
etal, 2001).
Hydrogen peroxide (HP) and ascorbic acid (AA) are also two emerging dechlorination
chemicals. HP, however, is not used in large scale applications because its highly
corrosive nature makes it dangerous to handle (Worley, 2000). Also, it requires long
reaction times for the reaction with chloramines, thus may only be suitable for large
facilities with denitrification processes in place to reduce the formation of chloramines
during chlorination. Thus, HP is ideal for wastewater facilities either with long contact
times or if high levels of mechanical mixing are present following dechlorination, and it
is unlikely to be used in the wastewater treatment at the municipal level (EC, 2003).
L-ascorbic acid (C5H5O5CH2OH) is becoming a popular dechlorination chemical due to
its ease of handling, short reaction times and because it is safe to the user and the aquatic
environment. Also, it is able to completely remove residual chlorine. However, the pH
impacts, and the high cost associated with its use (see Table 3) prohibits the application
of AA in the wastewater industry (EC, 2003).
20

Table 2 summarizes the advantages and disadvantages of the seven dechlorination agents
from an operational point of view.
Table 2: Advantages and disadvantages of selected dechlorination chemicals. Dechlorination
Agent (DA) Sodium Sulfite (SS)
Sodium Bisulfite (SBS)
Sodium Metabisulfite (SMBS)
Sodium Thiosulfate (STS)
Calcium Thiosulfate (CTS)
Hydrogen Peroxide (HP)
Ascorbic Acid (AA)
Advantages
- Significant use history - Non-toxic, non-corrosive, easy to use
- Significant use history - Easy to inject - Low use ratio
- Significant use history - Easy to inject - Amongst all sulfur salts, lowest addition rate required5
- Significant use history - Non-toxic, non-corrosive, easy to use - Low initial capital costs - Easy to inject - Scavenges less oxygen than sodium sulfite, bisulfite or metabisulfite1
- Non-toxic to aquatic organisms1
- Low stoichiometric dosages required compared to other dechlorination chemicals (e.g. 0.99 mg of CT per 1 mgof Cl2) - Reacts very rapidly with free chlorine
- Easy to inject - Inexpensive chemical cost - Release oxygen during the neutralization reaction3
- Safe to handle - Do not scavenge oxygen - No inherent odor2
- Reaction rate of AA is much slower than that of sulfite and thiosulfate
Disadvantages
- High use ratio - Solutions subject to freezing in cold weather -Difficult to handle - Expensive chemical - Highly Corrosive1
- Solutions subject to freezing in cold temperatures - Solutions subject to freezing in temperatures
- Solutions subject to freezing in cold weather -Required stoichiometric dosage varies depending on the solution pH3
-Excess thiosulfate release may produce turbidity violations ]
- Excess thiosulfate release into receiving streams promote thiobacillus bacterial growth1
- Reactions using stoichiometric concentrations require long contact times (~5 mins) - Overdosing may cause turbidity violations1
- Excess thiosulfate release into receiving streams promote thiobacillus bacterial growth1
- Does not remove chloramines at a useful rate - Highly unstable and subject to deterioration - High chemical cost - When dissolved in water, it is corrosive due to the low pH
Table adapted from Environment Canada (2003), lrrikkanen et al, 2001; 2 Paterka, 1998;3 Worley, 2000; "Bedneref a/., 2004; 5USEPA, 2000
21

Comparing the above-mentioned DAs from an operational point of view, it is evident that
using sulfur compounds - SS, SBS and SMBS - is a logical choice for dechlorination of
wastewater effluent. However, there are other selection criteria (Section 2.2) that need to
be considered when selecting a dechlorination agent to achieve optimum results.
2.2 Selection Criteria for Dechlorination Agents in
Wastewater Applications
Various dechlorination facilities use different dechlorination chemicals depending on
several factors such as required chemical dosage and cost, contact time for complete
neutralization, and mixing requirements (operational conditions). Other important
criteria that need to be considered when choosing a DA are safety and ease of handling
(NMED, 2003; EC, 2003), which were previously discussed in the Table 2.
2.2.1 Chemical Dosage and Cost
Adding the sufficient dosage of the dechlorination chemical is a critical factor in
producing non-detectable chlorine residual in the effluent. Theoretically required
stoichiometric dosages calculated from the balanced chemical reaction equation of each
of the dechlorination agents are tabulated in Table 3. Typically, the weight ratio of the
dechlorination agent added to chlorine is 1:1 (mg DA/ mg CI2), and USEPA (2000) is
highlighting the importance of using proper amounts of chemicals to avoid over-dosing.
Over-dosing may have negative consequences on the receiving waters. For example,
excess sulfur salts have the potential to react with DO (4 parts of sulfite will consume 1
22

part of oxygen on weight-to-weight basis) in the wastewater, producing sulfates (USEPA,
2000; NMED, 2003) according to the following reaction (Bedner et a/.,2004):
2SO?+02^>2SO;2
Sulfite Sulfate
This reaction not only reduces the DO levels in the water, but it also lowers the effluent
pH (USEPA, 2000). NMED (2003) on the other hand claims that an excess of 10%
above theoretical values of the dechlorination agent is necessary to achieve complete
dechlorination. GVRD (1997) also claims that "over-dosing is the best approach." Helz
& Nweke (1995) claim that approximately 50% molar excess of sodium sulfite (relative
to the initial total residual chlorine) is currently used by wastewater treatment facilities in
the United States. Dechlorination Design Standards for Maine Wastewater Facilities
recommends the use of approximately the stoichiometric ratios of 1.8, 1.5 and 1.5 sodium
sulfite (SS), bisulfite (SBS) and metabisulfite (SMBS) to chlorine on a weight basis (mg
DA/ mg CI2), respectively (DEP, 2005). Thus, it is apparent that there are conflicting
practices regarding the appropriate dosage of dechlorination agents to be used to achieve
complete neutralization. Further studies are needed, using varying dosages of chemicals
to evaluate the minimum dosage necessary to achieve complete dechlorination over a
reasonable reaction time (less than 1-3 minutes).
Worley (2000) conducted similar dechlorination experiments with ascorbic acid (AA),
sodium thiosulfate (STS) and hydrogen peroxide (HP) and determined the effective dose
for the dechlorination of chlorine for the three chemicals to be 3.0, 2.2 and 0.6 mg/mg CI2
respectively. It was also found that after 5 minutes of reaction with a lx stoichiometric
dosage (henceforth "x" will be used to designate the stoichiometric weight ratio of DA to
23

CI2) of each of those 3 chemicals, there was ~ 7.5%, 2.5% and 65% of the residual
chlorine left in the effluent for AA, HP and STS, respectively. This research further
supports the idea that the dechlorination reactions at lx stoichiometric dosages are not
instantaneous and are incomplete.
The cost of the dechlorination chemicals is directly proportional to the required dosage.
Thus, the amount of chemical dosage required for complete dechlorination is a main
determinant of the type of dechlorination agent that is used. The required dosage is
directly related to the incoming effluent chlorine concentration, desired residual
concentration, and the type of dechlorination chemical that is being used (NMED, 2003).
Table 3 tabulates the stoichiometric dosages of each dechlorination chemical required to
neutralize 1 mg of chlorine (as CI2) and the associated costs per kg of residual
neutralized. The sample calculations are included in Appendix 2.
Table 3: Stoichiometric dosages and cost of various dechlorination chemicals
Dechlorination Agent (DA)
Ascorbic acid (AA)
Sodium Bisulfite (SBS)
Sodium Thiosulfate (STS)
Sodium Sulfite (SS)
Hydrogen peroxide (HP) Sodium Metabisulfite (SMBS) Calcium Thiosulfate (CTS)
Stoichiometric Dosage (kg DA/1 kg ClJ
2.5
1.47
0 .56@pHll 1.86 @pH 8
2.23 @ pH 6.5 1.78
0.48
1.34
0 .45@pHll 0.99 @ pH 7.35
Delivery Concentration , ? ,
chemical
99% (solid)
97% (solid)
38% (liquid)
97% (solid)
96% (Solid) 35 % (liquid) 50 % (liquid)
97% (solid)
30% (liquid)
$9.95
$2.40
$0.45' $1.70 $1.70 $1.70 $1.22 $1.37 $0.96
$0.94
$1.95' $1.95'
Cost/Tig of residual
$25.13
$3.64
$1.742
$0.97 $3.26 $3.90 $2.26 $1.88 $0.90
$1.30
$2.93 $6.44
Adopted from EC, 2003. 'Email communication with Canada Colors Limited, May 20th, 2008. 2See calculation in appendix 2
24

From Table 3 it can be seen that the dechlorination costs are directly proportional to the
dosage of chemical required. For example, AA requires the largest dosage per mg of CI2,
and has the highest cost per unit of chemical. Therefore, it has the highest cost per kg of
residual neutralized. CTS is also costly; however, it only costs 25% of the cost of AA per
unit of residual neutralized The neutralizing costs (per kg residual) of the rest of the
chemicals are significantly less (an order of magnitude) than that of AA. Cost of
dechlorination using HP is also claimed to be much less than methods based on treatment
with sulfur dioxide (Shams El Din & Mohammed, 1998). . From a cost point of view,
for large facilities using large quantities of the dechlorination chemicals, it is impractical
to use AA or CTS.
The choice of dechlorination chemical will not only influence the costs for the chemicals,
but it will also have an impact on the cost of dosing equipment, installation, labour,
operation and maintenance of the treatment facility. Also, there might be other costs that
would have to be considered depending on the location and the size of the treatment
plant. For example, according to EC (2003), the use of sulfur salts by wastewater
facilities is largely dependent on the availability of the chemicals and associated
transportation costs. Therefore, the cost of the chemical is directly proportional to
transportation costs and each facility will require a thorough cost analysis before adopting
the use of sulfur salts (USEPA, 2000). When choosing the most effective dechlorination
chemical to be used, the cost savings should be weighed against other design
requirements (mixing and contact time), safe handling and storage issues.
25

2.2.2 Contact Time for Reaction Completion and Mixing Requirements
Generally, wastewater facilities are designed to allow for a minimum of 30 seconds of
mixing and contact time following dechlorination during peak hourly flow (NMED,
2003; Utilities Kingston, 2004). Thus, it is essential that the dechlorination agent of
choice be able to neutralize the free and combined chlorine rapidly within a short period
of time. Many dechlorination agents are unable to achieve complete dechlorination in
less than 30 seconds. In some cases during peak hourly flow, after the addition of the
dechlorination agent, the effluent is directed into a holding tank to allow for additional
mixing and reaction time (NMED, 2003). Typically the residence time of water in these
holding tanks is a few minutes, which may or may not be sufficient to achieve the desired
residual chlorine levels in the residual (< 0.02 mg/L) (GVRD, 1997). Thus, it is
important to have a clear idea of the required contact time during the design of the
wastewater treatment facility to assess the requirements of a holding tank and/or adequate
mixing to ensure complete neutralization.
Sulfur salts (as discussed in Section 2.1.2.8) produce sulfur (IV) compounds that readily
react with free and combined chlorine species (Ekkad & Huber, 1996). The required
contact times for these reactions are between one to five minutes, which is considerably
shorter when compared to other chemicals such as the thiosulfates (EC, 2003; US Army,
1988). On the other hand, NMED (2003) claims that the reaction between free or
combined chlorine and the sulfur (IV) compounds will occur within a much shorter time
period of 15-20 seconds. Ekkad and Huber (1996) claim that all the dechlorination
reactions are rapid at low pH, but at neutral pH the reaction of sulfite with free chlorine
26

and inorganic chloramines is completed in a few seconds while the reaction with organic
chloramines is much slower. Although not explicitly stated in their reports, this
inconsistency in the required contact time reported by each of the above agencies could
be due to the differences in the dosage that was used. Thus, it is evident that a small
variation in the dose may result in an order of magnitude change in the contact time.
Although dechlorination using sulfur (IV) compounds is assumed to be rapid and
complete (USEPA, 2000; Ekkad & Huber, 1996), many researchers (Bedner et al, 2004;
Helz & Nweke, 1995; Jensen & Helz, 1998; MacCrehan et al, 1998; Worley, 2000)
challenge this notion. Through pilot-scale testing at two wastewater treatment facilities,
the authors claim that dechlorination only removes 87 - 98% of free chlorine in the
effluent rapidly, and the rest is reduced at a much slower rate. Approximately 90% of the
initial residual chlorine was reduced by sulfite within the first 2 minutes of the reaction,
however, the remaining 10% reacted more slowly with a first-order rate constant of 0.026
min"1. Even doubling of the initial sulfite concentration did not eliminate all the residual
chlorine from the sample within 1 hour (Helz & Nweke, 1995). In agreement with Helz
& Nweke (1995), Bedner et al. (2004) also found that sulfite only reduces 67% of
residual chlorine within the first 2 minutes of the reaction, and that chlorine reduction
remains incomplete after 2 hours. This incomplete dechlorination occurs because the
hydrophilic residual chlorine components of wastewater are readily reduced by
dechlorination agents compared to the hydrophobic components that are more resistant to
dechlorination.
27

Although highly effective in rapidly reducing inorganic form of chlorine species (e.g.
HOC1, OC1", NHCI2, NCI3), studies have shown that sulfite is not as effective in reducing
organic chloramines, especially N-chloropeptides (macromolecular chloramine), that are
resistant to dechlorination by sulfite (Bedner et al, 2004; Helz & Nweke, 1995; Jensen &
Helz, 1998; Jameel & Helz, 1999; MacCrehan et ah, 1998). N-chloropeptides are
peptides that have been monochlorinated at the terminal N, and the majority of the
residual chlorine species found in the dechlorinated effluent after several minutes are N-
chloropepties (Jensen & Helz, 1998). Chlorine disinfected municipal wastewater can be
high in inorganic N-chloropeptides that would not be completely neutralized in less than
1 hour (Jensen & Helz, 1998). Thus, the required contact time for complete
dechlorination is not only is dependent on the dosage, but it is also dependent on the
composition of the wastewater and the possibility of other chloramine compound
formation.
Minimal, and often conflicting information, on required contact times is available on
other dechlorination chemicals such as HP, AA, CTS and STS as well. HP rapidly reacts
with free chlorine, yet the reaction with combined chlorine is slow, and would require
longer contact times of between 10 to 15 minutes (Shams El Din & Mohammed, 1998) to
achieve complete dechlorination (EC, 2003). Although AA is claimed to react with
chlorine rapidly (EC, 2003), others report that it is comparatively less effective than
sulfites (Bedner et al, 2004). Thiosulfates on the other hand have been found to be more
effective than sulfites in reducing both hydrophilic and hydrophobic residual chlorine
fractions (Bedner et al, 2004). Thus in terms of the contact time and mixing
28

requirements, sulfur salts seem to have an advantage over the other dechlorination agents
of choice.
Even though the required contact time is a critical criterion that needs primary
consideration when selecting a dechlorination agent, it seems that minimal information is
available regarding the required reaction times of the commonly used dechlorination
chemicals. Also, the existing reaction time data with varying dechlorination chemical
dosages appear conflicting. Therefore, more research is needed to investigate the required
contact time for complete dechlorination under various dosages of the dechlorination
agents.
2.3 Health Impacts of Dechlorination Chemicals
Wastewaters are usually disinfected with chlorine, as one of a number of measures to
control waterborne diseases. A drawback of this public health strategy is that the
dechlorination agents added to neutralize the toxic chlorine prior to discharge may harm
aquatic organisms living in waters receiving treatment plant effluents, and humans who
use this water for drinking and/or for recreational activities. Even though the
dechlorination agents are known to be less harmful than chlorine, they might also pose a
threat to the aquatic species in receiving streams, especially in the case where
"overdosing" of dechlorination agents is required. Thus, it is important to investigate the
aquatic toxicity of common dechlorination chemicals. Even though the environmental
benefits associated with the dechlorination of wastewater effluent prior to discharge has
been the focus of research for many years, the aquatic and human health impacts of DAs
have not been very well studied (Ryon et al, 2002). When choosing a dechlorination
29

agent to treat wastewater effluent that would be released into natural rivers and lakes that
support contact and non-contact recreation, aquatic life and serve as a source of drinking
water, the aquatic and human health impacts related to exposure to these chemicals
become important. The following two sections review the aquatic and health impacts of
selected dechlorination chemicals.
2.3.1 Aquatic Toxicity
There are several chemical, physical and biological factors that can independently or
jointly contribute to the toxicity of wastewater effluent to aquatic species. In the case of
wastewater effluent, it is the chemical components (e.g. ammonia, chlorine and heavy
metals) that are found in or added to wastewaters that cause toxicity to the aquatic
organisms in the receiving waters (SETAC, 2004).
In order to evaluate the aquatic toxicity of a given substance (e.g. dechlorination
chemicals) various tests can be conducted such as acute or chronic lethality tests. Tests
conducted in this research were acute lethality tests. Generally, acute lethality tests are
carried out using indicator aquatic species such as Daphnia magna (D. magna), Daphnia
carinata, Daphnia pulex, and Ceriodaphnia quadrangular (Wu et al, 2007), and some
fish species such as the rainbow trout, stripped bass, and fathead minnow. An acute
lethality test is defined as a test method used to determine the effect of a given material
on a group of selected organisms under specific conditions (EC, 1990). An acute
lethality test "measures the proportion of organisms affected by the exposure to different
30

concentrations of chemicals, effluent, elutriate, leachate and receiving waters" (EC,
1990).
The species of choice for North American
toxicity studies is Daphnia magna (Figure
2) (EC, 1990; USEPA, 2002), because it is a
dominant herbivore present in the
freshwater lakes and rivers of North
America (Mitchell et ah, 2004), where the
water hardness is greater than 150 mg/L
(EC, 1990). In addition, D. magna is an Figure 2: Daphnia magna
important link in the aquatic food chain, has Adapted from www.mblaquaculture.com
a short lifespan, can be "easily" cultured in the laboratory, is sensitive to a wide range of
aquatic contaminants, and is a manageable size requiring only small volumes of test
water. D. magna has the ability to produce genetically identical organisms via cyclical
parthenogenesis (Wu et ah, 2007), which makes them ideal for toxicity testing. Cyclical
parthenogenesis is where female neonates emerge from sexual resting eggs and undergo
cycles of asexual reproduction (Mitchell et ah, 2004).
Lethality and toxicity field tests have been undertaken by researchers to identify the least
harmful dechlorination chemical to be used in practice (EC, 2003; Oh et ah, 2008; Ryon
et ah, 2002; Yonkos et ah, 2001). For example, to investigate the effects of sulfur
compounds used for the dechlorination of wastewater effluent, Ryon et ah (2002)
31

conducted laboratory toxicity testing with Ceriodaphnia Dubia using sodium thiosulfate
(STS) and bisulfite (SBS). From acute toxicity tests conducted with SBS, Ryon et al.
(2002) concluded that the 24 hour Median Lethal Concentration (LC50), the concentration
that reduces the survival by 50%, for Ceriodaphnia Dubia was 245 mg/L.
The authors found that although overdosing with STS and SBS does not have any direct
aquatic impacts as a result of the inherent toxicity of these chemicals, they have the
indirect impact of suppressing the pH and consuming the DO of the receiving waters,
potentially resulting in fish kill (Ryon et al, 2002). They discussed two examples to
illustrate how the use of sulfur-containing compounds can influence the fish populations
in receiving streams. The concentration of SBS necessary to cause a fish kill event in
receiving waters was found to be 39 mg/L, which can reduce the DO level in the
receiving waters by ~ 6 mg/L. In agreement with the claims by EC (2003), Ryon et al.
(2002) also found that these impacts require a unique set of circumstances to produce
effects. The following is a list of receiving stream conditions (adopted from Ryon et al,
2002) indicative of sulfur compound over-dosing:
• Low levels of pH and DO
• In-stream sulfur precipitation
• Increased in-stream bacterial growth
• Changes in the color or appearance of the stream bed
• Changes in the concentrations of dissolved metals
32

Although, the sulfite ion itself is not lethal, at higher dosages it can suppress the DO and
pH level in the receiving water, thus inducing stress on the aquatic species (EC, 2003;
Ryon et al, 2002). Also, it has been found that sulfite ion (SO^2) concentrations of less
than 10 mg/L have no significant effect on the aquatic environment (White, 1999).
STS is also thought to be non-toxic to aquatic species even at high concentrations (Ryon
et al, 2002; Tikkanen et al, 2001). Oh et al (2008) found the Median Effect
Concentration (EC50) of Daphnia magna, to be as high as 1334 mg/L. In general, the
EC50 is the DA concentration which induces a 50% effect to the response compared to the
control or response halfway between the baseline and maximum and LC50 is
concentration that produces a lethality effect in 50% of test organisms in a given
population. In animal studies, however, LC50 and EC50 are used interchangeably to refer
to the concentration that produces a lethality effect in 50% of test organisms in a given
population (IUPAC, 1997). This EC50 in the case of STS is much higher than the
expected concentration of STS in the wastewater effluent following dechlorination.
Generally, the residual chlorine concentration in wastewater is approximately 0.95 mg/L
(EC, 2007), which would require ~ 2.12 mg/L (@ pH 6.5) of STS to neutralize if STS is
used at a 1:1 stoichiometric ratio. Therefore, it is safe to conclude that at concentrations
presently being used for dechlorination of wastewater effluent, STS is non-toxic to
aquatic organisms.
33

However, Ryon et al, (2002) discovered that a STS concentration of 34 - 40 mg/L in a
creek in Kentucky caused by overdosing was able to cause a fish kill of over 24,000,
given the following set of conditions. When the effluent was over-dosed (34 - 40 mg/L)
with STS, a light-colored floe formation was observed in the receiving stream (Big
Bayou Creek, Kentucky). This floe is a form of non-toxic elemental sulfur produced as a
metabolic waste of the naturally-occurring bacteria that utilizes thiosulfate as an energy
source in oxygenated waters. Besides causing sulfur accumulation, this process does not
pose a problem under low (< 10°C) water temperatures. However, if the input rate of
sulfur is reduced, these bacteria begin to metabolize the precipitated sulfur, producing
sulfuric acid as a product. This acid production can reduce the water pH to
approximately 4, causing fish kills. Other factors such as increasing temperature can
further accelerate the metabolic rate of these bacteria, further reducing the water pH
(Ryon et al, 2002).
Also, precaution should be taken when interpreting STS aquatic toxicity test results (Oh
et al, 2008). Excess STS has the ability to form biologically unavailable forms of metal
complexes with several cationic metals (such as copper - Cu(II), cadmium - Cd(II), nickel
- Ni(II)) commonly present in wastewater (Oh et al, 2008). This complex formation
could lead to over or underestimation of the sample toxicity. For example, the presence
of zinc (Zn(II)) in the dechlorinated water could increase the toxicity of the sample, while
Cu(II), Cd(II) and Ni(II) can suppress the toxicity. Thus the aquatic toxicity effects of
STS can vary largely depending on the composition of the effluent that is dechlorinated
(Oh et al, 2008).
34

Other dechlorination agents such as SMBS, SS, CTS, AA and HP have not been very
well studied in terms of their aquatic impacts. For SMBS, USEPA (2007) reports the 96
hour LC50 value of lOOmg/L for fish, 72 hour EC50 of 48.1 mg/L for algae, an acute 48
hour EC50 and a No Observed Effect Concentration (NOEC) of 88.76 mg/L and >10
mg/L for daphnids, respectively. Moreover, since SS and SMBS belong to the family of
sulfur compounds, they could potentially have similar impacts on aquatic biota such as
pH and DO suppression (Tikkanen et al, 2001). SS is also classified as non-hazardous
for aquatic species, with a 48 hour LC50 value of 440 mg/L for Daphnia magna, and a 96
hour LC50 value of 460 mg/L for Western Mosquitofish (Mallinckrodt Chemicals, 2007).
It is unlikely that these high concentrations of dechlorination agents will be present in the
effluent or in the receiving water bodies, thus at lower concentrations these chemicals can
be declared safe for aquatic species.
Nonetheless, the indirect aquatic impacts of these dechlorination chemicals, such as DO
and pH suppression, can be deleterious to aquatic species thus need further investigation.
Through an experimental study, Tikkanen et al. (2001) found that the use of
stoichiometric concentrations of SMBS, SS, STS and CTS can suppress the DO in the
water stream by 1.18, 0.30, 0.55, 0.50 mg/L, respectively after 250 seconds of reaction
time. With twice the stoichiometric concentrations of the above chemicals, the DO
concentration decreased by 1.0, 0.90, 0.90, 0.70 mg/L, respectively. In conclusion, the
authors found SMBS to have the greatest impact on DO (Tikkanen et al, 2001). The
implications of such DO suppression on aquatic species are well known (Alberta
Environment, 1996). For example, extremely low levels (less than 6 mg/L) of DO in the
35
water can cause cellular breakdown and rapid death while sub-optimal levels of DO
affect the ability of fish to survive and reproduce. In addition, an indirect effect of low
DO levels is the reduction in survival of organisms that the fish prey on (Alberta
Environment, 1996).
Ascorbic acid is a naturally occurring substance in the aquatic environment and has the
least amount of information published on it in terms of aquatic toxicity (Science Lab Inc.,
2005a). Available toxicity studies suggest that AA is non-toxic at high concentrations
(200 mg/L) (NICNAS, 2003). The 48 hour EC50 value for D. Magna based on measured
concentrations is given as > 190 mg/L by NICNAS (2003). The 96 hour LC50 value for
fish was found to be > 80 mg/L, and thus, AA is declared non-toxic to fish.
The addition of HP on the other hand, is thought to increase the DO concentration in the
receiving water, since the reaction between chlorine and hydrogen peroxide is known to
release oxygen (see Section 2.1.2.6) (EC, 2003). For example, addition of the
stoichiometric concentration of hydrogen peroxide is known to increase the DO
concentration in the water by 0.3 mg/L after 4 minutes and 10 seconds (Tikkanen et ah,
2001). On the other hand, when twice the stoichiometric concentrations were added, the
DO level was found to decrease by 0.2 mg/L, and the authors failed to discuss the
possible reasons behind such a DO decrease. HP moreover, is subjected to oxidation and
reduction processes in the receiving waters and undergoes decomposition into water and
oxygen. The highly reactive and corrosive nature of HP can cause adverse effects in the
aquatic environment. Studies (Advanced Sterilization Products, 2005) have shown the
EC50 value for Daphnia magna to be 7.7 mg/L, 48 hour LC50 for Daphnia pulex to be 2.4
36

mg/L, while fish species such as the fathead minnow and catfish have 96 hour LC50
values of 16.4 and 37.4 mg/L respectively. In addition, the half life of HP in the aquatic
environment is 8 to 20 days, which is long enough to cause adverse effects on the aquatic
species. Compared to other dechlorination chemicals mentioned above, hydrogen
peroxide seems to pose a threat to the aquatic species at much smaller concentrations
(Advanced Sterilization Products, 2005).
Tikkanen et al. (2001) have also found that treatment with AA can deplete water pH,
which can result in deleterious effects to the aquatic species. The addition of
stoichiometric and twice the stoichiometric amounts of the dechlorination chemicals can
reduce the pH of the water by 0.3 and 0.6 pH units, respectively (Tikkanen et al, 2001).
Thus, even though ascorbic acid does not have a direct impact on the aquatic species, it
could have an indirect impact by reducing the pH of the water. These indirect impacts
need further consideration and research.
The aquatic health impacts of dechlorination chemicals can be directly studied through
aquatic toxicity testing, however, human health effects are not as easily studied.
Nevertheless, knowing the human health effects of primary and secondary exposure to
these dechlorination chemicals will help identify the least harmful chemical to be used in
wastewater practice. Section 2.3.2 provides a brief review of the literature of the human
health effects of the seven dechlorination agents under consideration.
37
2.3.2 Human Health Effects
There are two main ways in which these dechlorination agents could come into contact
with humans and cause health impacts. Typically, these chemicals may pose an
occupational health hazard to their handlers at wastewater treatment facilities, especially
because they are exposed to high concentrations over a long period of time. The general
population may be exposed to much lower concentrations because typically, treated
wastewater is discharged into freshwater lakes, rivers, or oceans that support contact and
non-contact recreation or serve as a source of potable water. Thus it is important to get
an understanding of the human health effects resulting from primary and secondary
contact with these dechlorination chemicals. Table 4 summarizes short-term (acute) and
long-term (choric) human health effects of exposure to the selected dechlorination
chemicals.
Sulfur salts, SS, SBS and SMBS, all have National Fire Protection Association (NFPA)
health hazard ratings (0 - 4) (see Appendix 1 for details) of 2, 1 and 3, respectively.
SMBS is declared by NFPA as the most hazardous of the three sulfur salts considered.
Nonetheless, all the sulfur salts have health effects on the human skin, cardiovascular and
central nervous systems. Ingestion of sulfite compounds may cause severe allergic
reactions (anaphylactoid symptoms) in sensitive individuals and some asthmatics.
Exposure to larges doses of sulfur compounds over a short period of time could cause
circulatory disturbances, diarrhea, and depression of the central nervous system.
38

Table 4: Potential human health effects of dechlorination chemicals
Chemical
Sodium sulfite3'1
Sodium bisulfite4'2'1
Sodium metabisulfite1'2'3
Sodium thiosulfate5
Calcium thiosulfate6
(30% w/v) Ascorbic acid
Hydrogen peroxide (30% w/v)7
NFPA health Rating
2 - may be harmful if inhaled or absorbed 1 - may be irritating
3 - corrosive or toxic - avoid skin contact or inhalation
1 - may be irritating
0 - no direct health hazard
1 - may be irritating
3 - corrosive or toxic - avoid skin contact or inhalation
Potential Health Effects Acute
- only moderately toxic in large amounts - produce central nervous system depression, bronchio-constriction and anaphylaxis in asthmatics - gastric irritation - large doses: circulatory disturbances, diarrhea, and central nervous system depression - skin, eye, respiratory tract irritation with coughing and wheezing - harmful if swallowed - cause skin and eye irritation - ingestion of large amounts may cause diarrhea - probable lethal dose for humans is 0.5-5.0 g/kg.
- ingestion of large amounts may cause diarrhea
- eye, skin irritation and respiratory tract irritation if inhaled7
-ingestion of large amounts may cause gastrointestinal tract irritation, urinary stones, and renal failure7
- large doses cause nausea9, diarrhea9
- toxic and corrosive can cause serious burns - eye contact cause serious injury such as blindness - lowest published lethal dose for humans is 1429 mg kg"1
Chronic - eye and respiratory tract irritation. - harmful if swallowed or inhaled - highly corrosive - allergic dermatitis - skin sensitization - target organs damage - affect the liver, urinary system, and metabolism (weight loss) - irritate lungs, cause bronchitis
- may cause bluish skin color - human exposure to 300 mg/kg of the pentahydrate, for 7 days, resulted in cyanosis - used for therapeutic purposes in small (15-20 mmol/day) concentrations - large doses: affects unknown - large doses: affects unknown
- may affect the blood/bone marrow and metabolism7
- may also affect behavior7
- mutagenic effects9
- mutagenic effects
'Science Lab Inc., 2005b; 2Tikkanen et al, 2001;3 Mallinckrodt Chemicals, 2005; "ESSECO USA, 2001;5
MDL Information Systems, Inc, 2002; Tramfloc Inc., 2002; Oxford University, 2005; See Section 2.1.2.8 above for details of the NFPA Hazard Rating system; Science Lab Inc., 2005a.
39

Short-term exposure to sulfur compounds can cause eye and respiratory tract irritation.
Since these salts are highly corrosive, contact with the skin can result an allergic
dermatitis, which is an allergic reaction. In addition, sulfur salts can cause skin
sensitization, which is also an allergic reaction that becomes evident upon re-exposure to
this chemical. Ingestion of sodium sulfite, bisulfite or metabisulfite, could cause damage
to the liver and the urinary system and effect metabolism, causing weight loss. Prolonged
inhalation of sulfur compounds may irritate the lungs and cause bronchitis to develop
with cough, phlegm and/or shortness of breath. (Science Lab Inc., 2005b; Tikkanen et al,
2001; Mallinckrodt Chemicals, 2005; ESSECO USA, 2007)
Short-term exposure to STS can cause skin, eye and respiratory system irritation and STS
is declared to be non-carcinogenic (MDL Information Systems, Inc., 2002). With a
NFPA health rating of 1, STS is categorized as an irritant, similar to SBS and AA. STS
is neither a genotoxic nor a reproductive/developmental toxicant, and up to 5 times molar
concentration (M) of STS was found to have no effect on human cells (USEPA, 2003).
In addition, once ingested, thiosulfates are utilized by mitochondrial enzymes in humans
and the excess is rapidly hydrolyzed into sodium chloride, water, sulfur and sulfate, all of
which are harmless common constituents of the human body. Due to the rapid
breakdown by mitochondria, STS does not have any negative cumulative effects on the
human body (USEPA, 2003). However, if ingested in large doses, STS can cause
diarrhea and the chronic effect of bluish skin (MDL Information Systems, Inc., 2002).
Health effects resulting from the long-term exposure to large doses of STS are unknown
(MDL Information Systems, Inc., 2002). However, chronic exposure to smaller doses of
40

STS ( 1 5 - 2 0 mmol/day orally) is a common therapeutic practice for patients with renal
failure, and has been shown to have no adverse effects on patients with renal failure.
Give that STS is a strong diuretic (USEPA, 2003), it is not very well absorbed by the
human gastrointestinal tract, thus ingestion may result in cathartic effects (act as a
laxative) (MDL Information Systems, Inc., 2002).
CTS has a NFPA health hazard rating of zero, meaning it produces no direct health
hazard. Of all of the seven dechlorination chemicals considered, CTS is the only
chemical declared as non-hazardous by the NFPA (Tramfloc Inc., 2002). However,
similar to STS, short-term CTS exposure can cause diarrhea and nausea. Compared to
the other chemicals under consideration, there is a minimal amount of literature published
in the effects of CTS on human health (Tramfloc Inc., 2002).
AA with a NPFA health hazard rating of 1 is declared to be an irritant. Short-term
exposure to large amounts of ascorbic acid may cause skin, eye and respiratory tract
irritation. Ingestion of small amounts of AA during industrial handling is declared to pose
a low health hazard. However, ingestion of large amounts can cause gastrointestinal tract
irritation, hypermotility, diarrhea, acidification of the urine, which may cause stones in
the urinary tract, and renal failure. (Science Lab Inc., 2005a) There is a scarcity of
information available on the carcinogenicity of AA; however long-term exposure is
known to cause mutagenic effects on mammalian somatic cells (Oxford University,
2005). Chronic AA exposure could potentially effect blood/bone marrow and
41

metabolism and may effect behavior (psychomotor) in humans as well (Science Lab Inc.,
2005a).
With an NFPA rating of 3 (corrosive or toxic - avoid skin contact or inhalation), HP
(30% w/v) is a highly corrosive dechlorination chemical that readily decomposes to
oxygen and water, and it may also produce hydroxyl radicals that can cause DNA
damage if ingested by humans (CSTEE, 2001). Short-term exposure to HP can result in
serious burns, and eye contact can lead to blindness (Oxford University, 2005).
Therefore, the occupational exposure limits in the UK (OEL) are set to 1 ppm. The
lowest published lethal dose for humans is 1429 mg kg"1 (Oxford University, 2005),
which is much higher than the concentrations that may present in receiving waters as a
result of wastewater treatment plant discharge. In addition, HP is found to be genotoxic
and induce mutations in human mammalian cells (CSTEE, 2001; Oxford University,
2005).
Although there are no direct human health impacts resulting from the exposure to the
dechlorination chemicals in consideration, the indirect human health effects of these
dechlorination chemicals need consideration before the use of these chemicals can be
deemed safe. Francy et al, (1996) found that dechlorination of disinfected wastewater
can enhance the repair of injuries and survival of chlorine-injured fecal coliforms
compared to chlorination alone. This repair mechanism that occur as a result of
dechlorination was observed only in lake water but not in river water, yet the reason for
this discrepancy in the case of lake and river water was not investigated by Fancy et al.
42

(1996). However, from the work of these researchers it is evident that repair mechanisms
exist for injured fecal coliforms to recover, which can defy the purpose of disinfecting
with chlorine. Coliform injury repair and survival can have a negative impact on the
receiving water quality, and might exceed the allowable fecal coliform levels effecting
recreational potential of lakes and rivers. Thus, the implications of dechlorination on the
recovery of fecal coliforms need further assessment.
Considering the human health effect resulting from acute and chronic exposure to the
seven dechlorination chemicals discussed above, it is safe to conclude that the majority of
the chemicals at low concentrations do not pose a serious direct threat to human health.
Nonetheless, it is important that additional care be taken when handlings large quantities
of these chemicals to avoid accidents that could result in exposure to harmful levels of
these chemicals.
43

Chapter 3 3 Methodology
This chapter provides a detailed description of the methodology used for both the
dechlorination, and the aquatic toxicity experiments, respectively. For the dechlorination
experiments, the materials and methods used, dechlorination agents and the variables
tested, and a list of experiments undertaken is included. Information regarding the
Daphnia magna experiments undertaken as a part of the aquatic toxicity tests, also
includes a description of the culturing of the test organisms, test procedures and a list of
experiments.
3.1 Dechlorination Experiments: Materials and Methods
Dechlorination experiments were conducted to investigate and compare the reaction
kinetics of the seven dechlorination agents with chlorine. The objectives of these
experiments were to investigate the efficacy of dechlorination under a range of
44

conditions. The rate of dechlorination was investigated under various dosage conditions,
solution pH and mixing conditions.
Experimental Apparatus
The experimental setup and a flow diagram is shown in
Figure 3 and Figure 4. The 8 L experimental container
was used as the reactor, which was connected to 1.8 m
of lAn ID x 3/8" OD 70F non-toxic PVC NSF-51 tubing,
coupled to 0.28 m of Microflex® 06486-24 tubing
running through the peristaltic pump (mode 7024-20).
The peristaltic pump was used to continuously pump the
test solution from the experimental container through
the Dulcometer® Continuous pH and Chlorine analyzer.
The Microflex® tube running through the pump was
connected to the flow stabilizer with 0.25 m of Tygon®
R-3603 tubing using plastic coupling that was attached Figure 3: Experimental setup
to the chlorine residual analyzer with 0.18 m of the same type of Tygon® tubing. A flow
diagram of the experimental setup is shown in Figure 4.
45

|FC & pHl
d\
\ y Probes -
w Dulcometer® Continuous pH & Chlorine analyzer.
18 cm of Tygon® R-3603 tubing
100 cm of Tygon® R-3603 tubing
VWR™ overhead mechanical
stirrer
Flow Stabilizer
25 cm of Tygon® R-3603 tubing
Peristaltic Pump (mode 7024-20)
cm of Microflex® 06486-24 tubing
80 cm of %" ID x 3/8" OD 70F PVC NSF-51 tubing
45 cm
18 L Reactor
3-Blade Propellet
H =38.5 cm
15 cm Test Water (8 L)
d = 15 cm
Figure 4: Detailed schematic of the experimental setup. Not drawn to scale.
A VWR™ overhead mechanical stirrer (Power Max Elite Dual Speed Meter) with a
simple on/off switch was used to mix the sample. A 3-blade propeller (Figure 5) with a
radius of 8.5 cm was attached to the mixer with a 45 cm iron rod.
46

Figure 5: Three-blade propeller used to mix the experimental solution.
Dechlorination experiments were conducted using an online continuous pH and chlorine
residual analyzer, DULCOMETER® D1C (Figure 6). The total chlorine (TC), free
chlorine (FC), temperature, and the pH of the experimental solutions were continuously
monitored and recorded over time until the reaction reached completion and for those that
did not reach completion, until 720 seconds have elapsed.
Complete dechlorination was considered to be achieved once the total chlorine levels
reached below 0.02 mg/L as Cb. However, only the residual analyzer measurements
above 0.10 mg/L were considered. Once the chlorine values reached below 0.10 mg/L, a
DPD test was conducted to measure and verify the chlorine levels in the solution. If the
reaction was complete at the stoichiometric dosage shown in Table 3, over a reasonable
amount of time (less than 180 seconds), less than stoichiometric dosages were tested to
investigate the minimum dosage required. On the other hand, if the reactions did not
reach completion within 720 seconds with the stoichiometric dosage, higher dosages (1,
47

2, 3 and 4 x stoichiometric dosages on a weight-basis, mg DA/ mg Cb) were tested until
complete dechlorination was achieved.
The DULCOMETER® CTE 1-mA type total chlorine probe and a CLE-3 mA type free
chlorine probe with measuring ranges of 0.05 - 5 mg/L were used to monitor the total
and free chlorine concentration in solution. Even though the resolution of the probes
were specified as 0.01 mg/L, during the experiments it was found that the probe was only
reliable down to about 0.10 mg/L. The D1C analyzer was able to measure pH ranging
from 0 - 14 pH units. However, the sensors that were used in these experiments were
most effective in the pH range of 5.5 - 9.5. The sensors were designed with an
amperometric membrane that allowed specific ions to pass through, and in time react
with an electrolyte. The current measured by the sensor was proportional to the
concentration of TC and FC in solution in parts per million by volume (ppm). Since 1 L
of pure water at 4°C and 1 standard atmosphere pressure weighs exactly 1 kg, 1 ppm of
water is equivalent to 1 mg/L (Satterfield, 2004), thus the readings were directly recorded
in mg/L. The FC sensor measured hypochlorous acid concentration (HOCl) in the
experimental solution, while the TC sensor measured the free and combined chlorine
concentration together.
48

Figure 6: DULCOMETER D1C online continuous pH and chlorine residual analyzer
Obtained chlorine values from the continuous chlorine analyzer were periodically
checked and recalibrated against DPD chlorine measurements using the Hach® DR2800
spectrophotometer (Figure 7), Total Chlorine (DPD Method 8167) and Free Chlorine
(DPD Method 8021) powder pillows, respectively.
Figure 7: Hach® DR2800 spectrophotometer and free/total chlorine powder pillows.
There was a lag time for the test solution to travel from the experimental container to the
pH, FC, and TC sensors of the analyzer as it had to travel through the tubes. These lag
times were determined to be 15, 17 and 20 seconds from the experimental container to
49

the pH, FC and TC sensors, respectively. In order to compensate for the delay in
traveling from the container to the sensors, data analysis was modified by omitting the
first 20 seconds of the obtained TC and FC values in the analysis. In some cases where
the 20 second reading was not obtained, up to 25 seconds of the initial readings were
omitted, which will be further discussed in Chapter 3. Also, once the FC and TC values
reached below 0.10 mg/L, the sensitivity of the chlorine analyzer deteriorated. Therefore,
the TC and FC values below 0.10 mg/L were also omitted from the data analysis.
Test Solution Preparation
The experiments were undertaken using tap water to minimize other variables, such as
nitrogen content in wastewater, that can interfere with the D1C analyzer measurements to
obtain the kinetics of these experiments under 'ideal' conditions with minimum or no
interferences. A comparison between the composition of typical wastewater effluent and
the test water used in this study is provided in Table 5. Since this experimental study was
conducted using chlorinated tap water to prevent the formation of chloramines, one could
argue the usefulness of these results in application at actual wastewater facilities with
high levels of inorganic and organic chloramines (e.g. NH2CI, NHCI2, RNHC1) in the
wastewater. Many of the dechlorination chemicals, especially sulfites, are known to be
highly effective in rapidly reducing inorganic forms of chlorine species (e.g. HOC1, OCl",
NHCI2, NCI3) (EC, 2001b), yet slow in reducing organic forms of chlorine species. Thus,
this experimental study of the reduction of inorganic forms of chlorine species (e.g.
HOC1) is very useful in determining the minimum dose, contact time, pH and mixing
requirements necessary to achieve dechlorination of the wastewater effluent. Knowing
50

that the rest of the effluent constituents are slow reducing, the dosage and the contact
time can be increased accordingly to achieve complete dechlorination of the effluent with
varying water quality.
Table 5: Comparison of the composition of municipal wastewater effluent and the test water of this experimental study.
Parameter
Total Residual Chlorine, mg Cl2/L Total suspended solids (TSS) Nutrients
- total phosphorus - nitrogen-based compounds
/ total nitrogen (nitrate, nitrite, ammonia, and ammonium) Microorganisms (e.g. fecal coliforms) Sulphides PH Turbidity, NTU Monochloramine, mg Cl2/L Free Chlorine, Temperature, °C Total hardness, mg CaC03/L
Municipal Wastewater
0.95*
20 - 80 mg/L
10-16gP/m 3
10-35gN/m3
108perl00mL
0.100 Sg/m3
6.5-8.5 1.8-9
— —
20±2 324-668
Test Water
1.5-2
Not measured
Not measured 0.15-0.30 NH3-N
mg/L
Not detectable
Not measured 6.5 - 8.5
0.15-0.20 2 - 3
0.05 - 0.20 20±2°C 160-180
— unknown * EC, 2003b
In addition, chemicals (see Table 6) were added to increase the hardness of the test
solution to 160- 180 mg/L as CaCC>3 to simulate the typical hardness of river and lake
water in Ontario, and to reflect that wastewater is expected to be fairly well buffered.
Another purpose of using the hardened water was to stabilize the pH values of the
solution and to mimic the composition of water used in the Daphnia Magna toxicity
testing. The composition of the prepared hard water is shown in Table 6.
Table 6; Preparation of hard water with hardness between 160 — 180 mg/L as CaCQ3
Chemical
NaHC03
CaS04
MgS0 4
KC1
Final Concentration
192 mg/L 120 mg/L 120 mg/L 8 mg/L
Weight in 8 L Sample
1536 mg 960 mg 960 mg 64 mg
Stock Concentration
15.36 g/100 ml = 153.6 g/L
Stock volume / 8 L 10 ml
Added directly as a solid 19.2 g/ 200 ml = 96 g/L 6.4 g/100 ml = 64 g/L
10ml 1ml
51

The stock solutions of NaHCC>3, MgS04, and KC1 were prepared by dissolving 15.36 g,
19.2 g, and 6.4 g of the solid in 100, 200 and 100 ml of DI water, respectively, in a
volumetric flask of the appropriate volume. They were labelled and stored in amber
bottles in a dark, cool place. Since the solubility of CaSC>4 in water is appreciably low,
stock solutions were not prepared. Instead, 0.96 mg of CaSC>4 was weighed separately,
dissolved with 100 ml of the experimental water and then added to the bucket to ensure
homogenous mixing.
Experimental Procedure
The experimental reactor was filled with 8 L of hardened (Table 6) tap water, and the
tubes leading to and leaving the chlorine analyzer were connected to the container. The
container was covered with the lid and the peristaltic pump was turned on. The flow rate
was set to 60 L/hr using the flow control unit attached to the D1C analyzer. The
mechanical mixer was turned on and set to the appropriate rate (130 RPM for periodic
and continuous low mixing and 275 RPM for continuous high mixing). The flow meter
was run for approximately 15 to 20 minutes and a set amount of Javex (usually 600 uL -
corresponding to 4 - 5 mg/L of TC in solution) was injected into the container to increase
the chlorine concentration in solution. Then the D1C analyzer was run until the
displayed total and free chlorine values stabilized. When the reading stablized, the total
and the free chlorine of the water was measured using the DR 2800 spectrophotometer
Total Chlorine DPD Method 8167 and the Free Chlorine DPD Method 8021,
respectively. If the displayed values of FC and TC of the analyzer and the HACH
52

measurement were not in agreement, the analyzer was calibrated according to the HACH
analyzer values.
The volume of the dechlorination agent (DA) to be added was calculated using the
following equation:
Tr . . „ , , , TC (mg/ L) x vol.of test solution (L) x stoich.ratio (unitless) Vol. of DA req'd = ^ -=—- - — - - (1)
Concentration of DA stock solution (mg/L)
For SS, SBS, SMBS, CTS, and STS the prepared stock solution concentration was 10
g/L. The stock solutions were prepared by dissolving 5 g of the respective chemical in
500 mL of DI water. Once the required volume of DA was determined, a pipette was
used to add the determined volume of DA into the experimental container, and the timer
was turned on simultaneously. The total and free chlorine values as well as the pH
values displayed on the analyzer was noted starting at t = 0 until the reaction was
complete or until 720 seconds (12 minutes) has elapsed.
3.1.1 Dechlorination Agents Tested
Seven dechlorination agents were studied: sodium sulfite (SS), sodium bisulfite (SBS),
sodium metabisulfite (SMBS), sodium thiosulfate (STS), calcium thiosulfate (CTS),
ascorbic acid (AA), and hydrogen peroxide (HP). Since the injection of sulfur salts is
the most commonly used strategy for dechlorination in practice (USEPA, 2000), three of
the sulfur salts - SS, SBS and SMBS were tested. Although, SMBS hydrolyzes to SBS
when added to water, which is a method utilized by researchers to produce bisulfite
(Yonkos et al, 2001), it was tested as a separate chemical for comparison purposes. STS
was chosen because it is being used widely in the United States, and AA and CTS were
53

considered because they are reported to be non-toxic to aquatic species (Tikkanen et al,
2001). HP was tested for the same reasons; its use in wastewater application has no
negative impact on receiving water bodies, and it boosts the DO levels in the water
bodies (EC, 2003).
3.1.2 Variables Tested
Three variables were tested for each dechlorination agent: DA concentration, mixing
regimes and the solution pH. The following sections further discuss these variables
tested.
3.1.2.1 Dechlorination Agent Concentration
Stoichiometric as well as higher dosages (1, 2, 2.5, 3, 4, 10 x stoichiometric on a weight-
basis, mg DA/ mg CI2) of dechlorination agents were tested to determine dechlorination
rates of the seven dechlorination chemicals. The required stoichiometric dosages for
each chemical were calculated according to the chemical reaction equations as shown in
Appendix 2. For example, the calculation for SS was as follows:
Na2SOi + HOCl -> Na2S04 + HCl Sodium sulfite Hypochlorous acid Sodium sulfate Hydrochloric acid
CL + HO^> HOCl + H+ + Cr Stoich. dosage for SS
= 1.78 mgSS/mgCl2 126 mg Na2 S03 \molNa2 S03 1 mol HOCl
1 mol Na2S03 1 mol HOCl 70.9 mg Cl2
For the two thiosulfates that were tested - STS and CTS - the stoichiometric dosage
required is reported to be pH dependent (Tikkanen et al, 2001). For STS and CTS at a
pH of 11 the stoichiometric dosage is 0.56 and 0.45 mg /mg Cb, respectively. However,
54
at a pH of 8 and 7.35 the dosage increases to 1.86 mg/mg CI2 for STS and 0.99 mg/mg
CI2 for CTS, respectively. In these experiments the pH of the experimental water ranged
from 7.5 to 8.5, Therefore the later concentration were used as the stoichiometric basis.
The Table 3 summarizes the required stoichiometric dosage of each dechlorination
chemical to neutralize 1 mg of CI2 residual in solution.
3.1.2.2 Mixing Regimes
Three different mixing regimes were tested for each dechlorination agent to investigate
the affects of variable mixing conditions on the reaction rate, and thus the required
reaction time. Samples were either periodically mixed or continuously mixed at two
different intensities (275 or 130 RPM). In the case of the continuous mixing, the
mechanical mixer was continuously operated at 130 and 275 RPM for the full length of
the experiments, from the point of dechlorination agent addition until the reaction was
fully complete. For the periodic mixing case, the samples were mixed at 130 RPM for
only the first 10 seconds following the addition of the dechlorination agent.
Typically, in wastewater applications, the mixing intensity is measured represented by
the G-value, and the RPM values used in this study can be converted to G-values using
the following formula:
( p V /2
G= — (2)
G = mean velocity gradient
P = power input (Nm/s or W)
\i = viscosity of water at a given temperature (N.s/m2)
55

V = volume of the reactor (L)
,«p.W.W™) (3) 33000ft.lb
G value is a function of tank volume, water temperature, and mixer shape, size, and
horsepower (HP). Based on the toque value of 90 in.oz as indicated on the display unit of
the mixer with a 9.5 cm impeller, equation 3 was used to calculate the power input (P).
For example, for the 130 RPM mixing intensity the G-value was calculated as follows:
P ( P V/2
G= K»Vj
T=90 in.ozx—l-^-— = 0.469 ftJb 12x16 in.oz
33000 ft.lb \HP
ju=0.00$9N/s.m2
V=SL=0.008m3
S.65Nm/s / \ l / 2
G = v0.0089iV/5./n2(0.008/M3)y
=349 s'
Similarly, the G-value for the 275 RPM mixing regime was calculated to be 507 s" .
The dosage tested for the effect of mixing conditions varied for each dechlorination
chemical. Since the lOx stoichiometric dosage reactions were very fast, the next highest
dosages that reached complete dechlorination in less than 180 seconds were tested for the
275 RPM and the periodic mixing cases, due to time constraints.
56

3.1.2.3 pH
Two different pH ranges were tested: pH 6.5 - 8.5 and > 9. The former is the typical pH
range of municipal wastewater (WEF & ASCE, 1998), whereas the pH range > 9 was
chosen to simulate the scenario where the pH is slightly over the higher margin of the
typical pH range of wastewater. Sulfuric acid (H2SO4) was used to lower the pH and
sodium hydroxide was (NaOH) used to increase the pH of the test solutions.
3.1.3 Methods of Data Analysis
There are two types of analysis of kinetic data; the differential rate law shows how the
rate of the reaction depends on concentrations, while the integrated rate law shows how
the concentrations of the species in the reaction depend on time. Since the concentration
of the reactants were measured as a function of time in these experiments, this data is
useful in determining the integrated (concentration/time) rate law for the seven
dechlorination chemicals. However, the form of the integrated rate law used for any
reaction is dependent on the type of the reaction in consideration. The data was
analyzed using the integral method because this method is useful when fitting simple
reaction types corresponding to elementary reactions, and depending on the kinetic form
of the reaction, integration yields different results. (Levenspiel, 1999; Zumdahl, 1998)
Also, the integral method is easy to use, and is recommended when testing relatively
simple rate expressions. The differential method was not used as it requires larger
amounts of data. (Levenspiel, 1999) The following presents the way in which the order
of the dechlorination reactions was determined.
57

A particular rate equation was put to the test by comparing the predicted concentration
versus the time curve with the experimental concentration versus time data (Levenspiel,
1999). Two different methods of analysis were used depending on the form of the
reaction equation.
• Primary Method: When DA is well in excess (lOx) of the stoichiometric
requirement
o Irreversible Unimolecular-Type Reactions: A -> products
• Zero order
• Pseudo-first order
• Pseudo-second order
• Secondary Method: When DA is close to the stoichiometric requirement.
o Irreversible bimolecular-type second-order reactions:
• Stoichiometric ratio of DA to CI: 2A -> products
• Greater than stoichiometric ratio (2-4x): A + B -> products
Initially, the lOx stoichiometric data for all the chemicals were analyzed using the
primary method and categorized into four different categories depending on the deduced
reaction order. The four categories are: zero order kinetics and pseudo-first order. The
kinetic data obtained for l-4x stoichiometric dosages was analyzed using the secondary
method. The following sections discuss the two methods of reaction order analysis used
in this study.
58

3.1.3.1 Determination of the Reaction Order with Respect to Total
Chlorine Concentration: Irreversible Unimolecular-Type
Reactions
Even though the dechlorination reaction is in the form of DA + CI2 •> Product, when the
DA is well in excess of the stoichiometric requirement, this reaction form reduces to a
unimolecular reaction in terms of total chlorine. The assumption in unimolecular
reactions is that if the initial concentration of the dechlorination agent (henceforth
represented by [DA]0) is much higher than the initial concentration of total chlorine in
solution (henceforth represented by [TC]0) the DA concentration will not change
appreciably over the course of the reaction (Levenspiel, 1999). Thus, in order to
investigate the order and the rate constants of the reactions in terms of the total chlorine
concentration in solution, 10 x stoichiometric dosages was tested.
The data obtained were subjected to three order tests, and plots were constructed for each
of the seven dechlorination chemicals to investigate the order of the reaction:
1. Zero order kinetics: —r = k
CA=-kt+C0 -> Thus, t = Uc0-CA)
k
Total chlorine (C) concentration versus time was plotted and if it yields a straight
line, the slope (k) represents the rate constant. For zero order reactions, the rate is
constant, and it does not change with concentrations as it does for first-order or
second-order reactions (Zumdahl, 1998).
2. First order kinetics: -rA = kCA
59

c (\\ -\n-^- = kt ->Thus, t= —
In this case the plot of ln(C/Co) versus time gives a straight line, where the slope
(-k) represents the rate constant. The derivation of the rate equation for a pseudo
first order reaction is included in Appendix 3.
3. Second order kinetics: - rA =kCA
1 , 1 „ 1 = kt-\ —» Thus, t-L. ^A CAO k
1 1 . C C ,
In this case the plot of 1/C versus time gives a straight line where the slope (k)
represents the rate constant.
The R2 values for the line of best fit for all the data points were compared among the
plots to deduce the order of the reaction for each of the dechlorination agents. The plots
were also visually investigated to assess the best fit. The plot with the highest R2 value
was chosen as the plot that produced the best fit, and the reaction order was assigned
accordingly.
3.1.3.2 Determination of Overall Reaction Order of Dechlorination
Reactions: Irreversible Bimolecular-Type Second-order
Reactions
Reaction form A + B -> Products
When analyzing an irreversible bimolecular-type (e.g. A + B -> R) second-order reaction
with CAo * CBo, the following rate expression can be tested:
In *- = CAJM-l)kt whereXA=\ *-andM=—^-*1 (4) M{\-XA) MK CAO CAO
60

CAo = initial concentration of chlorine in experimental solution (mg/L)
CBo= initial concentration of dechlorination agent added (mg/L)
XA = the fraction of chlorine converted to products
CA = concentration of chlorine in the experimental solution (mg/L)
In order to test the second order kinetics, plots of In —versus time were M(l-XA)
constructed and the obtained slope of the line was divided by CA0(M-\) to obtain the k
value, which represented the second order reaction rate constant. If the plot yields a
straight line then the reaction is determined to be second order.
If CBO is much larger than CAO (e.g. 10 x stoichiometric dosages of the DA), CB remains
approximately constant at all times, and as suggested by Levenspiel (1999), at this point
the second order reaction equation presented above becomes the following pseudo first-
order reaction:
- l n - ^ - = f c r
Reaction form 2A -> Products
For the reaction between the stoichiometric dosage of the dechlorination agent and
chlorine, since the initial concentration of chlorine and DA are equal, the second order
reaction test was undertaken as the reaction is in the form of 2A -> products. The
reaction rate constant, k, was then determined by testing this rate expression by plotting
— versus time. This method failed to yield plots of straight lines, and the predicted C ^ A
versus t plots were not in agreement with the experimental results. Thus, this method
was deemed unacceptable for the data analysis in this study.
61

3.1.4 List of Experiments
Table 7 lists the experiments undertaken for each of the dechlorination agents.
Table 7: List of experiments undertaken for each of the seven dechlorination chemicals.
I)A
Sodium Sulfite (SS)
Sodium Bisulfite (SBS)
Sodium metabisulfite (SMBS)
Sodium Thiosulfate (STS)
Calcium Thiosulfate (CT)
Ascorbic acid (AA)
Hydrogen peroxide (HP)
Stoichiometric Dosage Keq'd
(mg D/t/mg C7J
1.78
1.45
1.34
0.56
0 .45@pHll 0.99 @ pH 7.35
2.5
0.48
Variables Tested
Concentrations tested (x
stoichiometric)
l x 2x 3x 4 x 10 x lx 2x
2.5x 3x
lOx lx 3x 4x lOx lx 2x 3x lOx
lx 2x 3x lOx lx 2x 3x lOx O.lx 0.5x lx
lOx
Mixing
Continuous
130 KI'M
2 2 2 3 3 2 2 2 3 3 2 3 2 3 2 2 3 3 2 3 3 3 2 ^ 2 3 2 3 2 2 3
275 RPM
2
3
2
2
3
2
2
2
Periodic
2
2
3
3
3
3
3
PH 6.5 - ; >9
3
3
3
3
3
3
3
2
2
3
2
2
3
3
Minimum 2 or maximum 3 replicate experiments were undertaken for each
dechlorination chemical. Mixing and pH were varied only for a selected concentration.
62

3.2 Aquatic Toxicity Testing: Daphnia Experiments
The purpose of the daphnia experiments was to identify and assess the acute (short-term)
toxicity of selected dechlorination chemicals to the dominant aquatic herbivore Daphnia
magna through laboratory acute toxicity tests conducted according to the Environment
Canada method for acute toxicity testing (EC, 1990). Percentage mortality of Daphnia
magna was investigated under various concentrations of the dechlorination chemicals to
identify the least harmful dechlorination chemical to be used in practice.
3.2.1 Test Organism
The cultured organisms were maintained in DI water as required by the standard
procedure, with hardness added according to Table 6, to simulate the hardness of water in
North American rivers and lakes. The temperature of the culture solution was maintained
at 20 ± 1°C by placing them in an incubator with a photo-period of 16 h light: 8h dark of
"cool-white" fluorescent light of 400 - 800 lux. Dissolved Oxygen (DO) levels in the
culture media were maintained at > 80% by aerating if necessary. The pH of the culture
medium was adjusted to between 6 - 8.5, using hydrochloric acid (HC1) and sodium
hydroxide (NaOH), if necessary. Monthly 48 hour reference toxicity tests were
conducted using zinc sulfate (ZnS04) as the reference toxicant to investigate the general
health of the cultures. Stock cultures received daily water changes, and laboratory
cultured algae feed of 12 mL/L of dilution water, consisting of a mixture of Selenastrum
capricornutum and Chlorella pyrenoidosa and 4 mL/L of dilution water of laboratory
prepared Yeast-cerophyl-trout chow (YCT) (USEPA, 2002). YCT was prepared
according to the method outlined by USEPA (2002) using FLEISCHMANN'S® Yeast,
63
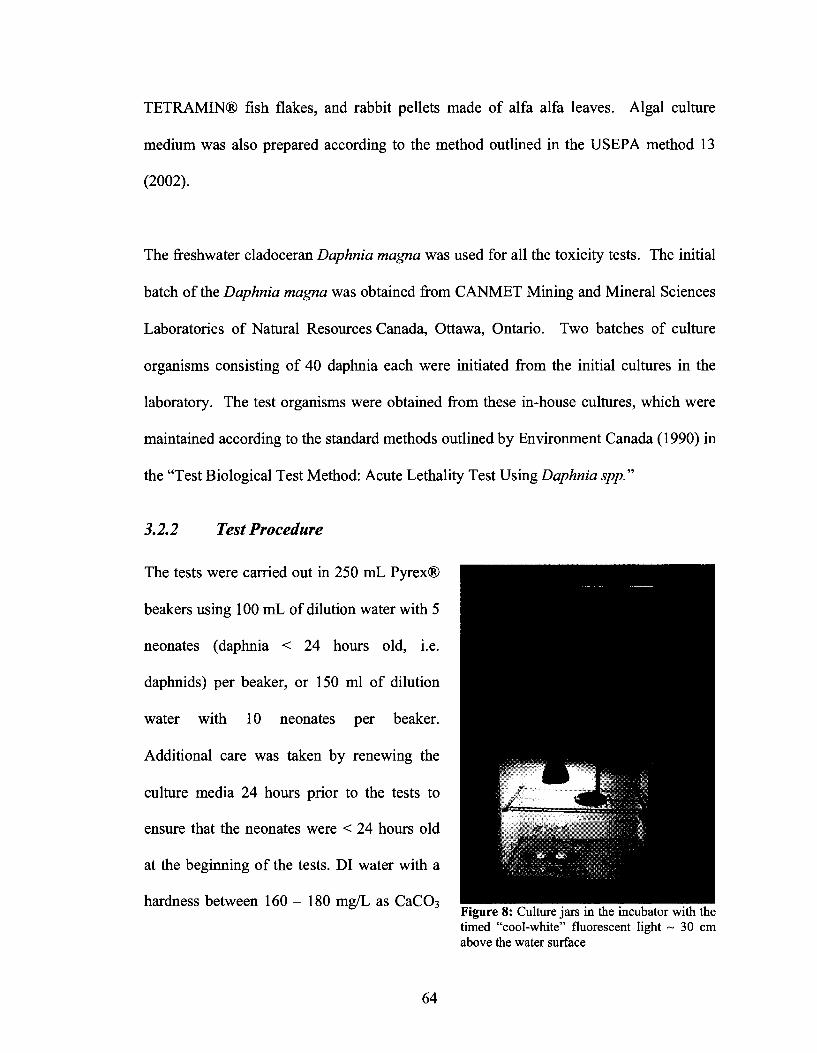
TETRAMIN® fish flakes, and rabbit pellets made of alfa alfa leaves. Algal culture
medium was also prepared according to the method outlined in the USEPA method 13
(2002).
The freshwater cladoceran Daphnia magna was used for all the toxicity tests. The initial
batch of the Daphnia magna was obtained from CANMET Mining and Mineral Sciences
Laboratories of Natural Resources Canada, Ottawa, Ontario. Two batches of culture
organisms consisting of 40 daphnia each were initiated from the initial cultures in the
laboratory. The test organisms were obtained from these in-house cultures, which were
maintained according to the standard methods outlined by Environment Canada (1990) in
the "Test Biological Test Method: Acute Lethality Test Using Daphnia spp."
3.2.2 Test Procedure
The tests were carried out in 250 mL Pyrex®
beakers using 100 mL of dilution water with 5
neonates (daphnia < 24 hours old, i.e.
daphnids) per beaker, or 150 ml of dilution
water with 10 neonates per beaker.
Additional care was taken by renewing the
culture media 24 hours prior to the tests to
ensure that the neonates were < 24 hours old
at the beginning of the tests. DI water with a
hardness between 160 - 180 mg/L as CaC03 Figure 8: Culture jars in the incubator with the timed "cool-white" fluorescent light ~ 30 cm above the water surface
64

was used as the dilution water. Temperature, DO, pH and conductivity of the test
solutions were measured at least once at the beginning, or at the end of the tests as
recommended by EC (1990). The temperature of the test solution was maintained in the
incubator at 20 ± 1°C with a photoperiod of 16 h light: 8h dark of "cool-white"
fluorescent light of 400 - 800 lux (Figure 8). The pH and the DO of the test solutions
were not adjusted after the addition of the DA during the test setup, since suppression of
pH and DO was one of the indirect effects of some DA on the aquatic environment (EC,
2003; Ryon et al, 2002). Thus, test solution pH and DO was measured before and after
the addition of the DA for comparison purposes. The daphnids were not fed during the
tests that lasted 48 hours and were visually observed in terms of mortality and movement
at the beginning (0-1 hours) and at the end of the test (48 ± 2 hours). Three replicates for
each of the tests were used and the beakers were clearly labeled to indicate the
concentration of DA. A control group was also tested (dilution water only) for
comparison purposes.
Stock Solution Prepared from Solids:
Stock solutions with a concentration of 10 g/L were prepared for SS, SMBS, SBS, AA,
and STS by weighing and dissolving 1 g of the reagent grade chemical in the solid
(crystal or powder) form in 100 mL of DI water. The stock solutions were prepared the
day of the test in 100 mL volumetric flasks and stored in amber bottles (to prevent photo-
reactions) in a cool and dry place. Fresh stock solutions were prepared at the beginning
of each test since previous studies reported a drop in S(IV) levels in stock solutions of
SMBS over 48 hours (Yonkos et al, 2001).
65
Stock Solution Prepared from Solids:
For HP and CTS the 30% w/v stock solution was diluted by adding 1 mL of stock into 10
mL of DI water, and appropriate volumes were added to each test solution to achieve the
desired concentration below 20 mg/L.
Sample Calculations:
Concentrations of DA ranging from 0 - 200 mg/L were tested and the volume of DA
stock solution needed to achieve a given concentration of DA (e.g 200 mg/L) in the 100
mL test beaker was calculated as follows:
Calculation 1 - For SS, SBS, SMBS, STS, and AA with 10 g/L (= 10 mg/mL) stock
solution concentration:
Desired DA concentration in 100 mL test solution = 200 mg IL
Mass of DA needed for 100 mL = xlOOmL = 20mg lOOOmL
^A 7 7 \mL DA stock volume x2\)mg = 2 mL
10 mg
Calculation 2 - For CTS and HP with 30% w/v (= 30 mg/mL) stock solution
concentration:
Desired DA concentration in 100 mL test solution = 200 mg IL
Mass of DA needed in 100 mL = xlOOmL = 20/we lOOOmZ
DA stock volume = x20mg = 0.667 mL = 666 juL 30 mg
66

3.2.3 List of Experiments
The concentrations of dechlorination chemicals tested for acute toxicity varied from 0 to
200 mg/L. The maximum limit was conservatively set to 200 mg/L, because such high
concentrations of dechlorination chemicals are not expected in the wastewater effluent on
a regular operation basis, although 200 mg/L could potentially represent an accidental
spill into the aquatic environmental. Table 8 outlines the concentrations tested for each
of the dechlorination chemicals, each of the concentrations was tested in replicates of 3.
Table 8: Concentrations of DA used in 48 hours Daphnia magna mortality testing
DA SS SBS SMBS STS CTS AA HP Chlorine
Concentrations Tested(mg/L)* 0,4.6, 20, 200 0,4.6,10,20,22, 50, 100,200 0, 20, 50, 80, 100, 200 0,4.6,10,20,22,46,100, 150,200 0,1, 5, 10,20, 80, 100,200 0, 1, 10, 20,100, 200 0,1,5,10,200 0,0.1,1,5,10
* For all of the dechlorination agents, a control solution was tested with dilution water and no dechlorination agent (0mg/L)
No chlorine was added to the test solution prior to the addition of the dechlorination
agent, because the purpose of these acute toxicity tests was to identify the toxicity affects
of the dechlorination agents themselves. Since the toxicity of chlorine itself to aquatic
biota is well known, and as such is regulated by the amendment to CEPA (1999), the
main focus of the aquatic toxicity tests was to identify the toxicity of the dechlorination
agents. However, a separate 48-hour toxicity test was undertaken using just chlorine to
substantiate the toxic effects of chlorine on Daphnia magna. Concentrations of 0.1, 1, 2,
and 5 mg/L CI2 were tested without adjusting the pH and the DO of the test solutions.
67
All the percentage mortality data obtained were plotted against the concentration of each
of the dechlorination chemicals to investigate the critical concentrations of each DA that
is needed to cause an appreciable mortality of daphnia. Also, for all the chemicals tested,
obtained mortality results were used to calculate the 48-hour LC50 values using the
Graphical Method suggested by the USEPA (2002). The LC50 value is the dechlorination
agent concentration at which 50% of the population died over the 48 hours. However, for
STS and SS, LC50 values could not be calculated using this method because these
chemicals did not cause any mortality at very high concentrations (e.g. 200 mg/L); the
obtained mortality rate did not bracket the 50% mortality mark for the concentrations
tested, and more tests could not be conducted at higher concentrations due to time
constraints.
68

Chapter 4 4 Results and Discussion This chapter presents the results and conclusions for the two phases of the experiments
undertaken as a part of this research project. Section 4.1 presents the results for the
dechlorination experiments and analyzes these results in terms of their application in the
wastewater treatment plant design. Section 4.2 includes a discussion of the acute toxicity
test results used to identify the toxicity of these chemicals to the common fresh water
herbivore Daphnia magna. Section 4.3 summarizes the application of the dechlorination
kinetics and the acute toxicity test results to the wastewater treatment plant design
process and explains how the results could be used to make decisions related to
dechlorination agent application point, appropriate dosage and the contact time of the
dechlorination agent needed to achieve complete dechlorination, and the best
dechlorination chemical to be used in practice considering the chemical costs and the
aquatic toxicity.
69

4.1 Dechlorination Experiments
The following sections discuss the results of the dechlorination experiments undertaken
to identify and compare the dechlorination kinetics of seven dechlorination chemicals
that are currently used in practice. The seven dechlorination agents studied were: sodium
sulfite (SS), sodium bisulfite (SBS), sodium metabisulfite (SMBS), sodium thiosulfate
(STS), calcium thiosulfate (CTS), ascorbic acid (AA), and hydrogen peroxide (HP). The
efficacy of these seven chemicals was evaluated under variable dosages, mixing regimes
and pH conditions. Section 4.1.1 presents the way in which the reaction order of the
dechlorination reactions was determined. In section 4.1.2 the affects of the three tested
variables on the dechlorination rate is discussed.
As discussed in the experimental methodology section, there was a 20 - 25 second lag
time for the reaction solution to travel from the experimental container to the analyzer.
Figure 9 shows the total chlorine data obtained for sodium metabisulfite, which mirrors
the other six dechlorination agents tested. Although the reactants were in contact at t = 0
seconds, changes in analyzer readings were not observed until 20 seconds had elapsed.
In the case where the 20 second data were not available, up to 25 seconds of the initial
data was omitted in the data analysis.
70

a E ~ 3 o 2 0)
o c o O !
$
•
* • 0 5 10 15 20 25 30 35 40 45 50
Time Bapsed (seconds)
Figure 9: Measured total chlorine concentrations overtime following the addition of sodium metabisulfite to the experimental solution.
Also, once the FC and TC values reached a level below 0.10 mg/L, the sensitivity of the
chlorine analyzer deteriorated and the Hach DPD method has also been reported to be
inaccurate (EC, 2003). Therefore, the TC and FC values below 0.10 mg/L were also
omitted from the data analysis.
4.1.1 Order of Dechlorination Reactions
The following sections present the way in which the order of the dechlorination reactions
were determined. Initially, lOx stoichiometric dosage of the dechlorination chemicals
were analyzed to determine the reaction order with respect to TC. Tests were conducted
for zero, first, and second order. For the dosages < lOx and > lx stoichiometric dosages,
the data were tested for first order kinetics with respect to both TC and DA
concentrations, to determine if the overall order of the reaction is second order. For the
lx stoichiometric dosage of the dechlorination agent, the data was not subjected to any
kinetic analysis as many of the chemicals failed to achieve complete dechlorination over
71

the 180 second time period. The following sections discuss the primary and the
secondary methods of reaction order analyses that were used in this study.
4.1.1.1 Determination of the Reaction Order with Respect to Total
Chlorine Concentration at lOx stoichiometric ration of
dechlorination agents
In order to investigate the pseudo-zero, -first and -second order kinetics for the seven
dechlorination chemicals tested with respect to the total chlorine concentration in
solution, total chlorine concentration (C), ln(C/Co), and 1/C versus time graphs were
constructed for the lOx stoichiometric dosage, respectively. A linear trendline was fitted
to the data, and the R2 values for each of these plots were compared to see the goodness
of fit (see Figure 10). The plot with the highest R value was chosen and the rate of the
reaction was determined to be the slope of the linear trendline fitted to all the data. The
following (see Figure 10) example demonstrates the method by which the order of the
dechlorination reaction was deduced for the lOx stoichiometric dosage of sodium
thiosulfate.
From Figure 10, the average R2 value for the zero, first and second order STS tests were
0.854, 0.923, 0.657, respectively. Even though the R2 value for the zero and the first
order plots are similar, visual examination of the plots reveal that the zero order plots are
closer to a curve than to a straight-line fit. Thus, since the ln(C/Co) versus time plot
produces the highest R2 value and the best visible straight-line fit of the data, the order of
the STS reaction was determined to be pseudo first-order with respect to the total chlorine
72

concentration in solution. From the slope of the trendline, the pseudo-first order rate
constant is determined to be 0.108 s"1.
Free chlorine concentration of the experimental solution was also analyzed as shown in
Figure 10. If the initial water sample was pure, the chlorine demand would be zero and
also there would be no ammonia and other organic matter, and thus when sodium
hypochlorite is added to the solution, combined chlorine will not be formed. If ammonia
is present in the water sample however, some free chlorine will be consumed, and
combined chlorine will be formed.
In pure water: Total residual chlorine (TRC) = Free Chlorine (FC)
In the presence of ammonia or other impurities:
Ammonia/organic matter + FC = Combined Chlorine;
TRC = FC + Combined Chlorine; and thus TRC > FC
73

I = 2
c 0) o c o O
y =-0.111x +5.221 R2 = 0.854
-0.063x + 3 R2 = 0.812
y = -0.084X + 4.269 R2 = 0.904
y = -0.153x + 6<60i R2 = 0.941
10 15 20 25 30 35 40 45
Time Bapsed (seconds)
• Total 02 runl o Total 02 run2 A Free 02 runl A Freel 0 2 run2
(a) Zero order test
65 70
-o -2 (J o "c -3
y = -0.085x + 1.756
-0.108x+2.218 R2 = 0.923
R2 = 0.931
y = -0.0862x + 1.8828 R2 = 0.9299
y = -0.1213x +2.6774 R2 = 0.9168
10 15 20 25 30 35 40 45
Time Bapsed (seconds)
50 55 60 65 70
• Total Q2 runl O Total 02 run2 A Free 02 runl A Free 02 run2
(b) Pseudo-first order test
15
10
5
y = 0.226x - 5.38& R2 = 0.737
y = 0.205x - 5.725 R2 = 0.655
y = 0.186x-4.429 R2 = 0. 116x-2.619
R2 = 0.635
10 15 20 25 30 35 40 45
Time Bapsed (seconds)
50 55 60 65 70
• Total Q2 runl o Total 02 run2 A Free 02 runl A Free 02 run2
(c) Second order test Figure 10 (a), (b), (c): Unimolecular pseudo first order tests for sodium. Data for the 10 x stoichiometric dosage at continuous low intensity mixing and pH 6.5 - 8.5 was used in the analysis.
74
The CEP A (1999) regulation requires that the total residual chlorine (TRC) in solution be
less than 0.02 mg/L. Thus, the reaction order was analyzed in terms of the total residual
chlorine concentration instead of the free chlorine concentration. The reason for using TC
is because the total and the free chlorine concentrations were not equal as expected,
which indicated the formation of combined chlorine species. The initial free chlorine
concentration was lower than the total chlorine concentration in solution possibly because
of the impurities of the water sample. For the free chlorine values below ~ 0.30 mg/L,
the measured free chlorine value exceeded the total chlorine value in solution because the
measuring equipment was not sensitive enough at such low values.
In addition, free chlorine values obtained were a lot more scattered compared to the total
chlorine values due to sensitivity issues in the measuring equipment. Also, the agreement
between the D1C residual analyzer measurements and the DPD measurements
deteriorated for values of free chlorine below 1.0 mg/L. For example, there were
instances where the DPD measurements were 0 mg/L while the analyzer had a reading of
0.12 mg/L. Therefore, the reaction kinetics were analyzed in terms of the total chlorine
in solution and not the free chlorine concentration.
A similar analysis was undertaken for the runs with rest of the six dechlorination
chemicals at lOx stoichiometric ratio (plots are shown in Appendix 3). For sodium
sulfite, metabisulfite, thiosulfate and hydrogen peroxide, the dechlorination reaction with
respect to the total chlorine concentration in solution was determined to be pseudo-first
order. The plot of ln(C/Co) versus time had the highest R2 value and the best visible fit,
75

thus the reaction order was concluded to be pseudo-first order. However, in order to be
certain that the reaction order and the rate found is the intrinsic reaction order, and the
reactions are not affected by other variables such as the dosage, mixing and pH, further
analysis was conducted under those variable conditions. This analysis is discussed in the
following sections.
Reaction with sodium bisulfite (SBS), calcium thiosulfate (CTS) and ascorbic acid (AA)
were identified to have zero order kinetics with respect to TC at the lOx stoichiometric
dosage, with the plot of total chlorine concentration versus time giving the best visible
straightline fit and the highest R2 value indicating that the reactions were zero order with
respect to TC.
The orders of the reactions obtained from the above analyses, as well as the determined
reaction rate constants (k), are reported in Table 9.
Table 9: Apparent reaction orders (with respect to total chlorine concentration) and rate constants for the seven dechlorination chemicals tested at lOx stoichiometric ratio.
Dechlorination Agent (DA)
Sodium Sulfite
Sodium Bisulfite
Sodium Metabisulfite Sodium Thiosulfate
Calcium Thiosulfate
Ascorbic Acid
Hydrogen Peroxide
Rate Equation
rTC=0.142[TC]
r xc = 0.626
rTC = 0.172[TC]
rTC = 0.108[TC] rTC = 0.280[TC]
r TC = 0.395 rTC = 0.502[TC]
R1
0.874
0.966
0.969 0.923
0.993
0.788
0.851
I'seudo Rate Constant (k)*
0.142
0.626
0.172
0.108 0.280
0.395
0.502
Reaction Order
Pseudo-first
Zero
Pseudo-first
Pseudo-first Zero
Zero
Pseudo-first * The pseudo rate constants are k[DA]x, where x is the undetermined order w.r.t [DA]. Units would depend on the value of x. [TC] denotes the concentration of total chlorine
76

For the lOx stoichiometric dosage of the DAs the data was possible to be analyzed as
irreversible unimolecular type reactions because the DA was well in excess of the CI2
concentration in solution. For 2 - 4x dosages however the DA concentration was
concluded to be not sufficiently in excess to assume that the DA concentration remained
constant from the beginning to the end of the experiment. Thus, the order of the 2 - 4x
dosages were analyzed assuming that the reactions were irreversible bimolecular-type
second order reactions, and the pseudo-order (determined at lOx dosage) of the reaction
with respect to the TC concentration in solution (determined at lOx dosage) was assumed
to be the same at lower dosages (Table 9).
4.1.1.2 Test for First Order Reaction Order with respect to both
Reagents at near Stoichiometric Ratios offDAJ/fTCJ
2-4x Stoichiometric Dosages
The tests at lOx stoichiometric above suggested zero order kinetics with respect to [TC]
in some cases and first order in others. The dependance on DA concentration cannot be
determined with the current experimental procedure lacking concentration measurement
capability for all the dechclorination agents. In order to investigate if the dechlorination
reactions can be tested for first order kinetics with respect to both reagents (second order
overall), the 2x, 3x and 4x stoichiometric dosage data was tested for second order using
the irreversible bimolecular second-order test for the reaction form A + B -> products.
Thus, the reaction rate equation will be as follows:
— roverall =' *overall^TC^ DA
77

If the reaction between DA and chlorine is second order at 2x - 4x stoichiometric
concentrations of the DAs, the plots of In — versus time are expected to produce
M(l-XA)
straight lines. Each run for the 2x - 4x stoichiometric dosage experiments were analyzed
separately and determined to have a straighline fit, which indicated that the
dechlorination reactions were second order overall. The obtained slopes of the trendlines
were then divided by the respective CA0 (M -1) values for each of the runs and the
reaction rate constants (k) were calculated for each run. The average of the reaction rate
constants of all the runs for each test condition was calculated to be the overall k (koveraii)
value of each reaction.
The second order tests conducted for SBS, CTS and AA are shown in Figure 11. For the
2x stoichiometric dosage of SBS, CTS and AA the obtained koveraii was 0.952, 1.193 and
0.877 L/mol.s, respectively. Similar KverM values of 0.1.059, 0.713 and 0.989 L/mol.s
were obtained for the 3x stoichiometric dosage of SBS and AA, respectively. These
results indicate that the second order rate constant for the reaction involving SBS, CTS
and AA is between 0.877 - 1.193 L/mol.s and that the overall reaction involving SBS,
CTS, AA and chlorine is second order.
78

< X
< * 2
< X
< >< 2
3x run2 y=0.104x-2.054
3x run3 0.082x-1.883
- 2.088
10 20 30
Time Bapsed (seconds)
• 2x runl - 2x run2 x 3x runl • 3x run2 + 3x run3
(a) Sodium bisulfite
3x runl ^0.103x-2.873 R2 = 0.934
2xrun2 y = 0.084x - 2.327
R2 = 0.937
—t* *
= 0.077x - 2.048 R2 = 0.836
i _ . . run2 *.086x - 2.47 R2 = 0.917
2xrun3 0.064x-1.819 R2 = 0.932
40 10 20 30 Time Bapsed (seconds)
A 2x runl - 2x run2 • 2x run3 x 3x runl • 3x run2 + 3x run3
(b) Calcium thiosulfate
50 60
3x run2 y = 0.086x-1.225
R2 = 0.824 ^ g <
Y^^
y
3x runl = 0.123x-2.31
R2 = 0 . 9 5 6 x ^
^ ^ 2 x run2
X
V ^ 2 x runl ^ = 0 . 1 0 6 x - 2 .
A R? = 0.832
ya0.090x-1.867 R* = 0.916
10
A 2x runl
20 30 Time Bapsed (seconds)
• 2x run2 x 3x runl • 3x run2
40
Figure 11: thiosulfate
(c) Ascorbic acid Second order tests undertaken for the 2 - 3x stoichiometric dosages of sodium bisulfite, calcium and ascorbic acid.
79

Table 10: Second order reaction rate constants (L/mol.s) for the dechlorination reactions of sodium bisulfite and ascorbic acid at 2x and 3x stoichiometric dosage.
Variable
2x stoich 3xstoich
SBS Jtun
1
1.009 1.251
Run 2 '
0.894 0.867
* £ *
0.952 1.059
CIS Run
t 1.207 0.789
Run •'2 •
1.411 0.729
Run 3
0.974 0.697
Avgk
1.193 0.713
AA Run
I
0.822 1.268
Run 2
0.932 0.709
Avgk
0.877 0.989
solution pH was between 6.5-8.5 and reactions were continuously mixed at 130 RPM
Reactions involving SMBS and STS which had pseudo-first order reaction kinetics with
respect to the total chlorine concentration at lOx stoichiometric dosage, had good fits for
the first order test with respect to each of the reactants (second order overall) at 2x - 4x
stoichiometric dosages (Figure 12).
The calculated reaction rate constant values are tabulated in Table 11.
solution pH was between 6.5-8.5 and reactions were continuously mixed at 130 RPM INC - denotes that the reaction did not reach completion within 180 seconds. — denotes concentrations that were not tested
80

3n
<
< X
*2
4x -runl y=0.106x-2.788
R2 = 0.933
4x - run2 y = 0.105x-2.717
R2 = 0.926
10 20
Time Elapsed (seconds)
X 4x runl • 4x run2
30 40
20
(a) Sodium sulfite
3x - run2 y = 0 . 0 7 8 x ^ ^
Wjj&vjt
30
4x - run2
y = 0.100x - 2 - 1 7 1 ^ . x ^ ^ R ? a 0 - 9 ^ ^ ^ O ^ c - r u n 1 ^ ^ ^ K ^ ^ y = 0.0890X - 1.945
^%S/\Jr^n n R2 = 0.956 j 0 y £ \ ^ ^ * 3x - run3 VT^S y = 0.097x - 2.072
y = 0.0780x-1.728 R2 = 0.958
40 50 60
Time Elapsed (seconds)
- 4x run2 o 4x runl x 3x runl • 3x run2 + 3x run3
10
(b) Sodium metabisulfite Figure 12: Second order tests for the 2 - 3x stoichiometric dosages of sodium sulfite, sodium
metabisulfite, sodium thiosulfate and calcium thiosulfate.
Special Case
HP was a special case because it achieved complete dechlorination with less than lx
stoichiometric dosages (e.g. O.lx stoichiometric dosage) of the dechlorination agent.
Interferences with the analytical unit and other possible side reactions, which may have
either catalyzed the reaction or reduced chlorine via an alternate reaction mechanism, are
suspected to be a few possible reasons for this finding. Consequently, only lOx and the
lx stoichiometric data of HP was analyzed for the reaction kinetics.
81

lx Stoichiometric Dosage
For SS, STS and AA the reactions involving the lx stoichiometric dosage were not
analyzed for the reaction order because those reactions did not reach completion within
the 180 second reaction time. For the rest of the four chemicals (SBS, SMBS, CTS, HP),
the lx stoichiometric dosage data was analyzed using the second order reaction tests for
the reactions in the form of 2A -> Products as shown in Section 3.1.3.2. Plots of CA
versus time were constructed to investigate a straight line fit as shown in Figure 13.
3
< y 2
1
• X
e » i a * * g
0 20 40 60 80 Time Bapsed (seconds)
XSBS-run1 BSBS-runl nSMBS-runl xSMBS-run2
ACTS-run1 -CTS-run2 •HP-run1 oHP-run2
Figure 13: Second order test for the lx stoichiometric dosages of Sodium bisulfite, sodium metabisulfite, calcium thiosulfate, and hydrogen peroxide.
The plots failed to produce a straight line fit and were better described by a curve, which
confirmed that at lx stoichiometric dosage the reaction between the above DAs and
chlorine is not second order. Further analysis to determine the order at lx stoichiometric
dosage was not conducted due to time constraints and analyzing the kinetic data to check
for fractional order or mixed order.
82

4.1.2 Impact of Tested Variables on the Dechlorination Rate
Three variables were tested to investigate their effects on the dechlorination reaction rate.
Stoichiometric dosage of the DA was varied from 1- lOx stoichiometric to investigate the
affects of variable dosage on the dechlorination rate and the results are reported in section
4.1.2.1. Section 4.1.2.2 presents the kinetic results obtained under variable mixing
conditions. The effect of varying pH on the dechlorination rate of these chemicals is
discussed in section 4.1.2.3.
4.1.2.1 Impact of DA Dosage on Dechlorination
Typically, the recommended DA dosage for municipal wastewater applications is 10% in
excess of the stoichiometric requirement. For sulfur (IV) compounds, the recommended
dosage is 1:1 (WEF & ASCE, 1998). However, the kinetic data obtained through
experiments in this study indicated that most dechlorination agents were unable to
achieve complete dechlorination within a reasonable amount of time (< 180 seconds)
with a lx stoichiometric dosage. The following sections present the reaction rates
deduced for the different dechlorination chemicals under varying dosages.
Reactions Incomplete at lx Stoichiometric Dosage
At lx stoichiometric dosage of SS, STS and AA, the dechlorination reactions did not
reach completion in 180 seconds (Figure 14).
83
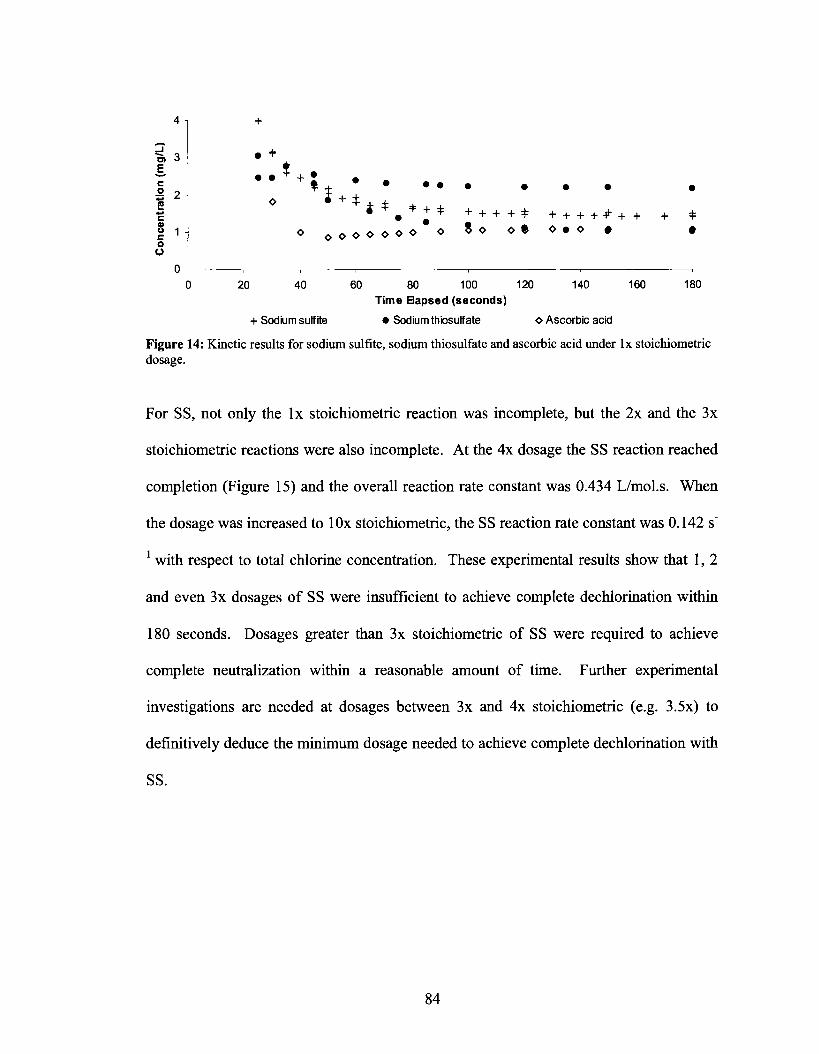
4 i
"3> 3 E
•2 2 E c 0)
g 1
o o
0
• +
• • * + • ? + * • • • • • • • •
o • + $ , + f + ^ * + :£ -f + + + £ + + + + ^ + + + £
o o o o o o ^ o * * * o o * o « o • •
0 20 40 60 80 100 120 140 160 180 Time Bapsed (seconds)
+ Sodium sulfite • Sodium thbsulf ate o Ascorbic acid
Figure 14: Kinetic results for sodium sulfite, sodium thiosulfate and ascorbic acid under lx stoichiometric dosage.
For SS, not only the lx stoichiometric reaction was incomplete, but the 2x and the 3x
stoichiometric reactions were also incomplete. At the 4x dosage the SS reaction reached
completion (Figure 15) and the overall reaction rate constant was 0.434 L/mol.s. When
the dosage was increased to lOx stoichiometric, the SS reaction rate constant was 0.142 s"
1 with respect to total chlorine concentration. These experimental results show that 1, 2
and even 3x dosages of SS were insufficient to achieve complete dechlorination within
180 seconds. Dosages greater than 3x stoichiometric of SS were required to achieve
complete neutralization within a reasonable amount of time. Further experimental
investigations are needed at dosages between 3x and 4x stoichiometric (e.g. 3.5x) to
definitively deduce the minimum dosage needed to achieve complete dechlorination with
SS.
84

X 2 1
X 2
4x -runl = 0.106x- 2.788
R2 = 0.933
4x - run2 y = 0.105x-2.717
R2 = 0.926
10 20
Time Bapsed (seconds)
X 4x runl • 4x run2
(a) Sodium sulfite
3 i
^^
* 2 -
5 ^5 X 2 1 -}T
0 -
2x runl y = 0.082x - 2.027
R2 = 0.883 2x run2 ^
y = 0.078x -1.688 ^ ^ ^ R2 = 0.910 J0&F*
j c ^ 0 r i ^ ^ ^
3x run3 y=0.082x-1.883
R2 = 0 . 9 5 6 ^ ^
^^^L " V
^ ^ r ^ ^ \ 3x runl y=0.076x-1.564
R2 = 0.922
$ ^
^Tm
3x run2 = 0.088x - 2.C
R2 = 0.939
10 20 30 40
Time Bapsed (seconds)
• 2x runl - 2x run2 % 3x runl • 3x run2 + 3x run3
(b) Sodium thiosulfate
50 60
3x run2 :0.086x- 1.225
R2 = 0.824
3x runl y = 0.123x-2.31
R2 = 0.956
2x run2 ya0.090x-1.867
R2 = 0.916
y = 0.106x- 2.369 A R?^ 0.832
10 20 30 Time Bapsed (seconds)
A 2x runl - 2x run2 x 3x runl • 3x run2
40
(c) Ascorbic acid Figure 15: Kinetic data for sodium sulfite, thiosulfate and ascorbic acid under various dosages (2-4x). The solution pH was between 6.5 - 8.5 and the samples were continuously mixed at 130 RPM.
85

Kinetic data obtained for STS is plotted in Figure 15. Even though the reactions with lx
stoichiometric dosage of STS were incomplete, when the dosage was doubled to 2x the
stoichiometric requirement the reaction reached completion with a overall second order
reaction rate constant of 1.19 L/mol.s. When the dosage was tripled to 3x stoichiometric,
the overall reaction rate constant for STS decreased to 0.720 L/mol.s, which is a 1.7 fold
decrease from the 2x dosage. This decrease in reaction rate could also be attributed to
experimental error, and further studies are needed at both the 2x and 3x dosages to
investigate the reaction rates at these dosages. When the dosage was increased to lOx
stoichiometric, the STS reaction rate constant was 0.108 s_1(Figure 10b). Thus, for STS,
it is apparent that a stoichiometric dosage of lx is insufficient to achieve 0.02 mg/L of
CI2 residual levels. Using STS dosages greater than lx stoichiometric is necessary to
ensure complete dechlorination within a reasonable amount of time (< 180 seconds).
Also, the decrease in required reaction time that occurred as a result of the increased
reaction rate at the 2x stoichiometric dosage was not much higher than at the 3x
stoichiometric dosage. Also, for both SS and STS, using lOx stoichiometric dosages did
not increase the reaction rate substantially compared to the lower dosages, probably
because the rate was limited by the concentration of residual chlorine in solution at such
high DA levels.
For AA also, the dechlorination reactions did not reach completion in 180 seconds at the
lx stoichiometric dosage (Figure 14). But for the 2x stoichiometric dosage, the reaction
reached completion in < 180 seconds (Figure 15) with a reaction rate constant of 0.877
L/mol.s. When the dosage was increased to 3x stoichiometric the reaction rate slightly
86

increased to 0.989 L/mol.s. For lOx stoichiometric dosage of AA on the other hand, the
reaction was zero order with respect to TC with a pseudo reaction rate constant of 0.396
mg/L.s as shown in Figure A 6a.
Dechlorination results obtained for AA and STS in this experimental study are in
agreement with what was found in the literature (Worley, 2000). Worley (2000)
undertook similar dechlorination studies with AA and STS and found that AA could
eliminate chlorine at twice the stoichiometric dosage. Experiments were performed on
solutions with 2-4 mg/L as CI2, at pH 6.5-7, and the reactants were allowed to react
approximately 5 minutes at room temperature. The stoichiometric dose of 0.56 mg/mg of
STS was used, even though this value is only accurate at pH 2 (White, 1999). STS on the
other hand was reported to require dosages several times the stoichiometric dosage
(minimum 1.5 x) to achieve complete dechlorination. (Worley, 2000)
Reactions Complete at lx Stoichiometric Dosage
For SBS and SMBS, the trends in reaction rate observed were similar to those of SS and
STS. However, one of the major differences observed is that the 1 x dosage in the case of
SBS and SMBS did reach completion in < 180 seconds following the addition of the DA
(see Figure 16).
87

7 rBui)
I nc
entr
a
o O
4 ,
3
2 -
1 -
0 -
• •
X
•
•
A
X
o
1 X X
A
o
X X
X
2 A
X X S
1 X
* X A m * * * - * - --* ,
0 20 40 60 80 100 120 Time Bapsed (seconds)
O Sodium bisulfite X Sodium metabisulfite A Calcium thiosulfate • Hydrogen peroxide
Figure 16: Kinetic results for sodium bisulfite, metabisulfite, calcium thiosulfate and hydrogen peroxide at the lx stoichiometric dosage.
Both SBS and SMBS reactions at the lx stoichiometric dosage required between 60 - 90
seconds for completion (Figure 17), which might not be suitable in wastewater
applications since typically only 30 - 60 seconds is available for dechlorination. The rate
constant for the lx stoichiometric dosages of SBS and SMBS could not be determined
from the kinetic analysis because the obtained data did not fit into the second order model
that was tested. At the 2x stoichiometric dosage of SBS, k-value was 0.952 L/mol.s,
which slightly increased to 1.059 L/mol.s for the 3x dosage. For the 10 x stoichiometric
dosage, the zero order rate constant with respect to the total chlorine concentration in
solution was determined to be 0.626 mg/L.s. For the 3x and the 4x stoichiometric
dosages of SMBS, the obtained k values were 0.737 and 0.804 L/mol.s, respectively (see
Table 10 and Table 11). For the 4x dosage of SMBS, the reaction rate did not
substantially increase compared to the lx stoichiometric concentration. Moreover, at the
lOx stoichiometric dosage of SMBS, the pseudo-first order reaction rate constant with
respect to the total chlorine concentration in solution was determined to be 0.172 s"1.
88

3x run2 y = 0.104x-2.054
3x run3 0.082X-1.883
088
10 20 30 Time Elapsed (seconds)
- 2x runl - 2x run2 sc 3x runl • 3x run2 + 3x run3
(a) Sodium bisulfite
4x - run2 y=0.100x-2.171
R2 = 0.946
3x -run2 y=0.078x-1.791
R2 = 0.947
4x - run l y = 0.0780x-1.728
R2 = 0.958
3x -run3 y = 0.097x - 2.072
R2 = 0.941
3x - run l 0.0890X-1.945 R2 = 0.956
10 20 30 40
Time Bapsed (seconds)
- 4x run2 o 4x runl x 3x runl • 3x run2 + 3x run3
(b) Sodium Metabisulfite
3x runl y = 0.103x-2.873
R2 = 0.934
2xrun2 0.084x - 2.327 R2 = 0.937
- * -
50 60
T « r
: runl = 0.077x - 2.048
R2 = 0.836
=T).086x - 2.47 R* = 0.917
2xrun3 y = 0.064x-1.819
R2 = 0.932
10 40
A 2x runl
20 30
Time Bapsed (seconds)
- 2x run2 • 2x run3 X 3x runl • 3x run2 + 3x run3
50 60
(c) Calcium thiosulfate Figure 17(a), (b): Kinetic results for the sodium bisulfite, metabisulfite and calcium thiosulfate under varying dosages (2-4x).
89

Results obtained for SBS and SMBS also substantiate the claim that dechlorination
reactions are not instantaneous (Bedner et ah, 2004; Helz & Nweke, 1995; Jensen &
Helz, 1998; MacCrehan et ah, 1998). Rather, depending on the initial chlorine levels in
the solution, the dechlorination time required for completion may vary. The initial
chlorine concentration for the SBS and SMBS reactions was 4 - 5 mg/L as Cb, which
required 60 - 90 seconds to be completely neutralized at lx stoichiometric dosages of
SBS and SMBS. However, the chlorine level in the wastewater effluent is unlikely to be
as high as 4 - 5 mg/L. Thus, depending on the initial concentration of chlorine in the
effluent, lx stoichiometric dosage of SBS and SMBS may be sufficient to achieve
complete neutralization within < 60 seconds. Dosage required to achieve complete
dechlorination of the wastewater effluent is site specific, depending on the flow rate,
available contact time, and the chlorine concentration in the effluent.
Kinetic data obtained for CTS is shown in Figure 17, which had similar trends to STS in
that the overall reaction rate constant decreased with increasing dosage of CTS. At 2x
stoichiometric dosage, CTS had a koVeraii value of 1.193 L/mol.s, but at the 3x dosage the
calculated koveraii values was 0.713 L/mol.s, which is a 1.7 fold decrease. This decrease in
observed reaction rate constant is identical to the decrease in rate observed for STS going
from 2x to 3x dosage. Possible reasons for this similarity is unknown, but it could
indicate that both sodium and calcium thiosulfate have similar kinetic behavior when
reacting with chlorine.
90

HP was a special case because it was able to achieve complete dechlorination with
concentrations less than the stoichiometric requirement (e.g. O.lx), which is practically
impossible. Possible reasons for such an observation could be that there are other
simultaneous and/or catalytic reactions that occur in the reaction solution reducing
chlorine levels or possible interferences of HP and reaction products with the chlorine
analyzer probes. Consequently, only lOx and the lx stoichiometric data was analyzed for
HP. At the lx stoichiometric dosage, the HP kinetic data failed to fit into the second
order model that was tested, but at the lOx dosage the pseudo-first order reaction rate
constant with respect to chlorine was determined to be 0.502 s"1. HP results also show
that the dechlorination reactions with HP are not instantaneous. Although the lOx
stoichiometric dosage was able to reduce the residual chlorine levels to below 0.02 mg/L
within 30 - 40 seconds, using dechlorination chemicals in excess of the stoichiometric
dosage is not recommended for wastewater applications (USEPA, 2002) because
presence of high DA concentrations in natural waters may lead to deleterious human and
aquatic health impacts. Similar findings have been previously reported in the literature
(Worley, 2000), where a 1 x stoichiometric dosage of HP was only able to reduce
residual chlorine values to 0.1% of the initial values. The experiments were performed
on solutions of 2-4 mg/L as CI2, at pH 6.5-7, and reactants were allowed to react
approximately 5 minutes at room temperature.
The reaction rates for each of the seven dechlorination chemicals under varying dosages
are shown in Table 12.
91

Table 12: Dechlorination reaction rate constants obtained at various dosages of the dechlorination chemicals.
Dechlorination Agent
Sodium Sulfite Sodium Bisulfite Sodium Metabisulfite Sodium Thiosulfate Calcium Thiosulfate Ascorbic Acid Hydrogen Peroxide
Dosage (x stoichiometric) I
INCt
ND' ND INC ND INC ND
2 INC
0.952 —
1.192 1.193 0.877 ND
.? INC 1.059 0.737 0.719 0.713 0.989 ND
4 0.434
— 0.804
— — —
ND
10 0.142 0.626* 0.172 0.108 0.280* 0.399* 0.502
Results are for the reaction conducted under continuous, low intensity (130 RPM) mixing and pH 6.5 - 8.5 condition For 2, 3 and 4x dosage the indicated k values are for the overall second order reaction rate constants (L/mol.s) For the lOx dosage the pseudo-first/zero order rate constants with respect to the total chlorine concentration are indicated * for SBS, CTS and AA the reactions were determined to be zero order for all the dosages, thus the unit for the reaction rate is mg/L.s INC - denotes that the reaction did not reach completion within 180 seconds.
'ND - denotes that the reaction rate constant could not be determined from the undertaken analysis — denotes concentrations that were not tested
Generally, the overall reaction rate constant increased with increasing dosage for all the
dechlorination chemicals except for the 2 - 3x stoichiometric dosage of STS and CTS as
shown in Table 12. With the lx stoichiometric dosage, SS, STS and AA did not achieve
complete neutralization for over 180 seconds. SBS, SMBS, and CTS reached completion
within 60 to 90 seconds, while HP reached completion in < 60 seconds. Thus, these
results show that the dechlorination with the 1 x stoichiometric dosage is not
instantaneous for all of the chemicals and incomplete in some cases. In real life
applications, the time required for complete dechlorination is expected to be much less
than what was observed during the experiments, because the initial chlorine levels in the
test solutions were between 4 - 5 mg/L, which is much higher than the expected
concentrations of chlorine in the disinfected municipal effluent. In addition, there was a
time lag of 25 seconds for the experimental solution to travel from the experimental
92

container to the free and total chlorine probes of the residual analyzer. For the purpose of
this analysis, the beginning of the reaction (t = 0) was taken as the time that the
dechlorination chemical was added to the experimental bucket and not the time that it
reached the analyzer.
Given that the contact time of MWWE with the dechlorination agent is in the order of
minutes and possibly less (NMED, 2003; Utilities Kingston, 2004), the dosage of the
dechlorination chemicals needed to achieve regulated effluent chlorine levels seems to be
site-specific. If SS, STS or AA is the DA of choice, using the DA 2x - 3x in excess of
the stoichiometric requirement is a feasible and necessary strategy to lower the effluent
chlorine levels. If the stoichiometric concentrations are used, the required residence time
is over 180 seconds, which is impractical in the case of municipal wastewater treatment.
For stoichiometric dosages between 2x - 4x, which is a 2-fold or more increase in dosage
compared to the initial value, the required reaction time was higher compared to the lOx
stoichiometric dosage. However, such a high dosage as 10 x stoichiometric is not
recommended in wastewater applications as it may cause deleterious effects in the
aquatic environment. If SBS or SMBS is the DA of choice, a lx stoichiometric dosage
may be sufficient depending on the initial chlorine levels in the effluent and the available
contact time. For HP the reactions were very fast and the 1 x stoichiometric dosage was
found to be sufficient to achieve complete dechlorination.
4.1.2.2 Impact of Mixing on Dechlorination
Commonly in practice, assuming that the dechlorination is instantaneous and complete,
20-30 seconds of mixing time is allowed for the chlorinated wastewater effluent and the
93

dechlorination agent to mix after disinfection (NMED, 2003; Utilities Kingston, 2004).
Having a homogeneous reactant mixture may increase the efficiency of the reactions and
reduce the required contact time. Thus, the affect of periodic and continuous mixing on
the reaction rate was investigated at 130 RPM, and the effect of using different mixing
intensities was investigated by comparing the reaction rates obtained at 130 and 275
RPM.
Impact of mixing intensity on the reaction rate — High
For SS and AA, the experimental results revealed that the mixing intensity had a stronger
impact on the reaction rate than mixing frequency. Both SS and AA had very similar rate
constants at the periodic and the continuous low mixing cases as shown in Table 13.
Table 13: Calculated reaction rate constants for the various mixing regimes of sodium sulfite and ascorbic acid.
Variable
Mix
ing!
periodic low Intensity high
-"TT Run
0.612 0.4
0.935
Run 2
0.561 0.467 0.728
avg
0.587 0.434 0.832
_ _ ^ Run
1
0.814 1.268 2.459
Bun 2
1.554 0.709 0.957
1.184 0.989 1.708
However, the overall reaction rate constant for the continuous high mixing condition of
SS was approximately 2 times that of the continuous low case (Figure 19a). Doubling of
the reaction rate of SS at high intensity mixing implies that increasing the intensity of
mixing can increase the rate of the reaction, which would allow the reaction to be
completed within a shorter contact time. Although, being able to increase the reaction
rate by increasing the intensity of mixing could be advantageous and would lead to
chemical cost savings, the downside is that high intensity mixing may be energy
intensive, which would add to the operating costs.
94

< >< 2
4x low - runl
4x high - run2 y = 0.150x-3.290 • R2 = 0.754
4x high -y = 0.193x
F? = 4x perbdic - run2 y = 0.105x-2.717
R? = 0.926
0 5 10 15 20 25
Time Bapsed (seconds)
X 4x low runl • 4x taw run2 • 4x high runl s 4x high run2 A 4x periodic runl X 4x periodic run2
Sodium Sulfite
Figure 18: Reaction kinetics for sodium sulfite at various mixing regimes tested.
The kinetic results of A A were also similar to that of SS in that the reaction rate
decreased when the frequency of mixing was increased from periodic to continuous
mixing (Figure 19). For AA, the reaction rate constant at the periodic mixing case was
1.184 L/mol.s which decreased to 0.989 L/mol.s for the continuous low mixing scenario.
* 2
< x
3x high runl y = 0.331x - 8.024
R2 = 0.87 3x perbdic run2
y = 0.160x-3.674 R2 = 0.961
3x low run2 y=0.086x-1.225
R2 = 0.824
3x low runl y = 0.123x-2.31
R2 = 0.956 3x perbdic runl y=0.101x-2.210
: high run2 R2 = 0.999 y = 0.250x - 6.066
FP = 0.912
10 20 30 40 Time Bapsed (seconds)
A 3x high runl - 3x high run2 x 3x bw runl • 3x bw run2 • 3x periodic runl m 3x periodic run2
(b) Ascorbic Acid Figure 19: Reaction kinetics for ascorbic acid at various mixing regimes tested.
95

The reason for this decrease could be because at the 3x stoichiometric dosage, the
reaction is limited by chlorine, and therefore increasing the frequency of mixing cannot
increase the reaction rate any further. When the reaction intensity was further increased
to 275 RPM the reaction rate increased nearly 2-fold compared to the low intensity case.
This increase in reaction rate could mean that the reaction order of AA could be affected
by mixing conditions, which is important to know since it was previously determined that
the reaction order was independent of the concentration. However, further studies with
more replicates are needed to substantiate this claim.
Impact of mixing frequency and intensity on the reaction rate - Minimal
As shown in Table 14, for SBS, SMBS and STS the reaction rates for the periodic,
continuous low, and continuous high case were very similar.
Table 14: Calculated reaction rate constants for the various mixing regimes of sodium bisulfite, metabisulfite, and sodium thiosulfate.
Variable
Mix
ing periodic
low Intensity high
SBS Run
1
0.935 1.251 0.765
Run. 2
1.124 0.867 1.11
-
&g*
1.03 1.059 0.938
SMBS Run
1
0.669 0.706 0.747
Run 2
0.671 0.606 0.546
Run 3
— 0.868
-
Avgk
0.671 0.737 0.546
SI Run
J
0.653 0.606 0.573
Run 2
0.504 0.798 0.707
13 Run
3
— 0.64
0.899
Avgk
0.50 0.72 0.80
— denotes concentrations that were not tested
For SBS (Figure 20), the overall second order rate constants were 1.03, 1.059 and 0.938
L/mol.s for the periodic, continuous low and continuous high case, respectively.
Although the lowest reaction rate was observed with the high intensity mixing, the
difference in rate is not considered significant. Thus, having adequate mixing within the
first 10 seconds of the reaction (periodic), or for the first l/3rd - l/4th of the total length of
the reaction, is sufficient for the reaction to achieve a very high reaction rate; increasing
96

the mixing time and the intensity any further do not increase the reaction rate
significantly. This result also means that the mixing frequency and the intensity did not
have a significant impact on the reaction rate of these chemicals.
3x high runl
y = 0.331x-8.024 3x periodic run2 R2-0.87 / y = 0.160x-3.674
3x pH6.5-8.5 runl / " ^ ^ ^ ^ ^ * y = 0.123x-2.31 / ^ ^ i ^^
D2 - n QKR A*£rf^^ ^ ^ S x periodic runl 3x pH6.5-8.5 run2 R " " ^ ^ ^ T ^ y = 0.101X - 2.210 y - 0.086x -1.225 ̂ ^ . . ^ ^ ^ V ^ ^ S x h i g h run2 R2 = 0.999
R2 = 0.824 - ^ ^ ^ W r ^ y = ° ' 2 5 0 x " 6 0 6 6
* X F? = 0.912
< * 2
<
0 10 20 30 40 Time Bapsed (seconds)
A 3x high runl - 3x high run2 X 3x tow runl • 3x low run2 • 3x periodic runl • 3x periodic run2
(a) Sodium bisulfite Figure 20: Reaction kinetics for sodium bisulfite at various mixing regimes tested.
As shown in Table 14, for STS and SMBS also, the reaction rates for the periodic,
continuous low, and continuous high case were very similar. For STS the dechlorination
reaction rate constants were 0.500, 0.720 and 0.800 L/mol.s and for SMBS the rate
constants were 0.671, 0.737 and 0.546 L/mol.s for the periodic, continuous low and
continuous high case, respectively. In the case of STS, the reaction rates were almost
identical for all the three mixing regimes tested, thus shows that mixing conditions and
the intensity did not have an effect on the reaction rate. For SMBS, when the solution
was continuously mixed at low intensity, the reaction rate slightly decreased, compared to
the periodic mixing (see Figure 21). A slight reduction (25%) in reaction rate was
observed (see Table 14) for the SMBS at high intensity mixing condition compared to the
low intensity condition for the same reasons described above.
97

~2 X
J1
-1
0
* 3 x low
3x high run2 y = 0.154x-3.470>
R2 = 0m7/r
3x low run3 ^ r y = 0.097x - 2 0 7 2 / X ^ - ^ ^
3x high runl R2 = 0 . 9 4 1 J > ^ ^ ^ ^ ^ ' y = 0.098x - 2.021 ^ ^ ^ ^ ^ ^ ^
R2 = o.94i ^ ^ ^ ^ P O < g r ^ ^ ^ 3x low runl ^ ^ F ^ ^ ^ ^ * * - periodic runl
y = 0.089x - 1 . 9 4 5 ^ y = 0.089x - 2.458 R2 = 0.956 R2 = 0.921
3x low run2 ^ . ^
*= 0.078x - ^:J^e^\L^^' R2 = 0 > J ^ ^ — '
•^3x periodic run2 y = 0.092x - 3.052
R2 = 0.956
10 20 30 , 40 50 60 Time Bapsed (seconds)
runl • 3x low run2 + 3x low run3 - 3x high runl • 3x high run2 A 3x periodic runl 3x periodic run2
(b) Sodium Metabisulfite
f 2
< X
3x high run2
3x low runl y=0.100x-2.17J
y = 0.076x-1.564 R2 0 9 4
R2 = 0.922 3x low run3
y=0.082x-1.883
R2 = 0.956 3x periodic runl
y=0.083x-1.920 R2 = 0.93I
high runl y = 0.076x-1.60
R2 = 0.945 r u n 2 3x periodic run2
' = 0.088x - 2.041 y = o.064x - 1.614 R2 = 0.891 R2 = 0.939
10 40 50 20 30
Time Bapsed (seconds)
X 3x low runl • 3x low run2 + 3x low run3 • 3x high runl • 3x high run2 A 3x periodic runl x 3x periodic run2
(c) Sodium thiosulfate Figure 21(a), (b) & (c): Reaction kinetics for sodium thiosulfate, hydrogen peroxide and sodium
metabisulfite at various mixing regimes tested.
60
In order to further substantiate this claim, an additional set of experiments were
undertaken for SMBS using lOx stoichiometric dosages to investigate the effects of low
and high intensity mixing on the rate of the dechlorination reaction. This result (Figure
22) indicates that at lower stoichiometric dosages (e.g. 4x stoichiometric) of SMBS, the
increase in mixing intensity does not strongly influence the reaction rate, but at higher
dosages (e.g. 10 x stoichiometric) the mixing rate can have a greater influence on the
reaction rate.
98

u •
-1 -
"5" O z
IT
-3 -
-4 -
H \ AS
10x Continuous, High * y = -0.360x + 8.383
R2 = 0.9319
^ |
10x Continuous, Low y=-0.172x + 4.138
" \ A R2 = 0.969
10 20 30 Time Bapsed (seconds)
40
A 10 x Continuous, Low • 10 x Continuous, High
Figure 22: Reaction kinetics for lOx stoichiometric dosage of sodium metabisulfite at various mixing regimes tested.
This observed difference in the reaction rate may be because when the DA is present in
10 x excess of the stoichiometric requirement, total chlorine becomes the limiting
reagent, and having high intensity mixing can increase the likelihood of the two reactants
coming into contact with each other. When the dosages of the DA are slightly in excess
(3x) of the stoichiometric requirement, or the competition amongst the dechlorination
agent molecules to make contact with a residual chlorine is not as high, the mixing does
not substantially increase the reaction rate.
Impact of both the mixing intensity and frequency on the reaction rate - High For
calcium thiosulfate both mixing intensity and frequency of mixing had an impact on the
reaction rates as shown in Figure 23.
99

* 2
I ><
0
3x high run2 y = 0.129x-3.092
, , R2 = 0.830 3x low run3
y = 0.0814x - 2.:
periodic run2 & = 0-' y = 0.063x-1.386.
R? = 0.995 3x high runl
y = 0.107x-2.526_
20 30
3x low runl ^ = 0.103x-2.873^
R2 = 0.93
3x low run2
y = 0.086x - 2.47
periodic runl ™ = 0.917
y = 0.062x-1.674
R2 = 0.979
40 50 60 0 10 Time Bapsed (seconds)
A 3x high runl - 3x high run2 x 3x low runl • 3x low run2 + 3x low run3 • 3x periodic runl • 3x periodic run2
(b) Calcium Thiosulfate Figure 23(a) & (b): Reaction rate constants for sodium metabisulfite and calcium thiosulfate at various mixing regimes tested.
When the experimental solution was continuously mixed at low intensity, the reaction
rate for CTS increased by approximately 1.3-fold compared to the periodic mixing
scenario (Table 15).
Table 15: Calculated reaction rate constants for calcium thiosulfate under various mixing regimes
Variable
Mix
ing periodic
low Intensity high
CIS Run
1
0.475 0.789 0.973
Run 2
0.561 0.729 1.126
Jinn 3
— 0.697
-
Avgk
0.561 0.713 1.126
— denotes concentrations that were not tested
When the mixing intensity was increased from 130 RPM to 275 RPM, the reaction rate
constant increased from 0.713 to 1.126 L/mol.s, which is also approximately a 1.6-fold
increase. This increase in reaction rate could be because the CTS reaction required 60 -
80 seconds to achieve complete neutralization when the sample was periodically mixed,
where the 10 second initial mixing accounts for only for l/6th - l/8th of the total reaction
time. Having 10 second initial mixing may be insufficient to ensure complete
homogeneity of the reaction mixture. Thus, for CTS reactions that take approximately 60
100

- 80 seconds to reach completion, both the intensity and the frequency of mixing can
have a direct impact on the reaction rate compared to the 10 second initial mixing.
From the analysis of the effects of mixing on the reaction rate of the dechlorination
chemicals, it is evident that for SS and AA the reaction rates for the periodic and
continuous low mixing condition are similar. However, when the solution was mixed at
high intensity, the reaction rate of SS and AA almost doubled compared to the low
intensity mixing and these reactions required approximately 3 0 - 4 5 seconds to reach
completion. The SBS, STS and HP reactions required 45 - 80 seconds to achieve
completion, and the reaction rate was not influenced by the intensity or the frequency of
mixing. On the other hand, for SMBS, which also required 50 - 80 seconds for reaction
completion, continuous mixing was important, while the intensity of mixing did not
impact the reaction rate. For CTS, mixing intensity was important while the frequency of
mixing did not impact the reaction rate. The results obtained for the dechlorination
agents under variable mixing conditions are tabulated in Table 17.
4.1.2.3 Impact ofpH on Dechlorination Rate
Typically, the pH range of municipal wastewater (WEF & ASCE, 1998) is 6.5 - 8.0, and
two different pH ranges were tested to investigate the effects of variable pH on the
dechlorination reaction rate of the seven dechlorination chemicals. Two pH ranges
tested were pH 6.5 - 8.5 and pH > 9. For the majority of the chemicals tested there was
no or minimal impact on the dechlorination rate with changing pH.
101

Impact of solution pH on the dechlorination reaction rate - Minimal
For SBS, SMBS and STS the dechlorination rate remained the same when the reaction
solution pH was raised to pH> 9 from the 6.5 - 8.5 as shown in Figure 24. For SBS and
STS the reaction rate showed a slight increase from the pH 6.5 - 8.5 to pH > 9 range as
shown in Table 16. For SMBS however the reaction rate constant slightly decreased
going from pH 6.5 - 8.5 to pH > 9 case.
Table 16: Calculated reaction rate constants for calcium thiosulfate under various mixing regimes,
Variable
Q .
PH6.5-8.5 pH9
SBS I
1.251 1.25
i
0.867 1.474
Ay&k
1.059 1.362
sMAs I
0.706 0.665
J | J \Avgk 0.60610.86810.737 0.712 J - 10.712
STS
' 1 ' 1 * 0.6061 0.7981 0.64 0.7671 0.6921 0.868
AVgR
0.72 0.78
— denotes concentrations that were not tested
These slight changes (increase/decrease) in the reaction rate with increasing pH will not
reduce or increase the required reaction time in practice by an appreciable amount, and
neither will it appreciably effect the dechlorination ability of these chemicals, thus it is
not considered to be a major advantage or disadvantage. Also, the finding that the
solution pH has minimal or no impact on the dechlorination reaction rate of these
chemicals confirms that the reaction orders calculated for the dechlorination reactions in
section 4.1.1 are independent of the pH conditions.
102

* 2
< X
-, 3x pH6.5-8.5 run2 y=0.1037x-2.0541
R2 = 0.9583*
3x pH>9 runl ,S^C y = 0.14-ix - mzijrSy
R2 = 0 . 9 7 5 ^ T _ ^ ^ 3x pH6.5-8.5 runl S^^jk ^** y = 0.143x - 2.825 ^ ^ / f ^ S * ' *
R2 = 0.964 j6+/y>S^
3x pH>9 run2 +
y=0.168x- 4.008
y R2 =
^^^^f.
•• 0.997 ^ y
^ S ^ 3x pH6.5-8.5 run3 y=0.082x-1.883
R2 = 0.956
~<2 X
><
< * 2
10 20 30 40
Time Elapsed (seconds)
X 3x runl • 3x run2 + 3x run3 - 3x pH>9 runl - 3x pH>9 run2
(a) Sodium bisulfite
50 60
-1
-
3x pH6.5-8.5 runl y = 0.0890x-1.945
R2 = 0.956
3x pH 6.5 - 8.5 run2
y = 0.078x - 1.791 . ^ ^ " ' V , 3x pH 6.5 - 8.5 run3 R2 = 0 9 4 Z * < ^ ^ ' ' ^ ^ ^ * " ' ^ y = 0.097x - 2.072 • •
R2 = 0.941 ^&&Z> ^ ^ g ^ ^ *
^ ^ ^ 3 x pH>9 run2 y = 0.0854x-1.9244
R2 = 0.8906
*^* 3xpH>9run1 y = 0.093x - 2.099
R2 = 0.879
10 20 30 40 Time Elapsed (seconds)
50 60
X 3x pH6.5-8.5 runl • 3x pH6.5-8.5 run2 + 3x pH6.5-8.5 run3 • 3x pH>9 runl m 3x pH>9 run2
(a) Sodium metabisulfite
3x pH6.5-8.5 runl y=0.076x-1.564
R2 = 0.922
3x pH>9 run2 y = 0.0904x - 2.029
R2 = 0.898 3x pH 6.5 - 8.5 run3 y=0.082x-1.883
R2 = 0.95|
3x pH>9 run3 y = 0.097x - 2.072
0 10 20 30 40 50 60 Time Bapsed (seconds)
X 3x pH6.5-8.5 runl • 3x pH6.5-8.5 run2 + 3x pH6.5-8.5 run3 • 3x pH>9 runl a 3x pH>9 run2 A 3x pH>9 run3
(a) Sodium thiosulfate Figure 24: Reaction rate constants for sodium metabisulfite and sodium thiosulfate at the two pH regimes tested.
103

Impact of solution pH on the dechlorination reaction rate - High
AA is a special case where the reaction rate for the pH > 9 case was 2.3 times the reaction
rate of the pH 6.5 - 8.5 condition (see Figure 25). The calculated reaction rates for the
pH 6.5 - 8.5 and pH > 9 case were 0.989 and 2.317 L/mol.s, respectively. This could
mean that the order of the reaction is impacted not by the concentration of the reaction
(thus zero order) but by the pH of the solution.
o
**< *2
X 2 1 ~£
0 -
3x pH>9 runl y = 0.394x - 8.995
R2 = 0.865 /
3x pH6.5-8.5 run2 lb.
y=0.086x-1.225 t L ^
R2 = 0.82^ ^ ^ - * ^ f r > *^\y<r _ >*C
3x pH6.5-8.5 runl
A y = 0.123x-2.31 f R2 = 0 . 9 5 6 $
^^^^r^*
/jx. pH>9 run2 y = 0.170x-3.89
R2 = 0.959
0 10 20 30 40
Time Bapsed (seconds)
A 3x pH>9 runl - 3x pH>9 run2 x 3x runl • 3x run2
Figure 25: Reaction rate constants for ascorbic acid at the two pH regimes tested.
However, further testing will be required at the variable pH of the lOx dosage to
substantiate this claim because the reaction order analysis was conducted at the lOx
stoichiometric dosage.
The reaction rate constant of SS was also effected by the increase in pH from 6.5 - 8.5 to
>9 as shown in Figure 26. For the pH 6.5 - 8.5 case the average k^ran was calculated to
be 0.434 L/mol.s, which increased by 1.5-fold to 0.650 L/mol.s for the pH>9 case. This
increase in reaction rate constant observed for the higher pH range could reduce the
required reaction time for dechlorination using SS, which might be an advantage in
wastewater applications.
104

< * 2
< X
4x pH6.5-8.5 - runl y=0.106x- 2.788
R2 = 0.933
4x pH>9 runl y=0.108x-2.133
R2 = 0.982
4x pH>9 run2 y = 0.130x-2.866
R2 = 0.869 5 - run2
y = 0.105x-2.717 R2 = 0.926
10 30 15 20 25
Time Bapsed (seconds)
X 4x pH6.5-8.5 runl • 4x pH6.5-8.5 run2 • 4x pH>9 runl • 4x pH>9 run2
Figure 26: Reaction rate constants for sodium sulfite at the two pH regimes tested.
35 40
Increasing pH caused a reduction in reaction rate
For CTS, caution should be taken to maintain the pH between 6.5 - 8.5, because a slight
increase in pH could cause a reduction in the dechlorination rate (see Figure 27), which
could result levels of residual chlorine in the effluent above regulated levels. The reaction
rate constant for the CTS reaction at pH 6.5 - 8.5 was 0.713 L/mol.s, which decreased by
1.5-fold to 0.463 L/mol.s for the pH>9 case. However, the difference in reaction rate
between the two pH ranges tested for CTS was found to be insignificant, which also
implies that the reaction orders calculated in section 4.1.1 are the intrinsic reaction orders.
3 i
* 2
< X
8.5 run2 '.086x - 2.47
F? = 0.917
3x pH6.5-8.5 runl
y=0.103x-2.873
F? = 0.
3x pH6.5-8.5 run3
y = 0.0814X - 2.38
R2 = 0.883;
3x pH>9 runl ^ X ^ ^ P O * ^ * 3 x p H > 9 r u n 1
y = 0.08x - IZXSl^S^^J^'^' y = 0.053x - 1.505 R2 = 0 . 9 3 9 1 , ^ S P > - R2 = 0.928
0 10 20 30 40 Time Bapsed (seconds)
A 3x pH>9 runl - 3x pH>9 run2 x 3x pH 6.5-8.5 runl • 3x pH 6.5-8.5 run2 + 3x pH 6.5-8.5 run3
Calcium thiosulfate Figure 27: Reaction rate constants for calcium thiosulfate at the two pH regimes.
105

4.1.3 Summary of Dechlorination Results
Table 17 summarizes the results of the investigation of the impact of mixing and pH on
the dechlorination rate of the seven dechlorination chemicals.
Table 17: Impact of mixing and solution pH on the dechlorination rate
DA
Sodium Sulfite (SS) Sodium Bisulfite (SBS) Sodium Metabisulfite (SMBS) Sodium Thiosulfate (STS) Calcium Thiosulfate (CTS) Ascorbic Acid (AA) Hydrogen Peroxide (HP)
Impact of Mixing
Frequency* X X
X
X y /
X X
Intensity • X
X
X • •/ X
pH
s X
X
X V
s X
* frequency of mixing refers to periodic or continuous mixing S - indicates that the reaction rate increased as a result of the described treatment X - indicates that the reaction rate had minimal or no significant increase (numerically) as a result of the described treatment Inconclusive - need further studies
Table 18 summarizes the dechlorination results of this experimental study in comparison
to what has been reported in literature.
Table 18: Results summary for dechlorination experiments Dechlorination
Chemical All
Experimental Findings
- lx stoichiometric dosages of DA:C12
(mg/mg) is inadequate to achieve complete dechlorination in less than 60 seconds - SBS and AA showed zero order reaction kinetics with respect to total chlorine concentration in solution - SS, SMBS, STS and HP had pseudo-first order kinetics - CTS had zero order kinetics at lOx dosage and at lower dosages (lx, 2x, 3x) the reaction was second order overall
Literature
- the typical weight ratio of dechlorination agent added to chlorine is 1:1 (USEPA, 2000) - an excess of 10% above theoretical values of the dechlorination agent is necessary to achieve complete dechlorination (NMED, 2003) - over-dosing is the best approach (GVRD, 1997)
106

Dechlorination Chemical
Sulfur Salts Sodium Sulfite Sodium Bisulfite Sodium Metabisulfite
Sodium Sulfite (SS) - sulfur salt
Experimental Findings
- lx stoichiometric dosages of DA:Cl2 (mg/mg) is inadequate to achieve complete dechlorination in less than 60 seconds - dechlorination reactions are rapid but not instantaneous - dechlorination agents are needed 2 -3x in excess of the stoichiometric requirement to achieve dechlorination in < 180 seconds
- pseudo-first order kinetics wrt to total chlorine concentration at lOx dosage -second order kinetics overall at 4x dosage - req'd reaction time at lx dosage > CTS but < STS - at 1,2,3x dosages reaction incomplete in <180s - 4x and lOx dosages req'd 40-50s - frequency of mixing did not have an impact on the reaction rate - intensity of mixing did have an impact on the reaction rate - reaction rate not effected at pH>9
Literature
- ~ 50% molar excess (relative to the initial total residual chlorine) is currently used (Helz&Nweke, 1995) - produce sulfur (IV) compounds that readily reacts with free and combined chlorine species (Ekkad & Huber, 1996) - reaction between free or combined chlorine and the sulfur (IV) compounds will occur in 15-20 seconds, especially at high pH (Helz & Nweke, 1995; NMED, 2003) - all the dechlorination reactions are rapid at low pH but slow at neutral pH (Ekkad and Huber, 1996) - dechlorination is rapid and complete (USEPA, 2000; Ekkad & Huber, 1996) - only removes 87 - 98% of free chlorine in the effluent and the rest is reduced at a much slower rate (Helz & Nweke, 1995) - sulfite only reduces 67% of residual chlorine within the first 2 minutes (Bedner et al, 2004) - not as effective in reducing inorganic chloramines, especially N-chloropeptides (Bedner et al, 2004; Helz & Nweke, 1995; Jensen & Helz, 1998; Jameel & Helz, 1999; MacCrehanefa/., 1998) - SS: CI ratio of 1.8:1 mg/mg should be used (DEP, 2005) - required reaction time «thiosulfates (EC, 2003; US Army, 1988) - dechlorination is not rapid and complete (Bedner et al, 2004; Helz & Nweke, 1995; Jensen & Helz, 1998; MacCrehan et al, 1998)
107

Dechlorination Chemical
Sodium Bisulfite (SBS) - sulfur salt
Sodium metabisulfite (SMBS)
Sodium Thiosulfate (STS)
Calcium Thiosulfate (CTS)
Experimental Findings
- zero order kinetics wrt to total chlorine concentration at lOx dosage -second order kinetics overall at 2-3x dosage - lx dosage req'd ~ 70 - 80s to complete - 2x dosage req'd 50-60s - 2.5x and 3x needed only 30-40s -lOx dosage req'd 30 - 40 s - frequency & intensity of mixing did not have an impact on reaction rate - need more studies to determine effects of pH change - required reaction time at lx dosage > CTS but < STS - pseudo-first order kinetics wrt total chlorine concentration at lOx dosage -second order kinetics overall at 2-4x dosage - lx dosage req'd >90s for completion - 3x and 4x dosages req'd 50 - 60s to achieve complete neutralization - lOx reaction complete in ~ 40s -frequency & intensity of mixing did not have an impact on reaction rate - reaction rate not effected at pH>9 - required reaction time at lx dosage > CTS but < STS - pseudo first order kinetics wrt total chlorine concentration at lOx dosage -second order kinetics overall at 2-4x dosage - reaction incomplete at lx dosage - at 2,3, and lOx dosage reactions completed in 40-60s - frequency and intensity of mixing did not have an impact on the reaction rate - reaction rate not effected at pH>9 - zero order kinetics wrt total chlorine concentration at lOx dosage -second order kinetics overall at 2-4x dosage - at l-3x dosage first order reaction -lx dosage needed ~ 70 s to achieve complete neutralization -2 and 3x had similar reaction rates and took ~50-60s to achieve complete dechlorination -lOx reaction req'd 30-40s for completion - intensity & frequency of mixing did have an impact on the reaction rate - reaction rate not effected at pH>9
Literature
- SBS: CI ratio of 1.5:1 mg/mg should be used (DEP, 2005) - required contact times for these reactions are between one to five minutes - required reaction time «thiosulfates (EC, 2003; US Army, 1988) - at high pH, reaction occur within 15-20s (Helz&Nweke, 1995) - dechlorination is not rapid and complete (Bedner et al, 2004; Helz & Nweke, 1995; Jensen & Helz, 1998; MacCrehan et al., 1998)
- SMBS: CI ratio of 1.5:1 mg/mg should be used (DEP, 2005) - produce sulfur (IV) compounds that readily reacts with free and combined chlorine species (Ekkad & Huber, 1996) - required reaction time «thiosulfates (EC, 2003; US Army, 1988) - dechlorination is not rapid and complete (Bedner et al, 2004; Helz & Nweke, 1995; Jensen & Helz, 1998; MacCrehan et al, 1998)
- required reaction time » sulfites (EC, 2003; US Army, 1988) - more effective than sulfites in reducing both organic & inorganic residual chlorine fractions (Bedner et al, 2004) - 5 mins of reaction with lx dosage will lead to ~ 65% of residual chlorine left in the effluent - effective dose for dechlorination is 0.6 mg/mg Cl2 (Worley, 2000) - more effective than sulfites in reducing both organic and inorganic residual chlorine fractions (Bedner et al., 2004) - required reaction time » sulfites (EC, 2003; US Army, 1988)
108
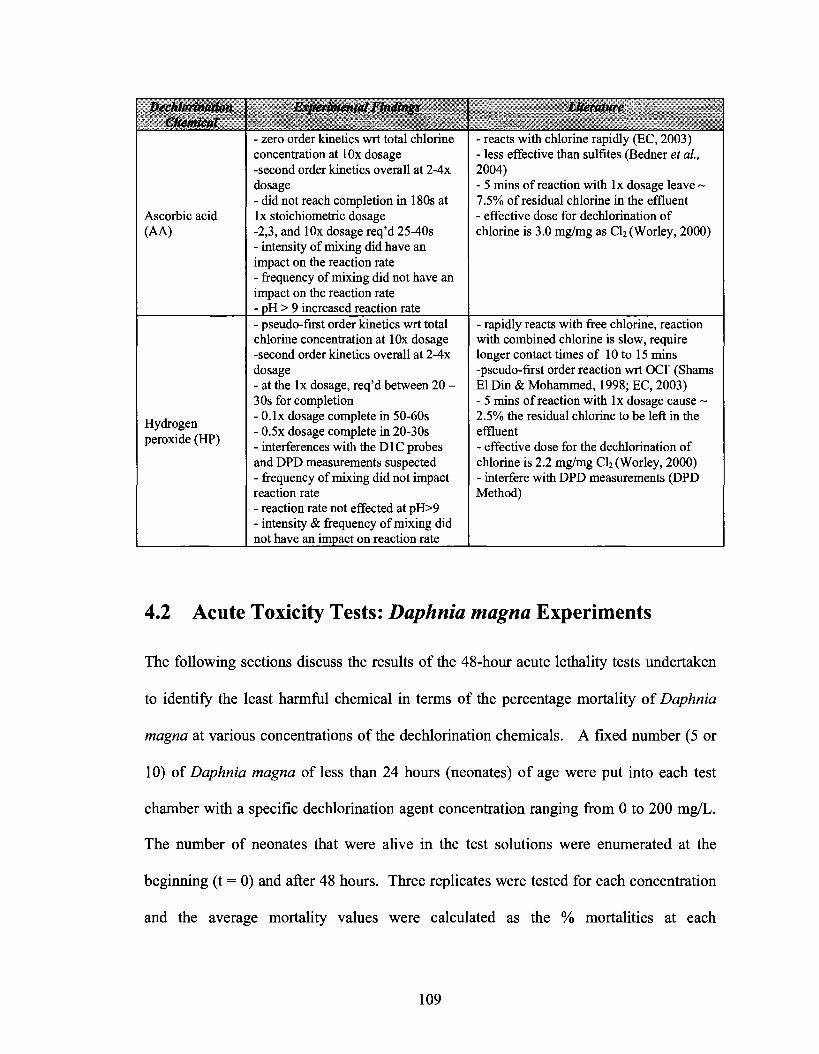
Dechlorination Chemical
Ascorbic acid (AA)
Hydrogen peroxide (HP)
Experimental Findings
- zero order kinetics wrt total chlorine concentration at lOx dosage -second order kinetics overall at 2-4x dosage - did not reach completion in 180s at lx stoichiometric dosage -2,3, and lOx dosage req'd 25-40s - intensity of mixing did have an impact on the reaction rate - frequency of mixing did not have an impact on the reaction rate - pH > 9 increased reaction rate - pseudo-first order kinetics wrt total chlorine concentration at lOx dosage -second order kinetics overall at 2-4x dosage - at the lx dosage, req'd between 20 -30s for completion - O.lx dosage complete in 50-60s - 0.5x dosage complete in 20-30s - interferences with the D1C probes and DPD measurements suspected - frequency of mixing did not impact reaction rate - reaction rate not effected at pH>9 - intensity & frequency of mixing did not have an impact on reaction rate
Literature
- reacts with chlorine rapidly (EC, 2003) - less effective than sulfites (Bedner et al, 2004) - 5 mins of reaction with lx dosage leave ~ 7.5% of residual chlorine in the effluent - effective dose for dechlorination of chlorine is 3.0 mg/mg as Cl2 (Worley, 2000)
- rapidly reacts with free chlorine, reaction with combined chlorine is slow, require longer contact times of 10 to 15 mins -pseudo-first order reaction wrt OC1" (Shams El Din & Mohammed, 1998; EC, 2003) - 5 mins of reaction with lx dosage cause ~ 2.5% the residual chlorine to be left in the effluent - effective dose for the dechlorination of chlorine is 2.2 mg/mg Cl2 (Worley, 2000) - interfere with DPD measurements (DPD Method)
4.2 Acute Toxicity Tests: Daphnia magna Experiments
The following sections discuss the results of the 48-hour acute lethality tests undertaken
to identify the least harmful chemical in terms of the percentage mortality of Daphnia
magna at various concentrations of the dechlorination chemicals. A fixed number (5 or
10) of Daphnia magna of less than 24 hours (neonates) of age were put into each test
chamber with a specific dechlorination agent concentration ranging from 0 to 200 mg/L.
The number of neonates that were alive in the test solutions were enumerated at the
beginning (t = 0) and after 48 hours. Three replicates were tested for each concentration
and the average mortality values were calculated as the % mortalities at each
109
concentration, and the error bars indicate one standard deviation above and below the
average values. The percentage survival and mortality at each concentration were
calculated as follows:
n / „ . , r i ,. (# neonates alive after 4Shrs) . . . % Survival for each replicate r = xlOO (5)
(# neonates alive at time = 0) . , . . sum of % survival of 3 replicates
% Survival at a given concentration— (6)
% Mortality = 1-%survival (7)
For all the chemicals tested, the 48-hour LC50 values were calculated using the Graphical
Method suggested by the USEPA (2002). Sodium thiosulfate (STS) and sodium sulfite
(SS) were omitted from the LC50 calculation because of the reasons discussed in the
methodology section. For SS and STS, the actual concentration of the dechlorination
agent at which 50% of the Daphnia magna would be killed was calculated instead.
The Daphnia magna acute toxicity test results are discussed in three separate sections:
sulfur salts, thiosulfates and other chemicals. SS, SBS and SMBS are discussed as part of
sulfur salts, sodium and calcium thiosulfate are discussed as part of the thiosulfates
category, while ascorbic acid and hydrogen peroxide are considered together under the
other chemicals category. Dechlorination chemicals were categorized as non-toxic,
directly toxic or indirectly toxic: Chemicals that caused no mortality at high (50 - 200
mg/L) concentrations tested were identified as non-toxic; chemicals that caused mortality
by substantial pH or DO suppression were indentified as indirectly toxic; while chemicals
that caused mortality by suppressing DO and/or pH of solution were indentified as
directly toxic.
110

4.2.1 Toxicity of Sulfur Salts
The percentage survival values obtained for Daphnia magna under different
concentrations of the three sulfur salts tested are illustrated in Figure 28. Iv
al
urvl
W ss
100 90 80 70 60 50 40
30 20 10 0
0 20 40 60 80 100 120 140 160 180 200 Concentration (mg/L)
— • SS — • SBS - - * - - SMBS - - -X- - - Control
Figure 28: Percentage survival of Daphnia magna for various concentrations of sodium sulfite, bisulfite and metabisulfite.
From the Figure 28, it is evident that the least harmful sulfur salt is SS, which resulted in
100% survival of Daphnia magna at 200 mg/L concentrations. This result is consistent
with previous findings for SS 48 hour LC50 value of 440 mg/L (Mallinckrodt Baker Inc.,
2005) for Daphnia magna. The 20% mortality that occurred at the 20 mg/L of SS could
be attributed to either the reduction in pH (0.8 pH units) that was observed (see Table 19)
and/or experimental error as indicated by the error bars. For SBS concentrations of 50,
100, 200 mg/L, the decreases in pH observed were 0, 0.1 and 0.6, respectively.
However, following the addition of 20 mg/L of SS to the solution, the pH of the solution
decreased by 0.8 units, which is unusual and may be attributed to experimental error,
because for concentrations > 20 mg/L the pH suppression is not consistently higher as
expected. Another possible source of error for the death of the 20% of the test population
111

of neonates could have been stresses induced during transfer from the culture chamber
into the test beakers. However, in the 20 mg/L of SS case, 100% of the test organisms in
the control solution survived, which makes the overall SS test results acceptable under
the USEPA (2002) test results acceptability criteria, which require that over 80% of the
test organisms in the control solution survive. Thus, the SS test results for the 20 mg/L
concentration were still included in the analysis.
Since SMBS dissociates into SBS when dissolved in water, both SBS and SMBS were
expected to have similar toxicity profiles. However, from the survival plot Figure 28,
SMBS seems to be less toxic than SBS between the concentrations of 20 - 100 mg/L. A
possible reason for the higher mortality with SBS could be the higher DO suppression
caused by SBS in the solution compared to SMBS. The tabulated DO values in Table 19
show a larger change in the DO values of SMBS compared to SBS for the concentrations
of 50, 100 and 200 mg/L. This result is in agreement with what has been previously
reported in literature, where among the sulfur salts SMBS have the greatest impact on
DO (Tikkanen et al, 2001). If a reduction in DO concentration was the reason for the
difference in survival, then the percentage survival values would be expected to differ for
all the subsequent concentrations of SBS and SMBS tested as well, but this was not the
case. For concentrations below 20 mg/L and higher than 100 mg/L, the survival rates are
identical for SBS and SMBS. This finding led to the hypothesis that the reason for the
discrepancy between SBS and SMBS might be a lethal combination of pH and DO
suppression that occurred at SMBS concentrations over 50 mg/L. But at 100 mg/L, both
112

chemicals may have reached their threshold of DO and pH suppression at which point the
percentage survival values became identical.
The above noted hypothesis was refuted after examining the obtained pH and DO data
that is tabulated in Table 19.
Table 19: The average dissolved oxygen (%) and pH values for the three replicates with various concentrations of sodium sulfite, bisulfite and metabisulfite.
DA
Sodium Sulfite Sodium Bisulfite Sodium Metabisulfite
5
Ctrl
97
97
97
mg/L
Avg
94
95
93
Avg A
-3
-2
-4
10 mg/L
Ctrl
97
97
97
Avg
94
96
95
A v g
A
-2
-1
-2
20 mg/L
Ctrl
96
96
96
Avg
94
95
93
Avg
A -2
-1
-3
50 mg/L
Ctrl
93
93
93
Avg
83
89
83
Avg
A -10
-5
-10
100 mg/L
Ctrl
94
94
94
Avg
78
90
56
Avg
A -16
-4
-38
200 mg/L
Ctrl
83
83
83
Avg
64
74
40
Avg
A -19
-9
-43
DA
Sodium Sulfite Sodium Bisulfite Sodium Metabisulfite
5
Ctrl
6.8
6.8
7.7
mg/L
Avg
6.6
6.6
7.6
Avg A
-0.2
-0.2
-0.1
10 mg/L
Ctrl
6.8
7.7
7.7
Avg
6.5
7.5
7.5
Avg A
-0.3
-0.2
-0.2
20 mg/L
Ctrl
7.7
7.7
7.7
Avg
6.9
7.1
6.9
Avg A
-0.8
-0.6
-0.8
50 mg/L
Ctrl
6.8
6.8
6.8
Avg
6.9
6.6
6.7
Avg A
0.0
-0.2
-0.1
100 mg/L
Ctrl
7.7
6.8
6.8
Avg
7.6
6.5
6.6
Avg A
-0.1
-0.3
-0.3
200 mg/L
Ctrl
6.8
6.8
6.8
Avg
7.4
6.5
6.5
Avg
A 0.6
-0.3
-0.3
* The average change (Avg A) is indicated as positive (+), if the DO or pH value increased following the addition of the dechlorination agent. If the DO or pH value decreased following the addition of the dechlorination agent, the value is indicated as negative (-).
* Ctrl corresponds to control solution - dilution water only, without the DA
For the 5 and 10 mg/L concentrations of SBS and SMBS, the reduction of pH observed in
solution is between 0.1 - 0.2. Although, the pH decreased by 0.6 and 0.8 for 20 mg/L
concentration of the SBS and SMBS, respectively, no mortality was observed. In
addition, for the 100 and 200 mg/L concentrations of SBS and SMBS, the reduction in
pH observed was identical (0.3 pH units), yet the DO change observed with SMBS is
much higher than the DO suppression caused by SBS. If the reason for the observed
mortality of SBS and SMBS at 100 and 200 mg/L is only the DO suppression, then
113

SMBS would be expected to cause higher percentages of mortality than SBS, which is
not the case. As shown in Figure 28, the observed mortalities for the both 100 and 200
mg/L concentrations of SBS and SMBS are identical. Thus it is likely that the mortality
values observed for SBS and SMBS are caused by a combination of inherent toxicity of
the two chemicals and DO and pH suppression caused by those chemicals.
Another trend illustrated in Figure 28 is that both SBS and SMBS seem to have a
threshold effect at which they cause mortality. For SBS and SMBS, there is no mortality
observed until > 20 mg/L and > 50 mg/L, respectively, which is identified as the toxic
threshold that Daphnia magna can tolerate. These results are in agreement with previous
reports which show that a reduction in DO, sufficient to cause a fish kill, is to be
expected when the in-stream concentrations of sulfur salts are equal to or exceed ~ 39
mg/L (Ryon et al, 2002). Both SBS and SMBS are reported to cause the indirect effect
of pH depletion as well (Ryon et al, 2002), which might have contributed to the death of
Daphnia magna. However, in this experimental study, large suppression in DO was
observed only for SMBS at concentrations > 50 mg/L, and the suppression in pH
observed was less than 0.3 pH units for both SMBS and SBS at all tested concentrations.
Thus, inherent toxicity of these chemicals is suspected. Further studies are needed at
constant pH and DO concentrations to investigate the inherent toxicity of SBS and
SMBS, which is beyond the scope of this project.
114

4.2.2 Toxicity of Thiosulfates
In the case of the two thiosulfates tested, the addition of STS did not cause any mortality
at concentrations up to 200 mg/L (see Figure 29), while Daphnia magna experienced
mortality starting at 4.6 mg/L of CTS.
Suv
ival
1001
90 -
80
70
60-50 40
30
20
10-0
0 20 40 60 80 100 120 140 160 180 200
DA Concentration (mg/L)
— • — S T S — • CTS - - •© - - - Control
Figure 29: Percentage survival of Daphnia magna for various concentrations of the sodium thiosulfate and calcium thiosulfate.
Median Effect Concentration (EC50); the STS concentration that produces a lethality
effect in 50% of test organisms in a given population (IUPAC, 1997) of Daphnia magna,
have been previously reported (Oh et al, 2008) to be as high as 1334 mg/L. Given such
high reported EC50 values, it was not surprising that not mortality was observed at the
STS range tested in this study. Also, pH and DO values tabulated in
Table 20 shows that the addition of STS did not alter the solution pH or the DO
concentration more than 0.3 units and 2%, respectively. Thus, it is safe to conclude that
STS does not have any direct or indirect lethality effects on Daphnia magna.
115
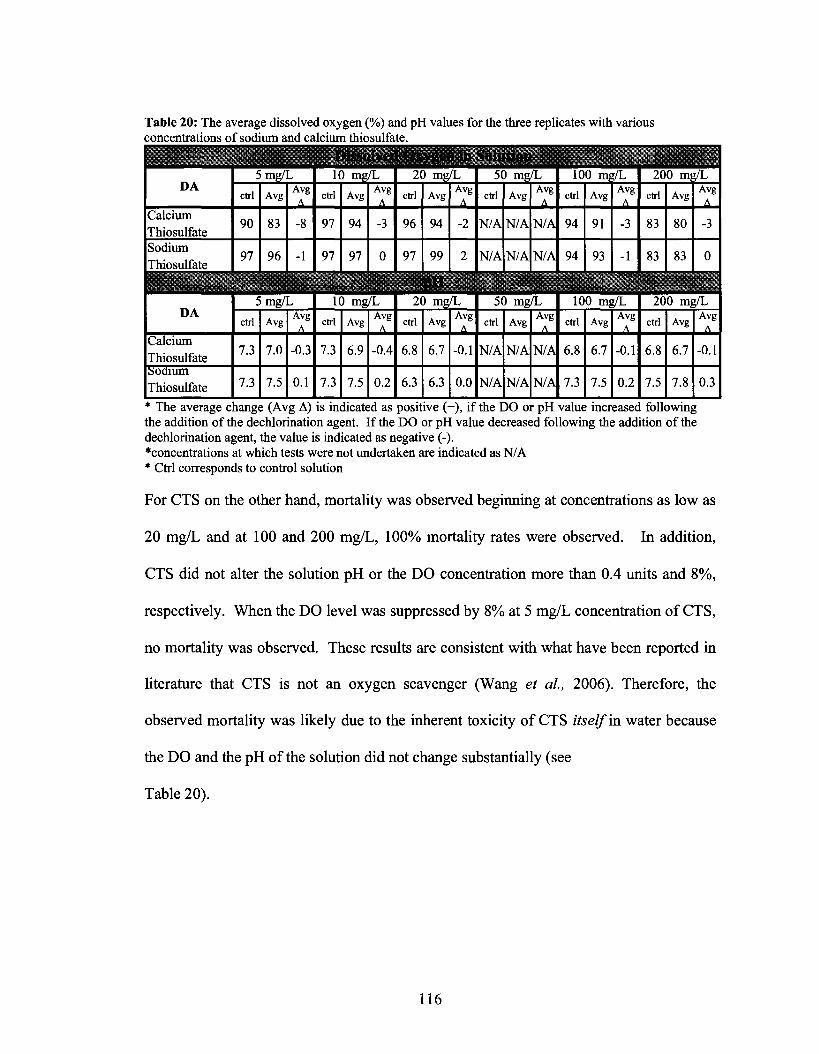
Table 20: The average dissolved oxygen (%) and pH values for the three replicates with various concentrations of sodium and calcium thiosulfate.
DA
Calcium Thiosulfate Sodium Thiosulfate
5
Ctrl
90
97
mg/L
Avg
83
96
Avg
A
-8
-1
10 mg/L
Ctrl
97
97
Avg
94
97
Avg
A
-3
0
20 mg/L
Ctrl
96
97
Avg
94
99
Avg
A
-2
2
50 mg/L
Ctrl
N/A
N/A
Avg
N/A
N/A
Avg
A
N/A
N/A
100 mg/L
Ctrl
94
94
Avg
91
93
Avg
A
-3
-1
200 mg/L
Ctrl
83
83
Avg
80
83
Avg
A
-3
0
DA 5 mg/L
Ctrl I Avg Avg
10 mg/L
Ctrl I Avg Avg 20 mg/L
Ctrl Avg Avg 50 mg/L
Ctrl I Avg Avg
100 mg/L
Ctrl Avg Avg
200 mg/L
Ctrl I Avg Avg
Calcium Thiosulfate
7.3 7.0 -0.3 7.3 6.9 -0.4 6.8 6.7 -0.1 N/A N/A WAl 6.8 6.7 -0.1 6.8 6.7 -0.1
Sodium
Thiosulfate 7.3 7.5 0.1 7.3 7.5 0.2 6.3 6.3 0.0 N/A N/A N/Al 7.3 7.5 0.2 7.5 7.8 0.3
* The average change (Avg A) is indicated as positive (+), if the DO or pH value increased following the addition of the dechlorination agent. If the DO or pH value decreased following the addition of the dechlorination agent, the value is indicated as negative (-). "•concentrations at which tests were not undertaken are indicated as N/A * Ctrl corresponds to control solution
For CTS on the other hand, mortality was observed beginning at concentrations as low as
20 mg/L and at 100 and 200 mg/L, 100% mortality rates were observed. In addition,
CTS did not alter the solution pH or the DO concentration more than 0.4 units and 8%,
respectively. When the DO level was suppressed by 8% at 5 mg/L concentration of CTS,
no mortality was observed. These results are consistent with what have been reported in
literature that CTS is not an oxygen scavenger (Wang et al, 2006). Therefore, the
observed mortality was likely due to the inherent toxicity of CTS itself in water because
the DO and the pH of the solution did not change substantially (see
Table 20).
116

4.2.3 Toxicity of Hydrogen Peroxide and Ascorbic Acid
Figure 30 shows the percentage survival values obtained for Daphnia magna under
different tested concentrations of hydrogen peroxide (HP) and ascorbic acid (AA).
• --«»- -o- o- o
40 60 80 100 120
DA Concentration (mg/L)
140 160 180 _Hjf
200
• AA — * — HP - • -$ - - - Control
Figure 30: Percentage survival of Daphnia magna for various concentrations of hydrogen peroxide and ascorbic acid.
Between HP and AA, HP was the most toxic. Lethality effects of HP were observed
beginning at concentrations as low as 2 mg/L, and 20 mg/L of HP resulted in 100 %
mortality of the test organisms. These results are consistent with the EC50 values
reported in the literature (Advanced Sterilization Products, 2005) of 7.7 mg/L. In this
study, the actual concentration of HP that caused 50% mortality was approximately 10
mg/L. These results are not surprising considering that HP is commonly used as a
disinfectant as it is a stronger oxidant than chlorine.
Although not as toxic as HP, AA also caused a considerable percentage of mortality
starting at concentrations as low as 20 mg/L. The actual concentration that caused 50%
mortality in this study was approximately 70 mg/L. This result is surprising since it does
117

not agree with what has been reported in the literature. For example, NICNAS (2003)
reports that AA is non-toxic at concentrations as high as 200 mg/L, and the 48 hour EC50
value for Daphnia magna based on measured concentrations, is given as > 190 mg/L by
NICNAS (2003). The reason for this observed discrepancy in results may be that, even
though not explicitly stated, NICNAS (2003) may have undertaken the toxicity tests
under controlled pH conditions, which may have masked any indirect toxicity as a result
of pH suppression.
Comparatively, AA had a greater impact on the pH of the solution than HP. For instance
at 100 and 200 mg/L concentrations of AA, the pH of the solution decreased by 0.5 and
1.2 pH units, respectively (see Table 21).
Table 21: The average dissolved oxygen (%) and pH values for the three replicates with various concentrations of ascorbic acid and hydrogen peroxide.
DA 5 mg/L
Ctrl Avg Avg 10 mg/L
Ctrl Avg A v g
- L .
20 mg/L Ctrl Avg
A v g
- 1 .
50 mg/L
Ctrl Avg Avg
100 mg/L Ctrl Avg Avg
200 mg/L Ctrl Avg
Avg
Ascorbic acid 97 93 97 94 96 93 -3 N/A N/A N/A 90 85 -5 83 81 -2 Hydrogen «roxide
DA 5 mg/L
Ctrl I A v g Avg
10 mg/L
Ctrl Avg Avg
20 mg/L
Ctrl Avg Avg 50 mg/L
Ctrl Avg Avg 100 mg/L
Ctrl Avg Avg 200 mg/L
Ctrl Avg Avg
Ascorbic acid 7.7 7.5 -0.2 7.3 7.1 -0.2 7.7 7.5 -0.2 N/A N/A N//J 7.3 6.8 -0.5 6.8 5.5 -1.2 Hydrogen peroxide
7.3 7.1 -0.2 6.8 6.7 -0.1 7.7 7.5 -0.2 N/A N/A N//J 7.5 7.4 0.1 7.5 7.3 -0.2
* The average change (Avg A) is indicated as positive (+), if the DO or pH value increased following the addition of the dechlorination agent. If the DO or pH value decreased following the addition of the dechlorination agent, the value is indicated as negative (-). * concentrations at which tests were not undertaken are indicated as N/A * Ctrl corresponds to control solution
118

This observed pH reduction with AA is consistent with what has been reported in the
literature (EC, 2003). The mortality observed for ascorbic acid concentrations 100 and
200 mg/L could be due to the pH suppression that is caused by AA in solution, and AA
therefore indirectly causes toxicity to Daphnia magna. Also, the DO data (see Table 21)
shows that neither AA nor HP is an oxygen scavenger. For HP, a substantial pH or DO
reduction was not observed, possibly because the observed mortality was a consequence
of inherent toxicity of HP itself.
4.2.4 Comparison of the Acute Toxicity of the Dechlorination Agents
Of all the dechlorination agents tested, STS had no toxicity effects on Daphnia magna
over the concentration range tested (0 - 200 mg/L). SS and STS were very similar in that
they both resulted in 100% survival for the concentration range rested; except that the 20
mg/L concentration of SS resulted in 20% mortality due to pH suppression or possible
experimental errors as previously discussed (see Section 4.2.1). Figure 31 below shows a
comparison between the dechlorination chemicals that produced a lethality effect to
Daphnia magna. Both SS and STS were omitted from Figure 31, because these
chemicals did not cause any significant changes to the percentage survival for the
concentrations tested over 48 hours.
119

CO
> E 3
CO
80 100 120
Concentration (mg/L)
• • -X- - - Control - - * - - SMBS — • — SBS — • — A A
200
•CTS •HP
Figure 31: Percentage survival for the control, sodium bisulfite, metabisulfite, ascorbic acid, calcium thiosulfate and hydrogen peroxide. Sodium sulfite and sodium thiosulfate were omitted as these chemicals did not cause any significant changes to the percentage survival.
From examining the Daphnia magna survival plots as well as the pH and DO data, three
types of toxicity criteria were identified for the seven dechlorination chemicals tested.
Based on these criteria the seven dechlorination agents were categorized as follows:
Table 22: Type of aquatic toxicity caused by the dechlorination chemicals. Type of Aquatic
Toxicity
Non- toxic
Direct Toxicity
Indirect Toxicity
Criteria
- no mortality was observed for high (50 - 200 mg/L) concentrations tested - chemical is inherently toxic - observed DO suppression < 10% - observed pH suppression < 0.3 pH units
- chemical inherently non-toxic - cause mortality by suppressing DO and/or pH of solution
Chemicals
Sodium Sulfite Sodium Thiosulfate
Hydrogen Peroxide Calcium Thiosulfate
Ascorbic Acid Sodium Metabisulfite Sodium Bisulfite
SBS and SMBS have similar toxicity profiles, except it can be seen from Figure 31 that
for concentrations between 20 - 50 mg/L SMBS deviates from the % mortality observed
for SBS, even though SBS is produced following the addition of SMBS to the water.
120

Ascorbic acid (AA) closely follows SMBS in the toxicity profile, yet mortality was
consistently higher than for SMBS up to 100 mg/L. For 20 and 200 mg/L of AA the
observed percentage mortalities were 14% and 87%, respectively, while for SMBS, they
were 0% and 42%. However, at 200 mg/L, the % mortality observed for AA was ~ 87%,
which is less than that of SMBS (100%), for unknown reasons.
CTS and HP are the most toxic dechlorination agents tested in this study. Percentage
survival under CTS and HP is significantly below all of the other chemicals tested
(Figure 31). For both of these chemicals, the % survival values start decreasing at
concentrations as low as 4.6 mg/L and the rate of decrease in percentage survival
followed a similar trend until 20 mg/L. At 20 mg/L, HP caused 100% mortality in all the
replicates tested while CTS was less toxic and resulted in only 40% survival on average.
Since HP releases oxygen when added to water, it is not considered a DO suppressor.
Also, HP has not been reported to decrease pH in the test solutions. Thus it seems that
being a strong oxidant like chlorine, HP itself is directly toxic to Daphnia magna. The
highly reactive and corrosive nature of hydrogen peroxide (Advanced Sterilization
Products, 2005) seems to have caused the acute toxicity observed in Daphnia magna.
CTS also, did not suppress the pH and the DO of solution, thus the observed mortality
induced by CTS is attributed to its inherent toxicity.
Following the analysis of actual percentage lethality values under various concentrations
of the dechlorination agents, the obtained mortality results were analyzed using the
Graphical Method suggested by the USEPA (2002) to estimate the LC50 value for each of
121

the seven dechlorination chemicals (refer to Appendix 4 for individual graphs). This
Graphical Method is a mathematical procedure used to estimate the LC5o values by linear
interpolation between points of a plot of observed % mortality versus the logio of %
effluent concentration. One short-coming of this method, however, is that it does not
produce confidence intervals for the LC50 values. The LC50 values obtained from the
Graphical Method are shown in Table 23. STS and SS could not be analyzed using the
Graphical Method (USEPA, 2002), because this method is only valid for analyzing data
when the obtained percentage mortalities bracket the 50% mortality mark.
Table 23: 48 hour LC50 values derived using the Graphical Method (USEPA, 2002).
Dechlorination Agent
Sodium Thiosulfate (ST) Sodium Sulfite (SS) Sodium Metabisulfite (SMBS) Sodium Bisulfite (SBS) Ascorbic acid (AA) Calcium Thiosulfate (CTS) Hydrogen peroxide (HP)
Calculated 48 hr LC5lt value (mg/L)
>200* >200*
100 68 55 22 4.7
* observed mortality could not be analyzed using the graphical method since no mortality was observed over the tested concentration range of 0 - 200 mg/L, thus actual concentrations at which 50% mortality observed are indicated.
Therefore, from the analysis of the actual percentage survival values, and the 48 hour
LC50 values of Daphnia magna under varying concentrations of SS, SBS, SMBS, STS,
CTS, AA and HP, it is apparent that HP has the highest acute toxicity values. CTS
closely follows HP, and was observed to be more toxic than AA. The three sulfur salts
were comparably safer than CTS, AA and HP. However, of the three sulfur salts tested,
SBS and SMBS had similar toxicity profiles, and SS did not cause substantial acute
toxicity.
122

In conclusion, from the study of seven dechlorination chemicals, STS was identified as
the chemical with the least or no acute toxicity over the concentration range tested (0 -
200 mg/L). This result was similar to that of SS. Thus, STS and SS are the least toxic
chemicals and as such would be the preferred chemicals for the dechlorination of
municipal wastewater effluent prior to discharge into natural rivers and lakes, because
these chemicals produce the least acute toxicity to the common indicator organism
Daphnia magna.
Table 24 summarizes the experimental findings of this study and provides a comparison
to the results reported in the literature regarding the acute toxicity of the seven
dechlorination agents in consideration.
Table 24: Acute toxicity test results summary Dechlorination
Chemical
Sodium Sulfite (SS)
Sodium Bisulfite (SBS)
Experimental Findings
-48hrLC50>200mg/L
-48hrLC5 0 is68 mg/L - more toxic than SMBS between the concentrations of 20 to 100 mg/L - chemical inherently non-toxic - cause mortality by suppressing DO and/or pH of solution
Literature
- 48 hour LC50 value of 440 mg/L (Mallinckrodt Baker Inc., 2005) - non-hazardous for aquatic species, 96 hr LC50 is 460 mg/L for Western Mosquitofish (Mallinckrodt Chemicals, 2007). - use of stoichiometric concentrations can suppress the DO by 0.30 mg/L (Tikkanen et al, 2001) - LC50 for Ceriodaphnia Dubia is 245 mg/L - over dosing does not have any direct aquatic impacts - at higher dosages can suppress the DO and pH level in the receiving water (EC, 2003; Ryon et al, 2002) - 39 mg/L concentration in receiving waters can cause a fish kill event and can reduce the DO level in the receiving waters by ~ 6 mg/L (Ryon etal, 2002)
- sulfite ion (SO^ ) concentrations of less
than 10 mg/L have no significant effect on the aquatic environment (White, 1999)
123
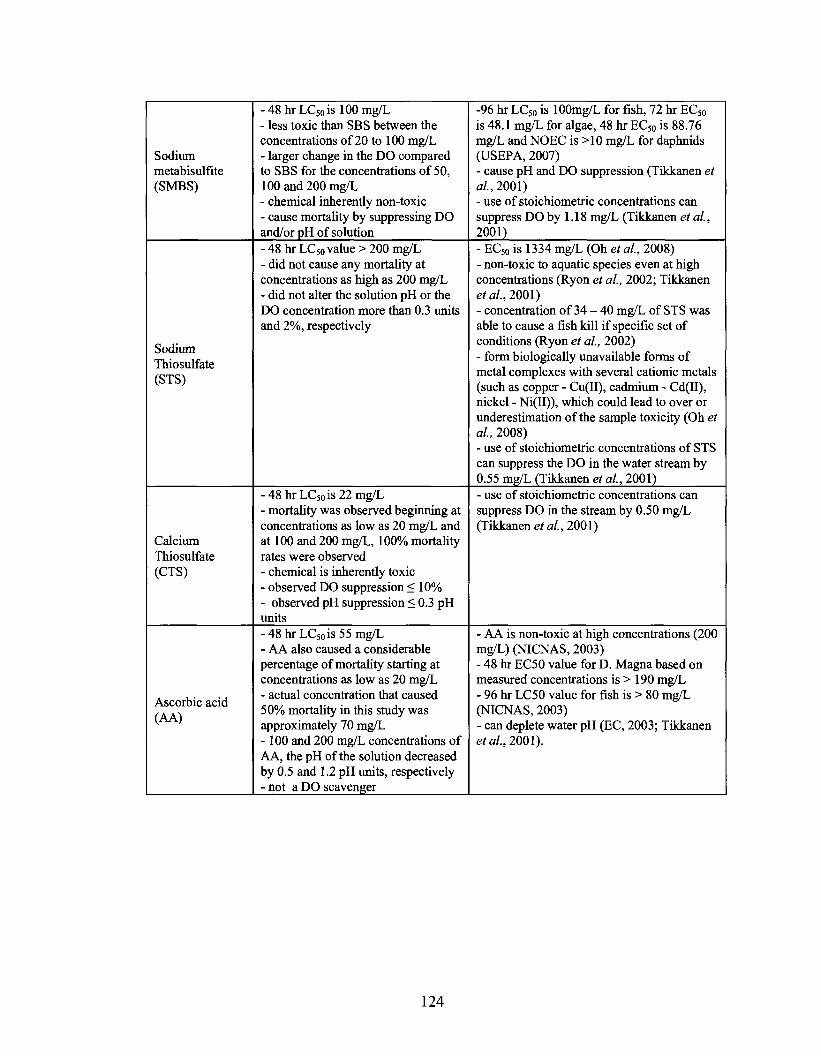
Sodium metabisulfite (SMBS)
Sodium Thiosulfate (STS)
Calcium Thiosulfate (CTS)
Ascorbic acid (AA)
-48hrLC50islOOmg/L - less toxic than SBS between the concentrations of 20 to 100 mg/L - larger change in the DO compared to SBS for the concentrations of 50, 100 and 200 mg/L - chemical inherently non-toxic - cause mortality by suppressing DO and/or pH of solution - 48 hr LC50 value > 200 mg/L - did not cause any mortality at concentrations as high as 200 mg/L - did not alter the solution pH or the DO concentration more than 0.3 units and 2%, respectively
-48hrLC50is22mg/L - mortality was observed beginning at concentrations as low as 20 mg/L and at 100 and 200 mg/L, 100% mortality rates were observed - chemical is inherently toxic - observed DO suppression < 10% - observed pH suppression < 0.3 pH units -48hrLC50is55mg/L - AA also caused a considerable percentage of mortality starting at concentrations as low as 20 mg/L - actual concentration that caused 50% mortality in this study was approximately 70 mg/L -100 and 200 mg/L concentrations of AA, the pH of the solution decreased by 0.5 and 1.2 pH units, respectively - not a DO scavenger
-96 hr LC50 is lOOmg/L for fish, 72 hr EC50
is 48.1 mg/L for algae, 48 hr EC50 is 88.76 mg/L and NOEC is >10 mg/L for daphnids (USEPA, 2007) - cause pH and DO suppression (Tikkanen et al, 2001) - use of stoichiometric concentrations can suppress DO by 1.18 mg/L (Tikkanen et al, 2001) - EC50 is 1334 mg/L (Oh et al, 2008) - non-toxic to aquatic species even at high concentrations (Ryon et al, 2002; Tikkanen et al, 2001) - concentration of 34 - 40 mg/L of STS was able to cause a fish kill if specific set of conditions (Ryon et al, 2002) - form biologically unavailable forms of metal complexes with several cationic metals (such as copper - Cu(II), cadmium - Cd(II), nickel - Ni(II)), which could lead to over or underestimation of the sample toxicity (Oh et al, 2008) - use of stoichiometric concentrations of STS can suppress the DO in the water stream by 0.55 mg/L (Tikkanen et al, 2001) - use of stoichiometric concentrations can suppress DO in the stream by 0.50 mg/L (Tikkanen et al, 2001)
- AA is non-toxic at high concentrations (200 mg/L) (NICNAS, 2003) - 48 hr EC50 value for D. Magna based on measured concentrations is > 190 mg/L - 96 hr LC50 value for fish is > 80 mg/L (NICNAS, 2003) - can deplete water pH (EC, 2003; Tikkanen et al, 2001).
124

Hydrogen peroxide (HP)
-48hrLC50is4.7 mg/L - Lethality effects of HP was observed beginning at concentrations as low as 2 mg/L, and 20 mg/L of HP resulted in 100 % mortality of the test organisms - chemical is inherently toxic - observed DO suppression < 10% - observed pH suppression < 0.3 pH units - the actual concentration of HP that caused 50% mortality was approximately 10 mg/L
- increase the DO in water (Tikkanen et al, 2001) - highly reactive and corrosive nature can cause adverse effects in the aquatic environment - EC50 for Daphnia magna is 7.7 mg/L, 48 hr LC50 for Daphnia pulex is 2.4 mg/L, fathead minnow and catfish have 96 hr LC50 values of 16.4 and 37.4 mg/L, respectively - pose a threat to the aquatic species at much smaller concentrations (Advanced Sterilization Products, 2005)
4.3 Applications in Wastewater Treatment Plant Design
Dechlorination of the disinfected wastewater effluent is an essential step prior to
discharging it into natural lakes and rivers to avoid the toxic effects of residual chlorine.
Findings of this experimental study can be applied to full-scale wastewater treatment
plant design to determine the required dosage of the DA based on the required contact
time and the aquatic health impacts. Also, the kinetic data and the required reaction time
information can be used in practice to identify the dechlorination chemical application
point. Experimental results obtained under variable mixing and pH conditions will assist
the WWTP designers to determine the necessary pH and mixing conditions to achieve
complete dechlorination within a desirable amount of time and with a minimum possible
dechlorination agent dosage.
Kinetic analysis of the dechlorination reactions revealed that most reactions were pseudo-
first order with respect to the total chlorine concentration in solution at lOx
stoichiometric. First order rate equations were deduced from the reaction rate constants
(k) obtained from the experimental studies. The reaction rate equation is in the form of
125

[C] = [C]0efa (8)
where k is the reaction rate constant. For example, for sodium sulfite, the pseudo-first
order rate equation is[C] = [C]0e"0142/. The first order rate equations for each of the
dechlorination chemicals could in turn be used to calculate the required contact time to
achieve complete neutralization of a given residual concentration of chlorine in the
effluent as follows.
[C] = [C]0efe
]n(C/Co) = ekl (9)
1, C /=—In—
k Co
For the chemicals with zero order reaction kinetics, the reaction rate is in the form of
CA~CA0=-kt (10)
and the required reaction time to achieve the neutralization of a given residual chlorine
level is calculated using the following formula:
j(CA0-CA) = t (11) k
Kinetic analysis of the dechlorination reactions at 2 - 4x stoichiometric dosage revealed
that most reactions were second order overall and first order with respect to each of the
reactants. Second order rate equations were deduced from the reaction rate constants (k)
obtained from the experimental studies. The reaction rate equation is in the form of
r = kCACB (12)
and the required reaction time to achieve the neutralization of a given residual chlorine
level is calculated using the following formula:
t= M ( ' - ^ (13) CA0(M-l)k
126

In this case the plot of In M(l_xA
) versus time gives a straight line and the slope of the
trendline is divided b CAO(M-1)1C to obtain the k value, which represents the rate
constant. Equation 13 was used to calculate the time required to neutralize a given
chlorine residual in the effluent at 3x stoichiometric dosage of each of the dechlorination
agent by substituting CAO = 1, 2, or 3 mg/L and the obtained k values. For example, in
the case of the 3x stoichiometric dosage of SMBS, the required reaction time for the
neutralization of 1 mg/L of residual chlorine was calculated as follows:
CM =lmg/L = 0.0\4mol/L
CA = 0.02 mg IL = 0.000282 mol IL
0.000282
0.014
M = 3 k=0.731L/mol.s i M-XA , 3-0.9798
M(l-XA) * " 3(1-0.9798) 1nPl ,
t= -—-—= - =l70seconds CA0(M-l)k 0.0\4x(3-l)xOJ31L/mol.s
This calculated 170 second reaction time does not agree with what was observed through
the experimental studies. For example, during the experiments, with the 3x stoichiometric
dosage of SMBS, 3.56 mg/L of chlorine was neutralized to 0.03 mg/L within 59 seconds.
Therefore, 1 mg/L of chlorine in the effluent is expected to be completely neutralized
within nearly 20 seconds. However, this is not what the above calculations reveal,
suggesting that there might be some deficiencies in the data analysis. One possible
reason for the discrepancy between the observed and the calculated reaction times is that
there might have been significant reduction in the reactant concentrations during the first
20 seconds following the DA addition, which was unable to be measured due to the lag
time in the analytical equipment. Further studies should be conducted with equipment
which could detect chlorine levels in the solution instantaneously, thus eliminating the
127

lag time. It is also possible to modify the data analysis, by assigning the CAO value as the
chlorine concentration at t = 20 seconds instead of t = 0 seconds, eliminate possible errors
that might have arisen by ignoring the obtained data between 0 - 2 0 seconds due to the
lag time.
The calculated reaction times for the lOx stoichiometric dosage of the seven
dechlorination chemicals are tabulated in Table 25 below.
Table 25: Calculated required reaction times for lOx stoichiometric dosages of DAs to achieve 0.02 mg/L residual with a 1, 2 and 3 mg/L initial concentration of chlorine.
DA SS
SBS* SMBS STS
CTS* AA* HP
10 x Stoichiometric . Chlorine Concentration in El
1 mjj/l.
28 2 23 36 4 2
2 32 3 27 43 7 5
[fluent (mg/L) 3 35 5 29 46 11 7
CND CND denotes that the reaction times could not be calculated since the reaction rate could not be determined from the obtained kinetic data * at 1 Ox stoichiometric dosage the reaction is zero order
Table 25 shows that in the case of the lOx stoichiometric dosage, all the chemicals,
except HP, achieved desired residual levels in less than 60 seconds, with SBS, CTS and
AA reactions going to completion in less than 11 seconds, probably because the reactions
were zero order and thus the reaction rate was independent of the reactant concentrations.
Further investigation is needed to determine which other factors effect the dechlorination
rate of these reactions. In addition, at the lOx stoichiometric, SS, SMBS and STS
required between 23 - 46 seconds to achieve complete neutralization.
128

The experimental data show that a lx stoichiometric dosage of SS, STS and AA is
insufficient to achieve complete dechlorination within a reasonable amount of time. The
dosage required to achieve complete dechlorination within 60 seconds is approximately
3x in excess of the stoichiometric requirement. Dechlorination chemical dosages of lOx
in excess of the stoichiometric requirement are not needed because ultimately the goal of
dechlorination is to achieve neutralization of residual chlorine within a reasonable
amount of time using the least amount of chemicals possible.
If the reaction times were able to be calculated for the lx and the 3x dosage, those
reaction times are not only useful in determining the necessary DA dosage, they could
also assist the treatment plant operators in deducing the dechlorination application point
to allow for the necessary contact time between the DA and the effluent prior to
discharge. Based on the flow of the wastewater stream, the operators can determine the
distance that is needed to allow for a given reaction time. Being able to address higher
residual chlorine effluent levels by simply altering the DA application point could be a
very economical choice for existing plants that are having difficulties achieving the
desired residual chlorine levels.
Another important finding of this study is that the measuring probes used in detecting
chlorine in the wastewater stream must be carefully chosen because some constituents of
the wastewater can interfere with the functionality of these probes and produce erroneous
results. The Dulcometer® D1C continuous residual chlorine and pH analyzer used in this
study was determined to be unsuitable for real life treatment plant applications because
129

the analyzer readings were effected by wastewater constituents such as amines. The
Hach spectrophotometer was found to be more useful in determining the residual chlorine
levels of the effluent for all the chemicals except in the case of HP. Even though it is
easy to use, it has been reported that Hach measurements are not accurate for measuring
chlorine residual below 0.10 mg/L (EC, 2003).
In combination with the above finding that the dechlorination agents should be used in
excess of the stoichiometric requirement, acute aquatic toxicity tests can be utilized to
determine the aquatic health impacts of varying concentrations of the various
dechlorination chemicals in the water. The 48-hour acute toxicity test data showed that
all the dechlorination agents have no lethality effects at concentrations of 2 mg/L except
for hydrogen peroxide as shown in Figure 32.
Illllll — i — i i — — i — — i — — i — — i
Control SS SBS SMBS STS CTS AA HP Dechlorination Agent
Figure 32: Percentage survival data for Daphnia magna for the 2 mg/L concentration of the seven dechlorination agents.
It is likely to find 2 mg/L of DA in the effluent if the dechlorination agent is used in
approximately 2x in excess of the stoichiometric requirement, and it is encouraging to
130

know that these doses do not have deleterious effects on Daphnia magna. On the other
hand, if the dechlorination agents are used lOx in excess, the effluent DA concentrations
could rise up to approximately 10-20 mg/L. In this case, Daphnia magna start to die for
SS, CTS, AA and HP as shown in Figure 33. The 20% mortality observed for SS might
be an experimental error or due to the drop in pH that was observed, as discussed in
section 4.2.1.
Control SS SBS SMBS STS CTS AA HP
Dechlorination Agent
Figure 33: Percentage survival data for Daphnia magna for the 20 mg/L concentration of the seven dechlorination agents.
The c»5£ indicate 100% mortality.
From Figure 33 it is apparent that SBS and SMBS, which are the commonly used
dechlorination agents in North America, did not cause lethality. STS is also shown to be
safe at concentrations as high as 20 mg/L, where as the same concentration of CTS
resulted in only 42% survival. HP, on the other hand, was the most lethal; it killed 100%
of the Daphnia magna. These results indicate that it is advisable to avoid using DA
concentrations slightly in excess of the stoichiometric requirement if it gives rise to
concentrations of 20 mg/L or less in the effluent.
131

Furthermore, 48-hour acute lethality tests were conducted using 200 mg/L of the
dechlorination agents to simulate a scenario of a large discharge, which is likely to
happen only in the case of an accidental spill or equipment malfunction. The obtained %
survival data for Daphnia magna is plotted in Figure 34.
Control SS SBS SMBS STS CTS AA HP
Dechlorination Agent
Figure 34 : Percentage survival data for Daphnia magna for the 200 mg/L concentration of the seven dechlorination agents.
The iM? indicate 100% mortality.
From Figure 34 it can be seen that all the dechlorination agents appear to be toxic to
Daphnia magna except for SS and STS. Thus it is important to realize that even
dechlorination agents that are used to reduce the toxicity of chlorine to aquatic species
can have deleterious effects at very high concentrations. As such, care should be taken to
ensure that the minimum possible dosage is used to achieve a balance between the
reasonable reaction time and the resulting residual DA concentration in the effluent. This
result further substantiates that the use of dechlorination agents at 2-3x in excess of the
stoichiometric dosage does not have appreciable mortality effects to daphnia magna, and
will allow the effluent residual chlorine to be neutralized within 60 seconds.
132

Chapter 5 5 Conclusions and Future Work This chapter presents the overall conclusions for the dechlorination kinetic study and the
acute toxicity testing conducted as a part of this research project. Section 5.1 includes the
overall conclusions that emerged from this two phase study, and section 5.2 presents a list
of recommendations for future work in the area of dechlorination.
5.1 Conclusions
As a part of this thesis project the dechlorination reaction kinetics of seven dechlorination
chemicals were studied under varying dosages, mixing regimes and pH conditions.
Dechlorination agent dosages ranging from lx - lOx stoichiometric were tested to
identify the minimum dosage required to achieve near zero chlorine residual levels (0.02
mg/L) in the effluent. In order to assess the affects of mixing frequency and intensity on
the dechlorination rate of these chemicals, samples were periodically and continuously
mixed at two different intensities - 130 and 275 RPM. Lastly, two different pH ranges
133

were tested (6.5 - 8.5 and pH >9) to assess the effects of variable pH on the
dechlorination rate of these chemicals. Acute toxicity tests were also undertaken using a
common aquatic indicator species - Daphnia magna - to identify the least harmful
dechlorination chemical in terms of the percentage mortality. The following is a list of
conclusions that emerged from this experimental study.
1. Dechlorination reactions at lx stoichiometric dosage (mg DA/ mg Cb) of the DAs
were rapid in most cases but not instantaneous. Dechlorination using a lx
stoichiometric dosage of sodium bisulfite, metabisulfite, calcium thiosulfate and
hydrogen peroxide was rapid but not instantaneous, the fastest reaction occurred
with hydrogen peroxide. Sodium sulfite, thiosulfate and ascorbic acid were not
able to achieve near-zero residual levels with lx stoichiometric dosage. In these
cases, dechlorination agents were need more than the stoichiometric dosage to
ensure a near zero residual (0.02 mg/L total residual chlorine, as required by
CEPA (1999)).
2. Dechlorination reactions were either zero order or pseudo-first order with respect
to the total chlorine concentration in solution when the dechlorination agent was
present well in excess of the stoichiometric dosage (i.e. lOx stoichiometric).
Dechlorination reactions of sodium bisulfite, calcium thiosulfate and ascorbic acid
were zero order and for sodium sulfite, sodium metabisulfite, sodium thiosulfate
and hydrogen peroxide were pseudo-first order with respect to the total chlorine
concentration in solution. The obtained rate constants can be used to calculate the
134

required reaction time to achieve complete neutralization of a given residual
chlorine concentration in the effluent.
3. Dechlorination reactions were second order overall when the dechlorination agent
was present 2- 4x in excess of the stoichiometric dosage (i.e. lOx stoichiometric).
Dechlorination reactions of sodium bisulfite, calcium thiosulfate and ascorbic acid
were second order overall. But for sodium sulfite, sodium metabisulfite and
sodium thiosulfate the reactions were first order with respect to the total chlorine
and the DA concentration in solution. The obtained rate constants can be used to
calculate the required reaction time to achieve complete neutralization of a given
residual chlorine concentration in the effluent.
4. Except in the case of ascorbic acid and calcium thiosulfate, using the
dechlorination agents in excess of the stoichiometric requirement was found to
pose no significant threat to Daphnia magna. Mortality levels at dosages of 2
mg/L, 20 mg/L and 200 mg/L were analyzed to get an idea of aquatic toxicity of
low, medium and high effluent concentrations of DAs, respectively. The 48-hour
acute (short-term) toxicity tests conducted with varying concentrations of the
dechlorination agents revealed that sodium sulfite and sodium thiosulfate had the
least aquatic impacts while hydrogen peroxide and calcium thiosulfate had the
most deleterious effects on Daphnia magna.
135

5. Dechlorination agents were either directly toxic or indirectly toxic to Daphnia
magna. Hydrogen peroxide and calcium thiosulfate were identified as directly
toxic to Daphnia magna because those chemicals showed inherent toxicity
without suppressing the DO or reducing the pH of the solution. Ascorbic acid,
sodium metabisulfite and sodium bisulfite on the other hand caused mortality
indirectly by suppressing the DO and the pH of the solution.
6. The mixing intensity and the frequency had no or minimal impact on the
dechlorination reaction rate of sodium bisulfite, sodium thiosulfate, and sodium
metabisulfite. For sodium sulfite and ascorbic acid, only the intensity of mixing
had an impact on the dechlorination rate but the frequency had no impact. The
reaction rate of calcium thiosulfate reaction on the other hand was increased by
both the mixing intensity and the frequency.
7. Increasing the pH of the reaction solution from 6.5 - 8.5 to > 9 had minimal or no
impact on the dechlorination reaction rate of SS, SBS, SMBS, STS, and CTS.
The effect of pH on the reaction rate of SBS was inconclusive from the
experimental evidence. For AA on the other hand, increase in pH of the
experimental solution caused a decrease in the reaction rate.
The conclusions from this dechlorination kinetic and aquatic toxicity study was then used
to formulate a set of recommendations for the wastewater facility managers, designers
and policy makers to assist with making accurate decisions regarding the most suitable
dechlorination chemical.
136

List of Recommendations
The following list is a set of recommendations formulated for wastewater facility
operators, managers, and designers in complying with the regulated effluent total residual
chlorine levels. Some recommendations stemming from the acute toxicity studies can
also assist policy makers with making accurate decisions regarding the most suitable
dechlorination chemical.
• If lx stoichiometric dosages of the dechlorination agents are used for economical
or other reasons, calcium thiosulfate or hydrogen peroxide should be the
dechlorination agent of choice.
• Using this required contact time data in combination with the flow rate of the
wastewater stream at a treatment plant, the dechlorination agent application point
could be determined to ensure effluent residual chlorine levels are in compliance.
• If SMBS and STS are the dechlorination agent of choice, then the lx
stoichiometric dosage on a weight basis (mg Ck/mg DA) is insufficient to achieve
near zero residual levels, thus SMBS and STS should be used in excess of the
stoichiometric requirement to achieve complete neutralization within a reasonable
time.
• From an aquatic toxicity perspective, SS and STS should be the dechlorination
agent of choice, while HP and CTS should be avoided. It is safe to use the
dechlorination agents 2 - 3x in excess of the stoichiometric requirement, except
137

for HP and AA. CTS, HP and AA should be avoided as dechlorination agents if
possible.
• If CTS or AA is the dechlorination agent of choice, the reaction mixture should be
continuously mixed at high intensity (G-value = 349 s"1) to maximize the reaction
rate. For SMBS, mixing the reaction continuously at low intensity (G-value =
507 s"1) is sufficient to achieve complete neutralization within a reasonable
amount of time. If SS, SBS, or STS is used, periodic mixing is adequate to
achieve a homogenous reactant mixture.
• If AA is the dechlorination agent of choice, care should be taken to ensure that the
solution pH does not exceed pH 9. At pH > 9, the rate of the reaction between
AA and chlorine is reduced, which would lead to higher than expected residual
chlorine levels.
138

5.2 Future Work
In order to further expand the knowledge of dechlorination kinetics and aquatic toxicity
of the dechlorination chemicals and build on the findings of this research study, the
following focus areas are suggested for future work:
• Further dechlorination kinetic analysis could be conducted using chlorinated
wastewater to better understand the dechlorination kinetics of these dechlorination
chemicals in full-scale when both organic and inorganic forms of chlorinated
species are present.
• Since the concentration/composition dependent term of the rate equation was
derived from this experimental study by holding the temperature constant, a set of
experiments could be undertaken to investigate the temperature dependent term of
the rate equation.
•rA=f\ concentration dependent term, temperature dependent term Found in this study Need Investigation
Hydrogen peroxide should be further studied to investigate the possible reasons
for the reaction to reach completion with less than stoichiometric dosages.
Further studies could be conducted at higher mixing intensities (e.g. G-values
between 1000 - 1500 s"1) to understand the effects of very high intensity mixing
on the dechlorination rate.
139

• Lower pH ranges (< 6.5) could also be tested to investigate the effects of lower
pH levels on the dechlorination rate of these chemicals.
• Aquatic toxicity tests could be conducted using dechlorinated wastewater to
assess the completeness of dechlorination by these dechlorination chemicals.
• Further aquatic tests could be conducted at higher dosages of SS and STS to
determine the LC50 values of these chemicals.
• In order to investigate the inherent toxicity of the dechlorination chemicals,
aquatic toxicity tests should be conducted under constant dissolved oxygen (DO)
and pH conditions.
140

References
Advanced Sterilization Products. 2005. Hydrogen Peroxide Material Safety Data Sheet (MSDS). MSDS NUMBER: 09461-0-001. Irvine, CA. URL: http://www.sterrad.corn/customer_support/user_resources/msds/h2o2_msds.pdf. Accessed on April 23, 2008.
Alberta Environment. 1996. Northern River Basins Study Final Report. URL: http://www3.gov.ab.ca/env/water/nrbs/index.html Accessed on February 21st, 2008.
Bedner, M., MacCrehan, W.A., & Helz, G. R. 2004. Making chlorine greener: investigation of alternatives to sulfite for dechlorination. Water Research, 38, 2505-2514.
Canada Colors Limited. 2008. Email Communication on May 20*2008.
CSTEE (Scientific Committee on Toxicity, Ecotoxicity and the Environment). 2001. Opinion on the results of the Risk Assessment of: Hydrogen Peroxide Human Health Effects. CAS No.: 7722-84-1, EINECS No.: 231-765-0.
Department of Environmental Protection (DEP). Bureau of Land & Water Quality. 2005. Dechlorination Design Standards for Maine Wastewater Facilities. URL: http://www.state.me.us/dep/blwq/ddds.htm Accessed on June 29, 2008.
Ekkad, N. V., & Huber, C. O. 1996. Residual sulfite after dechlorination of water. Water, Air, & Soil Pollution, 90(1-2): 195-300.
Environment Canada. 2003. Review of Municipal Effluent Chlorination/Dechlorination Principles, Technologies and Practices. Prepared by Associated Engineering (B.C.) Ltd. URL:http://www.pvr.ec.gc.ca/GeorgiaBasin/resources/publications/SciTechRepor ts/SciTech06 e.htm Accessed on January 23, 2008. Report Number: C2003-980317-1
Environment Canada. 2001a. The State of Municipal Wastewater Effluents in Canada. Municipal wastewater effluents: What they are and what they contain. URL: http://www.ec.gc.ca/soer-ree/English/soer/MWWEl.cfm. Accessed on October 29, 2007. Report Number: C2001-980074-6.
Environment Canada. 2001b. Threats to Sources of Drinking Water and Aquatic Ecosystem Health in Canada, Chapter 9 - Municipal Wastewater Effluents. URL: http://www.nwri.ca/threats/chapter09-e.html. Accessed on January 10, 2008. Report Number: C2001-980362-1
141

Environment Canada (EC), 1990 (with 1996 amendments). Biological Test Method: Acute Lethality Test Using Daphnia spp. Ottawa, Ontario. Report Number: C90-098684-0.
EPA Victoria. 2002. Disinfection of Treated Wastewater. Guidelines for Environmental Management. Publication #730. Victoria, Australia.
ESSECO USA. 2007. Catalyzed sodium sulfite with sodium metabisulfite Material Safety Data Sheet (MSDS). MSDS Number: EUSA-165. New Jersey.
Francy, D.S., Hart, T.L., Virosteck, CM. 1996. Effects of Receiving-Water Quality and Wastewater Treatment on Injury, Survival, and Regrowth of Fecal-Indicator Bacteria and Implications for Assessment of Recreational Water Quality. U.S. Geological Survey Water-Resources Investigations Report, 96-4199. Columbus, Ohio.
GE Infrastructure Water & Process Technologies (GE). 2004. ProMinent Dulcometer™ D1C / DMTa Chlorine Analyzer and Controller Total and Free Chlorine Control. Fact Sheet. Trevose, PA.
Greater Vancouver Regional District (GVRD). 1997. Chlorine Monitoring and Dechlorination Techniques Handbook prepared by ENKON Environmental Limited and Norecol, Dames & Moore, Inc. URL: http://www.gvrd.bc.ca/water/chlorin/handbk2.pdf Access on January 26th, 2008.
Helz, G.R., & Nweke, A.C. 1995. Incompleteness of Wastewater Dechlorination. Environmental Science and Toxicology, 29, 1018-1022.
IUPAC. 1997. IUPAC Compendium of Chemical Terminology, 2nd Edition compiled by Alan D. McNaught and Andrew Wilkinson (Royal Society of Chemistry, Cambridge, UK).
Jameel, R.H. & Helz, G.R. 1999. Organic Chloramines in Disinfected Wastewaters: Rates of Reduction by Sulfite and Toxicity. Environmental Toxicology and Chemistry, 18(0): 1899-1904.
Jensen, J. S., Helz, G. R. 1998. Rates of reduction of n-chlorinated peptides by sulfite: Relevance to incomplete dechlorination of wastewaters. Environmental Science & Technology, 32, 516-522.
Levenspiel, O. 1999. Chemical Reaction Engineering 3rd Edition. John Wiley & Sons, New Jersey, USA.
Liu, W., Andrews, S. A., Stefan, M.I., Bolton, J.R. 2003. Optimal methods for quenching H2O2 residuals prior to UFC testing. Water Research, 37(15): 3697-3703.
142

Loge, F.J., Emerick, R.W., Thompson, D.E., Nelson, D.C., Darby, J.L. 1999. Factors Influencing Ultraviolet Disinfection Performance Part I: Light Penetration to Wastewater Particles. Water Environment Research, 71(3): 377-381.
Macauley, J.J., Qiang, Z., Adams, CD., Surampalli, R., & Mormile, M.R. 2006. Disinfection of swine wastewater using chlorine, ultraviolet light and ozone. Water Research, 40(10): 2017-2026.
MacCrehan, W.A. Jensen, J.S., & Helz, G.R. 1998. Detection of sewage organic chlorination products that are resistant to dechlorination with sulfite. Environmental Science and Technology, 32, 3640-3645.
Mitchell, S.E., Read, A.F., & Little, T.J. 2004. The effect of a pathogen epidemic on the genetic structure and reproductive strategy of the crustacean Daphnia magna. Ecological Letters. 7:848-858.
Mallinckrodt Chemicals. 2005. Sodium Sulfite MSDS, Phillisburn, New Jersey. URL: http://www.itbaker.com/msds/englishhtml/s5066.htm Accessed on March 20, 2008.
MDL Information Systems, Inc. 2002. Sodium Thiosulfate Material Safety Data Sheet. http://www.deq.state.mi.us/documents/deq-ess-lab-SodiumThiosulfate.pdf Accessed on
New Mexico Environment Department (NMED). 2003. Recommended Standards for Wastewater Facilities; Policies for the design, review, and approval of plans and specifications for wastewater collection and treatment facilities. Santa Fe, NM.
National Industrial Chemicals Notification and Assessment Scheme (NICNAS). 2003. Public Report, 2-0—D-glucopyranosyl-L-ascorbic acid, File Number STD/1056. Australia.
Oh, S.R., Kim, J.K., Lee, M.J., and Choi, K. 2008. Dechlorination with Sodium Thiosulfate Affects the Toxicity of Wastewater Contaminated with Copper, Cadmium, Nickel, or Zinc. Environmental Toxicology. 9999(9999), NA.
Oxford University. 2005. The Physical and Theoretical Chemistry Laboratory. Safety data for hydrogen peroxide, 30% solution. URL: http://ptcl.chem.ox.ac.uk/MSDS/HY/hydrogen_peroxide_30pc.html Accessed on February, 15th 2007.
Parker, J.A., and Darby, J.L. 1995. Particle-Associated Coliform in Secondary Effluents: Shielding from Ultraviolet Light Disinfection. Water Environment Research, 67:1065-1075.
143
Peterka, G.A. 1998. Solution That's Easy to Swallow: Vitamin C - A Promising Dechlorination Reagent. Opflow, 24:12(1), 4-5.
Ryon, M.G., Stewart, A.J., Kszos, L.A., & Phipps, T.L. 2002. Impacts on Streams from the use of sulfur-based compounds for dechlorinating industrial effluents. Water, Air, and Soil Pollution, 136, 255-268.
Sciencelab.com, Inc. 2005a. Ascorbic Acid MSDS. Houston, Texas. URL: http://www.sciencelab.com/xMSDS-Ascorbic_acid-9922972. Accessed on June 29, Accessed April 27, 2008.
Sciencelab.com, Inc. 2005b. Sodium metabisulfite MSDS. Houston, Texas. URL: http://www.sciencelab.com/xMSDS-Sodium_metabisulfite-9927597, Accessed April 28,2008.
Shams El Din, A.M., Mohammed, R.A.1998. Kinetics of the reaction between hydrogen peroxide and hypochlorite. Desalination, 115, 145-153.
Society of Environmental Toxicology and Chemistry (SETAC). 2004. Whole Effluent Toxicity Testing, SETACTIP, technical issue paper. Pensacola, Florida.
Satterfield, Z. 2004. What does ppm or ppb mean? On Top. National Environmental Services Center, West Virginia University, Morgantown, WV.
Tchobanoglous, G., Burton, F. L., & Stensel, H. D. 2003. Wastewater engineering treatment and reuse. McGraw-Hill series in civil and environmental engineering. Boston: McGraw-Hill. ppl261 - 1263.
Tikkanen, M.W., Schroeter, J.H., Lawrence, P.E., Leong,Y.C, Ganesh, R. 2001. Guidance Manual for the Disposal of Chlorinated Water. AWWARF, Denver, CO.
Tramfloc Inc. 2002. Calcium Thiosulfate MSDS. Tempe, AZ.
United States Department of Army (US Army). 1988. Domestic Wastewater Treatment. Publication Number: TM 5-814-3. URL: http://www.usace.army.mil/publications/ armytm/tm5-814-3/ Accessed on January 26th, 2008.
United States Environmental Protection Agency (USEPA), 2007a. Reregistration Eligibility Decision - Inorganic Sulfites. Arlington, VA. URL: http://www.epa.gov/pesticides/reregistration/REDs/inorganicsulfites.pdf Accessed on February, 3rd
144

USEPA, 2007b. TRI Forms & Instructions Document: Appendix B. Section 7A. On-site Waste Treatment Methods and Efficiency. Water treatment. URL: http://www.epa.gOv/tri/TWebHelpAVebHelp/trilib.htm#4 2 1 water treatment.ht m Accessed on April 2, 2008
USEPA. 2003. Sodium thiosulfate; Notice of Filing a Pesticide Petition to Amend a Tolerance for a Certain Pesticide Chemical in or on Food. Federal Register, 68(228): 66416-66421. URL: http://www.epa.gov/EPA-PEST/2003/November/Day-26/p29320.htm Accessed on February 17th, 2008.
USEPA. 2002. Short-term Methods for Estimating the Chronic Toxicity of Effluents and Receiving Waters to Freshwater Organisms, 4th Ed. Section 13 - Test Method Daphnid, Ceriodaphnia Dubia, Survival and Reproduction Test Method 1002.0. 141 - 196.
USEPA. 2000. Wastewater Technology Fact Sheet, Dechlorination. URL: http://www.epa.gov/owmitnet/mtb/dechlorination.pdf Accessed on January 11th, 2008.
USEPA. 1998. Sewer and Tank Sediment Flushing: Case Studies. Chapter 4. EPA# EPA/600/R-98/157.
Utilities Kingston. 2004. Ravensview WPCP Secondary treatment and capacity upgrade Class EA update. Technical Memo #6 - Disinfection Process. Prepared by J.L. Richards & Associates Limited.
Wang, L.K., Hung, Y., and Shammas, N (Editors). 2006. Advanced Physicochemical Treatment Processes (Handbook of Environmental Engineering Volume 4). Humana Press, New Jersey, USA.
Weerasinghe, B.N., and Basu, O.D. 2008. Dechlorination Kinetics of Municipal Wastewater Effluent. Conference Proceedings of the 37th Annual WEAO Technical Symposium and OPCEA Exhibition, Collingwood, Ontario.
Water Environment Federation (WEF) and American Society of Civil Engineers (ASCE). 1998. Design of Municipal Wastewater Treatment Plants - MOP 8, 4th Edition, VA, USA.
White, G.C. 1999. Handbook of Chlorination and Alternative Disinfectants. John Wiley and Sons, Inc.,
New York (4th ed).
Wiseman, K.C. 1997. Use of Ascorbic Acid to Remove Chloramine from Dialysate Water. American Nephrology Nurses' Association Journal, 24(i), 67-68.
145

Worley, J.L. 2000. Evaluation of Dechlorinating Agents and Disposable Containers for Odor Testing of Drinking Water. Masters Thesis. Virginia Polytechnic Institute and State University.
Wu, Y., Lin, C , & Yuan, L. 2007. Characteristics of six cladocerans in relation to ecotoxicity testing. Ecological Indicators. 7:768-775.
Yonkos, L.T., Fisher, D.J., Burton, D.T., Whitekettle, W.K., & Petrille, J.C. 2001. Effectiveness of the sulfur (IV) compound, sodium bisulfite, in reducing chlorine, chlorine dioxide, and chlorite toxicity to Daphnia magna in well water and pond water. Environmental Toxicology and Chemistry, 20(3), 530-536.
Zumdahl, S.S. 1998. Chemical Principles, 3rd Edition. Houghton Mifflin Company. Boston, USA.
146

Appendices Appendix 1: NFPA Hazard Chart
t
Chem. name
Health (blue) 4-deadly 3-extreme danger 2 - hazardous 1-slightly
hazardous 0 - normal material
Fire Hazard (red) Flash Point Temp. 4 - below 73 F. 3 -below 100 F. 2 -below 200 F. 1 -above 200 F. 0-will not bum
Specific Hazard OXY-oxidizer ACID-acid ALK-Alkali COR - corrosive W - use no water RAD - radiation haz.
Reactivity (yellow) 4-may detonate 3 - shock or heat may
detonate 2 - violent chem. reaction 1 - unstable if heated 0
Figure A 1: NFPA Hazard rating chart. Adapted from: http://www.nmsu. edu/~safety/images/si gns/labelNFP A l.ipg
147

Appendix 2: Dechlorination Agent Dosage and Cost Calculations
1. Sodium Sulfite
ci2 +H2O^> HOCI+H+ + cr Na2S03 + HOCI -+Na2S04 + HCI Sodium sulfite Hypochlorous acid Sodium sulfate Hydrochloric acid
Stoich. dosage for SS nlNn.Sn. 1 mnl Hf)Cl
= US mg SSImgCl2
126 mg Na2SQ3 1 mol Na2S03 1 molHOCI
1 mol Na2S03 1 mol HOCI 70.9 mg Cl2
Oxygen Scavenging: 2 Na^O^ + 02 -» 2Na2S04
Sodium sulfite Sodium sulfate
Oxygen (mg) scavenged by 1 mg of sodium sulfite = = 0.127 2(126 g I mol Na2S04)
Sample Calculation For SS :
Stoichiometric Dosage=1.78 Kg I Kg Cl2
Delivery Concentration — 96%
Cost I Kg of chemical = $ 1.22 <M 22 1 19,K(f 100
Cost I Kg of Re sidual '- x — x = $2.26 / Kg of Re sidual Kg Residual KgCl2 96
2. Sodium Bisulfite
NaHSO, + HOCI -> NaHSO, + HCI Sodium bisulfite Hypochlorous acid Sodium bisulfate Hydrochloric acid
Stoich. dosage for SBS = 104.1 mg NaHS03 1 mol NaHS03 l mol HOCI
= 1.47 mgSSImgCl2 1 mol NaHSO} 1 mol HOCI 70.9 mg CI\
Sample Calculation For SBS:
Stoichiometric Dosage=1.47 Kg I Kg Cl2
Delivery Concentration = 38%
Cost I Kg of Chemical = $0.45
Cost I Kg of Re sidual= '• x — x = $ 1.74 / Kg of Re sidual Kg Re sidual KgCl2 38
148

3. Sodium Metabisulfite Na2S205 +2Cl2+3H20^>2NaHS04+ 4HCI
Sodium metabisulfite Sodium bisulfite Hydrochloric acid
Stoich. dosage for SMBS = mAmgNa2S1Q5Jn,olNa1S20^ 2ma,CI2 = SMBS/mgClj
\molNa2S205 2molCl2 141.8 mgCl2
Sample Calculation For SMBS:
Stoichiometric Dosage = 1.34 Kg I Kg Cl2
Delivery Concentration = 97%
Cost I Kg of Chemical = $0.94
Cost I Kg of Re sidual= : x — x = $ 1.30 / Kg of Re sidual Kg Residual KgCl2 97
4. Sodium Thiosulfate Na2S203 + Cl2 + 5H20^> INaHSO, + ZHCl
Sodium thiosulfate Sodium bisulfate
Stoich. dosage for STS = 158.1 mg Na2S20, \molNa2S20, ImolCL „ „„ „ . m « ,
- ?-?—L- 2-2-2- 2— = 2.23 mg SMBSImgCl2 1 mol Na2 S2 03 1 mol Cl2 70.9 mg Cl2
Sample Calculation for STS @ pH6.5:
Stoichiometric Dosage=2.23 Kg I Kg Cl2
Delivery Concentration = 97%
Cost I Kg of Chemical = $ 1.70 <r i nr\ 9 23 KQ 100
Cost I Kg of Re sidual = '• x —'- JC = $3.90/ Kg of Re sidual Kg Re sidual KgCl2 97
5. Calcium Thiosulfate
CaS203 + 4HOCI +H20^> CaS04 + 4HCI + H2S02 Calcium thiosulfate Hypochlorus Acid CalciumSulfate Hydrochloric Acid Sulfuric Acid
Stoich. dosage for CTS = 152.2 mgCaS^, ImolCaS.O, ImolHOCl ,. , , „„„ . ^,,
- 2-^-x 2-^-x = 0.54 mg CTSImg CL lmolCaS203 AmolHOCl 10.9mgCl2
2
149

Sample Calculation for CTS @ pH\ 1:
Stoichiometric Dosage=0.45 Kg I Kg Cl2
Delivery Concentration - 30%
Cost I Kg of Chemical = $ 1.95
Cost I Kg of Re sidual = '- x — x = $2.93 / Kg of Re sidual Kg Residual KgCl2 30
6. Ascorbic Acid
C5H505CH2OH+ HOCl -> C5Hi05CH2OH + HCl +H20 Ascorbic Acid Hypochlorus Acid Dehydroascorbic Acid Hydrochloric Acid
Stoich. dosage for AA = llCH-D 1 mnl HOC!
= 2.48 mg AAImgCl2
176.1 mg C6Hs06 1 mol C6H$06 1 mol HOCl
1 mol C6Hs06 1 mol HOCl 70.9 mg Cl2
Sample Calculation for AA:
Stoichiometric Dosage = 2.5 Kg I Kg Cl2
Delivery Concentration=99%
Cost I Kg of Chemical=$9.95
Cost I Kg of Re sidual= '- x — x = $25.13/ Kg of Re sidual Kg Re sidual KgCl2 99
7. Hydrogen Peroxide
Cl2+H202 -+2HCl + 02
Stoich. dosage for HP = O. \ m n l H n \rr,nlHnri
0ASmgHP/mgCl2
34 mg H202 \molH202 1 mol HOCl
1 molH202 1 mol HOCl 70.9 mg Cl2
Sample Calculation for HP:
Stoichiometric Dosage = 0.48 Kg I Kg Cl2
Delivery Concentration=35%
Cost I Kg of Chemical = $1.37
Cost I Kg of Re sidual= '- x—'• x = $1.88/ Kg of Residual Kg Re sidual KgCl2 35
150

Appendix 3: Plots for Reaction Order Determination
r -0.2273X + 9.0905 R2 = 0.8274
c a o c o o
10 15 20 25
Time Bapsed (seconds)
30 35 40
o o o "if
-1
•*1 ̂> •
•
y = -0.142x + 3.472 R2:
•
= 0.874
•
10 15 20 25
Time Bapsed (seconds)
30 35 40
y = 0.111x-2.687 R2 = 0.705..
• •
10 15 20 25
Time Bapsed (seconds)
30 35 40
Figure A 2: Test undertaken to determine the order of the reaction of sodium sulfite with respect to the total chlorine concentration in solution. Dosages of SS in excess of 10 x stoichiometric dosage at continuous low intensity mixing and pH 6.5 - 8.5 data was used to determine the pseudo-order of the reactions.
151

A
(mg
/L)
CO
nt ra
t io
n
Co
nce
n
\ * • \
\
A y = -0.626x +19.694 \
R2 = 0.966 \
\
\
*
0 5 10 15 20 25 30 35
Time Elapsed (seconds)
0
_1
o 5 c - -2
$ \ \ »
y =-0.390x +9.819 \ * R2 = 0.888 \ #
•
0 5 10 15 20 25 30 35
Time Elapsed (seconds)
•i ^
2 .
1/C
-| .
n
•
y = 0.390x - 9.981 / R2 = 0.615 /
/ •
A * *7
0 5 10 15 20 25 30 35
Time Bapsed (seconds)
Figure A 3: Test undertaken to determine the order of the reaction of sodium bisulfite with respect to the total chlorine concentration in solution. Dosages of SBS in excess of 10 x stoichiometric dosage at continuous low intensity mixing and pH 6.5 - 8.5 data was used to determine the pseudo-order of the reactions.
152

A
Con
cent
ratio
n (m
g/L)
C
•
N . y = -0.2084X + 7.9399 * > ^ R? = 0.7915
) 5 10 15 20 25 30 35 40
Time Bapsed (seconds)
n
-1 "o" y o
-2
-3
N. y = -0.1724x +4.1376 > ^ R2 = 0.9688
^ V »
• >v
0 5 10 15 20 25 30 35 40
Time Bapsed (seconds)
•a
o
1/C
n
C
/
y = 0.1906x-4.7351 * / ^ R2 = 0.6764 X 4
• / +
5 10 15 20 25 30 35 40
Time Bapsed (seconds)
Figure A 4: Test undertaken to determine the order of the reaction of sodium metabisulfite with respect to the total chlorine concentration. Dosages of SMBS in excess of 10 x stoichiometric dosage at continuous low intensity mixing and pH 6.5 - 8.5 data was used to determine the pseudo-order of the reactions.
153

O)
c o
c 8 c o o
y = -0.2796X + 9.644 R2 = 0.9932
10 15 20 25 30
Time Bapsed (seconds)
40
o u G c
y = -0.2473X + 5.9294 R2 = 0.8675
10 15 20 25
Time Bapsed (seconds)
30 35 40
y = 0.3449X - 8.92 R2 = 0.5048
10 15 20 25
Time Bapsed (seconds)
30 35 40
Figure A 5: Test undertaken to determine the order of the reaction of calcium thiosulfate with respect to the total and free chlorine concentration in solution. Dosages of CTS in excess of 10 x stoichiometric dosage at continuous low intensity mixing and pH 6.5 - 8.5 data was used to determine the pseudo-order of the reactions.
154

15 20 25
Time Bapsed (seconds)
o U O
i
2
3
\ t \ . • \ ^ •
#̂ \ • y = -0.2742X + 5.6299 \
R? = 0.7489 • \
• •
10 15 20 25
Time Bapsed (seconds)
30 35 40
y = 0.2663X - 5.3775 FP = 0.416 ^ / ±_
10 15 20 25
Time Bapsed (seconds)
30 35 40
Figure A 6: Test undertaken to determine the order of the reaction of ascorbic acid with respect to the total and free chlorine concentration in solution. Dosages of AA in excess of 10 x stoichiometric dosage at continuous low intensity mixing and pH 6.5 - 8.5 data was used to determine the pseudo-order of the reactions.
155

(mg
/L)
1 2 C
on
cen
t
n
\ . \
\ y = -0.7754X + 20.599 \ R2 = 0.7824
• \
\
0 5 10 15 20 25 30 35 40
Time Bapsed (seconds)
n
-1 o o o ^ -2
Q
v \ \
y =-0.5019x + 10.996 ^ R2 = 0.8511 \
•
0 5 10 15 20 25 30 35 40
Time Bapsed (seconds)
1/C
n
•
y = 0.3773X - 8.2974 / R2 = 0.7503 y
/
/
/ / 0 5 10 15 20 25 30 35 40
Time Bapsed (seconds)
Figure A 7: Test undertaken to determine the order of the reaction of hydrogen peroxide with respect to the total chlorine concentration in solution. Dosages of HP in excess of 10 x stoichiometric dosage at continuous low intensity mixing and pH 6.5 - 8.5 data was used to determine the pseudo-order of the reactions.
156

Appendix 4: Plots for LC50 Determination
100
O)
E
2 10 c 0) u c o o tn CO
• — .
oo
•
10 20 30 40 50 60
% mortality
70 80 90 100
Figure A 8: Plot of percentage mortality at different dosages of Sodium Bisulfite (SBS) used to determine the LC50 value. One outlier was identified in the data (circled), which was omitted in the data analysis.
1000
O)
~ 100 c o '^ 2 c o c o u tn m s tn
10
= < F = . — - — ^ = =
«i '
<>
10 20 30 40 50 60 70 80 90 100
% mortality
Figure A 9: Plot of percentage mortality at different dosages of Sodium Metabisulfite (SMBS) used to determine the LC50 value.
157

1000
E 100 c o
c « o c o o 10
O
0 10 20 30 40 50 60 70 80 90 100
% mortality
Figure A 10: Plot of percentage mortality at different dosages of Calcium Thiosulfate (CTS) used to determine the LC50 value.
100
O)
g c E 10 c 0) o c o o
2
. X •
,, \ \ \ 1 \— 0 10 20 30 40 50 60 70 80 90 100
% Mortality
Figure A l l : Plot of percentage mortality at different dosages of Ascorbic Acid (AA) used to determine the LC50 value.
158

100
O) E c o
2 10 c « o c o u Q.
- I I I ] I | r I ! • • • < >
O
4 ^ s
10 20 30 40 50 60 70 80 90 100
% Mortality
Figure A 12: Plot of percentage mortality at different dosages of Hydrogen Peroxide (HP) used to determine the LC50 value.
159