kinematics of the south-w estern us deformation …...2.2 tectonic setting 19 figure 2.1: t ectonic...
TRANSCRIPT

Chapter 2
Kinematics of the South-WesternUSDeformation Zone inferr edfr om GPSmotion data.
2.1 Intr oduction
In�
thesouthwesternUS theboundarybetweenthePacific andNorth Americanplatescomprises� a broadzoneof deformationportrayinga variety of distinct deformationstyles� and regionsof complex tectonics(e.g. TransverseRanges,easternCaliforniashear� zone). An importantconstrainton thepresent-daytectonicsin this region is anaccurate� descriptionof thevelocitygradientfield becausethis field providesimportantkinematic�
boundaryconditionsfor dynamicmodeling(e.g.EnglandandHouseman,1989;JacksonandMolnar, 1990),aswell asameansto estimatemomentdeficitsusedfor seismichazardanalysis(WGCEP, 1995). Spacegeodetictechniques,primarilythe�
globalpositioningsystem(GPS),now provide a greatsourceof informationaboutthe�
patternsand ratesof deformationacrossspatialscalesof order 10 to 1000 km.ThroughoutthesouthwesternUSdeformationzone,for example,continuouslyoperat-ing�
networksof GPSstationshavebeenin operationsincethemid-1990’s (e.g.SCEC,B�
ARD, BARGEN, EBRY). Furtherdensificationis provided by the many campaignsites� from which datahave becomereadilyavailable(e.g.Bennettet al., 1997;Dixonet� al., 2000a,b;Ganet al., 2000;Miller et al., 2001;Shenet al., 1996;Thatcheret al.,1999).RecentlyBennettet al. (1999,2002)andBennett(2003)integrateddatafrom alar
genumberof thecontinuousandcampaignnetworksin southwesternUSto obtainadataset
within onesinglereferenceframe.Becausespacegeodeticpositioningtechniquesprovide velocity estimatesat spe-
This chapterhasbeensubmittedfor publicationto J�. Geoph.Res.as: A.G. Bos,W. Spakmanand
R.A. Bennett,Kinematicsof theSouth-WesternUSDeformationZoneinferredfrom GPSmotiondata.
17

18 Chapter2
cific� pointsin space,andthedensityof availablepointsis quitevariabledependingonthe�
region andscaleof investigation(kilometersto 100’s of kilometers),resolutionofthe�
spatiallycontinuousvelocity gradienttensorfield dependsheavily on thenumberand� distribution of availablestations.Most methodsstartwith someinterpolationofthe�
geodeticdatain dataspace.For example,Snayet al. (1996)implementa bilinearinterpolationschemeto transfercrustaldeformationinformation from geodeticsitesto�
grid nodes. Strainandrotationratesweresubsequentlyobtainedby discretespa-tial�
differentiationof thehorizontalvelocity grid. Shenet al. (1996)andWard(1998)resolvedthestrainandrotationratesatany arbitrarysamplepointsby aweightedleast-squares� inversionof thegeodeticvelocity estimatesbasicallyassumingsmoothnessofthe�
crustalvelocity field. Along similar lines,Shen-Tu et al. (1998,1999)invert aver-age� strainratesfrom seismologicalandgeologicalinferencesand/orgeodeticvelocityestimates� for aspatiallyvariableEulervectorfunctionthatdescribedthehorizontalve-locity
field on the Earth’s surface. The rotationvectorfunction wasrepresentedby abicubic�
Besselinterpolation.Bennett(2003)regularizedthevelocity gradientinverseproblem by consideringthe relative motionsamongandinternaldeformationswithina� very small numberof geodeticallydefinedstrainprovinces. Previous studieshavetended�
to concentrateon eitherthedetailsof relatively small regions,or on relativelylo
w resolutionbroad-scalefeatures.Noneof thesepreviousinvestigationsincorporated(a)seismic�
motionon faultsaspartof theirmodelparameterization.In�
thischapterI analyzeanupdatedversionof thesouthwesternUScrustalvelocitydata
setof Bennett(2003),with theaimof capturingboththebroad-scalepatternof de-formation,andthefiner-scaledetailsof thedeformationfield in asingleself-consistentsurf� acedeformationmodel. Fromthis dataset,I estimatethehorizontalvelocity gra-dient
field, aswell ascreepon all majorfaultsusingtheinversionprocedureproposedby�
SpakmanandNyst (2002). This methodis basedon thekinematicsof incrementaldeformation
in a modelspaceformulationandincorporatesno assumptionsaboutthedynamics
or rheologyof thecrust. Themethodallows for densificationof themodelparameterization in areasof increaseddatadensity, providing moredetail in the sur-f�acedeformationfield modeledwhereappropriate,while at thesametime accounting
for bothplate-scaledeformationpatternsandsmall-scaledisplacementdiscontinuitiesassociated� with nearsurfacefault creep.This multiscaleparameterizationhasthepo-tential�
to determinewhetherstrongjumps in relative velocitiesacrossfaults signifycreep� on the faults (King et al., 1994; Nicholsonet al., 1986) or alternatively rapidstrain� accumulationon locked seismogenicfaults (Bennettet al., 1996; King et al.,1994).
I�
usethis techniqueto derive a surfacedeformationmodelfor which I evaluatetheconsistenc� y of thecontemporarystrainratefield with thelong-termstrainratefield de-rivedfrom seismicandgeologicalfault slip dataandcorrespondingmomenttensors.Iwill� alsoderive themomentdeficit owing to thedifferencebetweenthegeodeticmo-mentderived from my strainratefield andtheseismicmomentderived from moment

2.2TectonicSetting 19
Figure�
2.1: T�ectonicsettingof thesouthwesternUSdeformationzoneplottedagainsttopog-
r� aphy. Black lines indicatethe fault tracesutilized in the modelparameterization.Grey dotsindicate�
the shallow( ����� km)�
relocatedseismicityof Engdahlet al. [1998]. MD: MojaveDesert;ST: SaltonThrough;ECSZ:easternCalifornia shearzone;CNSZ:central Nevadaseis-mic� zone;WLB:Walker Lanebelt; SAF:SanAndreasfault; HF: Hayward fault; CF: Calaverasfault;�
GF: Garlock fault; SJF:SanJacintofault; EF: Elsinore fault; CPF: Cerro Prieto fault;P: Parkfield.For a color versionof this figureseefigureC.1of appendixC.1.
tensor�
summationof theseismicitywithin themodelareaduringthetime-spanof ob-serv� ation,which I interpretin termsof seismichazard.Finally, basedon my surfacedeformation
model,I proposeakinematicmodelfor theaccommodationof thePacific-North�
Americanrelativeplatemotion.
2.2�
TectonicSetting
In thesouthwesternUStheboundarybetweenthePacificandNorthAmericanplatesisdistrib
utedacrossa 300-1000km wide zonerangingfrom thePacific coastto thestateof� Utah (figure 2.1). The relative platemotion acrossthe deformationzoneamountsto� "!$#
mm/yr (DeMetset al., 1990),of which only a fraction is accommodatedby

20 Chapter2
the�
SanAndreasfault (WGCEP, 1995).Southof latitude34% N,�
theremainingrelativeplate motion is distributedalongneighboringparallel faults,suchasthe SanJacintoand� Elsinorefaultswhichall lie to thewestof theSanAndreas(WGCEP, 1995).Northof� 34% N,
�thefaultsof theeasternCaliforniashearzoneandBasinandRangeprovince,
east� of the SanAndreassystem,alsoaccommodatea significantfraction of the totalplate motion. At 34% N� the SanAndreasfault changesits orientationfrom N& # % W' toN� ($) % W' dueto a 160km ”left-step” in the fault. It is generallyacceptedthat this BigBend�
sectionof the fault zonecomprisesa structuralimpedimentto the platemotion(Eberhart-Phillips�
etal.,1990)causinghorizontalcrustalshorteningandverticalcrustalthick�
eningwithin theTransverseRanges(Arguset al., 1999).TheSantaMonica,SanGabriel,*
SanBernadinoandPinto Mountainscanall be regardedassurfaceexpres-sions� of this convergence.North of the Big Bend,the SanAndreasfault resumesanorientation� almostparallelto theplatemotion(N& # % W).
'Furthernorth,aroundthelati-
tude�
of 36.5% N� thegreaterSanAndreassystembroadens,to includetheCalaverasandHayw+
ardfaults,in additionto theSanAndreasfault sensostricto.North�
of latitude34% N,�
eastof thegreaterSanAndreasfaultsystem,approximately, #.- , !% of the relative platemotion is transferredfrom the SaltonTroughthrough
the�
Mojave Desertvia theEasternCalifornianshearzone(ECSZ)(Dixon et al., 1995,2000b;/
Dokka andTravis, 1990;Ganet al., 2000;Miller et al., 2001;Sauberet al.,1994; Savage et al., 1990). The ECSZ inlet feedsthe westernGreat Basin strainpro vince (Bennett,2003)which encompassesboth the geologicallyclassifiedWalkerLaneBelt (WLB) andtheseismologicallydefinedcentralNevadaseismicbelt (figure2.1)./
At Mono Lake ( )0(21 ! % N)
�thereis a broadeningof the ECSZdeformationinto
the�
centralandnorthernWalkerLaneBelt (WLB) andthecentralNevadaseismiczone(CNSZ)�
locatedin thewesternGreatBasinof theBasinandRangeprovince(Bennett,2003;/
Dokka andTravis, 1990;Oldow et al., 2001;Savageet al., 1990,1995,figure2.1)./
W'
estof this inboardshearzone,thecentralandeasternGreatBasinprovincesarecharacterized� by aseriesof roughlynorth-trendingbasinboundingnormalfaults(Stew-art,� 1971). In contrastto theratheruniform distribution of faults,historicalseismicityis�
primarily restrictedto a narrow belt generallycoincidentwith the greaterWasatchf�ault zonecalledthe intermountainseismicbelt (IMSB). Contemporarycrustalexten-
sion� in thispartof theBasinandRangeprovinceis distributedacrossawideregionthatincludes,�
but is significantlybroaderthan,theintermountainseismicbelt (e.g.Bennett,2003;/
Friedrichetal., 2003)
2.3�
Relativemotion data
Figure�
2.2showsthehorizontalvelocityestimatesthatcomprisethedatafor thisstudy.This datasetis derivedfrom a combinationof velocity estimatesfrom continuousnet-
2.3Relativemotiondata 21
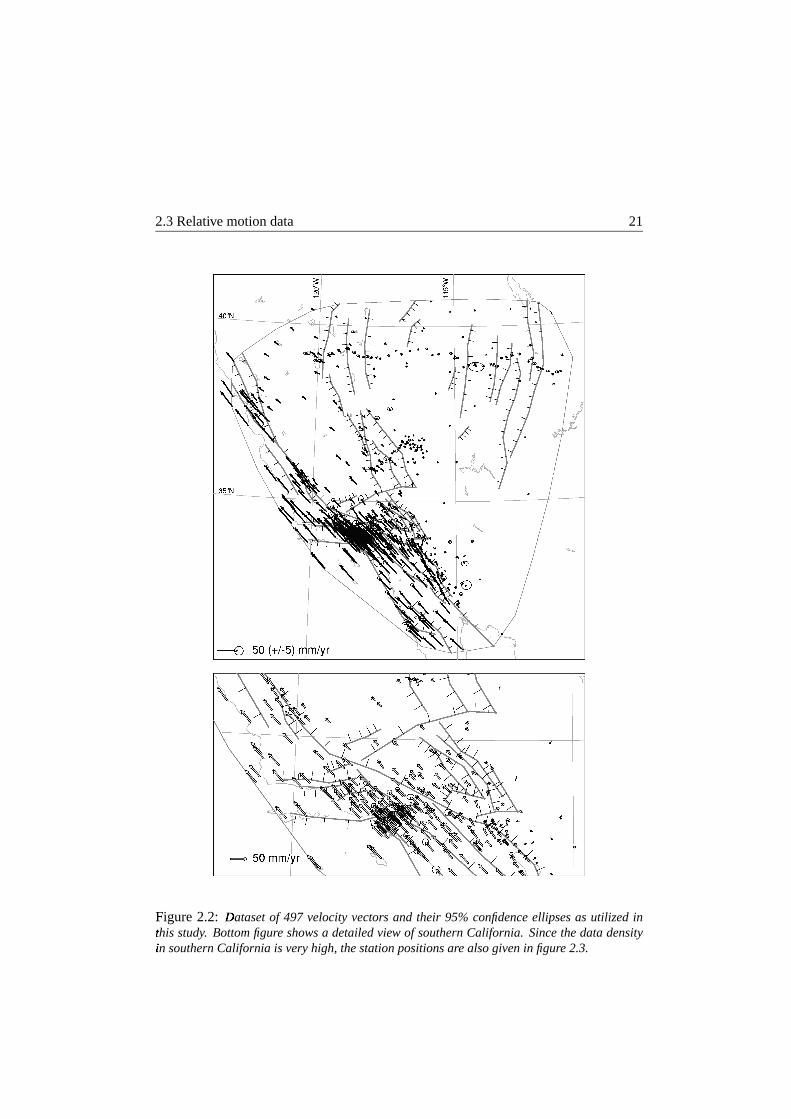
Figure�
2.2: Dataset3
of 497 velocityvectors and their 95% confidenceellipsesas utilized inthis4 study. Bottomfigure showsa detailedview of southernCalifornia. Sincethedatadensityin�
southernCalifornia is veryhigh, thestationpositionsarealsogivenin figure2.3.

22 Chapter2
w� orks [BARD (e.g.King et al., 1995),BARGEN (e.g.Bennettet al., 1998;Wernickeet� al., 2000), EBRY (http:/www
5.mines.utah.edu/rbsmith/RESEARCH/UUGPS.html),
6SCIGN7
(Bock et al., 1997)andIGS (Beutleret al., 1994)],aswell asfrom campaigndata
[SCEC(Shenet al., 1996),northernBasinandRangeProvince (Thatcheret al.,1999),ECSZ(Bennettet al., 1997;Ganet al., 2000;Miller et al., 2001), the SierraNe�
vada(Dixon et al., 2000b)and northeastBaja, California (Dixon et al., 2000a)].The8
methodusedto combinethesedifferentdatasetsis describedby Bennettet al.(2002)�
andBennett(2003). All velocity vectorsin the combinedsolution refer to acommon� NorthAmericafixedreferenceframe.For my studyI limit thedatasetto GPSand� VLBI observationsites,whichamountsto 497stationslocatedin thesouthwesternUS,9
of which 194arecontinuouslyoperatingGPSstations.Thevelocity estimatesatthe�
latter arein mostcasessignificantlymoreprecisethanthe campaignestimates.Ido
not considerthosestationsfor which the :2; v< elocity estimateuncertaintiesexceed10 mm/yr. 57 stationsin the combineddatasetare includedin several of the cam-paign networksand/ora continuousGPSnetwork. For thesestationsI only retainthecontinuous� velocity estimateor the mostpreciseestimateof relative motion for eachstation.� At two stationsin theMojaveDesertpost-seismicrelaxationdueto theLandersearthquak� e couldbe identified(Shenet al., 1996). Sincemy objective is to modelthelong-term,
morestationarysurfacedeformationfield, I retainthepre-Landersvelocityestimates.�
2.4 Inversionmethodand modelparameterization
I�
usethe methodof Spakmanand Nyst (2002) to invert the relative motion datainestimates� of thesurfacevelocity-gradientfield (strain-androtationrate),andslip rate(creep�
rate)on major faults. In brief, the methodutilizes the following observationequation� for theobservedrelativemotion =?>A@CB between
�any two stationsD and� E :
=GFH@CBJIKMLONPRQ N SHTUWV
X FZY\[^]O_a`b[?cKdeQ Ngf d2hid Ykj
d@CB ] (2.1)�
where� X FZY\[^].I >Almln>Almo> opl > opo is the unknown velocity gradientfield (with e.g.
> opl I�
indicatetherateof changeof > o -componentwith the q -coordinatein a sphericalcoordinate� frame)and hid is the unknown fault slip rate(creeprate)on fault segmentr. The two stationsareconnectedwith a path s of� arbitrarygeometry(but usually
the�
geodesic)which is cut into segmentsat the locations(j d@CB )6 whereit crossesa faultleadingto path-segmentss P@CB . At theselocationsa fault slip term is addedto accountfor�
thepossiblecontribution of fault motionto =?>A@CB . Equation2.1 is exact in practiceand� doesnot involve any knowledgeof crustalrheology. Thevelocity gradientfield is

2.4Inversionmethodandmodelparameterization 23
parameterized by assuminglinearvariationof its componentsin triangulardomains.Tothis�
enda studyregion is subdividedby (spherical)triangulationusingsupportpointswhich� becomethemodelnodes.Thespatialdensityof nodescanbevariedto adapttothe�
localdatadensity. Nodesneednotcoincidewith stationpositionsandtrianglesidesnevercrossfaults.With thisparameterizationthemodelparametersarethecomponentsof� the velocity gradienttensorat the model nodes. Fault slip rate (or creeprate) isparameterized by assumingconstantslip rateon fault segments.
Substitution7
of themodelparameterizationin 2.1 leadsto a linearsystemof equa-tions�
representedhereby tuwv I tx , where tu is theobservationmatrix,v
representsthe�
collectionof all modelparameters,and tx is thevectorof all combinationsof rela-ti�vemotionbetweenstationpairs.Thelengthof tx is
�of theorderof y�Ypy - :a] relatiz ve
motioncomponentswhere y is thenumberof stations.This setof equationscanbee� xtendedby definingextra integrationpaths s between
�all stationpairs. Theseextra
paths areusedto assureinternalconsistency betweenthe velocity gradientfield andf�ault motionin constitutingthetotal deformationfield. A next setof equationsderives
from the fact thatX|{}X F~I�� within� regionsboundedby faults. This constraintis
defined
for eachsingletriangleleadingto the linear equationfH� ��v I�� where� fH�is�
a weight usedto tune the relative importanceof theseequationsin determiningasolution.�
Thedataequationsandthecurl-constraintscanbemergedin onematrix equationu�v I x which� is solvedby regularizedleastsquares.Theregularizationis performedby�
extendinguwv I x with� 3 setsof dampingequations:(1) fH� �m� v I�� for
�damping
the�
amplitudeofX F components� onmodel’sboundarynodes,(2) f @ �m� v I�� for spa-
tially�
variableamplitudedampingin nodesof themodelinterior, and(3) fH� ��� v I��for�
penalizingthe secondderivative of the componentsofX F , where
���and� � N are�
identity�
matricesand���
a� secondderivativeoperator(or discreteLaplaciansmoother;Se7
gall andHarris,1987).Theamplitudedampingassuresa completeregularizationofthe�
extendedmatrix andavoids unwarrantedamplitudeexcursionsin regionsof poorspatial� resolutionwhile the secondderivative dampinghasa smoothingeffect on thesolution.� For this applicationit provedunnecessaryto dampthefault slip rateparame-ters.�
Theformal least-squaressolutionof theregularizedsystemis:v I�Y u������ N�u c f
��� � c f
�@ � N c f��� �� � � ] � N u������ N� tx (2.2)
�which� dependsonthetuningof fH� , andthe3 regularizationfactors.Theaposteriori
model� covarianceis givenby:� I�Y u � ��� N�
u c f����� c f
� @ � N c f��� �� ��� ] � N and� the
model� resolutionkernelis ��I ��u � ��� N�u
.In my applicationM=497 which leadsto 123,256integration pathstaken along
geodesics.� In total 246,512alternative integrationpathswereadded. The curl con-straints� amountto 1327equations,thus, in total I have 371,095dataequations. In-v< ersionof the correspondingdatacovariancematrix is impossibleowing to its size.

24 Chapter2
Figure�
2.3: F
inal parameterizationof the SWUSDZmodels. Thick lines indicate fault seg-ments,� black dotsare the triangle nodesandgrey dotsare thesite positions.Notethat in myc¡ hoicefor thetrianglenodesI amnot restrictedto thelocationsof theobservationsites.Trian-gles¢ do not intersectfaults. Nodesat the fault are doubledto allow thevelocitygradientfieldto4 bediscontinuousacrossfaults.

2.5Inversion 25
InsteadI take for� � a� diagonalmatrix with elements>¤£�j¥Yp=J>a@CB¦]§l�¨~Yp;A@©] �l c�Y©;^B¦] �l as�
an� estimateof thevariancefor thevelocitydifferenceYp=?>A@CBm] l in longitudinaldirection.Similarly7
in latitudinaldirection.Themodelregion is parameterizedwith 1327triangles(figure2.3). Thelocal den-
sity� of GPSstationswasusedto guidedensificationin thetriangulation.Thetrianglesare� spannedby 777modelnodesleadingto 4*777velocitygradienttensorcomponentsto�
besolvedfor. Themajorsystemof surface-breakingactive faultsin Californiaandthe�
Wasatschfault zonewereadoptedfrom the USGS.The Basin& Rangeprovinceis�
characterizedby diffuse fault zoneswhich I mimic by a few single faults (figure2.3)./
In total I have 46 largefault traces.Thesearedividedinto 292segmentsleadingto�
2*292 slip ratecomponentsin the model. The total numberof modelparametersis 3692which definesthe sizeof the matrix to be invertedto obtain the solution
v(Equation�
2.2).
2.5 Inversion
The dataare invertedfor threedifferent representationsof the SWUSDZcrustalde-formationfield; the first (solution I) in termsof rotationsof crustalblocksandfaultmotion,� thesecond(solutionII) in termsof continuousdeformationonly, andthethird(solution�
III) in termsof continuousdeformationandfault motion. In orderto quanti-tati�
vely comparethethreerepresentationsof crustaldeformationI determineonesetofrez gularizationparametersfor all solutions.For tuningof thecovariancefactor ; � for
�the�
extraXª{«X F¬I� constraints� andof theregularizationparametersfH� , f @ and� fH� ,
I primarily focuson obtainingsolutions(for inversionsI, II andIII, respectively) thatare� comparablyresolvedandobtainanacceptablemodelcovariance.Thespatialvari-ation� of the amplituderegularization( f @ )6 dependson the numberof paths(hitcount)
® ¯±° ²´³ ² UCµ ² UC¶ ²O· ²´¸k° ¹Hº »¼¾½ »¯0¿½ »¯¤À½ÁÃÂÅÄaÆ Á\ÂaÇ ÁÃÂaÈ Á\ÂaÈ ÁÃÂ2È ÁÃÂ^ÉkÊ ÁÃÂ^ÄaÇm/yr /yr mm/yr
I 3.5 3.0 2.0 4.0 3.0 2.0 13.72 0.31 0.53 0.036II 3.5 3.0 2.0 4.0 3.0 - 5.27 0.66 1.20 -III 3.5 3.0 2.0 4.0 3.0 - 3.98 0.66 1.36 0.049
T8able2.1: Aspects
Ëof the inversion parameterizationand average resultsfor inversionsI, II
andÌ III. Key: Í ,Î solution; Ï2Ð ,Î standard deviation of the Ñ~ÒwÑÔÓwÕ�Ö equations;× ØgÙ ,Î ØgÚ µ ,Î ØgÚ ¶ ,ÎØgÛ andÌ ØgÜ Ð ,Î the regularizationparameters; Ý0Þ ,Î numberof modelnodes; ß ,Î numberof faultseà gments; áâ�ã Õ äå åÚRæ ä ç ÚèÚ ,Î the average resolution,with
ç ÚCÚ the4 diagonal elementsof the
resolutionmatrixand é the4
numberof modelparameters; áÏAêã Õ äå?ë å?ëÚìæ äí î ÚèÚ ,Î theaverage
standarà d deviation for the componentsof ÑïÓ ,Î with é ê Õ~ð¾Ý Þ the4 numberof componentsofÑïÓ ;ñ áÏ^òã Õ äåJó åJóÚRæ ä í î Ú Í ,Î the average standard deviation for the componentsof ô\õ ,Î withé ò Õ¬�aß the4 numberof slip components.

26 Chapter2
Figure2.4: Modelstandard deviationscorrespondingto a 95%confidencelevelandresolutionofö solution I. The modelstandard deviations are expressedas percentage of the componentma� gnitude.
contrib� uting to eachnode;nodeswith lesshits than :2÷Aø of� themaximumhitcountweresubjected� to anincreasedregularization( f @ ³ )6 with respectto theothernodes( f @§ù ).6 IninversionI I am concernedwith solving for (average)crustalblock rotations(asym-metric� part of
X F )6
andfault motion. To this purposeI suppressthe symmetricpartof� thevelocity gradienttensor(strainrate)by fHú � . Table2.1 shows theregularizationparameters usedto obtainmy modelsolutions.
The normalizeddatamisfit valuesû � per degreeof freedom(Bos et al., 2003a)pro vide a measureof how well themodelscanfit thedata(table2.1). Basedon a :2;data
errorsolutionIII providesthebestdatafit, however, noneof thesolutionscanfitall� local variationsin the velocity datawithin the :2; data
standarddeviation. On a

2.5Inversion 27
Figure2.5: Modelstandard deviationsandresolutionof solutionII.
28 Chapter2
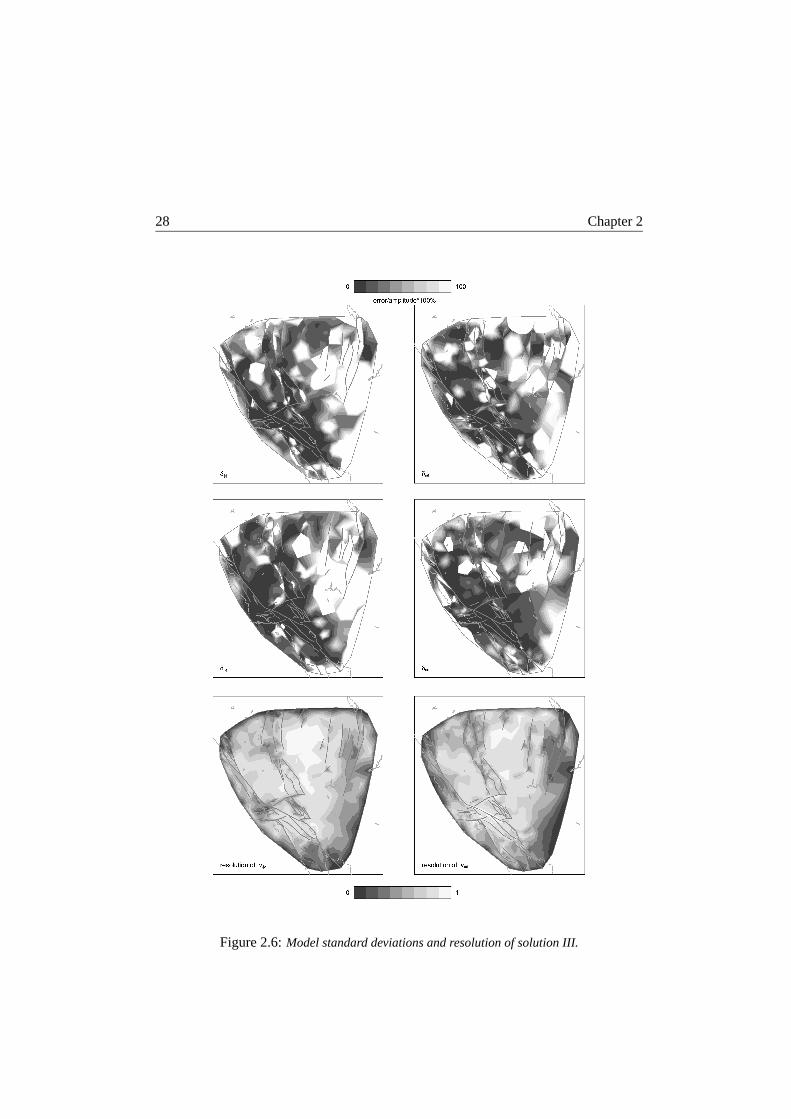
Figure2.6: Modelstandard deviationsandresolutionof solutionIII.

2.6Descriptionof thethreesolutions 29
ü !aýconfidence� level solutionsII andIII do fit thedatawithin thestandarddeviations
(� û � þÿþ I # 1 ø ( and� û � þÿþpþ I # 1���� )6 in contrastto solutionI (û � þ I , 1 , ø ).6
In�
solutionI, theadditionalconstraintsimposedon thestrainratereducetheX > lml
and� X > o©o components� of thesolutionto two ordersof magnitudesmallerthantheX > lmo
and� X >aopl components.� Theselattercomponentsareof thesamemagnitude,howeverofopposite� sign.Figure2.4shows the
) ; modelstandarddeviation (, 1 & !���� � @C@ )6 plotted
as� apercentageof thesolutionvalueandthediagonalelementsof theresolutionmatrixfor�
the latter two components.Standarddeviationsexceeding100%of the solutionv< aluehavenotbeencontoured.Theseoccurmostlyin regionswith smallamplitudesofthe�
velocity gradientcomponents.The resolutionof theX > lmo and� X > opl components�
has�
beenreducedby the additionalconstraints.However, interpretationof the modelis still warranted.Both componentshave significantvelocity gradientvalues.The
) ;errors� on thefaultmotionsof solutionI donotexceed
# 1 ü� � j � N .Figure�
2.5 and2.6 show the) ; model� standarddeviationsandthe diagonalele-
ments� of theresolutionmatrix ( � @C@ )6 of theX > l�l and� X > opo components� of thevelocity
gradient� tensorof solutionsII andIII, respectively. The � @C@ v< aluesforX >almo and� X >aopl
are� comparableto the valuesofX > lml and� X > opo , respectively. Sincepart of the data
signal� in solutionIII is explainedby motionon faults,largerareasnow rendervelocitygradient� valuesnot significantlydifferentfrom 0 in eitheror bothdirections.As in so-lution I, the
) ; errors� on thefault motionsof solutionIII do not exceed# 1 ü� �� j � N .
Generally*
, I observe a strongreductionin resolutionalongthe modelboundary, con-sistent� with the increaseddampingof the model on the boundary. I also observe areductionz of resolutionaroundsomeof thefaultsin solutionIII, indicatinga trade-offbetween�
thefaultmotioncomponentsandthevelocitygradientcomponentsdueto lackof� GPSdatacloseto faults(SpakmanandNyst,2002).
2.6 Description of the thr eesolutions
2.6.1�
Fault motion
In bothsolutionI andIII fault motionproveswell resolvable(figure2.7 and2.8). Al-though�
magnitudesmight differ, the senseof relative motion in both modelscorre-spond� very well. The Californianshearzoneis dominatedby dextral motion. In theTransverseRangessignificantthrustingis observed. In solutionI this thrustingis ac-companied� by sinistralslip (
) - ümm/yr),whereassolutionIII resolvesdextral slip on
the�
SantaYnez fault ( : mm/yr),� Big Pine fault (
�# 1 & mm/yr)� andPinto Mountainf�ault (
,mm/yr).� Both solutionsobtaina combinationof normalfaultinganddextral
slip� in the easternCalifornianshearzone(ECSZ),Walker LaneBelt andthe centralNe�
vadaseismiczone(CNSZ).Sinistral thrustmotion ( ,� �� j � N )6 is obtainedon
the�
Wasatchfault zone.I have comparedtheobtainedslip ratesof bothsolutionI andIII to geologicalslip

30�
Chapter2
Figure�
2.7: F ault motioncontributionof solutionI. A) Lateral componentof thefault motions;
B) perpendicularcomponentof the fault motions. Pleasenotethe different scalesof the slipvector� s.

2.6Descriptionof thethreesolutions 31
Figure�
2.8: F ault motioncontribution of solutionIII. A) Lateral componentof the fault mo-
tions;4 B) perpendicularcomponentof thefault motions.Pleasenotethedifferentscalesof theslipà vectors.

32�
Chapter2
Figure�
2.9: Str�
ain ratecontributionof solutionI. Thearrowsdenotetheprincipal strain rates:contr¡ action(black) andextension(white).For color versionof this figureC.2 in appendixC.1.
rates,aswell ascreepmeasurements(appendixA.1). I find that the senseof motionon� faultsin bothsolutionsis generallyin agreementwith thegeologicalobservations.Trade-offs betweenestimatesof thevelocity gradientandfault slip ratein someareasrequireacarefulinterpretationof themagnitudesof theslip ratesolutions.However, inrez gionswith densestationcoveragein thevicinity of the faultsI do modelsignificantaseismic� surfacecreep.
2.6.2�
Strain rate
Although�
stronglysuppressedin amplitude,thestrainratefield of solutionI exhibits aclear� pattern(figure2.9). I observe N-S contractionin theGreatValley, centralBasinand� Rangeandeastof theMojave Desert.Almost E-W extensionis foundaroundtheBig�
Bendin theSanAndreasfault,betweenthePintoMountainandSanAndreasfaultsand� betweentheSanAndreas,SanJacintoandElsinorefaults.

2.6Descriptionof thethreesolutions 33
Figure�
2.10: Str�
ain rate contribution of solution II. For color version of this figure C.3 inappendixÌ C.1.
Both solutionsII and III show a clearCalifornianshearsystem(figure 2.10 and2.11;/
note the differencein amplitudewith solution I). In the shearzone,variationsin contractionalandextensionalpatternsin the effective strainratedo not indicateachange� in dominantregime, but a small dominanceof eitherprincipal strainrate. Insolution� III themagnitudeof thestrainrateswithin theCaliforniashearzonehasbeenreducedz dueto thepresenceof fault motion. Theprincipalaxesshow a rotationalongwith� the changeof orientationof the SanAndreasfault in the Big Bendof the fault.In the ECSZthe dextral normalmotion on the faultssignificantlyreducesthe exten-sion� observed in solutionII andchangesthe orientationslightly from WNW-ESEtopure E-W. Both solutionsshow a distinct asymmetryof the deformationat the SanAndreasfault in centralCalifornia,betweentheBig BendsectionandSanFrancisco.Thedeformationtendsto concentrateon theeasternsideof theSanAndreasfault, inthe�
GreatValley (figure 2.9 and2.10). The deformationbecomesmuchmorediffuseand� spatiallydistributedacrosstheTransverseRanges.In southernCaliforniait mainly

34�
Chapter2
Figure�
2.11: Str�
ain rate contribution of solution III. For color version of this figure C.4 inappendixÌ C.1.
localizesbetweenthe SanJacintoand SanAndreasfaults, especiallyin solution III(figure�
2.10). Many regional aspectsof the deformationof solutionII comparewellwith� thoseobtainedin earlierstudiesbasedon geodeticdataandignoringactive faultmotion(appendixA.2). It is difficult to indicatetheextent to which thediscrepanciesresultz from differencesin methodologybetweenthe variousapproachesanddifferentdata
setsused.I notehowever thatsignificantdifferencesbetweentheseearlierstudiesand� solutionIII exist andareadirectresultof theimplementationof faultmotionin mymethodology. Further, I deducethatpostseismicrelaxationof theLandersearthquakeaf� fectsmy surfacedeformationfield (appendixA.3), while thepostseismicrelaxationrelatedz to theNorthridgeandLomaPrietaearthquakeshave no influenceon my solu-tions.�
However, postseismicrelaxationof severalotherearthquakesmaypossiblyaffectmy solutionsin theECSZ,thewesternTransverseRanges,alongtheParkfieldsegmentof� theSanAndreasfault andat SaltonThrough.I ampresentlyunable(dueto lack ofdata)
to quantifytheextentof their influenceonmy surfacedeformationsolutions.

2.6Descriptionof thethreesolutions 35
Strain7
ratesin theBasinandRangearealmostanorderof magnitudesmallerthanthose�
observed in the shearzone. The deformationin the BasinandRangeprovinceappears� to be dominatedby north-southvariationsin the principal axesorientations.East�
of theWasatchfault zonesignificantE-W extensionis obtainedin bothsolutions,whereas� the westernBasinandRangeshows extensiondominatedright-lateralshear.Although the spatialdistribution of deformationin the BasinandRangeremainsde-bated,�
generalconsensusexists on the fact that it is dominatedby NW-SE extension(Bennett�
et al., 1999,2002;Fleschet al., 2000;King et al., 1994;Lachenbruchet al.,1994;Thatcheret al., 1999). I found that a sinusoidalpatternin the NS-componentof� the campaigndatasetof Thatcheret al. (1999)dominatesthe deformationpatternsobtained� in theBasinandRangeprovince(appendixA.4). This datasetis alsorespon-sible� for thelargeextensioneastof theWasatchfault zoneobservedin my model(seeappendix� A.4). Therefore,I will refrain from further discussionof the surfacedefor-mation� modelwithin theBasinandRangeprovince.
2.6.3�
Rotation rate
Both�
solutionsII andIII show strongclockwiserotationsalongtheSanAndreasfault,Moja�
veDesert,ECSZ,CNSZandWalkerLaneBelt, consistentwith dextral shear(fig-ure� 2.12B,C). I noticeanasymmetryof the rotationswith respectto the faultsalongthe�
ParkfieldandCarrizosegmentsof theSanAndreasfault. SolutionIII shows minorcounter� -clockwiserotationof : - , % y � j � N in
�thesouthernMojaveDesert.Generally,
solution� I (figure2.12A)shows no strongshearrelatedrotationsindicatingthat in thissolution� shearis accommodatedby fault motionbetweennear-rigid blocks.HereI ob-serv� eclockwiserotationsin thesouthernGreatValley, westernTransverseRangesandbetween�
thePintoMountainandSanAndreasfaults. Counter-clockwiserotationsarefoundin theMojave Desert.Thoughsignificantlocal rotationsof theGreatBasinandSierra7
Nevadaareobtainedin all solutions,I obtainnoclearuniformcounter-clockwiserotationz consistentwith the
# 1 , ø % y � j � N and� # 1 : ) % y � j � N suggested� by Dixon et al.(2000a)�
andHardingHearnandHumphreys (1998). However, especiallysolution I(limited�
to fault motion andblock rotation)doesagreewith their conclusionthat theblock�
is translatingto thenorthwest.
2.6.4 Asymmetry of the surfacedeformation field
Though8
in centralCalifornia,north of the Big Bend,deformationconcentratesat theSan7
Andreasfault,bothsolutionsII andIII show adistinctasymmetryof thestrainandrotationratesacrossthe fault (figure 2.10,2.11and2.12). The deformationlocalizeson� theeasternsideof the fault. Figure2.1 shows anupdatedversionof the relocatedseismicity� dataof Engdahletal. (1998)in thesouthwesternUS.Mostof theseismicityoccurs� at or closeto the major faults. However, thereis significantseismicityeast

36�
Chapter2
Figure�
2.12:Rotation�
ratecontributionof A) solutionI, B) solutionII andC) solutionIII. Notethe4 locationof the0 in thecontourscale. For color versionof this figureC.5 in appendixC.1.
2.6Descriptionof thethreesolutions 37
of� the SanAndreasfault in the GreatValley, which correlateswith high strain ratesin my deformationfield. Theseismicityeastof theCalaverasfault may be relatedtothe�
presenceof blind thrustfaults(UnruhandLettis, 1998,USGSfault dataset;),butnone� areknown eastof theSanAndreasfault betweentheCalaverasjunctionandtheTransverseRanges.
Pre�
vious surfacedeformationstudieshave not obtainedthis asymmetrypossiblydue
to coarser/smoothermodelparameterization(Shen-Tu etal., 1998;Ward,1998)orthe�
asymmetrywasnot addressed(Jacksonet al., 1997;Shen-Tu et al., 1999). Whenstudying� displacementdatacausedby the1906SanFranciscoevent,Chinnery(1970)found an asymmetryin the dataacrossthe SanAndreasfault in the vicinity of FortRoss.Huggettet al. (1977)performedstrainmetermeasurementsnearHollister. Theyobserv� ed large strainsoccurringaway from andonly on onesideof the SanAndreasand� Calaverasfaultsandpostulatedthat this may have beencausedby movementofone� sideof thefault.
Malservisi�
et al. (2001) relatedan asymmetricsurfacedeformationfield in theECSZto a viscositycontrast.Theviscositycontrastrelatesto differencesin heatflow,where� strain localizesin high heatflow regions. However, this can not explain theasymmetry� acrosstheSanAndreasfault sinceno heatflow contrastis observedacrossthe�
fault (figure1of Sasset al. (1994)). MahrerandNur (1979)andRybicki (1978)determined
displacementfieldsfor static2D modelsof a longstrike-slipfault in acrustof� laterally varying rigidity. They observe a significantreductionof displacementonthe�
high rigidity sideof the fault, aswell asa shift of thepeakdisplacementtowardsthe�
fault traceonbothsides.Suchadistinctrigidity contrastwouldalsohaveimportantimplicationsfor thecrustalvelocity structureacrossthefault.
HealyandPeake (1975)determinedseismicvelocity changesat BearValley. Theyobserv� edvelocity variationsextendinga numberof km away from the fault traceandasymmetric� acrossthefault. Thesamenon-symmetrywasobtainedby BooreandHill(1973).�
Basedon this contrastthey deducedthat the rigidity eastof theSanAndreasfault is smallerthanwestof thefaultby afactorof
: 1 ( . AcrosstheParkfieldsegmentof� theSanAndreasfault,Eberhart-PhillipsandMichael(1993)obtaineda5-20%lateralchange� in velocityover4 km width. By combiningthevelocitymodelwith aresistivitymodel,they wereableto deducecorrespondingrock units. Thehigh velocitiesto thesouthwest� of the fault areinferredashigh-resistive basementof Saliniangranite.Thelar
gevolumeof low-velocity, low-resistivity materialnortheastof theSanAndreasfaultis�
inferredto beoverpressuredFranciscanof GreatValley sequencematerial.Assumingthat�
thestresslevel at bothsidesof thefault is comparable,I deducea rigidity contrastacross� thefault of
: 1 ( ø , consistentwith BooreandHill (1973).Since7
thesamevelocity contrastacrossthe fault is still prominentat BearValley,this�
crustalstructuremay extent all along the SanAndreasfault from the Big Bendto�
theCalaverasjunction, thusproviding a feasibleexplanationfor the localizationofdeformation
eastof the fault. The notedlocalizationof deformationis importantfor

38�
Chapter2
seismic� hazardanalysis,aswell asfor theinterpretationof tectonics.
2.6.5 Comparison to paleomagneticobservations
The8
rotationratesof solutionsI, II andIII (Figure2.12A,B, C) arerepresentative forthe�
periodof observation(approximately20years)andapplyto rigid rotationsof smallequidimensional� blocks.In contrast,paleomagneticdataarerepresentative for thepastmillions� of yearsandmayrepresentrotationsof considerablecrustalblocks(McKenzieand� Jackson,1983).SinceI amunableto solve for a netuniform rotationof theentirestudy� area,the comparisonwith paleomagneticobservations is not straightforward.However, to determinetheextentto which thepresent-daypatternmayreflectthepastmillion� yearsandthe larger-scalecrustalblock rotationsI do comparethe resultsofsolutions� II andIII to paleomagneticrotations.
Basedon paleomagneticobservationsLuyendyket al. (1980)determineda geo-metricmodelfor theNeogenecrustalrotationsin southernCalifornia. In thewesternT8
ransverseRangestheir modelconsistsof many crustalblockspresentlyboundedonthe�
north and southby E-W-trendingsinistral faults, which have beensubjectedtoclockwise� rotationsof 70% to
�80% within� thePacific-Americandextral shearzone.The
eastern� TransverseRanges,centralMojave DesertandTehachapiMountainshave alsobeen�
rotatedclockwise. The rotatedblocks are nestedbetweenblocks boundedbyNW�
-SE-trendingdextral faults. Carteret al. (1987)refinedthis model in the easternTransverseRangesandMojave Desert.They includeda counter-clockwiserotationinthe�
southernMojave Desertto accommodatethe41% clockwise� rotationthey obtainedin�
theeasternTransverseRangessincethelateMiocene.The8
rotationratefield of solutionII shows orientationsconsistentwith Luyendyket� al. (1980).SolutionIII shows southernCaliforniarotatingin a mannerof which theorientations� areconsistentwith Carteretal. (1987),indicatingtheinfluenceof thedex-tral�
fault motionsmodeledon the Mojave Desertfaults. This resultsuggeststhat therotationz ratesmodeledmightrepresentlonger-term,larger-scalecrustalblockrotations.However, Luyendyket al. (1980)proposedthat therotationof theTransverseRangesmay� have ceasedwhentheSanAndreasfault broke throughsouthernCaliforniain thelate
Miocene,whereasCarteret al. (1987)foundsignificantclockwiserotationsin theeastern� TransverseRangessincethe lateMiocene.Therefore,I proposethatsincethelate Miocenea major part of the Pacific-Americandextral shearhasbeenaccommo-dated
by the SanAndreasfault, whereasthe remainderof the shearinducesongoingrotationsz in southernCaliforniaconsistentwith themodelof Carteretal. (1987).
2.7�
Implications for seismichazard
Ev�
en thoughaseismicsurfacecreepis presentin the deformationzone(solution III,Langbein,2002;Lienkaemperet al., 1991;Rosenet al., 1998),it is reasonableto as-

2.7Implicationsfor seismichazard 39
sume� thatwithin theseismogeniclayerthefaultsareprimarily locked.Therefore,I uti-lize solutionII to determineearthquake momentrateswithin my modelarea.Kostrov(1974)�
codifiedtherelationshipbetweenthestrainratetensor �� and� earthquake activ-ity�
. In addressingearthquake momentratesI adoptthe scalarversionof this formulaaccording� to Ward(1998):
�y I ,��! #"%$ú ��$&�'�(
(2.3)�
�y representsthe meanearthquake momentratefor the region A. I determine �y foreach� triangle of my parameterization,whereA is the areaof the triangle, �� $&�')( the
�maximumstrainrateat thecenterof thetriangleand
� I )¥1 # : # N � Nm� � �
, therigidityof� the elasticlayer.
" $ú in�
equation2.3 is the averagethicknessover which elasticstrains� accumulateanddissipatein earthquakes.
" $ú is�
neitherthe crustalthicknessnor themaximumdepthof earthquakes.Thesedepthsexceed
" $ú because�
thetop fewkilometersof the crustareaseismicand the propertiesof the deepestquakesdo notreflectz the seismogeniclayer asa whole. Ward (1998)determinedaveragevaluesof" $ú I�: , 1 ( km
�for southernCalifornia,
" $ú I�:a: 1 , km
�for northernCalifornia and" $
ú I�:$& 1 ( km for theBasin& Range.I haveadoptedthesevaluesin my analysis.W'
ard(1998)derivedaveragestrainandmeanmomentratesfor southernCalifornia,northern� CaliforniaandtheBasin& Rangeprovince. For comparison,I have assignedeach� triangleto eitherof thethreeareasbasedontheirgeographicallocationanddeter-minedthecorrespondingaveragestrainandmomentratefor each.I notethatmy modelarea� is not completelycomparablewith theareasadoptedby Ward(1998).My south-ern� California domainexceedsWard (1998)’s estimatedue to the inclusionof Baja,Mexico, while Ward(1998)’s northernCaliforniadomainextendsfurthernorthof mymodelingarea. Therefore,the significantlydifferentaveragestrain ratesobtainedinCalifornia*
in solutionII result in comparablemeanmomentrates(table2.2). Hence,the�
strainratesin Baja,Mexico containedin solutionII have loweredmy estimateforthe�
averagestrainrate,while the increasein surfaceareadueto this region inducesasimilar� estimateof themeanmomentrate.Thelowerstrainratesin northernCalifornianorth� of my modelingareahaveasimilar impactontheestimateof Ward(1998)in thisrez gion. In theBasinandRangethetwo solutionsdiffer significantlyfor bothstrainrateand� meanmomentrate.
areaÁÃÂ,+.-0/ º 1243½ ù65 ÁÃÂÅÄaÈ87 ¼ ÄÅÉ 19 Á\ÂÅÉ Ç8:;/�7 ¼ ÄÅÉ
W<
ard Sol. II Ward Sol. II seis.= geod.> Sol. II deficitS.C. 15.7 21.3 11.8? 1.6 10.6? 0.23 1.06 1.42? 0.20 1.35? 0.09 0.29N.C. 24.0 15.2 5.59? 0.25 7.44? 0.21 0.66 0.91? 0.04 0.83? 0.07 0.17B&R 77.5 52.8 2.11? 0.14 2.31? 0.21 0.55 1.23? 0.09 0.90? 0.13 0.35> geodeticmeanmomentratederivedby Ward [1998]= meanmomentratestakenfrom Ward [1998]
Table2.2: Meanstrain andmomentratesof Ward [1998] anddeterminedfor solutionII.

40 Chapter2
Themomentdeficitratebetweenthegeodeticmomentrateandtheseismicmomentrateaddressesthe(in)completenessof theearthquake catalogue(Ward,1998)(e.g.theabsence� of large, rarely occuringevents,aswell aseventswith magnitudeslessthan
5).@
Thedeficitsin thethreegeneralregionsbetweenthemomentratesof solutionIIand� theseismicmomentratesuggeststhatthecataloguesimply fails to reflectthelong-term�
situation. Within the 150 yeartime spanof the catalogthe momentdeficit ratein�
southernCalifornia is comparableto a yBA�I (21 (earthquak� e, wherethe moment
deficit
rateof northernCaliforniaamountsto a y A I (21��e� vent.
Shen-T7
u et al. (1999)determinedstrainratesandminimum momentratesfor thewestern� United Statesfrom geodetic,geologicandseismicdata. I find a reasonablecomparison� of my solution II strain ratesand their geodeticstrain rates(table 2.3).However, their regionsalongthe Californiancoast(regionsA, B andC of Shen-Tuet� al., 1999)extent furtherwestward thanmy modelboundary. The lower strainratesthe�
y modelin theareawestof my modelboundarydecreasetheir estimatesof theav-erage� strainrateandthecombinedeffect resultsin thesignificantdifferencesobservedfor themomentrates.In theMojave Desert(region J of Shen-Tu et al., 1999)I find asignificantly� larger averagestrainrate. This could be causedby my increasedstation
Shen-Tu etal [1998] SolutionII
area min. mom.rate= Strainrate> area19DC
StrainÁÃÂ,+seis. geol. geod. seis. geol. geod.
ÁÃÂ,+rate>-0/ º -0/ º
A 5.11 2.21 10.15 11.70 0.48 2.21 2.54 1.16 2.39 2.29B 2.96 1.63 16.77 19.55 0.61 6.29 7.34 2.30 19.16 9.25C 6.36 0.18 5.54 13.90 0.03 0.97 2.43 3.21 8.85 3.06D 3.74 34.39 51.00 42.94 10.18 15.14 12.75 3.39 42.32 13.85E 1.28 2.09 21.06 19.13 1.81 18.24 16.57 1.49 16.67 12.45F 1.27 18.69 19.55 13.41 16.32 17.07 11.71 1.33 15.56 13.00G 1.32 36.16 29.16 17.06 30.34 24.46 14.31 1.43 17.95 13.99H 4.11 7.64 41.61 47.49 2.07 11.25 12.84 4.86 63.67 14.56I 30.0 53.45 7.77 60.77 1.98 0.29 2.25 27.4 102.34 4.16J 5.53 9.03 7.27 23.05 1.81 1.46 4.63 6.63 46.12 7.73K 33.7 0.97 2.09 29.50 0.03 0.07 0.97 28.5 36.21 1.41
= Minimum momentrate(19FEHGJILK!MON 1¯ N�P 1Q º É P 1Q ºº0R ; Á\ÂÅÉ È8:;/�7 ¼ ÄÅÉ ) asdeterminedby
Shen-Tu etal [1998]with shearmodulusISEUTWV Â ÁÃÂÅÉ ÊX:;/�7 ¼ ÄÅÉ andV is thevolume,
which is theproductof theareaof theregionandtheseismogenicthickness(H 3 ¸ E Á�YZ-0/ )
> StrainrateÁÃÂÅÄaÈ87 ¼ ÄÅÉ ; 12O3½ ù65 EHN 1¯ N�P 1Q º É P 1Q ºº
C 19(ÁÃÂÅÉkÈ[:;/�7 ¼ ÄÅÉ ) is calculatedusing(3) in thetext, with anassumedseismogenic
thicknessof 15km
T8able2.3: Mean
\strain andmomentratesof Shen-Tu et al [1999] andthosedeterminedfrom
solutionà II.

2.7Implicationsfor seismichazard 41
Figure�
2.13: Moment\
magnitudescorrespondingto themomentdeficitsaccommodatedin mymodel� area during my observationperiod. The negativemomentmagnitudescorrespondtone] gativemomentdeficits,indicatingthat largeearthquakeswithin theobservationperiodhavereleasedmore seismicmomentthan hasbeenaccumulatedby my strain rate field. For colorver� sionof this figureC.6 in appendixC.1.
density
in thisarea,enablingmeto localizedeformation.
Clearly*
themeanmomentratesstronglydependon the ratio betweentheaveragemaximum� strain ratesandthe sizeof the areautilized, e.g. a larger areawith smalla� veragemaximumstrainratesamountsto ameanmomentratecomparableto themeanmomentrateof asmallareawith largeaveragemaximumstrainrates.
Based�
on theUSGSseismicitydatabaseandtheHarvardCMT CatalogueI deter-minetheseismicmomentratefor thetimespancontainedin my GPSdata(1973-2000).For theeventsobtainedfrom theUSGSdatabaseI usethe y � - y P relationof Thatcherand� Hanks(1973)for southernCalifornia ( ^`_�aHy � I�: 1 ! y P c : �21 # )
6to determinethe
seismic� moment.To avoid theinfluenceof thevaryingtrianglesizeswithin my model

42 Chapter2
parameterization I constructa grid of squarecellsof# 1 , ! % { # 1 , ! % within� my model
area.� For eachgrid cell theaveragemaximumstrainrateis derivedfrom themaximumstrain� ratesat the cornersof the cell andthe meanmomentrate is determinedusingequation� 2.3. I multiply my modelderived momentrateswith the time spanof mydata,
obtainingthe total accumulatedmomentof eachgrid cell. Basedon their loca-tion�
I assigneachseismicevent to a grid cell andapplymomentsummationto obtainthe�
total seismicmomentwithin my time spanfor eachcell. The deficit betweentheseismic� momentandthetotalgeodeticmomentgivesanestimateof theexcessmomentaccommodated� in my modelareaduring the observation periodof 27 yearsandwillallo� w identificationof regionswith possiblyincreasedseismichazard.
The momentmagnitude( ybA )6
of an earthquake is relatedto the seismicmoment(� y � )6 by (Kanamori,1977):
yBA¬I ^`_)aHy �: 1 ! - : # 1 ($) (2.4)
�
By replacingy � in equation2.4by themomentdeficit ( y )6
I determinetheearthquakemagnitudecorrespondingto eachmomentdeficit (figure2.13).Fromfigure2.13I cansee� largerearthquakesdiminishingthemomentdeficit. The largeeventsin theregion(e.g.�
Landers,HectorMine, NorthridgeandLomaPrieta)have releasedmoreseismicmomentthanwasaccumulatedgeodeticallyin this time period(negative magnitudes).Ofc
courselargeearthquakesreleaseseismicenergy andmomentacrosslargerareasthanjustd
their epicenter. This moreregional influenceof the large eventsis not explicitlyincorporated�
in my analysis,however, is takeninto accountin theinterpretationof fig-ure� 2.13.In thewesternTransverseRanges,theNorthridgeearthquakeandaftershockshave releasedmost of the momentbuild up by the strain ratesof my model withinthe�
time period,thusreducingtheseismichazardin this area.Thesameholdsfor theMojave Desert,wheretheLanders,Big BearandHectorMine earthquakesreleasedasignificant� amountof the accumulatedmoment. However, all alongthe SanAndreasf�ault I find momentdeficitscorrespondingto yBAfe ! 1 ü
. Significantmomentdeficit,corresponding� to yBAI �a1 : - �21 )
, hasaccumulatedeastof theParkfieldandCarrizose� gmentsof the SanAndreasfault. A comparablemomentdeficit is also observedin the Bay areaof SanFrancisco,along the SanAndreasfault just north of the BigBend�
andaroundthe ImperialandsouthernSanAndreasfaults. On theHaywardandsouthern� Calaverasfaultsthesehighmomentdeficitscoincidewith regionsof increasedmicro-seismicity. This phenomenawasalsoobservedprior to otherevents(e.g. the17August,1999,Izmit, Turkey earthquake;Nalbantetal., 1998;Parsonsetal., 2000)andmay� point at an increasedrisk of an earthquake to occur in theseregionsin the nearfuture.
2.8Crustaldeformationof theSWUSDZ 43
2.8 Crustal deformation of the SWUSDZ
Kingg
et al. (1994)derived that since1850about60% of the Pacific-NorthAmericanmotion� occurredseismicallyand40%aseismically. They furthershowedthatwithin theseismogenic� depthrangeof the plateboundaryaseismicdeformationis concentratednear� thesurfaceandatdepth.In somecasesthisdeformationcanbelocatedoncreepingf�aults,but elsewhereit is spreadover a several kilometerwide zoneadjacentto the
fault. I infer that this kind of surfacedeformationfield is clearlymodeledin solutionIII. Basedon solutionIII I derive a modelof thekinematicsof thepresent-daysurfacedeformation
of the SWUSDZ.Figure 2.14 summarizesthe main featuresfor strain,rotationz andslip ratesof my model.
W'
ithin the shearzoneof California I canidentify many faultscontainingdextralmotion andsignificantCW rotations. More in-depth,I candistinguishseveral faultzonesh boundingrotatingblocks. AroundtheSanFranciscoBay I obtaindextral creepon� the SanAndreas,Hayward andCalaverasfault system. The southernpart of thissystem� is associatedwith CW rotationsandshearstrainratesin asettingdominatedbycontraction.� To theeastof theSanAndreas-Calaverasfault junctionthemodeldepictssignificant� shearstrainratesalsoin asettingdominatedby contractionpossiblyrelatedto�
hiddenthrustsin the area. The eastward extent of theseshearstrain ratepatternsis poorly constrainedby the lack of datawithin theSierraNevada.TheParkfieldseg-ment� of the SAF is dominatedby asymmetricshearstrainsin a extensiondominatedsetting,� southwarddiminishingdextral creepandasymmetricCW rotations.Betweenthe�
SanAndreas-Calaverasfault junctionandtheBig Bendsectionof theSanAndreasfault, deformationlocalizeson theeasternsideof theSanAndreasfault which I haveattrib� utedto asignificantrigidity contrastacrossthefault. TheBig Bendsectionmarksthe�
transitionfrom N-S contractionin thewesternTransverseRangesto dextral shearin the Mojave Desert.The TransverseRangesareassociatedwith sinistralcreepandsignificant� CW rotations.ThesouthernMojave DesertexperiencesCCW rotationstoaccommodate� theCW rotationsin theeasternTransverseRanges.Therotatingblocksin the easternTransverseRangesand Mojave Desertare boundedby dextral faults.The ECSZ,Walker LaneBelt andCNSZ show a continuousshearzoneof dextrallycreeping� faultsseparatedby CW rotatingblocks.In contrastto theMojave Desert,thef�aultsboundingtheSierraNevadaobtainasignificantnormalcomponentof faultcreep
accommodating� theextensionof theBasinandRange.TheWhite Mountainsseismicgap� betweentheECSZandtheCNSZis dominatedby shear, thustransferringthede-formation�
from theECSZto theCNSZ.ThewesternGreatBasinundergoessignificantWNW'
-ESEextension.TheSanAndreasandSanJacintofaultsarelinkedasa singlede
xtral fault system.Betweenthe two dextral faultssignificantCW rotationanddex-tral�
shearoccursconsistentwith deformationin a dextral fault zone. The southwarde� xtensionof theSanAndreasfault, theImperialValley fault andtheCerroPrietofaultalso� show significantdextral creep.

44 Chapter2
Figure2.14:Modelof thekinematicsof thepresent-daysurfacedeformationof theSWUSDZ.With extensionalshearI indicateshearstrainsin which themagnitudeof theextensionalprin-cipal¡ axesexceedsthecontractionalprincipal axes.With contractionalshearI indicateshearstrà ainsfor which themagnitudeof thecontractionalaxesexceedstheextensionalaxes.

2.9Conclusions 45
2.9 Conclusions
I�
have estimatedthe surfacedeformationfield of the southwesternUS deformationzoneh in termsof I) block rotationandfault motion,II) thevelocity gradientfield, andIII) the velocity gradientfield andfault motion simultaneously. SolutionIII providesthe�
bestfit to thegeodeticdata. Themodelshows aseismicfault motionwhich senseof� motionis generallyin agreementwith geologicalobservations.In denselysampledareas,� the fault motion is consistentwith aseismiccreepmeasurements.However, tosome� extent(dependingon GPSobservationscloseto thefaults)thetrade-off betweenfault motion andthevelocity gradientfield exists throughoutmy model. Thesurfacedeformation
field showsdistributeddeformationin azonearoundthefaultswith signif-icant�
shearstrainratesandrotations,thoughsignificantdistributeddeformationawayfrom the faults is alsoobserved. The easternCalifornia shearzoneactsasa distinctf�ault zone,boundedby morerigid blocks. The faultswithin the zonetake up a sig-
nificant� part of the shearmotion, while shearstrainratesandclockwiserotationsarelocatedbetweentheboundingfaults.Similarly, theSanJacintoandSanAndreasfaultsact� asboundingfaultsof a fault zonewith significantshearstrainratesandclockwiserotations.z TheMojave Desertis dominatedby right-lateralshear, whereasthewesternT8
ransverseRangesshow significantcontraction.Thesenseof rotationin theseregionsis consistentwith modelsbasedon paleomagneticobservations. I deducethat sincethe�
LateMiocenea significantpartof theshearmotionbetweenthePacificandNorth-American�
plateis accommodatedby theSanAndreasfault,while theremnantmotioninduces�
clockwiserotationsin the TransverseRangesandcounter-clockwiserotationin thesouthernMojave Desert.Significantlocalizationof deformationeastof theSanAndreas�
fault is observedbetweentheBig BendsectionandtheSanAndreas-Calaverasf�ault junction. This is an immediateresultof a significantrigidity contrastacrossthe
fault associatedwith a morerigid Saliniangranitebasementwestof thefault andless-rigid Franciscanor GreatValley sequencematerialeastof the fault. This localizationof� deformationhasimportantimplicationsfor seismichazard.In this areamy seismichazard�
analysisshows a momentdeficit accumulatedbetween1973and2000corre-sponding� to a yBA�I �21 : - �21 )
earthquak� e. NearSanFranciscoBay, alongthe SanAndreasfault just north of the Big Bendandaroundthe Imperial andsouthernSanAndreas�
faultsa comparabledeficit hasaccumulated.On the Hayward andsouthernCala*
verasfaults the momentdeficitscoincidewith significantmicroseismicity. Thismay point at an increasedrisk of an earthquake to occur in theseregionsin the nearfuture.�

46 Chapter2