mechanical behavior stress versus strain elastic deformation plastic deformation hardness creep and...
TRANSCRIPT

Mechanical Behavior • Stress versus Strain• Elastic Deformation• Plastic Deformation• Hardness• Creep and Stress Relaxation• Viscoelastic Deformation

Stress versus Strain• Mechanical Properties
– Deal directly with behavior of materials under applied forces. – Properties are described by applied stress and resulting strain, or applied strain
and resulting stress.• Example: 100 lb force applies to end of a rod results in a stress applied to the end of the
rod causing it to stretch or elongate, which is measured as strain.
– Strength: ability of material to resist application of load without rupture. • Ultimate strength- maximum force per cross section area.• Yield strength- force at yield point per cross section area.• Other strengths include rupture strength, proportional strength, etc.
– Stiffness: resistance of material to deform under load while in elastic state.• Stiffness is usually measured by the Modulus of Elasticity (Stress/strain)• Steel is stiff (tough to bend). Some beds are stiff, some are soft (compliant)

Testing Procedures
• Mechanical Testing– Properties that deal with elastic or inelastic behavior of a material under load
– Primary measurements involved are load applied and effects of load application
– Two classification of tests; method of loading and the condition of the specimen during the test
• Primary types of tests– Tensile
– Compression
– Shear
– Torsion
– Flexure

Mechanical Test Considerations• Principle factors are in three main areas
– manner in which the load is applied– condition of material specimen at time of test– surrounding conditions (environment) during testing
• Tests classification- load application– kind of stress induced. Single load or Multiple loads– rate at which stress is developed: static versus dynamic– number of cycles of load application: single versus fatigue
• Primary types of loading
tension compressionshear
torsion
flexure

Standardized Testing Conditions
• Moisture– 100F, 100% R.H.
– 1 Day, 7 Days, 14 Days
• Temperature – Room Temperature: Most common
– Elevated Temperature: Rocket engines
– Low Temperature: Automotive impact
• Salt spray for corrosion– Rocker Arms on cars subject to immersion in NaCl solution for 1
Day and 7 Days at Room Temperature and 140 F.
• Acid or Caustic environments– Tensile tests on samples after immersion in acid/alkaline baths.

Stress• Stress: Intensity of the internally distributed forces or
component of forces that resist a change in the form of a body.– Tension, Compression, Shear, Torsion, Flexure
• Stress calculated by force per unit area. Applied force divided by the cross sectional area of the specimen.
• Stress units– Pascals = Pa = Newtons/m2
– Pounds per square inch = Psi Note: 1MPa = 1 x10⁶ Pa = 145 psi
• Example – Wire 12 in long is tied vertically. The wire has a diameter of 0.100
in and supports 100 lbs. What is the stress that is developed?– Stress = F/A = F/r2 = 100/(3.1415927 * 0.052 )= 12,739 psi =
87.86 MPa
A
F

Stress• Example
– Tensile Bar is 10in x 1in x 0.1in is mounted vertically in test machine. The bar supports 100 lbs. What is the stress that is developed? What is the Load?
• Stress = F/A = F/(width*thickness) = 100lbs/(1in*.1in )= 1,000 psi = 1000 psi/145psi = 6.897 Mpa
• Load = 100 lbs
– Block is 10 cm x 1 cm x 5 cm is mounted on its side in a test machine. The block is pulled with 100 N on both sides. What is the stress that is developed? What is the Load?
• Stress = F/A = F/(width*thickness) = 100N/(.01m * .10m )= 100,000 N/m2 = 100,000 Pa = 0.1 MPa= 0.1 MPa *145psi/MPa = 14.5 psi
• Load = 100 N
10cm 5cm
10in1 in
0.1 in
1 cm
100 lbs

Strain• Strain: Physical change in the dimensions of a specimen that results from applying a load to
the test specimen.• Strain calculated by the ratio of the change in length and the original length. (Deformation)
• Strain units (Dimensionless)– When units are given they usually are in/in or mm/mm. (Change in dimension divided by original
length)
• % Elongation = strain x 100%
0l
l l0
lF

Strain• Example
– Tensile Bar is 10in x 1in x 0.1in is mounted vertically in test machine. The bar supports 100 lbs. What is the strain that is developed if the bar grows to 10.2in? What is % Elongation?
• Strain = (lf - l0)/l0 = (10.2 -10)/(10) = 0.02 in/in
• Percent Elongation = 0.02 * 100 = 2%
– Block is 10 cm x 1 cm x 5 cm is mounted on its side in a test machine. The block is pulled with 1000 kN on bone side. If the material elongation at yield is 1.5%, how far will it grow at yield?
• Strain = Percent Elongation /100 = 1.5%/100 = 0.015 cm /cm
• Strain = (lf - l0)/l0 = (lf -5)/(5) = 0.015 cm/cm
• Growth = 5 * 0.015 = 0.075 cm
• Final Length = 5.075 cm
10cm 5cm
10in1 in
0.1 in
1 cm
100 lbs

Strain• Permanent set is a change in form of a specimen once the
stress ends.• Axial strain is the strain that occurs in the same direction
as the applied stress.• Lateral strain is the strain that occurs perpendicular to the
direction of the applied stress.• Poisson’s ratio is ratio of lateral strain to axial strain.
Poisson’s ratio = lateral strain axial strain
– Example• Calculate the Poisson’s ratio of a material with lateral strain of
0.002 and an axial strain of 0.006• Poisson’s ratio = 0.002/0.006 = 0.333
AxialStrain
LateralStrain
Note: For most materials, Poisson’s ratio is between 0.25 and 0.5• Metals: 0.29 (304 SS) to 0.3 (1040 steel) to 0.35 (Mg)•Ceramics and Glasses: 0.19 (TiC) to 0.26 (BeO) to 0.31 (Cordierite)•Plastics: 0.35 (Acetals) to 0.41 (Nylons)

Stress-Strain Diagrams
• Equipment– Strainometers: measures dimensional changes that occur during
testing• extensometers, deflectometers, and compressometers measure changes in
linear dimensions.
• load cells measure load
• data is recorded at several readings and the results averaged, e.g., 10 samples per second during the test.

Stress-Strain Diagrams• Stress-strain diagrams is a plot of stress with the
corresponding strain produced.• Stress is the y-axis• Strain is the x-axis
Stress
Strain
Linear(Hookean)
Non-Linear(non-Hookean)

Stiffness• Stiffness is a measure of the materials ability to resist deformation under
load as measured in stress.– Stiffness is measures as the slope of the stress-strain curve– Hookean solid: (like a spring) linear slope
• steel• aluminum• iron• copper
– All solids (Hookean and viscoelastic)• metals• plastics• composites• ceramics
kxF
E

Modulus• Modulus of Elasticity (E) or Young’s Modulus is the ratio of stress to
corresponding strain (within specified limits).– A measure of stiffness
• Stainless Steel E= 28.5 million psi (196.5 GPa)• Aluminum E= 10 million psi• Brass E= 16 million psi• Copper E= 16 million psi• Molybdenum E= 50 million psi• Nickel E= 30 million psi• Titanium E= 15.5 million psi• Tungsten E= 59 million psi• Carbon fiber E= 40 million psi• Glass E= 10.4 million psi• Composites E= 1 to 3 million psi• Plastics E= 0.2 to 0.7 million psi

Modulus Types
• Modulus: Slope of the stress-strain curve– Initial Modulus: slope of the curve drawn at the origin.
– Tangent Modulus: slope of the curve drawn at the tangent of the curve at some point.
– Secant Modulus: Ratio of stress to strain at any point on curve in a stress-strain diagram. It is the slope of a line from the origin to any point on a stress-strain curve.
Stress
Strain
Initial Modulus
Tangent Modulus
Secant Modulus

Compression Testing• Principles
– Compression results from forces that push toward each other.
– Specimens are short and large diameter.
– Circular cross section is recommended.
– Length to diameter ratio is important consideration
• Universal test machine (UTM)– Size and load of compression machine are specially built.
– Load and compression amount are measured.
• Stress– Force per unit area. Applied force divided by the cross
sectional area of the specimen.
• Strain calculated by the ratio of the change in length and the original length. (Deformation)
lFl0
A
F

Expected Results• Similar Stress-strain curve as tensile testing
Stress
Strain

Shear Testing• Principles
– Direct shear occurs when parallel forces are applied in the opposite direction.
– Single shear occurs on a single plane.
– Double shear occurs on two planes simultaneously.
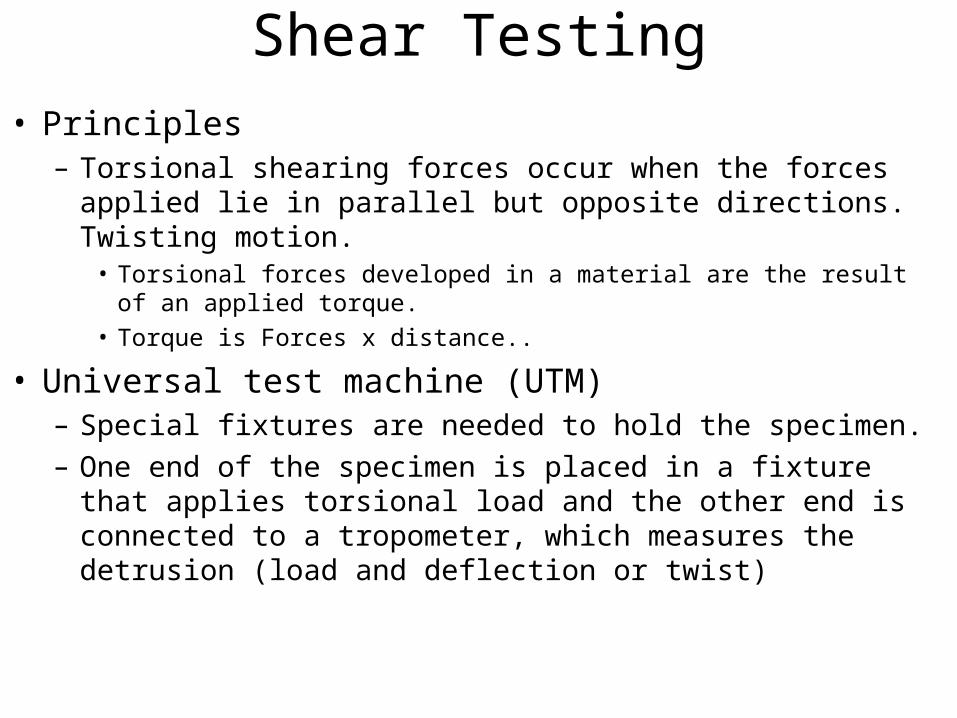
Shear Testing• Principles
– Torsional shearing forces occur when the forces applied lie in parallel but opposite directions. Twisting motion.
• Torsional forces developed in a material are the result of an applied torque.
• Torque is Forces x distance..
• Universal test machine (UTM)– Special fixtures are needed to hold the specimen.
– One end of the specimen is placed in a fixture that applies torsional load and the other end is connected to a tropometer, which measures the detrusion (load and deflection or twist)

Expected Results• Similar Stress-strain curve as tensile testing
Stress
Strain

Bend of Flexure Testing• Principles
– Bending forces occur when load is applied to a beam or rod that involves compression forces on one side of a beam and tensile forces on the other side.
– Deflection of a beam is the displacement of a point on a neutral surface of a beam from its original position under action of applied loads.
– Flexure is the bending of a material specimen under load.– Strength that material exhibits is a function of the flexural modulus of the material and the
cross-sectional geometry.• Example, rectangular beam of 1” x 4” (W) will exhibit higher flexural strength than a 2” by 2”
square beam of the same material modulus.
– Properties are the same as in tensile testing.• Strength, deflection, modulus, ultimate strength, etc.
– Specimen is loaded in a 3-point bending test• bottom goes in tension and the top goes in compression.
– Failure analysis can provide information as the type of failure,• either tension or compression failure,• buckle prior to failure,• condition of fracture, e.e., rough, jagged, or smooth.

Equipment• Universal test machine (UTM)
– Special fixtures are needed to hold the specimen.
– Precautions• Specimen length should be 6 to 12 times the width to avoid shear failure or
buckling.
• Areas of contact with the material under test should be such that unduly high stress concentrations are avoided.
• Longitudinal adjustments are necessary for the supports.
• Lateral rotational adjustments should be provided to prevent torsional stresses.
• The parts should be arranged to be stable under load.

Expected Results• Similar Stress-strain curve as tensile testing
Stress
Strain

Impact Testing• Principles
– Materials exhibit different properties depending on the rate at which a load is applied and the resulting strain that occurs.
• If a load is applied over a long period of time (static test)the material can withstand greater loads than if the test is applied rapidly (dynamic).
– Properties of materials are stain dependent.
– Standardized tests are used to determine the amount of energy required to break a material in impact tests.
– Outcome of impact tests is to determine the amount of energy needed to break a sample.

Impact Testing• Principles
– Energy absorbed in several ways• Elastic deformation of the members or parts of a system.
• Plastic deformation.
• Hysteresis effects.
• Frictional action
• effects of inertia on moving parts.
– Energy is defined as the ability to do work. E =W = F*D• Work is Force times distance moved.
– Energy of a dropped object hitting a specimen is • E = w*h Energy is weight times height dropped.
• E = m*g*h (metric) Energy is mass times gravity acceleration times height.
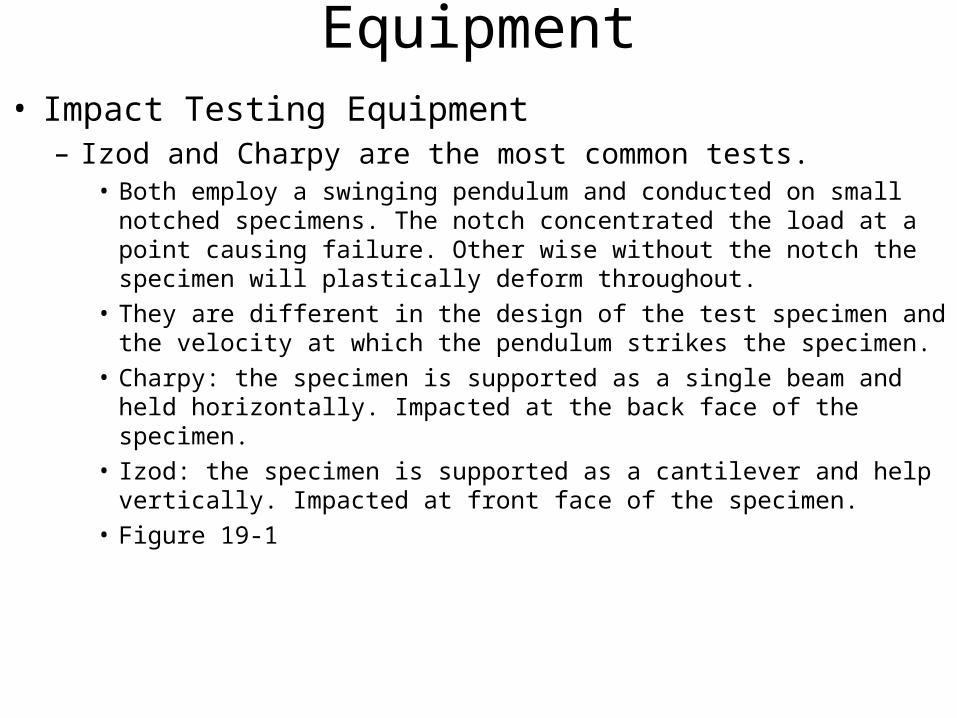
Equipment• Impact Testing Equipment
– Izod and Charpy are the most common tests.• Both employ a swinging pendulum and conducted on small notched
specimens. The notch concentrated the load at a point causing failure. Other wise without the notch the specimen will plastically deform throughout.
• They are different in the design of the test specimen and the velocity at which the pendulum strikes the specimen.
• Charpy: the specimen is supported as a single beam and held horizontally. Impacted at the back face of the specimen.
• Izod: the specimen is supported as a cantilever and help vertically. Impacted at front face of the specimen.
• Figure 19-1

Impact Test• In standard testing, such as tensile and flexural testing, the
material absorbs energy slowly. – In real life, materials often absorb applied forces very quickly:
falling objects, blows, collisions, drops, etc.
– A product is more likely to fail when it is subjected to an impact blow, in comparison to the same force being applied more slowly.
– The purpose of impact testing is to simulate these conditions.

Impact Test• Impact testing is testing an object's ability to resist high-rate loading.
– An impact test is a test for determining the energy absorbed in fracturing a test piece at high velocity.
– Most of us think of it as one object striking another object at a relatively high speed. – Impact resistance is one of the most important properties for a part designer to consider, and
without question the most difficult to quantify.– The impact resistance of a part is, in many applications, a critical measure of service life. More
importantly these days, it involves the perplexing problem of product safety and liability.
• One must determine: – 1.the impact energies the part can be expected to see in its lifetime, 2.the type of
impact that will deliver that energy, and then 3.select a material that will resist such assaults over the projected life span.
– Molded-in stresses, polymer orientation, weak spots (e.g. weld lines or gate areas), and part geometry will affect impact performance.
– Impact properties also change when additives, e.g. coloring agents, are added to plastics.
•

Impact Test• Most real world impacts are biaxial rather than
unidirectional. – Plastics, being anisotropic, cooperate by divulging the easiest
route to failure.
• Complicated choice of failure modes: Ductile or brittle. – Brittle materials take little energy to start a crack, little more to
propagate it to a shattering climax. – Highly ductile materials fail by puncture in drop weight testing
and require a high energy load to initiate and propagate the crack. – Many materials are capable of either ductile or brittle failure,
depending upon the type of test and rate and temperature conditions.
– They possess a ductile/brittle transition that actually shifts according to these variables.
• For example, some plastic food containers are fine when dropped onto the floor at room temperature but a frozen one can crack when dropped.

Expected Results• Charpy Test
– Capacity of 220 ft-lb for metals and 4 ft-lbs for plastics
– Pendulum swings at 17.5 ft/sec.
– Specimen dimensions are 10 x 10 x 55 mm, notched on one side.
• Procedure– Pendulum is set to angle, , and swings through specimen and
reaches the final angel, . If no energy given then = .
– Energy is

Expected Results• Izod Test
– Capacity of 120 ft-lb for metals and 4 ft-lbs for plastics
– Impacted at the front face of the specimen.
– Specimen dimensions are 10 x 10 x 75 mm, notched on one side.
• Procedure– Pendulum is set to angle, , and swings through specimen and
reaches the final angel, . If no energy given then = .
– Energy is

Fundamentals of Hardness
• Hardness is thought of as the resistance to penetration by an object or the solidity or firmness of an object
– Resistance to permanent indentation under static or dynamic loads– Energy absorption under impact loads (rebound hardness)– Resistance toe scratching (scratch hardness)– Resistance to abrasion (abrasion hardness)– Resistance to cutting or drilling (machinability)
• Principles of hardness (resistance to indentation)– indenter: ball or plain or truncated cone or pyramid made of hard steel or diamond– Load measured that yields a given depth– Indentation measured that comes from a specified load– Rebound height measured in rebound test after a dynamic load is dropped onto a surface

Hardness Mechanical Tests• Brinell Test Method
– One of the oldest tests– Static test that involves pressing a hardened steel ball (10mm) into a test
specimen while under a load of • 3000 kg load for hard metals, • 1500 kg load for intermediate hardness metals• 500 kg load for soft materials
– Various types of Brinell• Method of load application:oil pressure, gear-driven screw, or weights with a lever• Method of operation: hand or electric power• Method of measuring load: piston with weights, bourdon gage, dynamoeter, or
weights with a lever• Size of machine: stationary (large) or portable (hand-held)

Brinell Test Conditions
• Brinell Test Method (continued)– Method
• Specimen is placed on the anvil and raised to contact the ball
• Load is applied by forcing the main piston down and presses the ball into the specimen
• A Bourbon gage is used to indicate the applied load
• When the desired load is applied, the balance weight on top of the machine is lifted to prevent an overload on the ball
• The diameter of the ball indentation is measured with a micrometer microscope, which has a transparent engraved scale in the field of view

Brinell Test Example• Brinell Test Method (continued)
– Units: pressure per unit area
– Brinell Hardness Number (BHN) = applied load divided by area of the surface indenter
22
2
dDDD
LBHN
Where: BHN = Brinell Hardness Number
L = applied load (kg) D = diameter of the ball (10 mm) d = diameter of indentation (in mm)
• Example: What is the Brinell hardness for a specimen with an indentation of 5 mm is produced with a 3000 kg applied load.
•Ans: 2
22/6.142
)5()10(10)10(
)3000(2mmkg
mmmmmmmm
kgBHN

Brinell Test Method (continued)
• Range of Brinell Numbers– 90 to 360 values with higher number indicating higher hardness
– The deeper the penetration the higher the number
– Brinell numbers greater than 650 should not be trusted because the diameter of the indentation is too small to be measured accurately and the ball penetrator may flatten out.
– Rules of thumb• 3000 kg load should be used for a BHN of 150 and above
• 1500 kg load should be used for a BHN between 75 and 300
• 500 kg load should be used for a BHN less than 100
• The material’s thickness should not be less than 10 times the depth of the indentation

Advantages & Disadvantages of the
Brinell Hardness Test• Advantages
– Well known throughout industry with well accepted results– Tests are run quickly (within 2 minutes)– Test inexpensive to run once the machine is purchased– Insensitive to imperfections (hard spot or crater) in the material
• Limitations– Not well adapted for very hard materials, wherein the ball deforms excessively– Not well adapted for thin pieces– Not well adapted for case-hardened materials– Heavy and more expensive than other tests ($5,000)

Rockwell Test• Hardness is a function of the degree of indentation of the
test piece by action of an indenter under a given static load (similar to the Brinell test)
• Rockwell test has a choice of 3 different loads and three different indenters
• The loads are smaller and the indentation is shallower than the Brinell test
• Rockwell test is applicable to testing materials beyond the scope of the Brinell test
• Rockwell test is faster because it gives readings that do not require calculations and whose values can be compared to tables of results (ASTM E 18)

Rockwell Test Description• Specially designed machine that applies load through a
system of weights and levers– Indenter can be 1/16 in hardened steel ball, 1/8 in steel ball, or
120° diamond cone with a somewhat rounded point (brale)– Hardness number is an arbitrary value that is inversely related to
the depth of indentation– Scale used is a function of load applied and the indenter
• Rockwell B- 1/16in ball with a 100 kg load• Rockwell C- Brale is used with the 150 kg load
– Operation• Minor load is applied (10 kg) to set the indenter in material• Dial is set and the major load applied (60 to 100 kg)• Hardness reading is measured• Rockwell hardness includes the value and the scale letter
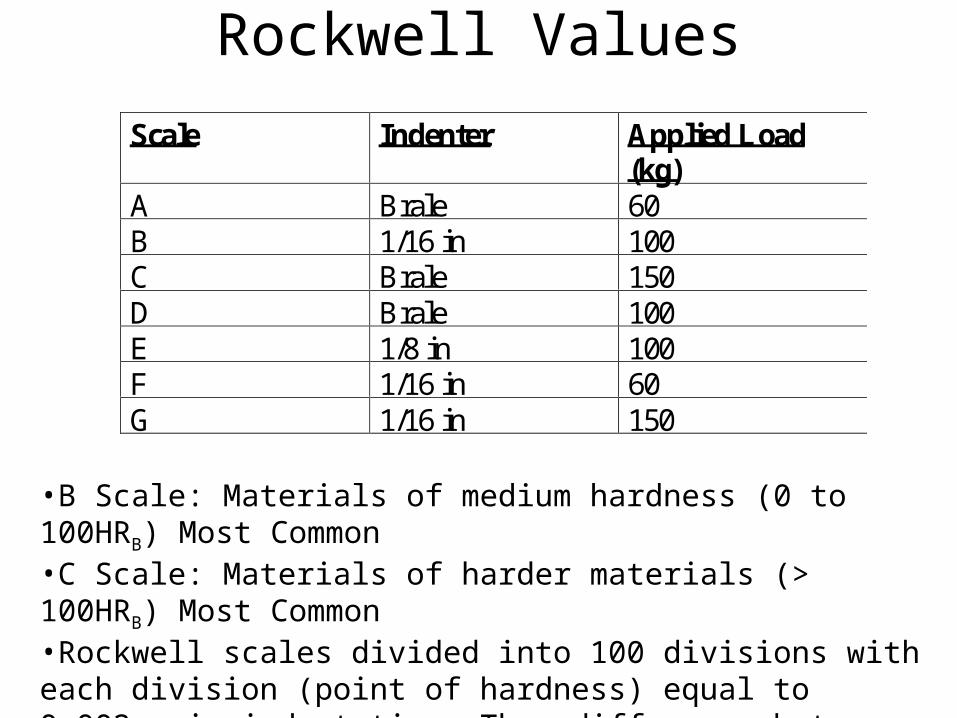
Rockwell Values
Scale Indenter Applied Load(kg)
A Brale 60B 1/16 in 100C Brale 150D Brale 100E 1/8 in 100F 1/16 in 60G 1/16 in 150
•B Scale: Materials of medium hardness (0 to 100HRB) Most Common
•C Scale: Materials of harder materials (> 100HRB) Most Common•Rockwell scales divided into 100 divisions with each division (point of hardness) equal to 0.002mm in indentation. Thus difference between a HRB51 and HRB54 is 3 x 0.002 mm - 0.006 mm indentation•The higher the number the harder the number

Rockwell and Brinell Conversion• For a Rockwell C values between -20 and 40, the Brinell
hardness is calculated by
• For HRC values greater than 40, use
• For HRB values between 35 and 100 use
CHR
xBHN
100
1042.1 6
CHR
xBHN
100
105.2 4
BHR
xBHN
130
103.7 3

Rockwell and Brinell Conversion• For a Rockwell C values, HRC, values greater than 40,
• Example,– Convert the Rockwell hardness number HRc 60 to BHN
CHR
xBHN
100
105.2 4
60100
105.2 4
xBHN 625BHN

Form of Polymers• Thermoplastic Material: A material that is solid,
that possesses significant elasticity at room temperature and turns into a viscous liquid-like material at some higher temperature. The process is reversible
• Polymer Form as a function of temperature
– Glassy: Solid-like form, rigid, and hard
– Rubbery: Soft solid form, flexible, and elastic
– Melt: Liquid-like form, fluid, elastic
Temp
Glassy
Rubbery
Melt
PolymerForm
Increa
sing T
emp
Tm
Tg
Glass Transition Temperature, Tg• Glass Transition Temperature, Tg: The temperature by
which:– Below the temperature the material is in an immobileimmobile (rigid)
configuration– Above the temperature the material is in a mobilemobile (flexible)
configuration
• Transition is called “Glass Transition” because the properties below it are similar to ordinary glass.
• Transition range is not one temperature but a range over a relatively narrow range (10 degrees). Tg is not precisely measured, but is a very important characteristic.
• Tg applies to all polymers (amorphous, crystalline, rubbers, thermosets, fibers, etc.)

Glass Transition Temperature, Tg
• Glass Transition Temperature, Tg: Defined as – the temperature wherein a significant the loss of modulus (or
stiffness) occurs
– the temperature at which significant loss of volume occurs
Modulus (Pa) or (psi)
Temperature-50C 50C 100C 150C 200C 250C
Tg
Vol.
Temperature-50C 50C 100C 150C 200C 250C
Amorphous
Cry
stal
line
TgTg

Crystalline Polymers: Tm
• Tm: Melting Temperature
• T > Tm, The order of the molecules is random (amorphous)
• Tm >T >Tg, Crystallization begins at various nuclei and the order of the molecules is a mixture of crystals and random polymers (amorphous). Crystallization continues as T drops until maximum crystallinity is achieved. The amorphous regions are rubbery and don’t contribute to the stiffness. The crystalline regions are unaffected by temperature and are glassy and rigid.
• T < Tg, The amorphous regions gain stiffness and become glassy
Polymer Form
Temp
Glassy
Rubbery
MeltTm
Tg
Decrea
sing T
emp

Crystalline Polymers Tg
• Tg: Affected by Crystallinity level – High Crystallinity Level = high Tg
– Low Crystallinity Level = low Tg
Modulus (Pa) or (psi)
Temperature-50C 50C 100C 150C 200C 250C
Tg
High Crystallinity
Medium Crystallinity
Low Crystallinity

Temperature
•T > Tm, The amorphous polymer’s volume decreases linearly with T.•Tm > T >Tg, As crystals form the volume drops since the crystals are
significantly denser than the amorphous material.•T < Tg, the amorphous regions contracts linearly and causes a change in
slope
Temperature Effects on Specific Volume
-50C 50C 100C 150C 200C 250C
Amorphous
Cry
stal
line
TgTg
Specific Volume
Elastomers• Elastomers are rubber like polymers that are thermoset or
thermoplastic– butyl rubber: natural rubber
– thermoset: polyurethane, silicone
– thermoplastic: thermoplastic urethanes (TPU), thermoplastic elastomers (TPE), thermoplastic olefins (TPO), thermoplastic rubbers (TPR)
• Elastomers exhibit more elastic properties versus plastics which plastically deform and have a lower elastic limit.
• Rubbers have the distinction of being stretched 200% and returned to original shape. Elastic limit is 200%

Rubbers• Rubbers have the distinction of being stretched 200%
and returned to original shape. Elastic limit is 200%• Natural rubber (isoprene) is produced from gum resin
of certain trees and plants that grow in southeast Asia, Ceylon, Liberia, and the Congo.– The sap is an emulsion containing 40% water & 60% rubber particles
• Vulcanization occurs with the addition of sulfur (4%).– Sulfur produces cross-links to make the rubber stiffer and harder.– The cross-linkages reduce the slippage between chains and results in
higher elasticity.– Some of the double covalent bonds between molecules are broken,
allowing the sulfur atoms to form cross-links.– Soft rubber has 4% sulfur and is 10% cross-linked.– Hard rubber (ebonite) has 45% sulfur and is highly cross-linked.

Vulcanizable Rubber• Typical tire tread
– Natural rubber smoked sheet (100),
– sulfur (2.5) sulfenamide (0.5), MBTS (0.1), strearic acid (3), zinc oxide (3), PNBA (2), HAF carbon black (45), and mineral oil (3)
• Typical shoe sole compound– SBR (styrene-butadiene-rubber) (100) and clay (90)
• Typical electrical cable cover– polychloroprene (100), kaolin (120), FEF carbon black (15) and
mineral oil (12), vulcanization agent

Thermoplastic Elastomers• Polyurethanes
– Have a hard block segment and soft block segment• Soft block corresponds to polyol involved in polymerization in ether based
• Hard blocks involve the isocyanates and chain extenders
• Polyesters are etheresters or copolyester thermoplastic elastomer– Soft blocks contain ether groups are amorpous and flexible
– Hard blocks can consist of polybutylene terephthalate (PBT)
• Polyertheramide or polyetherblockamide elastomer– Hard blocks consits of a crystallizing polyamide
Soft HardHard Hard
Soft Soft

Testing Elastomers• Modulus is low for elastomers and rubbers• Fig 6-47, 6-48, 6-50• Modulus depends upon
– Crosslinking = modulus
– Temp = modulus
• Rubbers have – large rubber region
– Large elastic component• Can test over and over again
• With same results
Modulus (Pa) or (psi)
Temperature-50C 50C 100C 150C 200C 250C
Heavy crosslinking
Medium crosslinking
Low crosslinkingTg Tm
Modulus (Pa) or (psi)
Rubbery Region
TmTg TroomStress (Pa)or(psi)
StrainLow modulus
High modulus

Glasses and Ceramics Thermal• Viscosity- materials resistance to flow
– Viscosity of glasses are between 50 and 500 P, whereas viscosity of water and liquid metals are 0.01p
• Viscosity of soda-lime glass from 25C to 1500C. (Fig 6-42)– Melting range is between 1200 and 1500C
– Working range is between 700 and 900 C
– Annealing Point • Internal stresses can be relieved
– Softening point at 700C• Viscosity = 1013.5 P
– Glass transition • Occurs around annealing point
Temperature, C
Log Viscosity (poise)
0 500 1000 1500
20
15
10
5
0
Annealing Point
Annealing Range
Working Range
Melting Range

Glasses and Ceramics Stresses• Thermal stresses occur during production of tempered glass.• Fig 6-43
– High breaking strength of product is due to residual compressive stress at the material surfaces.
– Above Tg• No tension or compression
– Air quenched surface below Tg• Compression on surface tension on the bottom
– Slow cool to room temperature• Surface compression forces on tension inside.

Long Term Static Loading: Creep• Creep
– Measures the effects of long-term application of loads that are below the elastic limit if the material being tested.
– Creep is the plastic deformation resulting from the application of a long-term load.– Creep is affected by temperature
• Creep procedure– Hold a specimen at a constant elevated temperature under a fixed applied stress and
observe the strain produced.– Test that extend beyond 10% of the life expectancy of the material in service are
preferred.– Mark the sample in two locations for a length dimension.– Apply a load– Measure the marks over a time period and record deformation.

Creep Results• Creep versus time
Creep(in/in)
Time (hours)
Primary CreepSecondary Creep
Tertiary Creep
l0lF
Constant Load
Fixed

Short Term Conventional Testing• Tear
– Flexible plastics and elastomers often fail in a tearing mode and their resistance to tearing is often inadequately reflected in tensile strength
– Standard tear tests involve a variety of test specimen geometries (angle tear, trouser tear, etc.) Figure 4.12
• Conducted on a Universal testing machine or specialized equip
• Involve a cut, slit, or nick which is made before the test.
• Biaxial stress– Developed when a circular diaphragm, pipe, or container is
subjected to pressure (Fig 4.13)• Basis for quick-burst tests.
• The pressure at failure (rupture), or the stress is measured