killer whale, orcinus orca, ofbottomfish in the ...fishbull.noaa.gov/932/yano.pdf · yano and...
TRANSCRIPT

Kazunari VanoSeikai National Fisheries Research InstituteFisheries Agency of Japan2-5-20 Higashiyamoto-machi. Shimonoseki 750. Japan
Marilyn E. DahlheimNational Marine Mammal Laboratory. Alaska Fisheries Science CenterNational Marine Fisheries Service, NOM7600 Sand Point Way NE. Seattle. WA 981 J 5-0070
Killer whale, Orcinus orca,depredation on longline catchesof bottomfish in the southeasternBering Sea and adjacent waters
Abstract.-Depredation ofbottomfish on longline catches bykiller whales, Orcinus orca, hasbeen documented throughout theBering Sea. Stations where repeated interactions with killerwhales had been noted were examined during Japan-U.S. cooperativelongline research surveys conducted from 1980 to 1989. Duringvessel surveys in 1988, killerwhales were shown to depredateGreenland turbot. Reinhardtiushippoglossoides, sablefish, Anoplopoma fimbria. arrowtooth flounder.Atheresthes stomias, Pacific halibut, Hippoglossus stenolepis, andsearcher. Bathymaster signatus. selecting the largest fish available foreach species. Depredation rate,based on averages of total catch,was higher than calculated fromdirect counts of damaged fish. Theaverage annual monetary loss tothe survey calculated over a 4-monthresearch season as a result ofkillerwhale predation for the years 1982through 1988 was estimated torange from $2.982 to $34.571 (fromY402,500 to Y4,667,1l01.
Manuscript accepted 12 September 1994.Fishery Bulletin 93:355-372 (1995).
Killer whales, Orcinus orca, are cosmopolitan in distribution (Leatherwood and Dahlheim, 1978), and reports of their interference in fishery operations occur worldwide(Sivasubramanium, 1965; Leatherwood et aI., 1990; Tasmanian Fisheries Development Authorityl). InAlaska, killer whales depredatelongline catches ofbottomfish. suchas sablefish talso known as blackcod), Anoplopoma fimbria, andGreenland turbot, Reinhardtiushippoglossoides, in the southeastern Bering Sea and Prince WilliamSound, Alaska (Dahlheim2). Information from sources in the U.S. domestic longline fishery in the BeringSea suggests that killer whale depredation occurs on at least 20% ofthe bottom longline sets {Dahlheim2l.In Prince William Sound, an estimated 25% of the total catch is lostto killer whales (Matkin3).
Annual Japan-U.S. cooperativelongline research surveys for sablefish and Pacific cod, Gadus macro·cephalus, resources have occurredin Alaskan waters since 1979. Research vessels use similar fishinggear to that used during Japanesecommercial bottom longline operations. This study reports on the nature and extent of fishery interac-
tions with killer whales on JapanU.S. research longline operations inAlaskan waters from 1980 to 1989.The survey area included the eastern Aleutian Islands, north into theBering Sea along the continentalslope. eastward following the AlaskaPeninsula to the Gulf ofAlaska, andthen south into Southeast Alaska(Fig. 1l. Objectives of the study include 1) definition of the areaswhere fishery interactions occur; 2 lestimation ofkiller whale depredation on longline-caught fish; 3l iden-
1 Tasmanian Fisheries Development Authority. 1981. Assessment of impact orinterference from Orcinus orca (killer whale)on Tasmanian dropline fishery. AustralianNational Parks and Wildlife Service. Tasmanian Fisheries DevelopmentAuthority.23 Old Wharf. Hobart. Tasmania 7000.Australia. Unpubl. manuscr., 35 p.
2 Dahlheim. M. E. 1988. Killer whale(Orcinus orca) depredation on longlinecatches of sablefish CAnoplopoma fimbria)in Alaskan waters. U.S. Dep. Commer.•NOAA. Natl. Mar. Fish. Serv.• NorthwestAlaska Fish. Cent., 7600 Sand Point WayNE, BIN C15700, Seattle, WA98115. Proc.Rep. 88-4. 31 p.
3 Matkin. C. O. 1986. Killer whale interactions with the sablefish longline fishery inPrince William Sound. Alaska, 1985. withcomments on the Bering Sea. Rep. to theNational Marine Mammal Laboratory, Natl.Mar. Fish. Serv., NOAA. 7600 Sand PointWay N.E., Seattle. WA98115-0070. Unpubl.manUBcr. contract 40-HANF-6-0068, 10 p.
355

356
•..
1 WA EA9 45•• £'374''''. ,,44 43 41 4039 ••
48 • • 42 of. -• IJIf ......" Jil',~ .60
49 ~;, ,.54••~75951 • •• 5556
52 53
Fishery Bulletin 93(2). 1995
GULF OF ALASKA
Figure 1Survey stations ofJapan-U.S. cooperative longline surveys in Alaskan waters (1980-89). Surveys were not. conducted in the Bering Sea(B-II, B-Ill. and B-N) during 1980 and 1981 seasons. f..) =stations where kiUer whales, Orcinus orca, were not encountered: I"') =stations where whales were encountered (stations 10,19, and 83 killer whales were observed but no depredation occurred). B = BeringSea, WA = Western Aleutian Islands, EA = Eastern Aleutian Islands, SH = Shumagin Islands. CH = Chirikof Island, KO = KodiakIsland, YA =Yakutat, SE =Southeast Alaska.
tification ofspecies and size offish consumed by killerwhales; and 4) quantification of the amounts oflongline catch lost to killer whales.
Materials and methods
Stations for the Japan-U.S. longline research survey in Alaskan waters were established by the National Research Institute ofFar Seas Fisheries, FisheriesAgency ofJapan, and the National Marine Fisheries Service (NMFS), Alaska Fisheries Science Center. In 1980 and 1981, 76 stations were fished, excluding areas B-I1, B-III, and B-IV (29 stationsl in theBering Sea (Fig. n Beginning in 1982, the number ofstations (which represent 11 major fishing areas) increased to 108 to include the additional Bering Sea stations (Sasaki, 1985; Fig. 1). Surveys were conductedbetween May and September each year (1980-89).Weather permitting, one station was fished per day.
The research vessels selected for the surveys werechartered Japanese commerciallongline vessels that
had been used for previous sablefish and Pacific codfishing operations in the North Pacific Ocean. Thebottom longline was 16 Ian long and consisted of 160"hachis" (skates). Each hachi was 100 m long andcontained 45 hooks which were spaced 2 m apart.Gangion lengths were 1.2 m. Each hook was baitedwith squid (total number of hooks=7,200l. The hook(standard type: Tara [=cod] no. 18) was 74 mm inlength and 21 mm in width. The depth at which fishwere caught was estimated by measuring the depthof water under the vessel with an echo sounder atevery fifth hachi. The catch was recorded by estimating the numbers ofspecies or species groups for eachhachi. The total catch of the major species wasweighed to the nearest gram. Total length (TL) orfork length (FL) was measured for each species tothe nearest millimeter. Details of the survey methods and longline gear are described in Yan04•5 •
4 Yano, K. 1989. Japan-U.S. joint survey for stock assessment ofsablefish and Pacific cod resources in 1988. Report ofthe Northern Groundfish Section, Japan Scientific Council on the
continued on next page

Yano and Dahlheim: Depredation of bottomfish on longline catches by Orcinus orca 357
Between 1980 and 1989, stations where killerwhales were present were recorded. During vesselsurveys in 1988, depredation rates by killer whaleswere quantified. During the 1988 surveys, as thegroundline was retrieved, fish that had been damaged or partially consumed by killer whales were identified by remains left on the hook (e.g. heads, lips, orgills). In addition, head length (HL) or maxillary length(ML) measurements were collected for each damagedfish. Head length (mm) was measured from the mostanterior point ofthe snout ofthe upper jaw to the mostdistant point ofthe posterior margin ofthe operculum.Maxillary length (rom) was measured along the longest margin on the premaxillary side. Fork length (FLlfor sablefish and arrowtooth flounder, Atheresthesstomias, and total length (TL) for Greenland turbotwere also measured. Fork length and TL were measured from the tip of the snout to the central point ofthe caudal fin. The relationships between HL and FLor TL and between ML and FL or TL were calculatedby the least-square method following the equation:
Y= a+ bX,
where Y is FL or TL (mm), X is HL or ML (mm), anda and b are constants. Average lengths of damagedand undamaged fish were compared by using t-testswith a significance level of 0.05.
To obtain killer whale depredation rates for eachstation, direct counts were made of the remainingheads, lips, or gills that were brought aboard theresearch vessel. Empty hooks did not provide evidence of killer whale depredation and were not included in the analysis.
Killer whale depredation rates were calculated bytwo methods. RNT is the depredation rate calculatedfrom the number of fish preyed upon as a percentage of the total number of fish landed per fishingtrip. RNS is the depredation rate calculated from thenumber of fish preyed upon as a percentage of thenumber offish landed from the time the whales werefirst observed to depredate them.
The two depredation rates were calculated for eachstation as
RNT (%) = NPI(NT+NP) x 100
and
4 (continued) Fisheries Resources (GSKJ, Thhoku National Fisheries Research Institute, Hachinohe Branch, 25-259 Shimomekurakubo, Samemachi. Hchinohe, Aomori 031, Japan, No.22, p. 145-173. [In Japanese.]
5 Yano, K. 1990. Report on sablefish and Pacific cod resource developmental survey. 1988. Japan Marine Fishery ResourcesResearch Center, 3-27 Kioi-cho. Chiyoda-ku, Thkyo 102 Japan,JAMARC Rep. S631No.ll, 195 p. [In Japanese.]
RNS (%) =NPI(NS+NP) x 100,
where NP is the number of depredated fish, countedby the remaining heads, lips, or gills; NT is the totalnumber offish landed with no evidence ofkiller whaledepredation; and NS is the number of fish landedwithout any physical evidence ofdepredation countedfrom the time the whales were first observed to depredate fish (determined by observing heads, lips, orgills on the groundline).
Other depredation rates (REA and REY) were obtained by averaging the catch rates (number of fishper hachi) obtained during the 1980 and 1988 surveys. REA is the depredation rate calculated fromthe average catch rates for all years at each station.REY is the depredation rate calculated from the average catch rates for all stations for each year. Theaverage catch rates (REA and REY) were obtainedthrough the following formula:
REA or REY (%) = 100 - (AlB x 100),
where A is the average catch rate during whale depredation for all years at each station (for REA) or allstations for each year (for REY), and B is the average catch rate with no killer whale depredation forall years at each station (for REA) or all stations foreach year (for REY). We tested for differences in theaverage catch rates for REA and REY by using theone-way analysis of variance (ANOVA). The annualsurvey reports of the Japan Marine Fishery Resources Research Center (JAMARC) by Inada andSasaki,6 Onoda and Sasaki,7 Mizogoshi and Sasaki,8
Funato and Sasaki,9 Iwami and Sasaki,IO Fukui andSasaki,ll Takeda and Sasaki,12 Takeda,13 and Yan05
provided fish catch data for the study.
6 Inada, T.. and T. Sasaki. 1981. Report on sablefish and Pacificcod resource developmental survey, 1980. Japan Marine Fishery Resources Research Center, 3-27 Kioi-cho, Chiyoda-ku. Thkyo 102 Japan, JAMARC Rep. S551No.18, 156 p. [In Japanese.]
7 Onoda. M., and T. Sasaki. 1982. Report on sablefish and Pacific cod resource developmental survey. 1981. Japan MarineFishery Resources Research Center, 3-27 Kioi-cho, Chiyoda-ku,Thkyo 102 Japan, JAMARC Rep. S56/No.15. 140 p. [In Japanese.]
s Mizogoshi, H., and T. Sasaki. 1984. Report on sablefish andPacific cod resource developmental survey, 1983. Japan MarineFishery Resources Research Center, 3-27 Kioi·cho, Chiyoda-ku,Thkyo 102 Japan, JAMARC Rep. S58/No.13, 219 p. [In Japanese.]
9 Funato, K., and T. Sasaki. 1985. Report on sablefish and Pacific cod resource developmental survey, 1982. Japan MarineFishery Resources Research Center, 3-27 Kioi-cho, Chiyoda-ku.Thkyo 102 Japan,JAMARC Rep. S571No.13, 191 p. [In Japanese.]
10 Iwami, T., and T. Sasaki. 1985. Report on sablefish and Pacificcod resource developmental survey, 1:984. Japan Marine FisheryResources Research Center, 3-27 Kioi-cho, Chiyoda-ku, Thkyo 102Japan, JAMARC Rep. S59INo.12. 223 p. [In Japanese.] .
11 Fukui, J., and T. Sasaki. 1988. Report on sablefish and Pacificcod resource developmental survey, 1985. Japan Marine
continued on next page

358
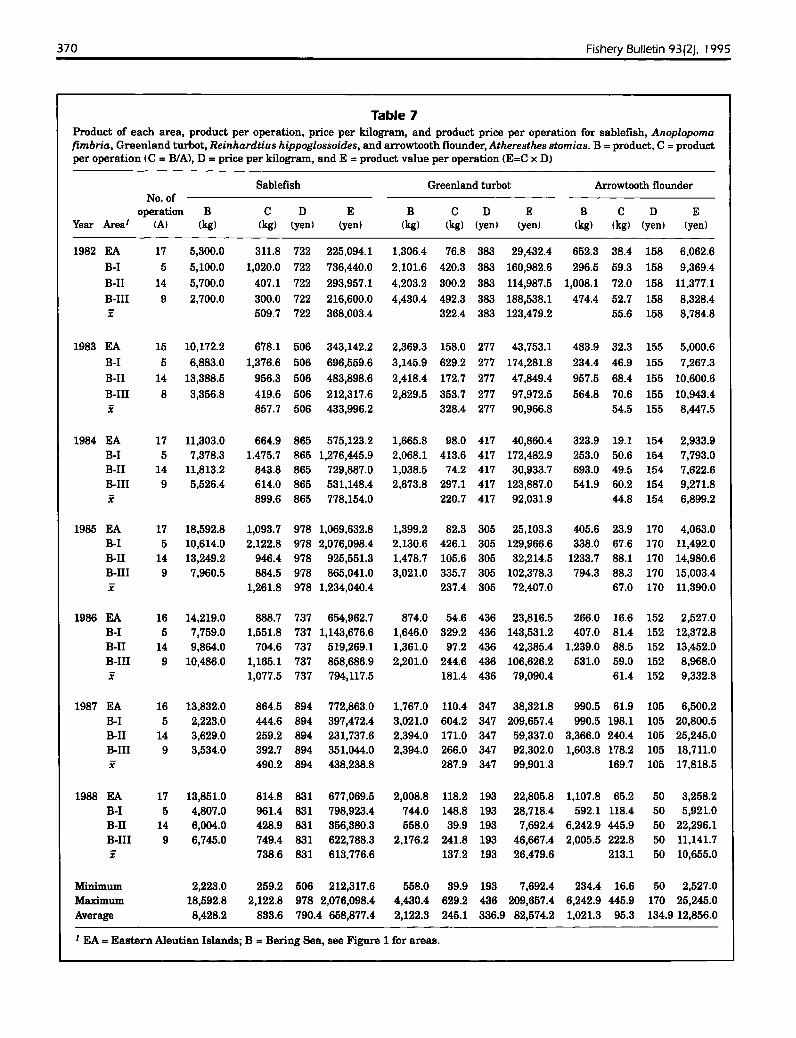
Monetary losses incurred during fishing operationswere calculated from data for product (kg) and fromprice per kilogram (yen) of sablefish, Greenland turbot, and arrowtooth flounder, contained in the annualsurvey reports of JAMARC by the following formula:
Monetary loss <yen and US dollar) =(Average product value) x (depredation rate
[RNT, RNS, REY or READ/100,
where average product value is the average of product values calculated by product per operation andby price per kilogram in each area and each year.
Results
Stations with killer whales
Between 1980 and 1989, killer whales were reportedat 25 stations (Fig. 1). Eighteen ofthese stations werein the eastern Bering Sea CB), five stations were nearthe eastern Aleutian Islands (EA), and one stationeach was near the Shumagin Islands (SH) and offKodiak Island (KO). Fishery interactions consistentlyoccurred at several of the sampling locations (Table1), The highest frequency ofkiller whale interactionswas reported for two areas in the Bering Sea: B-1(stations 31, 32, and 33) and B-II (stations 22, 25,26, and 27) (Table 1, Fig. 1). Killer whale group sizeranged between 4 and 50 animals during the 1988survey (Table 2). From the 1988 field observationsand photographs of killer whales, there appears tobe three killer whale groups involved in the BeringSea fishery interactions CBSl, BS2, and BS3 in Table2; Yano and Dahlheim14).
Depredation by killer whales
During the 1988 survey, when killer whales wereobserved around the vessel, the hooks on the re-
11 (continued) Fishery Resources Research Center, 3-27 Kioi-cho,Chiyoda-ku, Tokyo 102 Japan, JAMARC Rep. S60INo.12. 197p. [In Japanese.]
12 Takeda, Y., and T. Sasaki. 1988. Report on sablefish and Pacific cod resource developmental survey, 1986. Japan MarineFishery Resources Research Center, 3-27 Kioi-cho, Chiyoda-ku,'lbkyo 102 Japan. JAMARC Rep. S61/No.12, 179 p. [In Japanese.]
13 Takeda, Y. 1988. Report on sablefish a·nd Pacific cod resourcedevelopmental survey, 1987. Japan Marine Fishery ResourcesResearch Center, 3-27 Kioi-cho, Chiyoda-ku, 'lbkyo 102 Japan,JAMARC Rep. S62/No.ll, 191 p. [In Japanese.]
14 Yano, K., and M. E. Dahlheim. Behavior of killer whales,Orcinus orca, during longline fishery interactions in the southeastern Bering Sea and adjacent waters. Fisheries ScienceCunpubl. manuscript).
Fishery Bulletin 93(2). J995
trieved groundline frequently contained only fishheads, lips, or gills (Fig. 2), providing evidence thatkiller whales were responsible for depredation oflongline-caught fish. Occasionally, whole fish showedextensive rake marks made by killer whale teeth(Figs. 3 and 4). Whales consumed longline catches ofsablefish, Greenland turbot, arrowtooth flounder, andPacific halibut, the latter remaining whole but showing extensive rake marks. Two heads ofsearcher werealso noted. Other species of fish caught on longlinesbut not eaten by killer whales included Pacific cod,grenadier, Coryphaenoides acrolepis, rockfish, Bebastes spp., walleye pollock, Theragra chalcogramma,and shortspine thornyhead, Sebastolobus alascanus.
Depredation rates
Killer whale depredation rates calculated by fourdifferent methods showed that the rates based onaverages of total catch <REA and HEY) were higherthan the rates calculated directly from damaged fishcRNT and RNS). Based on our sampling, depredation rates for Greenland turbot were highest, followedby depredation rates for sablefish, arrowtooth flounder, and Pacific halibut <Table 3). Depredation ratesof about 10% or more (based on both RNT and RNSvalues) were noted for stations 30, 33, 25, 22, and20. The highest RNT and RNS values were found atstation 25 for Greenland turbot and sablefish and atstation 22 for arrowtooth flounder. Arrowtooth flounder typically had lower depredation rates than thosecalculated for Greenland turbot or sablefish. However, a large number of damaged arrowtooth flounder (15-72 specimens) were present in the catch atstations 30, 17, 20, 22, and 25.
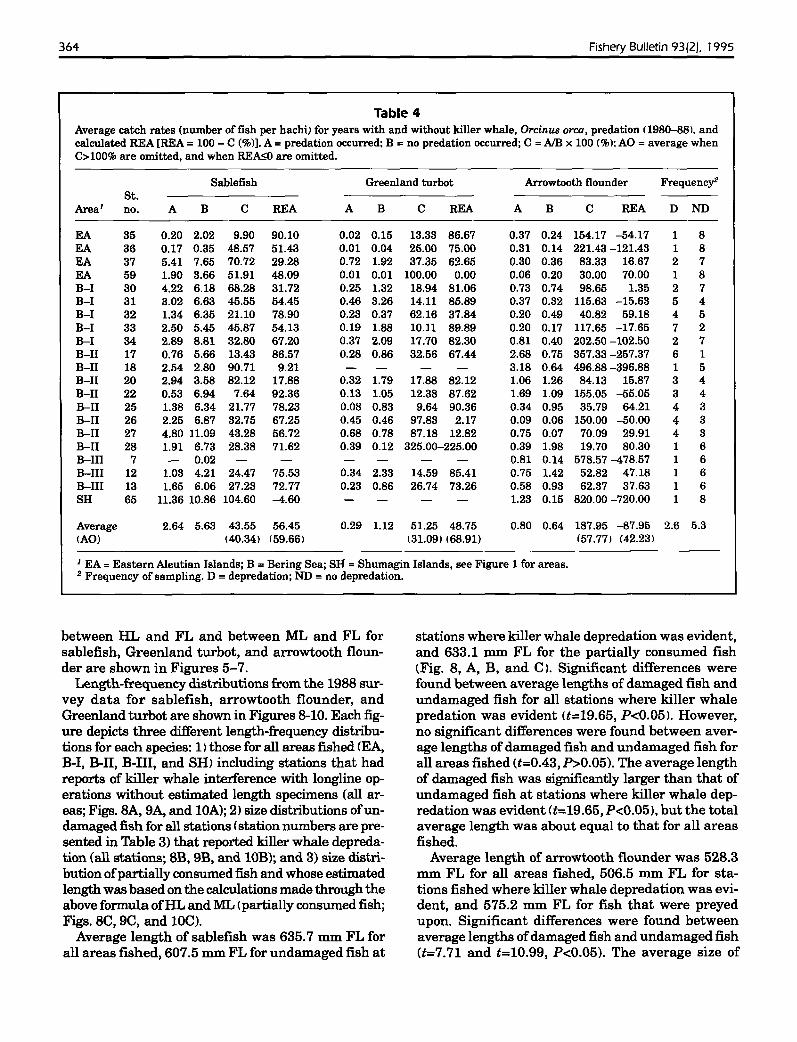
Annual catch rates (total number of fish caughtper hachi) of sablefish, Greenland turbot, andarrowtooth flounder for each station in the EA, B-1,B-II, B-III, and SH areas <Fig. 1) were used to calculate depredation rates for all years at each station<REA) and for all stations for each year (REY).Twenty-one stations had fishery interactions involving killer whales during the period 1980-88 (Table4). Depredation rates (REA) calculated from the average fishery catch rates for years with and withoutkiller whale predation showed that the average catchrates ofsablefish and Greenland turbot were significantly lower when killer whales were present thanwhen killer whales were absent (ANOVA, P<O.Ol).However, for arrowtooth flounder average catch rateswere independent of killer whale depredation(ANOVA, P>0.05). In addition average catch ofarrowtooth flounder was similar amongyears regardless of the presence or absence of whales (Table 4).Depredation rates (REA) calculated from the average

Yano and Dahlheim: Depredation of bottomfish on longline catches by Orcinus orca 359
Table 1Areas and stations where killer whales, Orc:inus orca, were encountered <X) during Japan-U.S. cooperative longline surveys<1980 to 1989), B-I1 and B-III areas were not surveyed I-I in 1980 and 1981. Asterisks (*) indicate the stations where killerwhales were encountered but no depredation occurred.
Year Totalper
Areal St. no. 1980 1981 1982 1983 1984 1985 1986 1987 19882 1989 station
EA 35 X 1EA 36 X 1EA 37 X X X 3EA 38 X 1EA 59 X 1B-1 30 X X 2B-1 31 X X X X X X 6B-1 32 X X X X 4B-1 33 X X X X X X X 7B-1 34 X X 2B-I1 17 X X 2B-I1 18 X 1B-I1 19 X* 1B-I1 20 X X X 3B-I1 22 X X X 3B-I1 25 X X X X X X 6B-I1 26 X X X X X 5B-I1 27 X X X 3B-I1 28 X 1B-III 7 X 1B-III 10 X* 1B-III 12 X X 2B-III 13 X 1SH 65 X 1KO 83 X* 1
Total per year 3 1 4 9 3 3 8 7 15 7 60
1 EA = Eastern Aleutian Islands: B = Bering Sea; SH = Shumagin Islands; KO = Kodiak Island, see Figure 1 for areas.2 Detailed observations of killer whale predation were documented.
catch rates for years with and without killer whale predation ranged from 9.2 to 92.4% for sablefish, from 2.2to 90.4% for Greenland turbot, and from 1.4 to 80.3%for arrowtooth flounder (Table 4).
Between-year comparisons (REY) for catches ofallspecies at the same station (except for 1982 of sablefish) indicate catches were lower in years with killerwhale depredation (Table 5). The average catch ratesof sablefish and Greenland turbot for stations withkiller whale depredation were significantly lowerthan in stations without depredation (ANOVA,P<0.05). However, the average catch rate ofarrowtooth flounder (for stations with killer whaledepredation) was not significantly lower than thatfor stations without killer whale depredation(ANOVA, P>0.05). Depredation rates (REY) calculated from the average catch rates for stations withand without killer whale predation ranged from 33.4to 84.1% for sablefish, from 53.3 to 82.6% for
Greenland turbot, and from 17.0 to 70.8% forarrowtooth flounder (Table 5). REYvalues calculatedfrom average catch rates for years with and withoutkiller whale depredation were slightly lower thanREA values (Table 6).
Predation rates based on the average catch landed(REA and REYvalues) were higher than those rates(RNT and RNS values) calculated directly from counting heads, lips, and gills of fish remains on the deckduring the 1988 survey (Table 6). Depredation rate,based on the four different methods ofcalculations (i.e.RNT, RNS, REY, and REA). suggested that whales took14-60% of the sablefish. 39-69% of the Greenland turbot. and 6-42% ofthe arrowtooth flounder.
Size of fish consumed by killer whales
The size of the fish taken by whales was determinedby measurements of HL or ML. The relationships

360 Fishery Bulletin 93(2), 1995
Table 2Stations where kjJler whales, Orcinlls orca, were encountered during the 1988 Japan-U.S. longline research survey.
Fishing depthFirst hachi of first hachi
Hachi2 Fishing number with number thatOperating Estimated Arrival number when depth of evidence of received
St. depth number of time of killer whales retrieved killer whale killer whale GroupJAreal no. Date (m) whales killer whales arrived hachi (m) depredation depredation (111) identified
EA 37 17 June 160-744 40-50 13:30 50 380 54 440 ?B-1 30 23 June 144-480 20-30 10:25 68 380 76 390 1,3B-1 31 27 July 110-820 5-6 12:15 120 550 123 600 2B-1 33 22 June 122-812 20-30 8:40 1 800 7 780 1,3B-II 17 14 July 174-980 8-10 11:05 86 210 95 300 1B-II 18 15 July 133-215 8-10 8:30 8 136 24 137 1B-IJ4 19 17 July 150-245 4 13:16 156 238 2B-II 20 18 July 160-820 8-10 9:30 42 160 117 440 2B-II 22 28 June 197-680 15-30 8:45 1 680 6 670 1B-II 25 24 June 430-613 10-20 8:30 1 610 6 610 2B-II 26 21 July 485-720 15-20 8:10 1 485 31 509 ?B-III 7 08 July 130-155 10-15 10:50 46 145 110 150 2B-III4 10 10 July 167-562 8:20 1 167 ?
SH 65 30 July 135-765 6-8 13:08 127 455 133 660K04 83 18 August 360-750 7-8 11:00 65 520 ?
I EA =Eastern Aleutian Islands; B =Bering Sea; SH =Shumagin Islands; KO =Kodiak Island, see Figure 1 for areas.2 A length of groundline equal to 100 m.,'1 See Yano and Dahlheim (See Footnote 14 in text).4 No predation observed at station.
Figure 2I-leads, lips, and gills of partially consumed sablefish, Anoplopoma fimbria, Greenland turbot,Reinhardtills hippoglossoides, and arrowtooth OoundCl', A/heres/lies s/ol11ias, at station 22. Scalerepresents 300 mm.

Yano and Dahlheim: Depredation of bottomfish on longline catches by Orcinus orca
Figure 3Depredated sablefish, Anoplopoma fimbria. at station 33. (A) Whole fish with rake marks made bykiller whale teeth; (B) pat1;ially consumed fish showing head, lips, and gills. Scale represents 300 mm.
361

362 Fisllery Bulletin 93(2), 1995
Figure 4Partially consumed Greenland turbot, Reinhard/ius hippoglossoides, and alTowtoothOounder,Atheresthes stornias. Scales represent 300 mm. (Al Arrowtooth flounder withrake marks made by killer whale teeth atstation 22; (Bl damaged Greenland turbotat station 17; (el head and lips of partiallyconsumed Greenland turbot at station 22.

Yano and Dahlheim: Depredation of bottomfish on longline catches by Orcinus orca 363
Table 3Killer whale, Orcinus orca, predation rates for 1988 on sa-blefish. Anoplopoma fimbria. Greenland turbot, Reinhardtiushippoglossoides. arrowtooth flounder. Atheresthes stomias. and Pacific halibut, Hippoglossus stenolepis. NPF: number of dam-aged fish; RNT (%1 =(number of partially consumed fish, NPl/(number of total catch fish) x 100; RNS (%l =(NP)/lnumber offish(remaining heads. lips, or gills seen) counted from the start of depredation by killer whalesl x 100.
Sabletish Greenland turbot Arrowtooth flounder Pacific halibut
Areal St. no. NPF RNT RNS NPF RNT RNS NPF RNT RNS NPF RNT RNS
EA 37 69 14.11 14.53 33 30.00 30.00 1 2.04 5.88 0 0.00 0.00
B-1 30 13 38.24 43.33 3 60.00 60.00 19 14.29 61.29 0 0.00 0.00
B-1 31 7 2.57 17.07 6 14.63 54.55 0 0.00 0.00 0 0.00
B-1 33 27 9.68 9.93 3 9.09 10.34 0 0.00 0.00 0 0.00 0.00
B-I1 17 9 7.38 9.47 7 16.28 17.07 15 3.50 17.65 0 0.00 0.00
B-I1 18 1 0.26 0.26 0 3 0.59 0.59 1 0.72 0.72
B-I1 20 25 26.04 71.43 27 71.05. 77.14 27 7.42 26.21 0 0.00 0.00
B-I1 22 8 5.76 6.20 9 37.50 37.50 72 19.46 19.62 0 0.00 0.00
B-I1 25 32 62.75 62.75 21 95.45 95.45 15 12.20 12.20 1 8.33 8.33
B-I1 26 3 0.64 0.89 11 20.75 23.91 1 8.33 8.33 0
B-III 7 0 0.00 0 1 0.77 1.64 4 0.57 4.04
SH 65 5 0.28 2.69 0 0 0.00 0.00 0 0.00
Average 13.98 21.69 39.42 45.11 5.72 12.78 0.87 1.46
I EA =Eastern Aleutian Islands; B =Bering Sea; SH =Shumagin Islands. see Figure 1 for areas.
AFL = 97.26 + 3.26 • HL (, = 0.975, n = 149)
1000
1:; 800
it.!!
~ 600...
//.. y ....~
. .. I .. .-:....0·,.-y .
• J. c::"·io~
P: ......'a.;r"" •/~...
120 160 200 240 280
FL = 163.78 + 9.02 • ML ('.0.979. n= 113) .-/
B ./~ •-.y.......
. .....! ,~........... .........-.!lA•••-. !C,...- -.-:...... ::.---; .
. ·,11:.....,-i.........
...............,..Figure 5Size ofpartiaUy consumed sablefish, Anoplopoma fimbria.(A) The relationship between head length (HLI and forklength (FLI; (Bl the relationship between maxillary length(ML) and fork length (FLI.
1000
E~
..c 800
~c.!!...0 600...
Head length (mm)
60 80
Maxillary length (mm)
100
364 Fishery Bulletin 93(2), 1995
Table 4Average catch rates (number offish per hachi) for years with and without killer whale, Orcinus orca, predation (1980-88). andcalculated REA [REA =100 - C (%)]. A =predation occurred; B =no predation occurred; C =AlB x 100 (%): AO =average whenC>100% are omitted, and when REAsO are omitted.
Sablefish Greenland turbot Arrowtooth flounder Frequency'!St.
Areal no. A B C REA A B C REA A B C REA D ND
EA 35 0.20 2.02 9.90 90.10 0.02 0.15 13.33 86.67 0.37 0.24 154.17 -54.17 1 8EA 36 0.17 0.35 48.57 51.43 0.01 0.04 25.00 75.00 0.31 0.14 221.43 -121.43 1 8EA 37 5.41 7.65 70.72 29.28 0.72 1.92 37.35 62.65 0.30 0.36 83.33 16.67 2 7EA 59 1.90 3.66 51.91 48.09 0.01 0.01 100.00 0.00 0.06 0.20 30.00 70.00 1 8B-1 30 4.22 6.18 68.28 31.72 0.25 1.32 18.94 81.06 0.73 0.74 98.65 1.35 2 7B-1 31 3.02 6.63 45.55 54.45 0.46 3.26 14.11 85.89 0.37 0.32 115.63 -15.63 5 4B-1 32 1.34 6.35 21.10 78.90 0.23 0.37 62.16 37.84 0.20 0.49 40.82 59.18 4 5B-1 33 2.50 5.45 45.87 54.13 0.19 1.88 10.11 89.89 0.20 0.17 117.65 -17.65 7 2B-1 34 2.89 8.81 32.80 67.20 0.37 2.09 17.70 82.30 0.81 0.40 202.50 -102.50 2 7B-II 17 0.76 5.66 13.43 86.57 0.28 0.86 32.56 67.44 2.68 0.75 357.33 -257.37 6 1B-II 18 2.54 2.80 90.71 9.21 3.18 0.64 496.88 -396.88 1 5B-II 20 2.94 3.58 82.12 17.88 0.32 1.79 17.88 82.12 1.06 1.26 84.13 15.87 3 4B-II 22 0.53 6.94 7.64 92.36 0.13 1.05 12.38 87.62 1.69 1.09 155.05 -55.05 3 4B-II 25 1.38 6.34 21.77 78.23 0.08 0.83 9.64 90.36 0.34 0.95 35.79 64.21 4 3B-II 26 2.25 6.87 32.75 67.25 0.45 0.46 97.83 2.17 0.09 0.06 150.00 -50.00 4 3B-II 27 4.80 11.09 43.28 56.72 0.68 0.78 87.18 12.82 0.75 0.07 70.09 29.91 4 3B-II 28 1.91 6.73 28.38 71.62 0.39 0.12 325.00-225.00 0.39 1.98 19.70 80.30 1 6B-III 7 0.02 0.81 0.14 578.57 -478.57 1 6B-I1I 12 1.03 4.21 24.47 75.53 0.34 2.33 14.59 85.41 0.75 1.42 52.82 47.18 1 6B-I1I 13 1.65 6.06 27.23 72.77 0.23 0.86 26.74 73.26 0.58 0.93 62.37 37.63 1 6SH 65 11.36 10.86 104.60 -4.60 1.23 0.15 820.00 -720.00 1 8
Average 2.64 5.63 43.55 56.45 0.29 1.12 51.25 48.75 0.80 0.64 187.95 --87.95 2.6 5.3lAO) 140.34) (59.66) 131.091 (68.91) (57.77) (42.23)
1 EA =Eastern Aleutian Islands; B =Bering Sea; SH =Shumagin Islands, see Figure 1 for areas.2 Frequency of sampling. D =depredation; ND =no depredation.
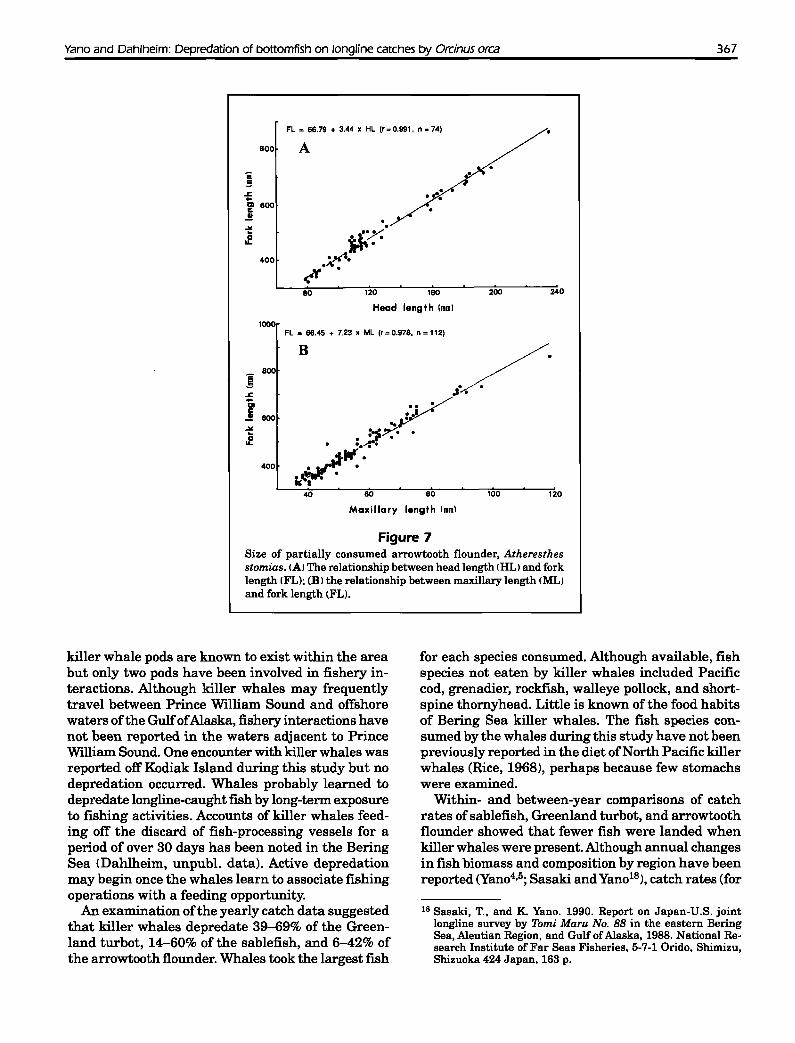
between HL and FL and between ML and FL forsablefish, Greenland turbot, and arrowtooth flounder are shown in Figures 5-7.
Length-frequency distributions from the 1988 survey data for sablefish, arrowtooth flounder, andGreenland turbot are shown in Figures 8-10. Each figure depicts three different length-frequency distributions for each species: 1) those for all areas fished (EA,B-1, B-II, B-III, and SH) including stations that hadreports of killer whale interference with longline operations without estimated length specimens (all areas; Figs. 8A, 9A, and lOA); 2) size distributions ofundamaged fish for all stations (station numbers are presented in Table 3) that reported killer whale depredation (all stations; 8B, 9B, and lOB); and 3) size distribution ofpartially consumed fish and whose estimatedlength was based on the calculations made through theabove formula ofHL and ML (partially consumed fish;Figs. 8C, 9C, and 10C).
Average length of sablefish was 635.7 mm FL forall areas fished, 607.5 mm FL for undamaged fish at
stations where killer whale depredation was evident,and 633.1 mm FL for the partially consumed fish(Fig. 8, A, B, and C). Significant differences werefound between average lengths of damaged fish andundamaged fish for all stations where killer whalepredation was evident (t=19.65, P<0.05). However,no significant differences were found between average lengths of damaged fish and undamaged fish forall areas fished (t=0.43, P>0.05). The average lengthof damaged fish was significantly larger than that ofundamaged fish at stations where killer whale depredation was evident Ct=19.65, P<0.05), but the totalaverage length was about equal to that for all areasfished.
Average length of arrowtooth flounder was 528.3mm FL for all areas fished, 506.5 mm FL for stations fished where killer whale depredation was evident, and 575.2 mm FL for fish that were preyedupon. Significant differences were found betweenaverage lengths ofdamaged fish and undamaged fish(t=7.71 and t=10.99, P<0.05). The average size of

Yano and Dahlheim: Depredation of bottomfish on longline catches by Orcinu5 orca 365
Table 5Average catch rates (number offish per hachil for stations with and without killer whale, Orcinus orca, depredation (stationsindicated in Table 4), and calculated REY [REY=100-C(%j]. A = depredation occurred; B = no depredation occurred; C = AlB x100(%); AO = average when C~100% are omitted, and when REY<0 are omitted.
Sablefish Greenland turbot Arrowtooth flounder Frequency
Year A B C REY A B C REY A B C REY D ND
1980 1.11 2.53 43.87 56.13 0.13 0.60 21.67 78.33 0.19 0.25 76.00 24.00 3 71981 0.51 3.20 15.94 84.06 0.48 1.24 38.71 61.29 0.19 0.26 73.08 26.92 1 91982 5.03 4.50 11.78 -11.78 0.30 1.18 25.42 74.58 0.14 0.48 29.17 70.83 4 171983 2.09 4.56 45.83 54.17 0.38 0.92 41.30 58.70 0.39 0.47 82.98 17.02 9 121984 2.04 9.49 21.50 78.50 0.12 0.69 17.39 82.61 0.23 0.31 74.19 25.81 3 181985 5.16 7.75 66.58 33.42 0.27 0.72 37.50 62.50 0.33 0.60 55.00 45.00 3 181986 3.52 6.69 52.62 47.38 0.36 0.77 46.75 53.25 0.47 0.67 70.15 29.85 8 131987 1.42 3.75 37.87 62.13 0.40 1.12 35.71 64.29 0.70 1.31 53.44 46.56 7 141988 2.18 4.55 47.91 52.09 0.19 0.48 39.58 60.42 1.33 1.18 112.71 -12.71 12 9
Average 2.56 5.22 49.32 50.68 0.29 0.86 33.78 66.22 0.44 0.61 69.63 30.37 5.56 13.00AO 41.51 58.49 33.78 66.22 64.25 35.75
1 Frequency of sampling. D = depredation; ND = no depredation.
Table 6Estimated depredation rate (%1 calculated by remainingheads, lips, or gills IRNT and RNS) and by averaging thecatch rates (REY and REA).
culated from REAl(Table 8). The average overall lossincurred for all years at all stations (Table 9) as' aresult of killer whale depredation ranged fromY402,499.6 to Y4,667,109.6 (from $29,181.50 to$34,571.20). The total product value ofthe 4-monthsurvey for each year (D in Table 9) ranged fromY98,812,086.0 to Y283,932,240.0 (from $731,941.40to $2,103,201.80) and the product values per operation (yearly total product value/number of stationsper each survey, F in Table 9) ranged from Y950,116.2to Y2,629.002.2 (from $7,037.90 to $19,474.10; Table9). The yearly loss was 0.21 to 2.96% (G in Table 9)of the total product value in survey and 3.80 to34.22% (H in Table 9) of the product value per station (per operation). These values suggest that therate ofyearly overall loss is not large (less than 3%) intotal product (survey area is extensive, ranging fromthe Aleutian Islands to SoutheastAlaska in Figure 1),
partially consumed fish (Fig. 9C) was significantlylarger than that reported from all areas fished (Fig.9A; t=7.71, P<0.05) and for the stations fished wherekiller whales were present (Fig. 9B; t=1O.99, P<0.05 l.
There was a bimodal length-frequency distributionfor Greenland turbot (Fig. 10, A-C). Average lengthof Greenland turbot was 744.3 mm TL for all areasfished, 730.8 mm TL for the stations fished wheredepredation occurred, and 756.1 mm TL for the partially consumed fish. Significant differences werefound between average lengths of damaged fish andundamaged fish for all stations with killer whale depredation (t=2.03, P<0.05). However, no significant differences were found between average lengths ofdamaged fish and undamaged fish for all areas fished(t=1.08, P>0.05). The average length ofdamaged fishwas significantly larger than that ofundamaged fishat stations with killer whale depredation (t=2.03,P<0.05) but the total average length was about equalto that for all areas fished.
Monetary loss
For the years 1982-88, data were collected on theproduct yield of each area and operation, unit priceper kilogram (commercial price when landed), andproduct price per operation for sablefish, Greenlandturbot, and arrowtooth flounder (Table 7). The average monetary loss in the total catch per operation(using 160 hachi per operation) was estimated torange from Y96,853.7 ($717.40 [U.S. dollars] @Y135calculated from RNT) to Y790,934.2 ($5,858.80 cal-
Depredationrate
RNTRNSREYREA
Sablefish
13.9821.6958.4959.66
Greenlandturbot
39.4245.1166,2268.91
Arrowtoothflounder
5.7212.7835.7542.23
19.7126.5353.4956.93

A
TL =187.06 + 2.94 x HL (.=0.972, n=139)
366
1000
e 900
~
-=DI 800c.!II 700
.2600
o 00./..~~....
vr· .... .• etA •~)....
• 1:·1' •
~..... 0,...·M· •. .
~....
Fishery Bulletin 93(2). J995
140 160 220
Head length lmml
260 300
1100
1000
e.!! 900
~...DIc 800.!
II
.2 700
800
TL =264.46 + 7.24 x ML ('.0.959. n=112) >B .... /. 0. .:/-·-4··· .
~..!:Ie II>'.... •. . ...,....
.:i.......···,··.:,4. '..~2-.:f..
50 70 90 110
Maxillary length lmml
Figure 6Size of partially consumed Greenland turbot. Reinhardtiushippoglossoides. (A) The relationship between head length lHL)and tota,l length ITLl; IBl the relationship between maxil'larylength (ML) and total length ITLl.
but the rate ofyearly loss per station (per operation)is relatively large in product per station.
Discussion
Although killer whales range throughout Alaskanwaters (Braham and Dahlheim, 1982"1, fishery interactions are restricted to the Bering Sea and PrinceWilliam Sound (Dahlheim2). In the Bering Sea, twoareas, B-1 and B-II, were repeatedly noted for predation by killer whales on longline-caught fish. Despite considerable fishing effort in areas outside theBering Sea, killer-whale-longline interactions havenot been reported for most of the western AleutianIsland chain, Alaska Peninsula, Gulf of Alaska, orSoutheast Alaska. However, in September 1991 inGlacier Bay National Park, fishermen reported thata small number of halibut showed evidence of toothrake marks made by killer whales and consequently
were unmarketable fish (Matkin15 ). In Canadianwaters, 85% of the commercial harvest of sablefishis taken by pot gear. There have been no reports ofkiller whales interfering with this pot fishery. Thereare, however, two isolated accounts of killer whalesraiding Pacific halibut longline operations in HecateStrait, British Columbia (Ellis16). Sablefish longliningoperations also range from Washington State to central California. Records of killer whale interferencewith this fishery have not been found (Parks17).
The only other area within Alaska where killerwhales have been reported raiding longline gear isPrince William Sound. Interactions in this area arewell documented (Dahlheim2; Matkin3). At least 19
15 Matkin, D. R. Box Gustavus,AK. Pers. commun., October 1991.
16 Ellis, G. Box 215, Station A, Nanaimo, B.C., Canada V9R 5K9.Pers. commun., March 1990.
17 Parks, N. Alaska Fisheries Science Center, 7600 Sand PointWay N.E., Seattle, WA 98115. Pers. commun., May 1990.
Yano and Dahlheim: Depredation of bottomfish on longline catches by Orcinus orca 367
80 120 180 200 240
B
1000
800...5~
a.c..! 800
~.e
400
Head length lmml
FL • 66.45 + 7.23 x ML (r =0.978. n =112)
.. /.
Poo ~/
: .1..:-~7"o 00A 0
o~~·:o...40 60 80 100 120
Maxillary length lmml
Figure 7Size of partially consumed arrowtooth flounder, Atheresthesstomias. (AI The relationship between head length IHLI and forklength (FL); (Bl the relationship between maxillary length (ML)and fork length lFL).
killer whale pods are known to exist within the areabut only two pods have been involved in fishery interactions. Although killer whales may frequentlytravel between Prince William Sound and offshorewaters ofthe GulfofAlaska, fishery interactions havenot been reported in the waters adjacent to PrinceWilliam Sound. One encounter with killer whales wasreported off Kodiak Island during this study but nodepredation occurred. Whales probably learned todepredate longline-caught fish by long-term exposureto fishing activities. Accounts of killer whales feeding off the discard of fish-processing vessels for aperiod of over 30 days has been noted in the BeringSea lDahlheim, unpubl. data). Active depredationmay begin once the whales learn to associate fishingoperations with a feeding opportunity.
An examination ofthe yearly catch data suggestedthat killer whales depredate 39-69% of the Greenland turbot, 14-60% of the sablefish, and 6-42% ofthe arrowtooth flounder. Whales took the largest fish
for each species consumed. Although available, fishspecies not eaten by killer whales included Pacificcod, grenadier, rockfish, walleye pollock, and shortspine thornyhead. Little is known of the food habitsof Bering Sea killer whales. The fish species consumed by the whales during this study have not beenpreviously reported in the diet ofNorth Pacific killerwhales (Rice, 1968), perhaps because few stomachswere examined.
Within- and between-year comparisons of catchrates of sablefish, Greenland turbot, and arrowtoothflounder showed that fewer fish were landed whenkiller whales were present. Although annual changesin fish biomass and composition by region have beenreported (Yan04,5; Sasaki and Yano18), catch rates (for
18 Sasaki, T.• and K. Yano. 1990. Report on Japan-U.S. jointlongline survey by 7bmi Maru No. 88 in the eastern BeringSea, Aleutian Region, and Gulf ofAlaska, 1988. National Research Institute of Far Seas Fisheries. 5-7-1 Orido, Shimizu,Shizuoka 424 Japan. 163 p.

368 Fishery Bulletin 93(2), J995
A4000
n=31339
3000
2000
1000
0501 601 901
B.. 600 n=3410c:co.§u
8. 400..-0Gi 200
.l)
E'"Z
0501 601 801 901
16
Cn =91
12
8
601 701
Fork length ~801 901
Figure 8Length-frequency distribution ofsablefish, Anoplopoma fimbria.(AI All areas (see Fig. 1); (Bl all stations fished where depredation occurred; (el calculated length (head length and maxillarylengthl of partially consumed fish.
the 10-year period) were typically lower when killerwhales were reported as present.
Depredation rates based on average catch rates(REY and REA values) were higher than those calculated from direct counts ofdamaged fish (RNT andRNS values). Calculated values ofRNT and RNS didnot consider empty hooks. It is possible that parts ofthe fish that were preyed upon were pulled off ordropped off the line as it was being retrieved. Thusthe rate ofpredation based on a direct-count methodmay underestimate the overall rate of depredation.However, RNT and RNS values were used as directevidence of depredation by killer whales. RNS values indicated that killer whales actively depredateat least 22% of the sablefish, 45% of Greenland turbot, and 13% ofthe arrowtooth flounder. Large numbers of arrowtooth flounder are found in shallower
depths where killer whales do not actively prey onfish, but sablefish and Greenland turbot are foundin deeper depths where active depredation has beenobserved tYan04). However, a greater number ofdamaged arrowtooth flounder prevailed in the catch(higher RNS values). Depredation rates by killerwhales on the U.S. domestic Bering Sea fishery couldeasily be higher because some vessels (due to overallsize and limited range) are forced to fish repeatedlyin the same area. Ifa particular area is in a region ofhigh killer whale density, the vessel may experiencecontinual problems. Reports of killer whales following vessels over short distances from one fishing areato another have been documented (Onodera19).
19 Onodera, S. Fishing master of7bmi Maru. No. 88, 6-3-25 Irifune,Kushiro, Hokkaido 085 Japan. Personal commun., October 1988.

Yano and Dahlheim: Depredation of bottomfish on longline catches by Orcinus orca 369
1200 A
n= 9991
800
400
0 301 401 501 601 801 901
300B..
c:..n= 2402E
.~ 200
~-0~ 100..
.JlE:>Z
0 301 401 501 901801
16 Cn= 110
12
0 ................,30~1;"-""~~40:;"1.... 501 601
Fork length \mm)
801 901
Figure 9Length-frequency distribution ofarrowtooth flounder, Atheresthesstomias. (A) All areas (see Fig. 1): (B) all stations fished wheredepredation occurred; (e> calculated length (head length andmaxillary length) of partially consumed fish.
Dahlheim2 estimated that the U.S. domesticlongline fishery in the Bering Sea incurred an average loss of $2,300 per day during the winter of 1988,similar to the values ($928.90 in RNT and $3,373.50in REA per operation [per day]) reported for thisstudy. However, losses reported for this study maybe underestimated. For example, monetary losseswould be greater if the time spent by fishermen traveling from one area to another to escape whales wasconsidered. Also the price per kilogram of sablefishis greater than that for larger fish. Since whales wereshown to prefer larger fish, the actual monetary lossesper operation may be greater than those reported (values based on an average cost/kg). Matkin et a1.20 esti-
20 Matkin, C. 0., G. Ellis, O. von Ziegesar, and R. Steiner. 1987.Killer whales and longline fisheries in Prince Willi.am Sound.Alaska 1986. Alaska Fisheries Science Center, National
mated sablefish losses of$34,300 to $55,500 over theentire season for the 1986 Prince William Soundsablefish longline industry. During the 4-month research survey, a minimum value (calculated from RNT)of $2,982.00 and a maximum value (calculated fromREA) of $34,571.00 was estimated.
Acknowledgments
We express our sincere appreciation to T. Sasaki (National Research Institute of Far Seas Fisheries) andM. Kuroiwa (Japan Marine Fishery Resources Re-
20 (continued) Marine Mammal Laboratory, Seattle, Washington,National Marine Mammal Laboratory, 7600 Sand Point WayN.E.• Sea~tle, WA 98115-0070. Unpubl. manuscr., contract40ABNF6 2262, 18 p.
370 Fishery Bulletin 93(2). J995

Yano and Dahlheim: Depredation of bottomfish on longline catches by Orcinus orca 371
A160
"= 1925
120
80
~o
0 501 601 701 801 901 1001
30B..
l:.. "=265.~u 20..~
(;
Ii 10
~
E::lZ
0501 701 801
C"=78
6
1001
Figure 10Length-frequency distribution ofGreenland turbot. Reinhardtiushippoglossoides. (AI All areas (see Fig. 1); (Bl all stations fishedwhere depredation occurred; (el calculated length (head lengthand maxillary lengthl of partially consumed fish.
Table 8Average monetary loss per station (1982-88) estimated by depredation rates IRNT. RNS, REY, and REA) for sablefish. Anoplopomafimbria, Greenland turbot, Reinhardtius hippoglossoides. and arrowtooth flounder, Atheresthes stomias. Total given for all threespecies.
Sablefish Greenland turbot Arrowtooth flounder Total
Depredation rate Yen U.S. $ Yen U.S. $ Yen U.S. $ Yen U.S. $
RNT 92,111.1 682.30 32.550.7 241.10 735.4 5.40 125,397.2 928.90
RNS 142,910.5 1,058.60 37,249.2 275.90 1,643.0 12.20 181,802.7 1,346.70
REY 385,377.4 2.854.60 54,680.6 405.00 4,596.0 34.00 444,654.0 3.293.60
REA 393,086.3 2.911.80 56,901.9 421.50 5.429.1 40.20 455,417.3 3,373.50

372 Fishery Bulletin 93(2), 1995
Table 9Yearly monetary loss per station and overall loss estimated by depredation rate of RNT (minimum value) and RNA (maximumvalue I, and yearly total product value per survey and product values per station calculated from total product value.
Overall Yearly total No. of Product Rate of loss Rate oflossYearly monetary loss No. of monetary loss product stations value/station per yearly per station
per station (Al depredated (C=AxB) value per IF=DlEl product productstations in Yen survey in Yen (G=C/Dx100l (H=A!Fx100)
Year Yen U.S. $ (BI Yen U.S. $ !U.S. $) IE) IU.S.$) 1%) (%)
1982 max. 100.624.9 745.40 4 402,499.6 2,981.50 121,346,699 108 1,123,580.5 0.33 8.96min. 308,350.2 2.284.10 1,233,400.8 9,136.30 (898,864.40) (8,322.80) 1.02 27.44
1983 max. 97,015.0 718.60 9 873,135.0 6,467.70 98,812,086 104 950,116.2 0.88 10.21min. 325,174.7 2,408.70 2,926,572.3 21,678.30 (731,941.40) (7,037.90) 2.96 34.22
1984 max. 145,459.5 1,077.50 3 436.378.5 3,232.40 176,102,713 108 1,630.580.7 0.25 8.29min. 530,579.4 3.930.20 1,591,738.2 11,790.70 (1.304,464.50) (12,078.40) 0.90 32.54
1985 max. 201,713.2 1,494.20 3 605,139.6 4,482.50 283,932,240 108 2,629,002.2 0.21 7.67min. 790,934.2 5,858.80 2,372,802.6 17,576.30 (2,103,201.80) (19,474.10) 0.84 30.08
1986 max. 142,728.9 1,057.30 8 1,141,831.2 8.458.00 238,057,678 107 2.224.838.1 0.48 6.42min. 532,212.9 3,942.30 4.257,703.2 31,538.50 (1,763,390.20) (16,480.30) 1.79 23.92
1987 max. 101,666.1 753.10 7 711,662.7 5,271.60 271,467,224 107 2,537,076.9 0.26 4.01min. 337,820.0 2,502.40 2,364,740.0 17,516.60 (2,010,868.30) (18,793.20) 0.87 13.32
1988 max. 96.853.7 717.40 121 1,162,244.4 8.609.20 275,277,684 108 2,548,867.4 0.42 3.80min. 388,925.8 2.880.90 4,667,109.6 34,571.20 (2,039.094.00) (18,880.50) 1.70 15.26
Overall max. 96,853.7 717.40 402,499.6 2,981.50 0.21 3.80790,934.2 5,858.80 4,667,109.6 34,571.20 2.96 34.22
1 Three stations where no depredation was evident.
search Center) for their kind cooperation in providing the data from the sablefish and Pacific cod surveys between the years 1980 and 1989. We also thankJ. J. Long, R. A. Payne, J. W. Stark, D. Bridges,K. Koike, S. Onodera, and the crew of the researchvessel Tomi Maru No. 88 for their valuable cooperation during the 1988 survey. Annual surveys weresupported by the Japan Marine Fishery ResourcesResearch Center (JAMARC), the National MarineFisheries Service (NMFS-Alaska Fisheries ScienceCenter), and the National Research Institute of FarSeas Fisheries. Janice Waite prepared final tables.Thomas Loughlin, Richard Merrick, and HaroldZenger (NMFS) reviewed the manuscript.
Literature cited
Braham, B. W., and M. E. Dahlheim.1982. Killer whales in Alaska documented in the Platforms
of Opportunity Program. Rep. Int. Whaling Comm.32:643-646.
Leatherwood, J. S., and M. E. Dahlheim.1978. Worldwide distribution of pilot whales and killer
whales. Naval Ocean Systems Center, Tech. Rep. 443:1-39.
Leatherwood, J. S., D. McDonald, W. P. Prematunga, P.Girton, D. McBrearty, and A. Ilangakoon.
1990. Records of the "blackfish~ (killer, false killer, pilot,pygmy killer, and melon-headed whales) in the IndianOcean Sanctuary, 1772-1976. In S. Leatherwood and G.P. Donovan (eds. ), Cetaceans and cetacean research in theIndian Ocean Sanctuary, p. 33-65. United Nations Environment Programme, Marine Mammal Technical Publication No.3, Nairobi, Kenya.
Rice, D. W.1968. Stomach contents and feeding behavior of killer
whales in the eastern North Pacific. Norsk. Havlf. 57:35-38.
Sasaki, T.1985. Studies on the sablefish resources of the North Pa
cific Ocean. Bull. Far Seas Fish. Res. Lab .. No. 22:1-108.
Sivasubramanium, K.1965. Predation of tuna longline catches in the Indian
Ocean, by killer whales and sharks. Bull. Fish. Res. Stn.,Ceylon 17(2):93-96.